Italian Female Disability
COMPARE
Italian
Select to Compare
Female Disability
Italian Female Disability
12.4%
DISABILITY | FEMALES
10.7/ 100
METRIC RATING
222nd/ 347
METRIC RANK
Italian Female Disability Correlation Chart
The statistical analysis conducted on geographies consisting of 574,730,286 people shows a substantial positive correlation between the proportion of Italians and percentage of females with a disability in the United States with a correlation coefficient (R) of 0.550 and weighted average of 12.4%. On average, for every 1% (one percent) increase in Italians within a typical geography, there is an increase of 0.34% in percentage of females with a disability.
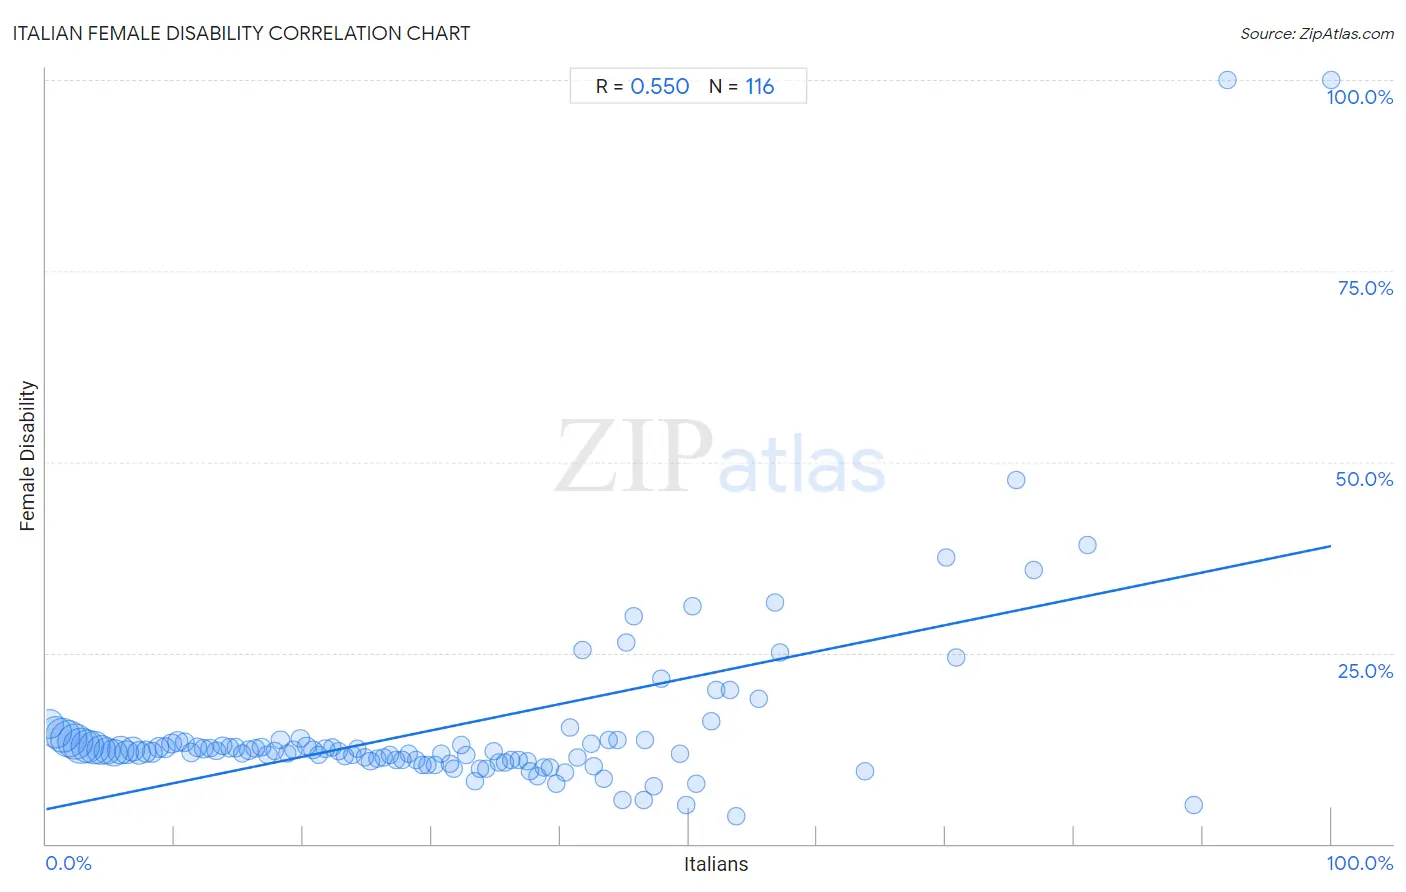
It is essential to understand that the correlation between the percentage of Italians and percentage of females with a disability does not imply a direct cause-and-effect relationship. It remains uncertain whether the presence of Italians influences an upward or downward trend in the level of percentage of females with a disability within an area, or if Italians simply ended up residing in those areas with higher or lower levels of percentage of females with a disability due to other factors.
Demographics Similar to Italians by Female Disability
In terms of female disability, the demographic groups most similar to Italians are Native Hawaiian (12.4%, a difference of 0.010%), Bahamian (12.4%, a difference of 0.040%), European (12.4%, a difference of 0.13%), Guamanian/Chamorro (12.5%, a difference of 0.13%), and Belizean (12.5%, a difference of 0.14%).
| Demographics | Rating | Rank | Female Disability |
| Samoans | 13.4 /100 | #215 | Poor 12.4% |
| Immigrants from Burma/Myanmar | 13.3 /100 | #216 | Poor 12.4% |
| British | 12.7 /100 | #217 | Poor 12.4% |
| Immigrants from Bahamas | 12.5 /100 | #218 | Poor 12.4% |
| Europeans | 12.1 /100 | #219 | Poor 12.4% |
| Bahamians | 11.1 /100 | #220 | Poor 12.4% |
| Native Hawaiians | 10.8 /100 | #221 | Poor 12.4% |
| Italians | 10.7 /100 | #222 | Poor 12.4% |
| Guamanians/Chamorros | 9.5 /100 | #223 | Tragic 12.5% |
| Belizeans | 9.3 /100 | #224 | Tragic 12.5% |
| Poles | 8.4 /100 | #225 | Tragic 12.5% |
| Hispanics or Latinos | 8.0 /100 | #226 | Tragic 12.5% |
| Assyrians/Chaldeans/Syriacs | 8.0 /100 | #227 | Tragic 12.5% |
| Immigrants from Cambodia | 7.8 /100 | #228 | Tragic 12.5% |
| Hungarians | 7.2 /100 | #229 | Tragic 12.5% |
Italian Female Disability Correlation Summary
| Measurement | Italian Data | Female Disability Data |
| Minimum | 0.27% | 3.6% |
| Maximum | 100.0% | 100.0% |
| Range | 99.7% | 96.4% |
| Mean | 31.1% | 15.2% |
| Median | 29.0% | 12.2% |
| Interquartile 25% (IQ1) | 14.5% | 11.0% |
| Interquartile 75% (IQ3) | 43.6% | 13.4% |
| Interquartile Range (IQR) | 29.1% | 2.4% |
| Standard Deviation (Sample) | 21.1% | 13.2% |
| Standard Deviation (Population) | 21.0% | 13.1% |
Correlation Details
| Italian Percentile | Sample Size | Female Disability |
[ 0.0% - 0.5% ] 0.27% | 28,816,436 | 15.7% |
[ 0.5% - 1.0% ] 0.77% | 38,090,078 | 14.6% |
[ 1.0% - 1.5% ] 1.26% | 41,874,895 | 14.2% |
[ 1.5% - 2.0% ] 1.74% | 50,087,820 | 13.7% |
[ 2.0% - 2.5% ] 2.25% | 45,177,909 | 13.4% |
[ 2.5% - 3.0% ] 2.74% | 49,307,260 | 12.8% |
[ 3.0% - 3.5% ] 3.25% | 40,258,235 | 12.8% |
[ 3.5% - 4.0% ] 3.76% | 39,607,847 | 12.6% |
[ 4.0% - 4.5% ] 4.25% | 30,547,195 | 12.3% |
[ 4.5% - 5.0% ] 4.73% | 25,297,303 | 12.2% |
[ 5.0% - 5.5% ] 5.25% | 21,928,345 | 11.9% |
[ 5.5% - 6.0% ] 5.79% | 26,115,159 | 12.2% |
[ 6.0% - 6.5% ] 6.24% | 14,855,939 | 12.0% |
[ 6.5% - 7.0% ] 6.75% | 14,992,365 | 12.4% |
[ 7.0% - 7.5% ] 7.23% | 11,460,112 | 11.9% |
[ 7.5% - 8.0% ] 7.74% | 7,765,427 | 12.0% |
[ 8.0% - 8.5% ] 8.25% | 7,633,473 | 11.9% |
[ 8.5% - 9.0% ] 8.73% | 6,866,052 | 12.7% |
[ 9.0% - 9.5% ] 9.23% | 5,841,163 | 12.6% |
[ 9.5% - 10.0% ] 9.75% | 4,668,083 | 13.1% |
[ 10.0% - 10.5% ] 10.25% | 5,320,060 | 13.4% |
[ 10.5% - 11.0% ] 10.77% | 4,338,610 | 13.2% |
[ 11.0% - 11.5% ] 11.27% | 3,485,303 | 12.0% |
[ 11.5% - 12.0% ] 11.75% | 4,087,795 | 12.7% |
[ 12.0% - 12.5% ] 12.23% | 3,498,045 | 12.5% |
[ 12.5% - 13.0% ] 12.74% | 3,194,623 | 12.5% |
[ 13.0% - 13.5% ] 13.23% | 2,648,735 | 12.2% |
[ 13.5% - 14.0% ] 13.76% | 2,268,946 | 12.8% |
[ 14.0% - 14.5% ] 14.26% | 2,098,429 | 12.6% |
[ 14.5% - 15.0% ] 14.74% | 2,290,819 | 12.5% |
[ 15.0% - 15.5% ] 15.24% | 1,768,070 | 11.8% |
[ 15.5% - 16.0% ] 15.77% | 2,482,232 | 12.3% |
[ 16.0% - 16.5% ] 16.25% | 1,766,102 | 12.5% |
[ 16.5% - 17.0% ] 16.74% | 2,082,443 | 12.7% |
[ 17.0% - 17.5% ] 17.25% | 1,661,602 | 11.6% |
[ 17.5% - 18.0% ] 17.76% | 1,427,121 | 12.1% |
[ 18.0% - 18.5% ] 18.24% | 996,195 | 13.6% |
[ 18.5% - 19.0% ] 18.74% | 1,300,339 | 11.8% |
[ 19.0% - 19.5% ] 19.22% | 1,590,038 | 12.3% |
[ 19.5% - 20.0% ] 19.77% | 1,396,696 | 13.8% |
[ 20.0% - 20.5% ] 20.25% | 1,269,501 | 12.8% |
[ 20.5% - 21.0% ] 20.76% | 705,278 | 12.3% |
[ 21.0% - 21.5% ] 21.17% | 895,340 | 11.6% |
[ 21.5% - 22.0% ] 21.73% | 677,537 | 12.4% |
[ 22.0% - 22.5% ] 22.27% | 630,771 | 12.7% |
[ 22.5% - 23.0% ] 22.73% | 591,888 | 12.1% |
[ 23.0% - 23.5% ] 23.22% | 803,879 | 11.5% |
[ 23.5% - 24.0% ] 23.79% | 634,681 | 11.6% |
[ 24.0% - 24.5% ] 24.19% | 608,074 | 12.5% |
[ 24.5% - 25.0% ] 24.78% | 698,199 | 11.3% |
[ 25.0% - 25.5% ] 25.24% | 662,809 | 10.9% |
[ 25.5% - 26.0% ] 25.77% | 497,100 | 11.1% |
[ 26.0% - 26.5% ] 26.25% | 411,140 | 11.3% |
[ 26.5% - 27.0% ] 26.73% | 395,158 | 11.6% |
[ 27.0% - 27.5% ] 27.23% | 520,952 | 11.0% |
[ 27.5% - 28.0% ] 27.75% | 669,323 | 11.0% |
[ 28.0% - 28.5% ] 28.21% | 242,295 | 11.9% |
[ 28.5% - 29.0% ] 28.75% | 298,769 | 11.0% |
[ 29.0% - 29.5% ] 29.24% | 335,860 | 10.3% |
[ 29.5% - 30.0% ] 29.70% | 240,932 | 10.3% |
[ 30.0% - 30.5% ] 30.25% | 208,754 | 10.3% |
[ 30.5% - 31.0% ] 30.76% | 189,873 | 11.7% |
[ 31.0% - 31.5% ] 31.41% | 194,712 | 10.4% |
[ 31.5% - 32.0% ] 31.74% | 109,590 | 9.9% |
[ 32.0% - 32.5% ] 32.33% | 138,104 | 13.0% |
[ 32.5% - 33.0% ] 32.72% | 119,984 | 11.7% |
[ 33.0% - 33.5% ] 33.35% | 88,955 | 8.2% |
[ 33.5% - 34.0% ] 33.76% | 60,196 | 9.9% |
[ 34.0% - 34.5% ] 34.22% | 74,431 | 9.9% |
[ 34.5% - 35.0% ] 34.86% | 54,668 | 12.1% |
[ 35.0% - 35.5% ] 35.22% | 75,271 | 10.6% |
[ 35.5% - 36.0% ] 35.74% | 89,111 | 10.7% |
[ 36.0% - 36.5% ] 36.16% | 91,376 | 10.9% |
[ 36.5% - 37.0% ] 36.73% | 78,250 | 11.0% |
[ 37.0% - 37.5% ] 37.42% | 64,722 | 10.8% |
[ 37.5% - 38.0% ] 37.62% | 11,868 | 9.5% |
[ 38.0% - 38.5% ] 38.28% | 42,122 | 8.8% |
[ 38.5% - 39.0% ] 38.68% | 7,070 | 9.9% |
[ 39.0% - 39.5% ] 39.21% | 39,595 | 9.9% |
[ 39.5% - 40.0% ] 39.69% | 93,445 | 7.9% |
[ 40.0% - 40.5% ] 40.34% | 32,777 | 9.3% |
[ 40.5% - 41.0% ] 40.77% | 3,272 | 15.2% |
[ 41.0% - 41.5% ] 41.34% | 1,674 | 11.3% |
[ 41.5% - 42.0% ] 41.70% | 2,043 | 25.4% |
[ 42.0% - 42.5% ] 42.44% | 344 | 13.1% |
[ 42.5% - 43.0% ] 42.64% | 54,970 | 10.2% |
[ 43.0% - 43.5% ] 43.36% | 11,894 | 8.5% |
[ 43.5% - 44.0% ] 43.80% | 1,363 | 13.6% |
[ 44.0% - 44.5% ] 44.41% | 53,871 | 13.6% |
[ 44.5% - 45.0% ] 44.89% | 2,007 | 5.7% |
[ 45.0% - 45.5% ] 45.12% | 492 | 26.3% |
[ 45.5% - 46.0% ] 45.73% | 1,592 | 29.7% |
[ 46.0% - 46.5% ] 46.47% | 15,548 | 5.7% |
[ 46.5% - 47.0% ] 46.61% | 6,179 | 13.6% |
[ 47.0% - 47.5% ] 47.29% | 628 | 7.5% |
[ 47.5% - 48.0% ] 47.81% | 3,384 | 21.6% |
[ 49.0% - 49.5% ] 49.27% | 619 | 11.8% |
[ 49.5% - 50.0% ] 49.85% | 680 | 5.1% |
[ 50.0% - 50.5% ] 50.32% | 626 | 31.2% |
[ 50.5% - 51.0% ] 50.61% | 164 | 7.9% |
[ 51.5% - 52.0% ] 51.77% | 564 | 16.1% |
[ 52.0% - 52.5% ] 52.16% | 8,114 | 20.1% |
[ 53.0% - 53.5% ] 53.17% | 7,895 | 20.1% |
[ 53.5% - 54.0% ] 53.73% | 335 | 3.6% |
[ 55.0% - 55.5% ] 55.41% | 1,785 | 19.0% |
[ 56.5% - 57.0% ] 56.67% | 60 | 31.6% |
[ 57.0% - 57.5% ] 57.14% | 63 | 25.0% |
[ 63.5% - 64.0% ] 63.67% | 245 | 9.5% |
[ 70.0% - 70.5% ] 70.00% | 30 | 37.5% |
[ 70.5% - 71.0% ] 70.81% | 298 | 24.4% |
[ 75.0% - 75.5% ] 75.45% | 220 | 47.7% |
[ 76.5% - 77.0% ] 76.87% | 640 | 35.9% |
[ 80.5% - 81.0% ] 80.99% | 605 | 39.1% |
[ 89.0% - 89.5% ] 89.30% | 187 | 5.1% |
[ 91.5% - 92.0% ] 91.94% | 186 | 100.0% |
[ 99.5% - 100.0% ] 100.00% | 50 | 100.0% |