Italian Self-Care Disability
COMPARE
Italian
Select to Compare
Self-Care Disability
Italian Self-Care Disability
2.4%
SELF-CARE DISABILITY
72.2/ 100
METRIC RATING
154th/ 347
METRIC RANK
Italian Self-Care Disability Correlation Chart
The statistical analysis conducted on geographies consisting of 572,484,313 people shows a substantial positive correlation between the proportion of Italians and percentage of population with self-care disability in the United States with a correlation coefficient (R) of 0.533 and weighted average of 2.4%. On average, for every 1% (one percent) increase in Italians within a typical geography, there is an increase of 0.056% in percentage of population with self-care disability.
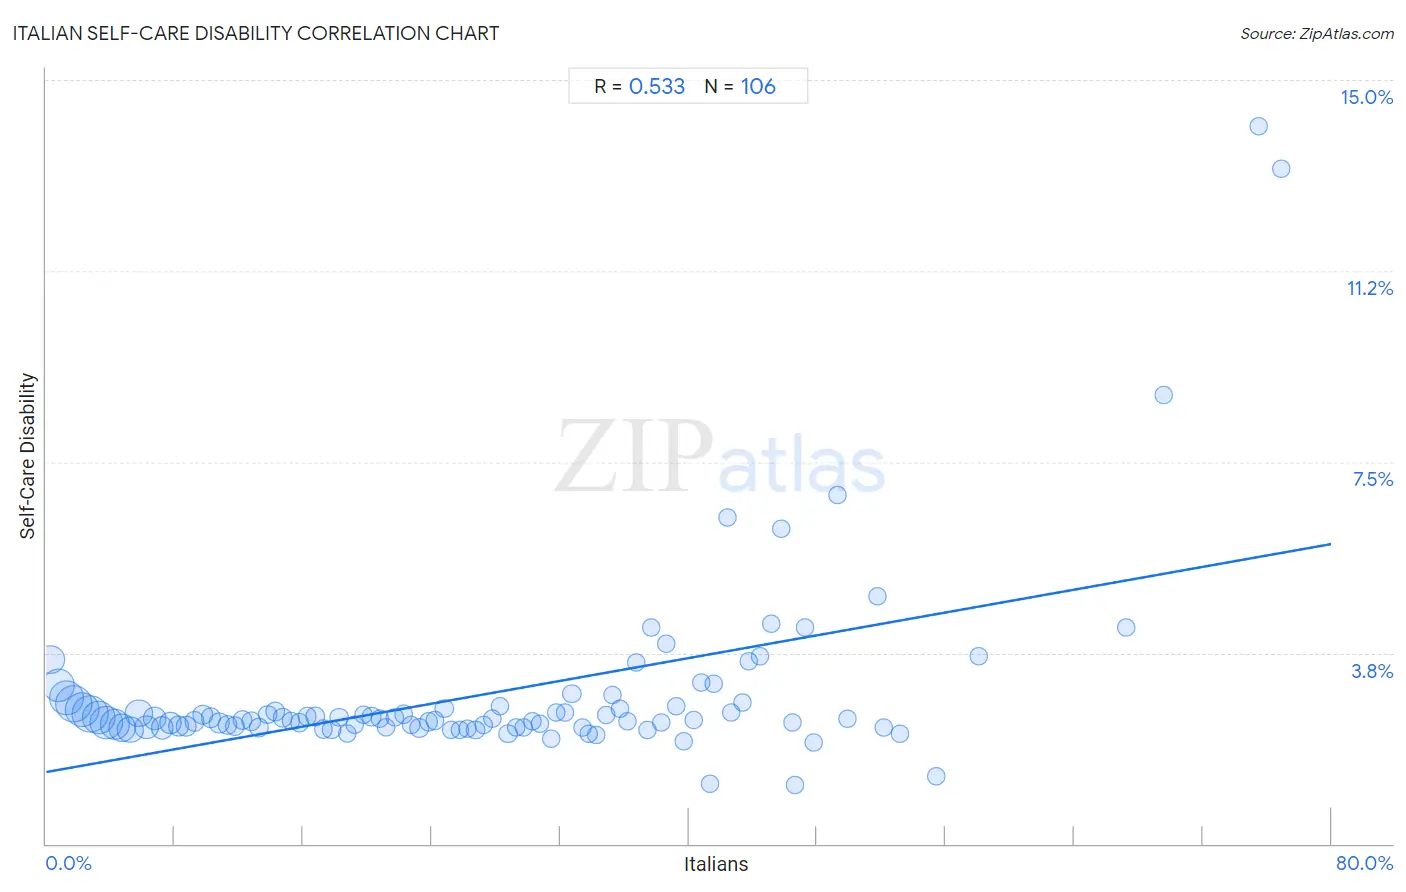
It is essential to understand that the correlation between the percentage of Italians and percentage of population with self-care disability does not imply a direct cause-and-effect relationship. It remains uncertain whether the presence of Italians influences an upward or downward trend in the level of percentage of population with self-care disability within an area, or if Italians simply ended up residing in those areas with higher or lower levels of percentage of population with self-care disability due to other factors.
Demographics Similar to Italians by Self-Care Disability
In terms of self-care disability, the demographic groups most similar to Italians are Pakistani (2.4%, a difference of 0.050%), Tlingit-Haida (2.4%, a difference of 0.080%), Immigrants from England (2.4%, a difference of 0.080%), Nigerian (2.4%, a difference of 0.090%), and Basque (2.4%, a difference of 0.11%).
| Demographics | Rating | Rank | Self-Care Disability |
| Dutch | 77.5 /100 | #147 | Good 2.4% |
| Romanians | 75.8 /100 | #148 | Good 2.4% |
| Arabs | 75.7 /100 | #149 | Good 2.4% |
| Immigrants from Costa Rica | 75.1 /100 | #150 | Good 2.4% |
| Basques | 74.0 /100 | #151 | Good 2.4% |
| Tlingit-Haida | 73.5 /100 | #152 | Good 2.4% |
| Immigrants from England | 73.5 /100 | #153 | Good 2.4% |
| Italians | 72.2 /100 | #154 | Good 2.4% |
| Pakistanis | 71.4 /100 | #155 | Good 2.4% |
| Nigerians | 70.6 /100 | #156 | Good 2.4% |
| Immigrants from Europe | 69.6 /100 | #157 | Good 2.4% |
| Immigrants from Western Europe | 68.6 /100 | #158 | Good 2.4% |
| Immigrants from Italy | 68.5 /100 | #159 | Good 2.4% |
| Finns | 67.0 /100 | #160 | Good 2.4% |
| Lebanese | 66.5 /100 | #161 | Good 2.4% |
Italian Self-Care Disability Correlation Summary
| Measurement | Italian Data | Self-Care Disability Data |
| Minimum | 0.27% | 1.2% |
| Maximum | 76.9% | 14.1% |
| Range | 76.7% | 12.9% |
| Mean | 27.5% | 3.0% |
| Median | 26.5% | 2.4% |
| Interquartile 25% (IQ1) | 13.2% | 2.3% |
| Interquartile 75% (IQ3) | 39.7% | 2.7% |
| Interquartile Range (IQR) | 26.5% | 0.40% |
| Standard Deviation (Sample) | 17.4% | 1.8% |
| Standard Deviation (Population) | 17.4% | 1.8% |
Correlation Details
| Italian Percentile | Sample Size | Self-Care Disability |
[ 0.0% - 0.5% ] 0.27% | 28,752,438 | 3.6% |
[ 0.5% - 1.0% ] 0.77% | 37,942,462 | 3.1% |
[ 1.0% - 1.5% ] 1.26% | 41,749,682 | 2.9% |
[ 1.5% - 2.0% ] 1.74% | 49,932,153 | 2.7% |
[ 2.0% - 2.5% ] 2.25% | 45,049,280 | 2.6% |
[ 2.5% - 3.0% ] 2.74% | 49,191,868 | 2.6% |
[ 3.0% - 3.5% ] 3.25% | 40,115,841 | 2.5% |
[ 3.5% - 4.0% ] 3.76% | 39,503,324 | 2.4% |
[ 4.0% - 4.5% ] 4.25% | 30,416,368 | 2.3% |
[ 4.5% - 5.0% ] 4.73% | 25,222,834 | 2.3% |
[ 5.0% - 5.5% ] 5.25% | 21,839,542 | 2.2% |
[ 5.5% - 6.0% ] 5.79% | 26,046,065 | 2.6% |
[ 6.0% - 6.5% ] 6.24% | 14,769,319 | 2.3% |
[ 6.5% - 7.0% ] 6.75% | 14,938,428 | 2.5% |
[ 7.0% - 7.5% ] 7.23% | 11,417,307 | 2.3% |
[ 7.5% - 8.0% ] 7.74% | 7,703,177 | 2.4% |
[ 8.0% - 8.5% ] 8.25% | 7,581,723 | 2.3% |
[ 8.5% - 9.0% ] 8.73% | 6,794,806 | 2.3% |
[ 9.0% - 9.5% ] 9.24% | 5,817,804 | 2.4% |
[ 9.5% - 10.0% ] 9.75% | 4,623,286 | 2.5% |
[ 10.0% - 10.5% ] 10.25% | 5,293,112 | 2.5% |
[ 10.5% - 11.0% ] 10.77% | 4,324,246 | 2.4% |
[ 11.0% - 11.5% ] 11.27% | 3,447,563 | 2.3% |
[ 11.5% - 12.0% ] 11.75% | 4,066,856 | 2.3% |
[ 12.0% - 12.5% ] 12.23% | 3,474,140 | 2.4% |
[ 12.5% - 13.0% ] 12.74% | 3,169,544 | 2.4% |
[ 13.0% - 13.5% ] 13.23% | 2,616,223 | 2.3% |
[ 13.5% - 14.0% ] 13.76% | 2,256,439 | 2.5% |
[ 14.0% - 14.5% ] 14.26% | 2,084,113 | 2.6% |
[ 14.5% - 15.0% ] 14.74% | 2,264,348 | 2.5% |
[ 15.0% - 15.5% ] 15.24% | 1,751,853 | 2.4% |
[ 15.5% - 16.0% ] 15.77% | 2,472,655 | 2.4% |
[ 16.0% - 16.5% ] 16.25% | 1,759,377 | 2.5% |
[ 16.5% - 17.0% ] 16.74% | 2,074,822 | 2.5% |
[ 17.0% - 17.5% ] 17.25% | 1,635,933 | 2.3% |
[ 17.5% - 18.0% ] 17.76% | 1,416,728 | 2.2% |
[ 18.0% - 18.5% ] 18.24% | 993,565 | 2.5% |
[ 18.5% - 19.0% ] 18.74% | 1,280,317 | 2.2% |
[ 19.0% - 19.5% ] 19.22% | 1,586,356 | 2.3% |
[ 19.5% - 20.0% ] 19.77% | 1,381,820 | 2.5% |
[ 20.0% - 20.5% ] 20.25% | 1,266,183 | 2.5% |
[ 20.5% - 21.0% ] 20.76% | 700,998 | 2.5% |
[ 21.0% - 21.5% ] 21.17% | 889,833 | 2.3% |
[ 21.5% - 22.0% ] 21.73% | 674,961 | 2.5% |
[ 22.0% - 22.5% ] 22.27% | 625,702 | 2.5% |
[ 22.5% - 23.0% ] 22.73% | 586,643 | 2.3% |
[ 23.0% - 23.5% ] 23.22% | 796,201 | 2.3% |
[ 23.5% - 24.0% ] 23.79% | 630,650 | 2.4% |
[ 24.0% - 24.5% ] 24.19% | 602,585 | 2.4% |
[ 24.5% - 25.0% ] 24.78% | 689,598 | 2.6% |
[ 25.0% - 25.5% ] 25.24% | 650,292 | 2.2% |
[ 25.5% - 26.0% ] 25.77% | 496,246 | 2.2% |
[ 26.0% - 26.5% ] 26.25% | 409,879 | 2.3% |
[ 26.5% - 27.0% ] 26.73% | 391,206 | 2.2% |
[ 27.0% - 27.5% ] 27.23% | 520,651 | 2.3% |
[ 27.5% - 28.0% ] 27.75% | 668,630 | 2.5% |
[ 28.0% - 28.5% ] 28.21% | 239,165 | 2.7% |
[ 28.5% - 29.0% ] 28.75% | 296,510 | 2.2% |
[ 29.0% - 29.5% ] 29.24% | 335,548 | 2.3% |
[ 29.5% - 30.0% ] 29.70% | 240,932 | 2.3% |
[ 30.0% - 30.5% ] 30.25% | 204,961 | 2.4% |
[ 30.5% - 31.0% ] 30.76% | 186,823 | 2.4% |
[ 31.0% - 31.5% ] 31.41% | 192,486 | 2.1% |
[ 31.5% - 32.0% ] 31.75% | 108,907 | 2.6% |
[ 32.0% - 32.5% ] 32.33% | 135,479 | 2.6% |
[ 32.5% - 33.0% ] 32.72% | 117,288 | 2.9% |
[ 33.0% - 33.5% ] 33.35% | 88,385 | 2.3% |
[ 33.5% - 34.0% ] 33.76% | 60,196 | 2.2% |
[ 34.0% - 34.5% ] 34.22% | 73,973 | 2.1% |
[ 34.5% - 35.0% ] 34.86% | 54,573 | 2.5% |
[ 35.0% - 35.5% ] 35.22% | 74,921 | 2.9% |
[ 35.5% - 36.0% ] 35.73% | 88,629 | 2.6% |
[ 36.0% - 36.5% ] 36.16% | 90,150 | 2.4% |
[ 36.5% - 37.0% ] 36.74% | 78,401 | 3.6% |
[ 37.0% - 37.5% ] 37.42% | 64,655 | 2.2% |
[ 37.5% - 38.0% ] 37.65% | 12,159 | 4.3% |
[ 38.0% - 38.5% ] 38.28% | 41,920 | 2.4% |
[ 38.5% - 39.0% ] 38.63% | 2,581 | 3.9% |
[ 39.0% - 39.5% ] 39.21% | 39,439 | 2.7% |
[ 39.5% - 40.0% ] 39.69% | 92,835 | 2.0% |
[ 40.0% - 40.5% ] 40.34% | 32,344 | 2.4% |
[ 40.5% - 41.0% ] 40.80% | 2,022 | 3.2% |
[ 41.0% - 41.5% ] 41.36% | 1,562 | 1.2% |
[ 41.5% - 42.0% ] 41.53% | 956 | 3.2% |
[ 42.0% - 42.5% ] 42.44% | 344 | 6.4% |
[ 42.5% - 43.0% ] 42.64% | 54,970 | 2.6% |
[ 43.0% - 43.5% ] 43.36% | 11,894 | 2.8% |
[ 43.5% - 44.0% ] 43.72% | 844 | 3.6% |
[ 44.0% - 44.5% ] 44.41% | 53,961 | 3.7% |
[ 45.0% - 45.5% ] 45.12% | 492 | 4.3% |
[ 45.5% - 46.0% ] 45.72% | 1,520 | 6.2% |
[ 46.0% - 46.5% ] 46.47% | 15,548 | 2.4% |
[ 46.5% - 47.0% ] 46.61% | 6,179 | 1.2% |
[ 47.0% - 47.5% ] 47.27% | 165 | 4.2% |
[ 47.5% - 48.0% ] 47.81% | 3,384 | 2.0% |
[ 49.0% - 49.5% ] 49.27% | 619 | 6.8% |
[ 49.5% - 50.0% ] 49.85% | 680 | 2.5% |
[ 51.5% - 52.0% ] 51.77% | 537 | 4.9% |
[ 52.0% - 52.5% ] 52.15% | 7,195 | 2.3% |
[ 53.0% - 53.5% ] 53.17% | 7,723 | 2.2% |
[ 55.0% - 55.5% ] 55.42% | 1,476 | 1.3% |
[ 58.0% - 58.5% ] 58.09% | 272 | 3.7% |
[ 67.0% - 67.5% ] 67.23% | 235 | 4.3% |
[ 69.5% - 70.0% ] 69.57% | 46 | 8.8% |
[ 75.0% - 75.5% ] 75.45% | 220 | 14.1% |
[ 76.5% - 77.0% ] 76.92% | 234 | 13.2% |