Italian Disability Age Under 5
COMPARE
Italian
Select to Compare
Disability Age Under 5
Italian Disability Age Under 5
1.6%
DISABILITY | AGE UNDER 5
0.0/ 100
METRIC RATING
292nd/ 347
METRIC RANK
Italian Disability Age Under 5 Correlation Chart
The statistical analysis conducted on geographies consisting of 261,419,311 people shows a poor positive correlation between the proportion of Italians and percentage of population with a disability under the age of 5 in the United States with a correlation coefficient (R) of 0.164 and weighted average of 1.6%. On average, for every 1% (one percent) increase in Italians within a typical geography, there is an increase of 0.011% in percentage of population with a disability under the age of 5.
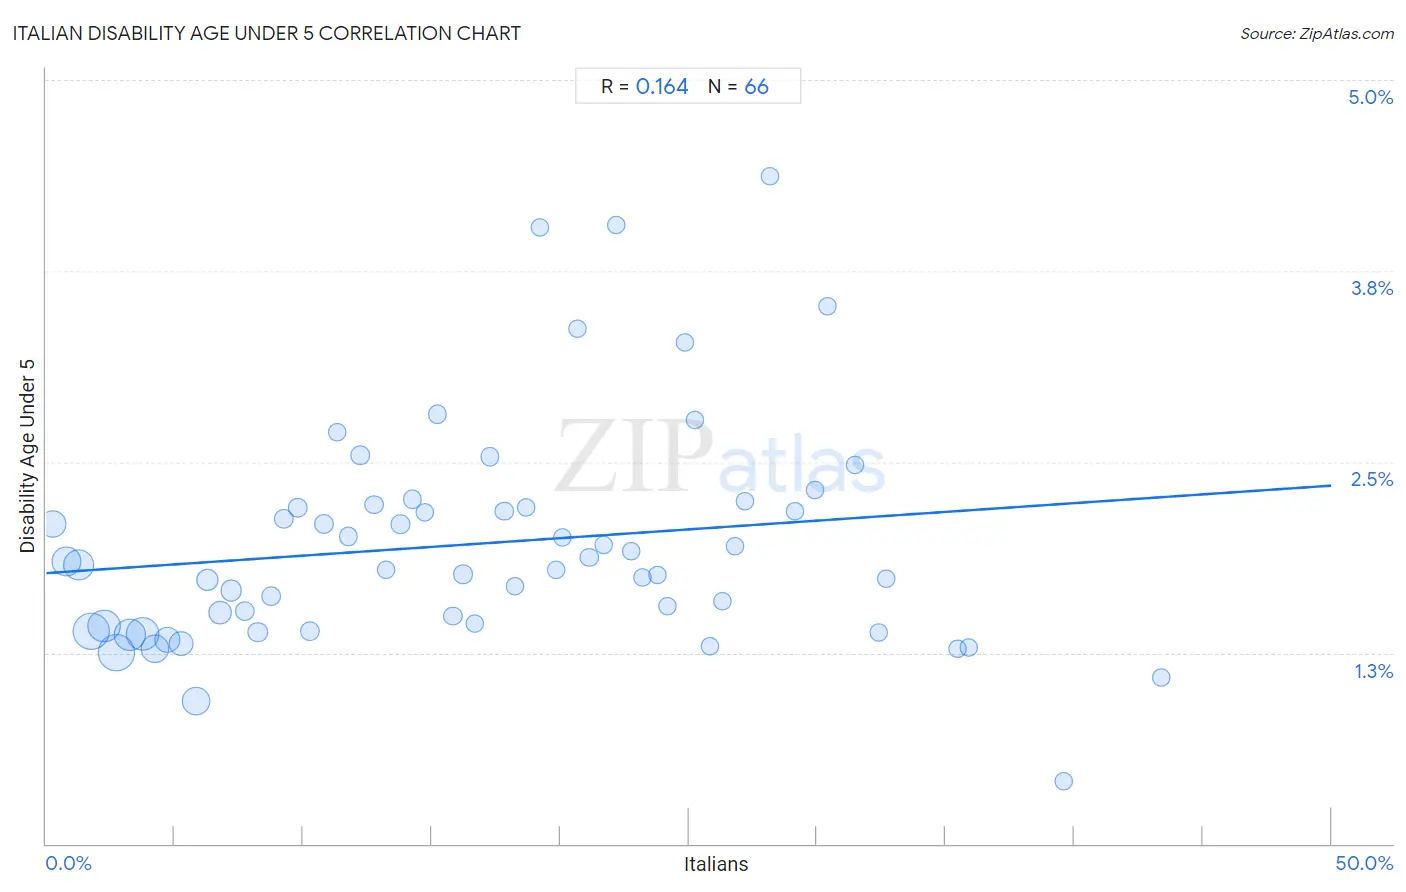
It is essential to understand that the correlation between the percentage of Italians and percentage of population with a disability under the age of 5 does not imply a direct cause-and-effect relationship. It remains uncertain whether the presence of Italians influences an upward or downward trend in the level of percentage of population with a disability under the age of 5 within an area, or if Italians simply ended up residing in those areas with higher or lower levels of percentage of population with a disability under the age of 5 due to other factors.
Demographics Similar to Italians by Disability Age Under 5
In terms of disability age under 5, the demographic groups most similar to Italians are Northern European (1.6%, a difference of 0.14%), Czech (1.5%, a difference of 0.24%), Hungarian (1.5%, a difference of 0.37%), Lithuanian (1.6%, a difference of 0.46%), and Estonian (1.5%, a difference of 0.50%).
| Demographics | Rating | Rank | Disability Age Under 5 |
| Croatians | 0.0 /100 | #285 | Tragic 1.5% |
| Tlingit-Haida | 0.0 /100 | #286 | Tragic 1.5% |
| Scandinavians | 0.0 /100 | #287 | Tragic 1.5% |
| Estonians | 0.0 /100 | #288 | Tragic 1.5% |
| Hungarians | 0.0 /100 | #289 | Tragic 1.5% |
| Czechs | 0.0 /100 | #290 | Tragic 1.5% |
| Northern Europeans | 0.0 /100 | #291 | Tragic 1.6% |
| Italians | 0.0 /100 | #292 | Tragic 1.6% |
| Lithuanians | 0.0 /100 | #293 | Tragic 1.6% |
| Swedes | 0.0 /100 | #294 | Tragic 1.6% |
| Finns | 0.0 /100 | #295 | Tragic 1.6% |
| Poles | 0.0 /100 | #296 | Tragic 1.6% |
| Nonimmigrants | 0.0 /100 | #297 | Tragic 1.6% |
| Cajuns | 0.0 /100 | #298 | Tragic 1.6% |
| Portuguese | 0.0 /100 | #299 | Tragic 1.6% |
Italian Disability Age Under 5 Correlation Summary
| Measurement | Italian Data | Disability Age Under 5 Data |
| Minimum | 0.26% | 0.41% |
| Maximum | 43.4% | 4.4% |
| Range | 43.1% | 4.0% |
| Mean | 17.0% | 2.0% |
| Median | 16.4% | 1.8% |
| Interquartile 25% (IQ1) | 8.2% | 1.4% |
| Interquartile 75% (IQ3) | 24.8% | 2.2% |
| Interquartile Range (IQR) | 16.6% | 0.78% |
| Standard Deviation (Sample) | 10.6% | 0.74% |
| Standard Deviation (Population) | 10.5% | 0.73% |
Correlation Details
| Italian Percentile | Sample Size | Disability Age Under 5 |
[ 0.0% - 0.5% ] 0.26% | 12,300,777 | 2.1% |
[ 0.5% - 1.0% ] 0.77% | 16,124,851 | 1.9% |
[ 1.0% - 1.5% ] 1.27% | 18,872,346 | 1.8% |
[ 1.5% - 2.0% ] 1.74% | 27,873,751 | 1.4% |
[ 2.0% - 2.5% ] 2.25% | 21,393,540 | 1.4% |
[ 2.5% - 3.0% ] 2.74% | 27,365,451 | 1.3% |
[ 3.0% - 3.5% ] 3.26% | 20,967,585 | 1.4% |
[ 3.5% - 4.0% ] 3.76% | 21,899,805 | 1.4% |
[ 4.0% - 4.5% ] 4.25% | 14,923,744 | 1.3% |
[ 4.5% - 5.0% ] 4.72% | 11,609,536 | 1.3% |
[ 5.0% - 5.5% ] 5.25% | 9,640,504 | 1.3% |
[ 5.5% - 6.0% ] 5.82% | 15,316,833 | 0.94% |
[ 6.0% - 6.5% ] 6.25% | 5,961,584 | 1.7% |
[ 6.5% - 7.0% ] 6.76% | 7,002,785 | 1.5% |
[ 7.0% - 7.5% ] 7.21% | 3,996,720 | 1.7% |
[ 7.5% - 8.0% ] 7.73% | 2,310,121 | 1.5% |
[ 8.0% - 8.5% ] 8.23% | 2,713,770 | 1.4% |
[ 8.5% - 9.0% ] 8.73% | 2,139,791 | 1.6% |
[ 9.0% - 9.5% ] 9.22% | 1,698,777 | 2.1% |
[ 9.5% - 10.0% ] 9.78% | 1,233,485 | 2.2% |
[ 10.0% - 10.5% ] 10.26% | 2,090,198 | 1.4% |
[ 10.5% - 11.0% ] 10.79% | 1,250,146 | 2.1% |
[ 11.0% - 11.5% ] 11.31% | 881,585 | 2.7% |
[ 11.5% - 12.0% ] 11.76% | 1,244,715 | 2.0% |
[ 12.0% - 12.5% ] 12.22% | 1,158,888 | 2.5% |
[ 12.5% - 13.0% ] 12.74% | 960,113 | 2.2% |
[ 13.0% - 13.5% ] 13.24% | 538,107 | 1.8% |
[ 13.5% - 14.0% ] 13.78% | 541,761 | 2.1% |
[ 14.0% - 14.5% ] 14.24% | 327,763 | 2.3% |
[ 14.5% - 15.0% ] 14.74% | 515,601 | 2.2% |
[ 15.0% - 15.5% ] 15.23% | 359,415 | 2.8% |
[ 15.5% - 16.0% ] 15.82% | 654,836 | 1.5% |
[ 16.0% - 16.5% ] 16.22% | 238,142 | 1.8% |
[ 16.5% - 17.0% ] 16.68% | 585,168 | 1.4% |
[ 17.0% - 17.5% ] 17.28% | 403,312 | 2.5% |
[ 17.5% - 18.0% ] 17.82% | 334,730 | 2.2% |
[ 18.0% - 18.5% ] 18.23% | 196,970 | 1.7% |
[ 18.5% - 19.0% ] 18.67% | 294,416 | 2.2% |
[ 19.0% - 19.5% ] 19.21% | 212,902 | 4.0% |
[ 19.5% - 20.0% ] 19.84% | 394,126 | 1.8% |
[ 20.0% - 20.5% ] 20.09% | 271,581 | 2.0% |
[ 20.5% - 21.0% ] 20.67% | 100,815 | 3.4% |
[ 21.0% - 21.5% ] 21.13% | 254,162 | 1.9% |
[ 21.5% - 22.0% ] 21.68% | 233,205 | 2.0% |
[ 22.0% - 22.5% ] 22.18% | 68,950 | 4.0% |
[ 22.5% - 23.0% ] 22.74% | 159,422 | 1.9% |
[ 23.0% - 23.5% ] 23.18% | 205,626 | 1.7% |
[ 23.5% - 24.0% ] 23.79% | 168,498 | 1.8% |
[ 24.0% - 24.5% ] 24.16% | 121,130 | 1.6% |
[ 24.5% - 25.0% ] 24.85% | 231,744 | 3.3% |
[ 25.0% - 25.5% ] 25.23% | 167,103 | 2.8% |
[ 25.5% - 26.0% ] 25.81% | 109,758 | 1.3% |
[ 26.0% - 26.5% ] 26.30% | 215,385 | 1.6% |
[ 26.5% - 27.0% ] 26.80% | 91,752 | 1.9% |
[ 27.0% - 27.5% ] 27.20% | 144,940 | 2.2% |
[ 28.0% - 28.5% ] 28.15% | 7,506 | 4.4% |
[ 29.0% - 29.5% ] 29.14% | 35,808 | 2.2% |
[ 29.5% - 30.0% ] 29.89% | 17,281 | 2.3% |
[ 30.0% - 30.5% ] 30.37% | 7,684 | 3.5% |
[ 31.0% - 31.5% ] 31.47% | 96,093 | 2.5% |
[ 32.0% - 32.5% ] 32.38% | 29,923 | 1.4% |
[ 32.5% - 33.0% ] 32.68% | 44,085 | 1.7% |
[ 35.0% - 35.5% ] 35.45% | 4,113 | 1.3% |
[ 35.5% - 36.0% ] 35.89% | 29,522 | 1.3% |
[ 39.5% - 40.0% ] 39.61% | 63,473 | 0.41% |
[ 43.0% - 43.5% ] 43.38% | 11,102 | 1.1% |