Italian Disability Age 5 to 17
COMPARE
Italian
Select to Compare
Disability Age 5 to 17
Italian Disability Age 5 to 17
5.9%
DISABILITY | AGE 5 TO 17
1.2/ 100
METRIC RATING
255th/ 347
METRIC RANK
Italian Disability Age 5 to 17 Correlation Chart
The statistical analysis conducted on geographies consisting of 560,593,784 people shows a mild positive correlation between the proportion of Italians and percentage of population with a disability between the ages 5 and 17 in the United States with a correlation coefficient (R) of 0.362 and weighted average of 5.9%. On average, for every 1% (one percent) increase in Italians within a typical geography, there is an increase of 0.15% in percentage of population with a disability between the ages 5 and 17.
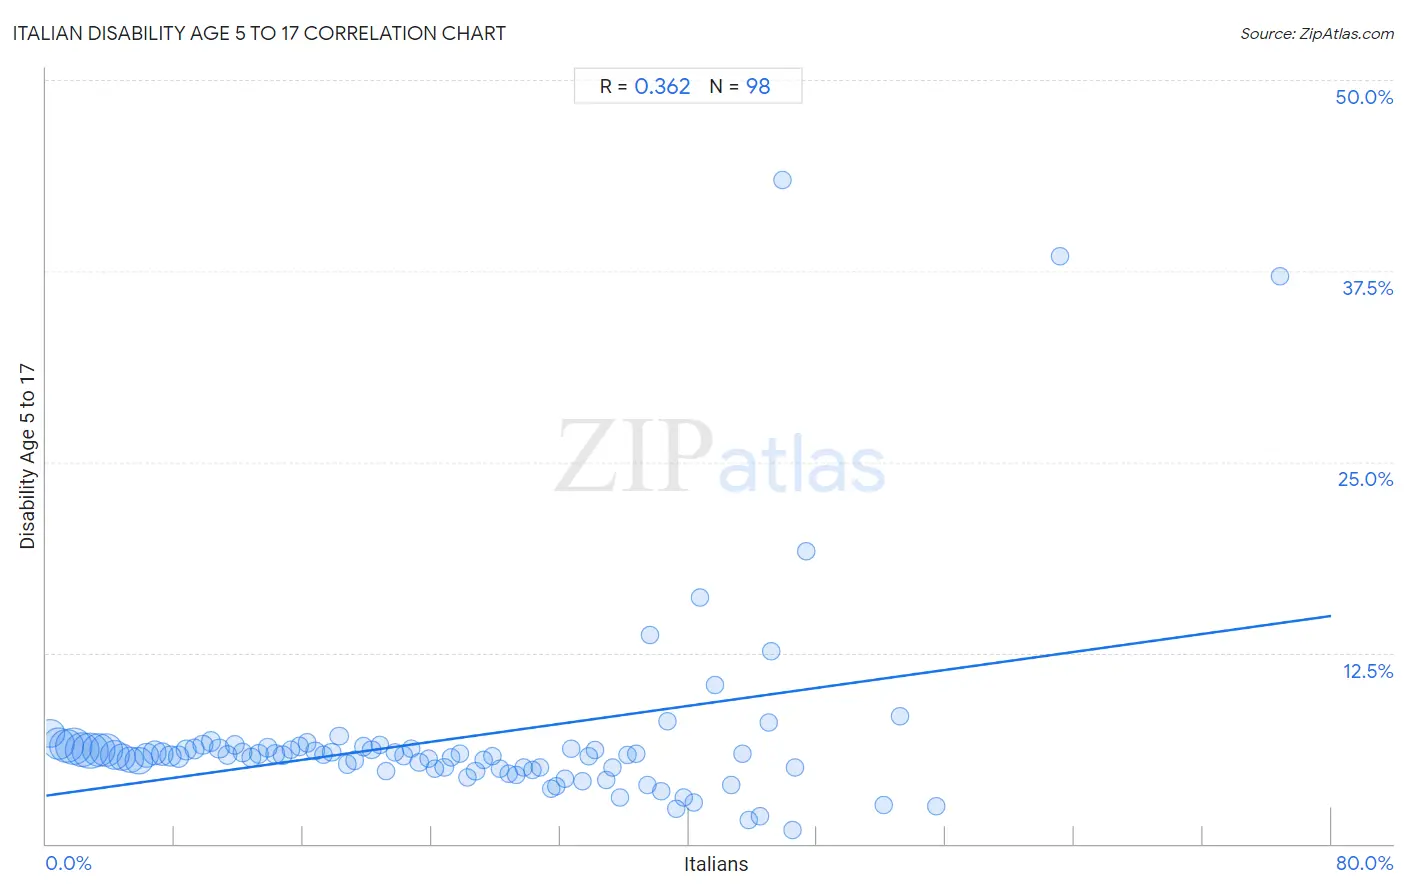
It is essential to understand that the correlation between the percentage of Italians and percentage of population with a disability between the ages 5 and 17 does not imply a direct cause-and-effect relationship. It remains uncertain whether the presence of Italians influences an upward or downward trend in the level of percentage of population with a disability between the ages 5 and 17 within an area, or if Italians simply ended up residing in those areas with higher or lower levels of percentage of population with a disability between the ages 5 and 17 due to other factors.
Demographics Similar to Italians by Disability Age 5 to 17
In terms of disability age 5 to 17, the demographic groups most similar to Italians are Barbadian (5.9%, a difference of 0.070%), Scandinavian (5.9%, a difference of 0.17%), Hopi (5.9%, a difference of 0.20%), Honduran (5.9%, a difference of 0.24%), and Immigrants from Cambodia (5.9%, a difference of 0.26%).
| Demographics | Rating | Rank | Disability Age 5 to 17 |
| British | 1.7 /100 | #248 | Tragic 5.9% |
| Immigrants from Ghana | 1.7 /100 | #249 | Tragic 5.9% |
| Poles | 1.5 /100 | #250 | Tragic 5.9% |
| Immigrants from Cambodia | 1.5 /100 | #251 | Tragic 5.9% |
| Hondurans | 1.5 /100 | #252 | Tragic 5.9% |
| Scandinavians | 1.4 /100 | #253 | Tragic 5.9% |
| Barbadians | 1.3 /100 | #254 | Tragic 5.9% |
| Italians | 1.2 /100 | #255 | Tragic 5.9% |
| Hopi | 1.0 /100 | #256 | Tragic 5.9% |
| Hispanics or Latinos | 1.0 /100 | #257 | Tragic 5.9% |
| Brazilians | 0.9 /100 | #258 | Tragic 5.9% |
| Slavs | 0.9 /100 | #259 | Tragic 5.9% |
| Somalis | 0.8 /100 | #260 | Tragic 5.9% |
| Immigrants from Middle Africa | 0.7 /100 | #261 | Tragic 5.9% |
| Immigrants from Western Africa | 0.7 /100 | #262 | Tragic 5.9% |
Italian Disability Age 5 to 17 Correlation Summary
| Measurement | Italian Data | Disability Age 5 to 17 Data |
| Minimum | 0.27% | 0.89% |
| Maximum | 76.8% | 43.5% |
| Range | 76.6% | 42.6% |
| Mean | 25.2% | 6.9% |
| Median | 24.5% | 5.8% |
| Interquartile 25% (IQ1) | 12.2% | 4.9% |
| Interquartile 75% (IQ3) | 36.7% | 6.2% |
| Interquartile Range (IQR) | 24.5% | 1.3% |
| Standard Deviation (Sample) | 15.7% | 6.4% |
| Standard Deviation (Population) | 15.7% | 6.4% |
Correlation Details
| Italian Percentile | Sample Size | Disability Age 5 to 17 |
[ 0.0% - 0.5% ] 0.27% | 27,943,550 | 7.2% |
[ 0.5% - 1.0% ] 0.77% | 36,944,652 | 6.5% |
[ 1.0% - 1.5% ] 1.26% | 40,919,949 | 6.4% |
[ 1.5% - 2.0% ] 1.74% | 49,175,726 | 6.4% |
[ 2.0% - 2.5% ] 2.25% | 44,403,892 | 6.2% |
[ 2.5% - 3.0% ] 2.74% | 48,659,165 | 6.1% |
[ 3.0% - 3.5% ] 3.25% | 39,501,021 | 6.2% |
[ 3.5% - 4.0% ] 3.76% | 39,031,245 | 6.1% |
[ 4.0% - 4.5% ] 4.25% | 29,976,301 | 5.8% |
[ 4.5% - 5.0% ] 4.73% | 24,795,643 | 5.7% |
[ 5.0% - 5.5% ] 5.25% | 21,443,930 | 5.5% |
[ 5.5% - 6.0% ] 5.79% | 25,648,046 | 5.4% |
[ 6.0% - 6.5% ] 6.24% | 14,455,339 | 5.8% |
[ 6.5% - 7.0% ] 6.75% | 14,629,011 | 5.9% |
[ 7.0% - 7.5% ] 7.23% | 11,147,232 | 5.9% |
[ 7.5% - 8.0% ] 7.74% | 7,495,809 | 5.7% |
[ 8.0% - 8.5% ] 8.25% | 7,368,692 | 5.7% |
[ 8.5% - 9.0% ] 8.73% | 6,606,334 | 6.1% |
[ 9.0% - 9.5% ] 9.23% | 5,601,288 | 6.2% |
[ 9.5% - 10.0% ] 9.75% | 4,497,137 | 6.5% |
[ 10.0% - 10.5% ] 10.25% | 5,100,023 | 6.7% |
[ 10.5% - 11.0% ] 10.77% | 4,096,680 | 6.2% |
[ 11.0% - 11.5% ] 11.27% | 3,349,860 | 5.8% |
[ 11.5% - 12.0% ] 11.75% | 3,895,771 | 6.5% |
[ 12.0% - 12.5% ] 12.22% | 3,364,998 | 6.0% |
[ 12.5% - 13.0% ] 12.75% | 3,044,966 | 5.7% |
[ 13.0% - 13.5% ] 13.23% | 2,514,473 | 5.9% |
[ 13.5% - 14.0% ] 13.76% | 2,171,897 | 6.3% |
[ 14.0% - 14.5% ] 14.26% | 2,004,833 | 5.9% |
[ 14.5% - 15.0% ] 14.74% | 2,223,736 | 5.8% |
[ 15.0% - 15.5% ] 15.24% | 1,678,845 | 6.2% |
[ 15.5% - 16.0% ] 15.77% | 2,395,077 | 6.4% |
[ 16.0% - 16.5% ] 16.25% | 1,684,512 | 6.6% |
[ 16.5% - 17.0% ] 16.74% | 1,985,966 | 6.1% |
[ 17.0% - 17.5% ] 17.25% | 1,575,351 | 5.8% |
[ 17.5% - 18.0% ] 17.76% | 1,331,524 | 6.0% |
[ 18.0% - 18.5% ] 18.24% | 954,304 | 7.1% |
[ 18.5% - 19.0% ] 18.74% | 1,226,848 | 5.2% |
[ 19.0% - 19.5% ] 19.23% | 1,507,997 | 5.5% |
[ 19.5% - 20.0% ] 19.77% | 1,351,488 | 6.4% |
[ 20.0% - 20.5% ] 20.24% | 1,203,557 | 6.2% |
[ 20.5% - 21.0% ] 20.76% | 649,170 | 6.5% |
[ 21.0% - 21.5% ] 21.17% | 832,790 | 4.8% |
[ 21.5% - 22.0% ] 21.73% | 614,888 | 6.0% |
[ 22.0% - 22.5% ] 22.27% | 598,618 | 5.8% |
[ 22.5% - 23.0% ] 22.72% | 559,789 | 6.2% |
[ 23.0% - 23.5% ] 23.22% | 746,105 | 5.3% |
[ 23.5% - 24.0% ] 23.78% | 573,522 | 5.6% |
[ 24.0% - 24.5% ] 24.19% | 560,779 | 4.9% |
[ 24.5% - 25.0% ] 24.78% | 655,961 | 5.0% |
[ 25.0% - 25.5% ] 25.24% | 636,255 | 5.6% |
[ 25.5% - 26.0% ] 25.77% | 450,737 | 5.9% |
[ 26.0% - 26.5% ] 26.24% | 389,416 | 4.4% |
[ 26.5% - 27.0% ] 26.73% | 378,688 | 4.8% |
[ 27.0% - 27.5% ] 27.23% | 495,357 | 5.5% |
[ 27.5% - 28.0% ] 27.74% | 643,963 | 5.8% |
[ 28.0% - 28.5% ] 28.22% | 215,127 | 4.9% |
[ 28.5% - 29.0% ] 28.76% | 272,132 | 4.5% |
[ 29.0% - 29.5% ] 29.25% | 321,633 | 4.5% |
[ 29.5% - 30.0% ] 29.69% | 234,192 | 5.0% |
[ 30.0% - 30.5% ] 30.25% | 193,445 | 4.8% |
[ 30.5% - 31.0% ] 30.76% | 177,171 | 5.0% |
[ 31.0% - 31.5% ] 31.42% | 184,318 | 3.6% |
[ 31.5% - 32.0% ] 31.76% | 88,164 | 3.8% |
[ 32.0% - 32.5% ] 32.32% | 119,451 | 4.2% |
[ 32.5% - 33.0% ] 32.72% | 106,336 | 6.2% |
[ 33.0% - 33.5% ] 33.36% | 85,027 | 4.1% |
[ 33.5% - 34.0% ] 33.77% | 54,420 | 5.8% |
[ 34.0% - 34.5% ] 34.18% | 60,340 | 6.2% |
[ 34.5% - 35.0% ] 34.86% | 49,712 | 4.2% |
[ 35.0% - 35.5% ] 35.21% | 64,297 | 5.0% |
[ 35.5% - 36.0% ] 35.73% | 84,016 | 3.0% |
[ 36.0% - 36.5% ] 36.16% | 89,864 | 5.8% |
[ 36.5% - 37.0% ] 36.74% | 73,884 | 5.9% |
[ 37.0% - 37.5% ] 37.44% | 54,560 | 3.8% |
[ 37.5% - 38.0% ] 37.61% | 10,067 | 13.7% |
[ 38.0% - 38.5% ] 38.29% | 37,848 | 3.4% |
[ 38.5% - 39.0% ] 38.66% | 6,218 | 8.0% |
[ 39.0% - 39.5% ] 39.23% | 31,648 | 2.3% |
[ 39.5% - 40.0% ] 39.69% | 93,026 | 3.0% |
[ 40.0% - 40.5% ] 40.34% | 30,308 | 2.7% |
[ 40.5% - 41.0% ] 40.74% | 1,436 | 16.1% |
[ 41.5% - 42.0% ] 41.66% | 1,702 | 10.4% |
[ 42.5% - 43.0% ] 42.64% | 54,970 | 3.9% |
[ 43.0% - 43.5% ] 43.36% | 11,841 | 5.9% |
[ 43.5% - 44.0% ] 43.72% | 844 | 1.5% |
[ 44.0% - 44.5% ] 44.41% | 52,938 | 1.8% |
[ 44.5% - 45.0% ] 44.98% | 1,256 | 7.9% |
[ 45.0% - 45.5% ] 45.12% | 492 | 12.6% |
[ 45.5% - 46.0% ] 45.83% | 72 | 43.5% |
[ 46.0% - 46.5% ] 46.49% | 14,755 | 0.89% |
[ 46.5% - 47.0% ] 46.61% | 6,179 | 5.0% |
[ 47.0% - 47.5% ] 47.30% | 222 | 19.1% |
[ 52.0% - 52.5% ] 52.15% | 7,195 | 2.5% |
[ 53.0% - 53.5% ] 53.17% | 7,895 | 8.3% |
[ 55.0% - 55.5% ] 55.42% | 1,476 | 2.5% |
[ 63.0% - 63.5% ] 63.08% | 195 | 38.5% |
[ 76.5% - 77.0% ] 76.85% | 406 | 37.2% |