Immigrants from Bangladesh vs Immigrants from Asia Married-Couple Family Poverty
COMPARE
Immigrants from Bangladesh
Immigrants from Asia
Married-Couple Family Poverty
Married-Couple Family Poverty Comparison
Immigrants from Bangladesh
Immigrants from Asia
7.5%
MARRIED-COUPLE FAMILY POVERTY
0.0/ 100
METRIC RATING
326th/ 347
METRIC RANK
4.8%
MARRIED-COUPLE FAMILY POVERTY
92.3/ 100
METRIC RATING
126th/ 347
METRIC RANK
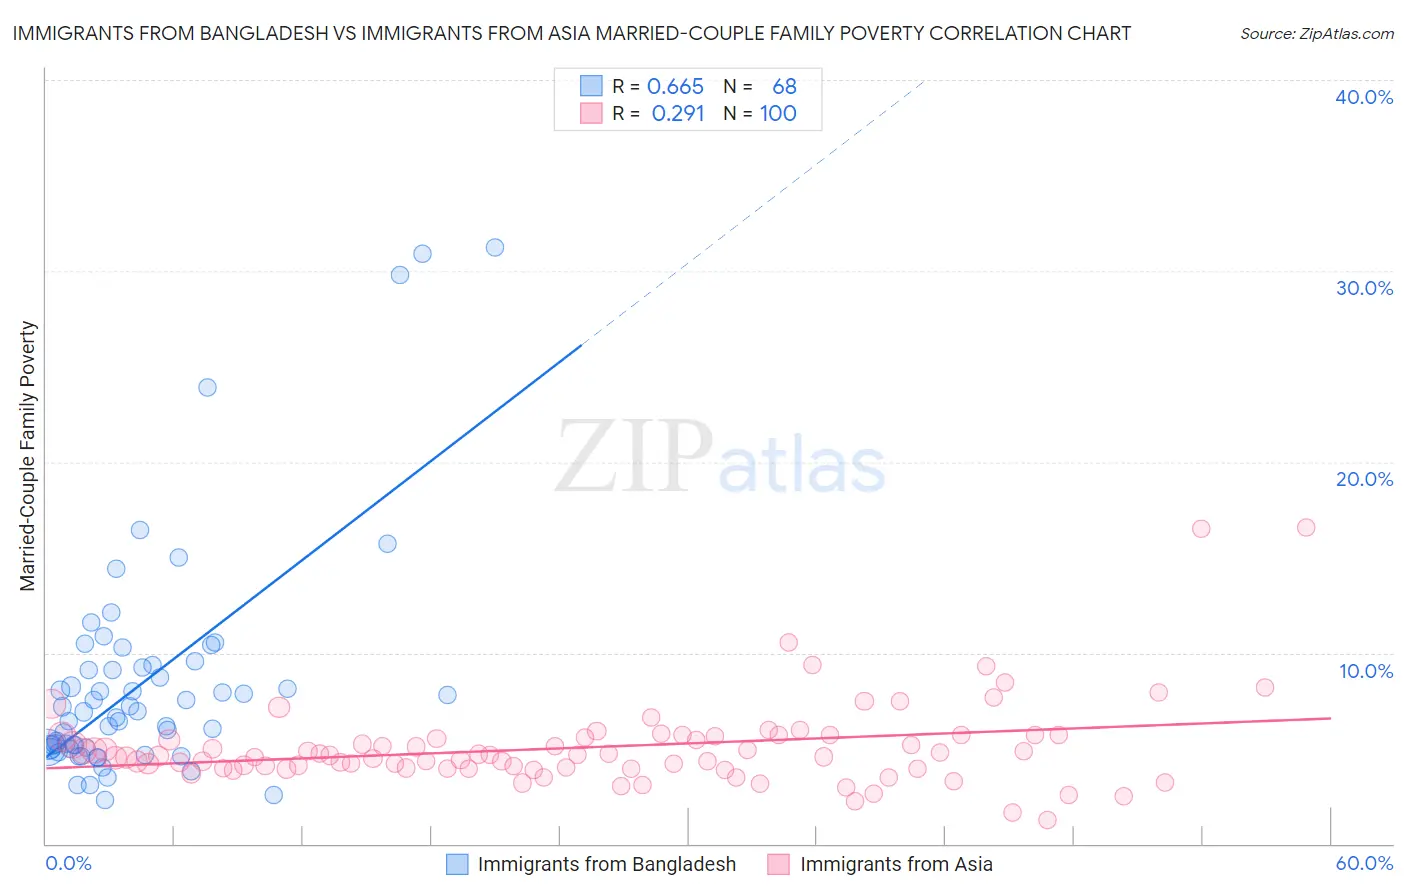
Immigrants from Bangladesh vs Immigrants from Asia Married-Couple Family Poverty Correlation Chart
The statistical analysis conducted on geographies consisting of 202,866,788 people shows a significant positive correlation between the proportion of Immigrants from Bangladesh and poverty level among married-couple families in the United States with a correlation coefficient (R) of 0.665 and weighted average of 7.5%. Similarly, the statistical analysis conducted on geographies consisting of 538,014,921 people shows a weak positive correlation between the proportion of Immigrants from Asia and poverty level among married-couple families in the United States with a correlation coefficient (R) of 0.291 and weighted average of 4.8%, a difference of 54.6%.
Married-Couple Family Poverty Correlation Summary
| Measurement | Immigrants from Bangladesh | Immigrants from Asia |
| Minimum | 2.3% | 1.2% |
| Maximum | 31.2% | 16.6% |
| Range | 29.0% | 15.4% |
| Mean | 8.5% | 5.1% |
| Median | 6.9% | 4.6% |
| Interquartile 25% (IQ1) | 5.0% | 3.9% |
| Interquartile 75% (IQ3) | 9.3% | 5.6% |
| Interquartile Range (IQR) | 4.3% | 1.7% |
| Standard Deviation (Sample) | 6.0% | 2.3% |
| Standard Deviation (Population) | 6.0% | 2.3% |
Similar Demographics by Married-Couple Family Poverty
Demographics Similar to Immigrants from Bangladesh by Married-Couple Family Poverty
In terms of married-couple family poverty, the demographic groups most similar to Immigrants from Bangladesh are Hispanic or Latino (7.5%, a difference of 0.0%), Immigrants from Cuba (7.5%, a difference of 0.20%), Immigrants from Central America (7.4%, a difference of 0.73%), Vietnamese (7.4%, a difference of 0.82%), and Immigrants from Mexico (7.6%, a difference of 1.2%).
| Demographics | Rating | Rank | Married-Couple Family Poverty |
| Immigrants | Latin America | 0.0 /100 | #319 | Tragic 7.2% |
| Immigrants | Grenada | 0.0 /100 | #320 | Tragic 7.3% |
| Immigrants | Caribbean | 0.0 /100 | #321 | Tragic 7.3% |
| Immigrants | Honduras | 0.0 /100 | #322 | Tragic 7.3% |
| Vietnamese | 0.0 /100 | #323 | Tragic 7.4% |
| Immigrants | Central America | 0.0 /100 | #324 | Tragic 7.4% |
| Immigrants | Cuba | 0.0 /100 | #325 | Tragic 7.5% |
| Immigrants | Bangladesh | 0.0 /100 | #326 | Tragic 7.5% |
| Hispanics or Latinos | 0.0 /100 | #327 | Tragic 7.5% |
| Immigrants | Mexico | 0.0 /100 | #328 | Tragic 7.6% |
| Natives/Alaskans | 0.0 /100 | #329 | Tragic 8.2% |
| Paiute | 0.0 /100 | #330 | Tragic 8.3% |
| Central American Indians | 0.0 /100 | #331 | Tragic 8.3% |
| Dominicans | 0.0 /100 | #332 | Tragic 8.3% |
| Lumbee | 0.0 /100 | #333 | Tragic 8.3% |
Demographics Similar to Immigrants from Asia by Married-Couple Family Poverty
In terms of married-couple family poverty, the demographic groups most similar to Immigrants from Asia are Immigrants from Bosnia and Herzegovina (4.8%, a difference of 0.070%), Romanian (4.8%, a difference of 0.090%), Egyptian (4.8%, a difference of 0.14%), Jordanian (4.8%, a difference of 0.36%), and White/Caucasian (4.8%, a difference of 0.37%).
| Demographics | Rating | Rank | Married-Couple Family Poverty |
| Immigrants | Eastern Asia | 94.0 /100 | #119 | Exceptional 4.8% |
| Immigrants | Southern Europe | 93.4 /100 | #120 | Exceptional 4.8% |
| Indians (Asian) | 93.2 /100 | #121 | Exceptional 4.8% |
| Whites/Caucasians | 93.1 /100 | #122 | Exceptional 4.8% |
| Jordanians | 93.1 /100 | #123 | Exceptional 4.8% |
| Romanians | 92.5 /100 | #124 | Exceptional 4.8% |
| Immigrants | Bosnia and Herzegovina | 92.5 /100 | #125 | Exceptional 4.8% |
| Immigrants | Asia | 92.3 /100 | #126 | Exceptional 4.8% |
| Egyptians | 92.0 /100 | #127 | Exceptional 4.8% |
| Palestinians | 91.2 /100 | #128 | Exceptional 4.9% |
| Immigrants | Pakistan | 90.7 /100 | #129 | Exceptional 4.9% |
| Soviet Union | 90.7 /100 | #130 | Exceptional 4.9% |
| Immigrants | Eastern Europe | 90.5 /100 | #131 | Exceptional 4.9% |
| Puget Sound Salish | 90.4 /100 | #132 | Exceptional 4.9% |
| Immigrants | Kenya | 90.2 /100 | #133 | Exceptional 4.9% |