Immigrants from Bangladesh Self-Care Disability
COMPARE
Immigrants from Bangladesh
Select to Compare
Self-Care Disability
Immigrants from Bangladesh Self-Care Disability
2.6%
SELF-CARE DISABILITY
0.4/ 100
METRIC RATING
252nd/ 347
METRIC RANK
Immigrants from Bangladesh Self-Care Disability Correlation Chart
The statistical analysis conducted on geographies consisting of 203,543,438 people shows no correlation between the proportion of Immigrants from Bangladesh and percentage of population with self-care disability in the United States with a correlation coefficient (R) of 0.015 and weighted average of 2.6%. On average, for every 1% (one percent) increase in Immigrants from Bangladesh within a typical geography, there is an increase of 0.0033% in percentage of population with self-care disability.
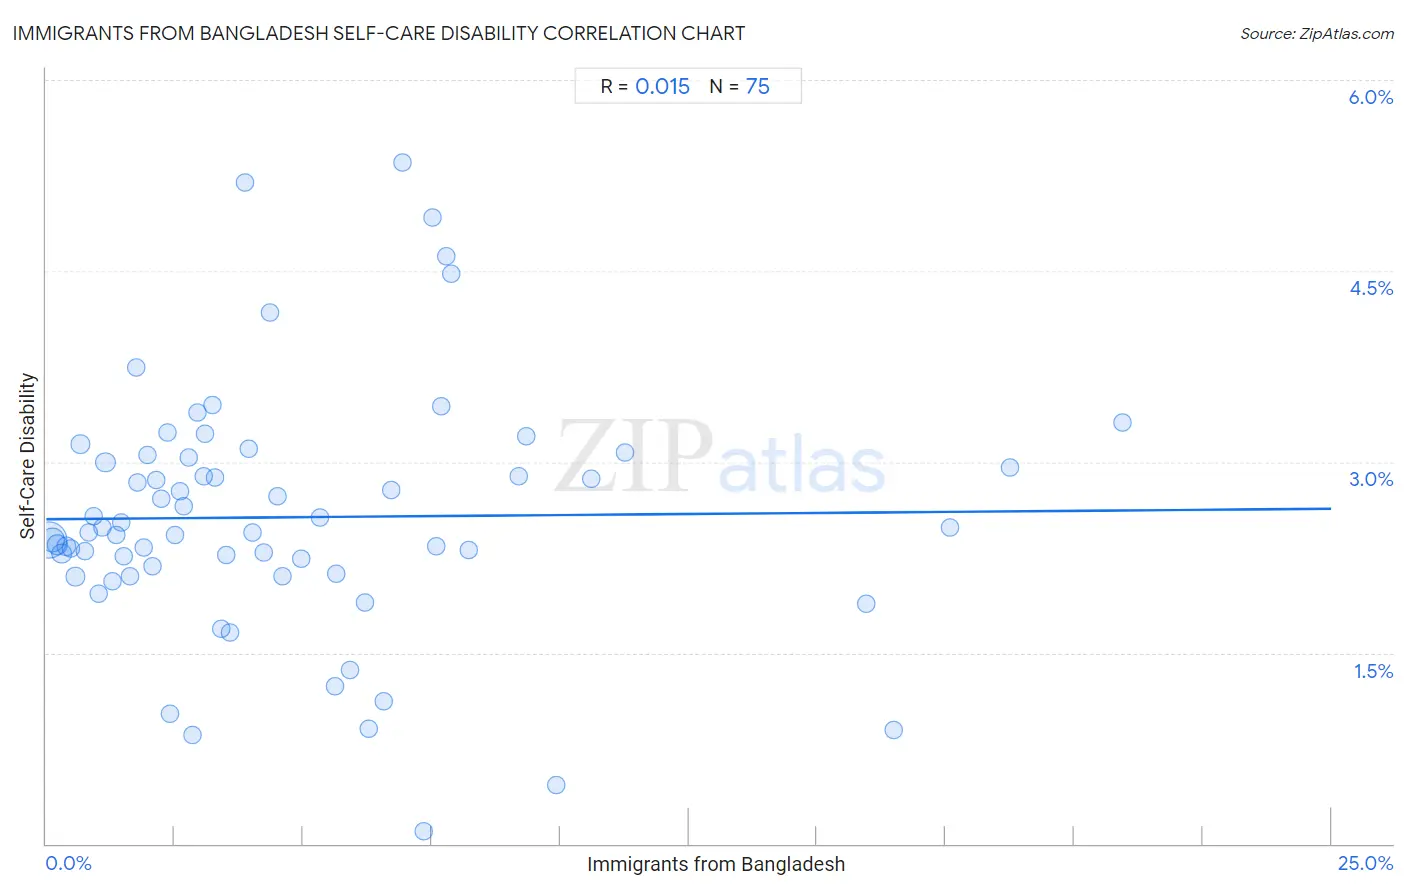
It is essential to understand that the correlation between the percentage of Immigrants from Bangladesh and percentage of population with self-care disability does not imply a direct cause-and-effect relationship. It remains uncertain whether the presence of Immigrants from Bangladesh influences an upward or downward trend in the level of percentage of population with self-care disability within an area, or if Immigrants from Bangladesh simply ended up residing in those areas with higher or lower levels of percentage of population with self-care disability due to other factors.
Demographics Similar to Immigrants from Bangladesh by Self-Care Disability
In terms of self-care disability, the demographic groups most similar to Immigrants from Bangladesh are Immigrants from Liberia (2.6%, a difference of 0.070%), Immigrants from Haiti (2.6%, a difference of 0.080%), Haitian (2.6%, a difference of 0.10%), Tsimshian (2.6%, a difference of 0.14%), and Portuguese (2.6%, a difference of 0.15%).
| Demographics | Rating | Rank | Self-Care Disability |
| Immigrants from Western Asia | 0.6 /100 | #245 | Tragic 2.6% |
| Cheyenne | 0.6 /100 | #246 | Tragic 2.6% |
| Immigrants from Albania | 0.6 /100 | #247 | Tragic 2.6% |
| Nicaraguans | 0.6 /100 | #248 | Tragic 2.6% |
| Mexican American Indians | 0.5 /100 | #249 | Tragic 2.6% |
| Portuguese | 0.4 /100 | #250 | Tragic 2.6% |
| Immigrants from Liberia | 0.4 /100 | #251 | Tragic 2.6% |
| Immigrants from Bangladesh | 0.4 /100 | #252 | Tragic 2.6% |
| Immigrants from Haiti | 0.3 /100 | #253 | Tragic 2.6% |
| Haitians | 0.3 /100 | #254 | Tragic 2.6% |
| Tsimshian | 0.3 /100 | #255 | Tragic 2.6% |
| Immigrants from Central America | 0.3 /100 | #256 | Tragic 2.6% |
| Potawatomi | 0.3 /100 | #257 | Tragic 2.6% |
| Nonimmigrants | 0.3 /100 | #258 | Tragic 2.6% |
| Immigrants from Belarus | 0.2 /100 | #259 | Tragic 2.6% |
Immigrants from Bangladesh Self-Care Disability Correlation Summary
| Measurement | Immigrants from Bangladesh Data | Self-Care Disability Data |
| Minimum | 0.039% | 0.094% |
| Maximum | 20.9% | 5.4% |
| Range | 20.9% | 5.3% |
| Mean | 4.8% | 2.6% |
| Median | 3.3% | 2.4% |
| Interquartile 25% (IQ1) | 1.6% | 2.1% |
| Interquartile 75% (IQ3) | 6.7% | 3.0% |
| Interquartile Range (IQR) | 5.1% | 0.92% |
| Standard Deviation (Sample) | 4.5% | 0.97% |
| Standard Deviation (Population) | 4.5% | 0.97% |
Correlation Details
| Immigrants from Bangladesh Percentile | Sample Size | Self-Care Disability |
[ 0.0% - 0.5% ] 0.039% | 108,356,206 | 2.4% |
[ 0.0% - 0.5% ] 0.13% | 36,613,013 | 2.4% |
[ 0.0% - 0.5% ] 0.21% | 17,085,345 | 2.3% |
[ 0.0% - 0.5% ] 0.30% | 9,259,111 | 2.3% |
[ 0.0% - 0.5% ] 0.39% | 6,280,930 | 2.3% |
[ 0.0% - 0.5% ] 0.48% | 3,685,134 | 2.3% |
[ 0.5% - 1.0% ] 0.57% | 2,403,868 | 2.1% |
[ 0.5% - 1.0% ] 0.66% | 2,799,583 | 3.1% |
[ 0.5% - 1.0% ] 0.74% | 1,362,017 | 2.3% |
[ 0.5% - 1.0% ] 0.83% | 882,455 | 2.4% |
[ 0.5% - 1.0% ] 0.92% | 796,175 | 2.6% |
[ 1.0% - 1.5% ] 1.02% | 652,008 | 2.0% |
[ 1.0% - 1.5% ] 1.09% | 329,561 | 2.5% |
[ 1.0% - 1.5% ] 1.16% | 8,975,525 | 3.0% |
[ 1.0% - 1.5% ] 1.28% | 285,824 | 2.1% |
[ 1.0% - 1.5% ] 1.37% | 169,464 | 2.4% |
[ 1.0% - 1.5% ] 1.46% | 228,414 | 2.5% |
[ 1.5% - 2.0% ] 1.52% | 118,471 | 2.3% |
[ 1.5% - 2.0% ] 1.63% | 97,379 | 2.1% |
[ 1.5% - 2.0% ] 1.74% | 210,174 | 3.7% |
[ 1.5% - 2.0% ] 1.78% | 379,641 | 2.8% |
[ 1.5% - 2.0% ] 1.89% | 69,610 | 2.3% |
[ 1.5% - 2.0% ] 1.97% | 214,782 | 3.1% |
[ 2.0% - 2.5% ] 2.06% | 78,110 | 2.2% |
[ 2.0% - 2.5% ] 2.13% | 42,368 | 2.9% |
[ 2.0% - 2.5% ] 2.24% | 46,309 | 2.7% |
[ 2.0% - 2.5% ] 2.36% | 60,080 | 3.2% |
[ 2.0% - 2.5% ] 2.41% | 27,698 | 1.0% |
[ 2.5% - 3.0% ] 2.51% | 153,852 | 2.4% |
[ 2.5% - 3.0% ] 2.61% | 31,106 | 2.8% |
[ 2.5% - 3.0% ] 2.68% | 164,756 | 2.6% |
[ 2.5% - 3.0% ] 2.78% | 9,966 | 3.0% |
[ 2.5% - 3.0% ] 2.85% | 2,985 | 0.85% |
[ 2.5% - 3.0% ] 2.94% | 23,797 | 3.4% |
[ 3.0% - 3.5% ] 3.06% | 9,973 | 2.9% |
[ 3.0% - 3.5% ] 3.10% | 46,794 | 3.2% |
[ 3.0% - 3.5% ] 3.24% | 145,098 | 3.5% |
[ 3.0% - 3.5% ] 3.27% | 94,815 | 2.9% |
[ 3.0% - 3.5% ] 3.40% | 90,548 | 1.7% |
[ 3.0% - 3.5% ] 3.50% | 3,688 | 2.3% |
[ 3.5% - 4.0% ] 3.57% | 50,650 | 1.7% |
[ 3.5% - 4.0% ] 3.86% | 2,279 | 5.2% |
[ 3.5% - 4.0% ] 3.93% | 25,606 | 3.1% |
[ 4.0% - 4.5% ] 4.00% | 67,001 | 2.4% |
[ 4.0% - 4.5% ] 4.23% | 40,198 | 2.3% |
[ 4.0% - 4.5% ] 4.36% | 65,283 | 4.2% |
[ 4.5% - 5.0% ] 4.51% | 29,308 | 2.7% |
[ 4.5% - 5.0% ] 4.60% | 12,129 | 2.1% |
[ 4.5% - 5.0% ] 4.96% | 126,907 | 2.2% |
[ 5.0% - 5.5% ] 5.32% | 73,318 | 2.6% |
[ 5.5% - 6.0% ] 5.61% | 97,668 | 1.2% |
[ 5.5% - 6.0% ] 5.64% | 127,805 | 2.1% |
[ 5.5% - 6.0% ] 5.90% | 3,490 | 1.4% |
[ 6.0% - 6.5% ] 6.21% | 5,923 | 1.9% |
[ 6.0% - 6.5% ] 6.28% | 26,939 | 0.90% |
[ 6.5% - 7.0% ] 6.56% | 366 | 1.1% |
[ 6.5% - 7.0% ] 6.70% | 1,164 | 2.8% |
[ 6.5% - 7.0% ] 6.93% | 30,063 | 5.4% |
[ 7.0% - 7.5% ] 7.35% | 1,102 | 0.094% |
[ 7.5% - 8.0% ] 7.51% | 28,327 | 4.9% |
[ 7.5% - 8.0% ] 7.60% | 4,146 | 2.3% |
[ 7.5% - 8.0% ] 7.70% | 52,160 | 3.4% |
[ 7.5% - 8.0% ] 7.77% | 29,921 | 4.6% |
[ 7.5% - 8.0% ] 7.88% | 77,230 | 4.5% |
[ 8.0% - 8.5% ] 8.22% | 59,961 | 2.3% |
[ 9.0% - 9.5% ] 9.20% | 31,200 | 2.9% |
[ 9.0% - 9.5% ] 9.33% | 847 | 3.2% |
[ 9.5% - 10.0% ] 9.91% | 938 | 0.46% |
[ 10.5% - 11.0% ] 10.61% | 3,006 | 2.9% |
[ 11.0% - 11.5% ] 11.26% | 27,794 | 3.1% |
[ 15.5% - 16.0% ] 15.95% | 17,328 | 1.9% |
[ 16.0% - 16.5% ] 16.49% | 1,425 | 0.89% |
[ 17.5% - 18.0% ] 17.59% | 27,842 | 2.5% |
[ 18.5% - 19.0% ] 18.74% | 64,268 | 3.0% |
[ 20.5% - 21.0% ] 20.93% | 43,213 | 3.3% |