Immigrants from Bangladesh vs Greek Married-Couple Family Poverty
COMPARE
Immigrants from Bangladesh
Greek
Married-Couple Family Poverty
Married-Couple Family Poverty Comparison
Immigrants from Bangladesh
Greeks
7.5%
MARRIED-COUPLE FAMILY POVERTY
0.0/ 100
METRIC RATING
326th/ 347
METRIC RANK
4.2%
MARRIED-COUPLE FAMILY POVERTY
99.9/ 100
METRIC RATING
32nd/ 347
METRIC RANK
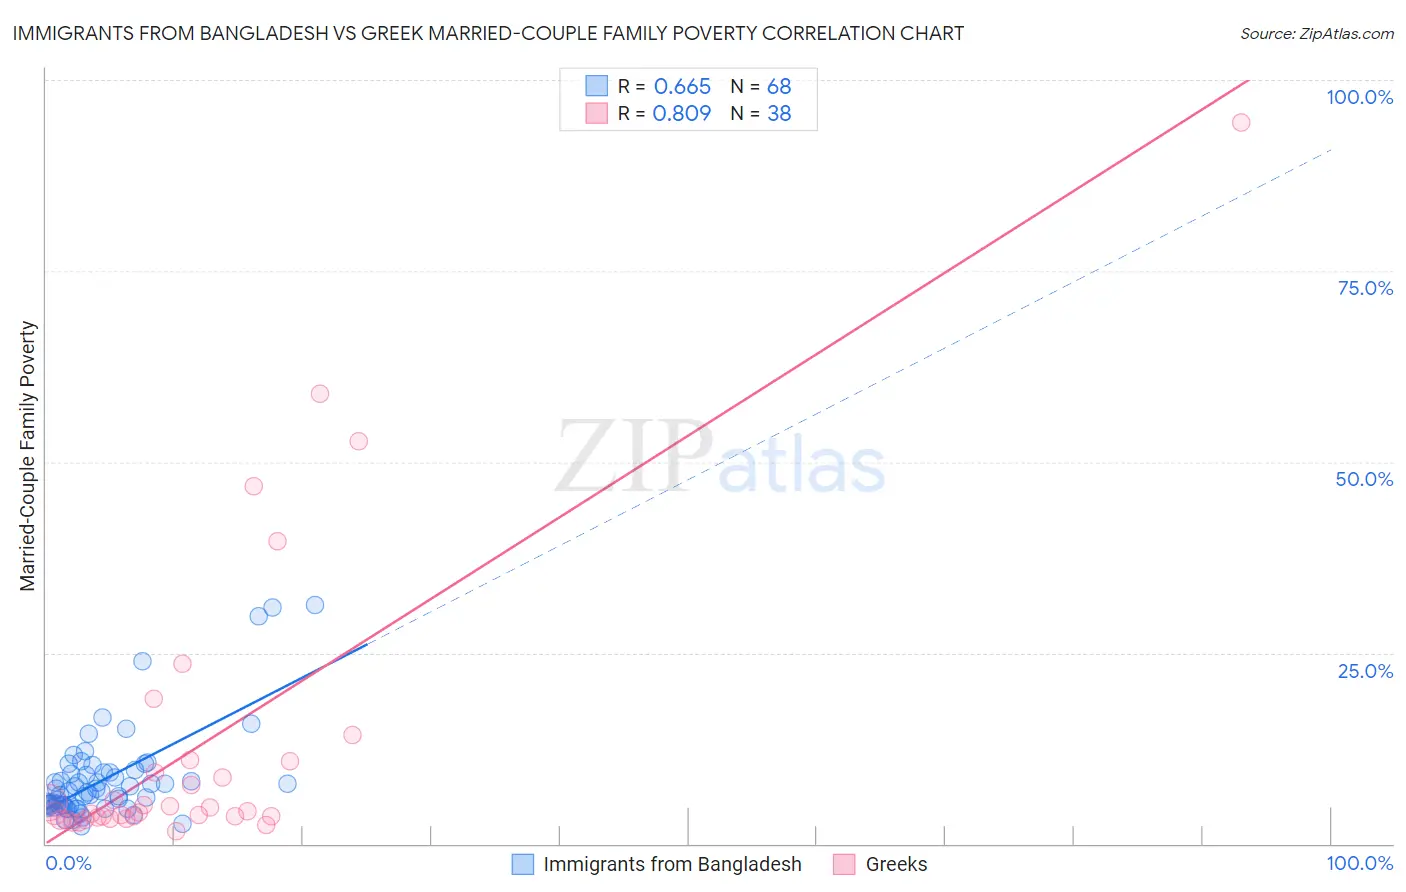
Immigrants from Bangladesh vs Greek Married-Couple Family Poverty Correlation Chart
The statistical analysis conducted on geographies consisting of 202,866,788 people shows a significant positive correlation between the proportion of Immigrants from Bangladesh and poverty level among married-couple families in the United States with a correlation coefficient (R) of 0.665 and weighted average of 7.5%. Similarly, the statistical analysis conducted on geographies consisting of 475,318,702 people shows a very strong positive correlation between the proportion of Greeks and poverty level among married-couple families in the United States with a correlation coefficient (R) of 0.809 and weighted average of 4.2%, a difference of 79.6%.
Married-Couple Family Poverty Correlation Summary
| Measurement | Immigrants from Bangladesh | Greek |
| Minimum | 2.3% | 1.6% |
| Maximum | 31.2% | 94.4% |
| Range | 29.0% | 92.7% |
| Mean | 8.5% | 12.9% |
| Median | 6.9% | 4.2% |
| Interquartile 25% (IQ1) | 5.0% | 3.5% |
| Interquartile 75% (IQ3) | 9.3% | 10.8% |
| Interquartile Range (IQR) | 4.3% | 7.3% |
| Standard Deviation (Sample) | 6.0% | 19.8% |
| Standard Deviation (Population) | 6.0% | 19.6% |
Similar Demographics by Married-Couple Family Poverty
Demographics Similar to Immigrants from Bangladesh by Married-Couple Family Poverty
In terms of married-couple family poverty, the demographic groups most similar to Immigrants from Bangladesh are Hispanic or Latino (7.5%, a difference of 0.0%), Immigrants from Cuba (7.5%, a difference of 0.20%), Immigrants from Central America (7.4%, a difference of 0.73%), Vietnamese (7.4%, a difference of 0.82%), and Immigrants from Mexico (7.6%, a difference of 1.2%).
| Demographics | Rating | Rank | Married-Couple Family Poverty |
| Immigrants | Latin America | 0.0 /100 | #319 | Tragic 7.2% |
| Immigrants | Grenada | 0.0 /100 | #320 | Tragic 7.3% |
| Immigrants | Caribbean | 0.0 /100 | #321 | Tragic 7.3% |
| Immigrants | Honduras | 0.0 /100 | #322 | Tragic 7.3% |
| Vietnamese | 0.0 /100 | #323 | Tragic 7.4% |
| Immigrants | Central America | 0.0 /100 | #324 | Tragic 7.4% |
| Immigrants | Cuba | 0.0 /100 | #325 | Tragic 7.5% |
| Immigrants | Bangladesh | 0.0 /100 | #326 | Tragic 7.5% |
| Hispanics or Latinos | 0.0 /100 | #327 | Tragic 7.5% |
| Immigrants | Mexico | 0.0 /100 | #328 | Tragic 7.6% |
| Natives/Alaskans | 0.0 /100 | #329 | Tragic 8.2% |
| Paiute | 0.0 /100 | #330 | Tragic 8.3% |
| Central American Indians | 0.0 /100 | #331 | Tragic 8.3% |
| Dominicans | 0.0 /100 | #332 | Tragic 8.3% |
| Lumbee | 0.0 /100 | #333 | Tragic 8.3% |
Demographics Similar to Greeks by Married-Couple Family Poverty
In terms of married-couple family poverty, the demographic groups most similar to Greeks are Estonian (4.2%, a difference of 0.11%), Finnish (4.2%, a difference of 0.19%), Immigrants from Scotland (4.2%, a difference of 0.43%), Scandinavian (4.1%, a difference of 0.47%), and Irish (4.2%, a difference of 0.48%).
| Demographics | Rating | Rank | Married-Couple Family Poverty |
| Immigrants | Taiwan | 99.9 /100 | #25 | Exceptional 4.1% |
| Cypriots | 99.9 /100 | #26 | Exceptional 4.1% |
| Danes | 99.9 /100 | #27 | Exceptional 4.1% |
| Scandinavians | 99.9 /100 | #28 | Exceptional 4.1% |
| Immigrants | Scotland | 99.9 /100 | #29 | Exceptional 4.2% |
| Finns | 99.9 /100 | #30 | Exceptional 4.2% |
| Estonians | 99.9 /100 | #31 | Exceptional 4.2% |
| Greeks | 99.9 /100 | #32 | Exceptional 4.2% |
| Irish | 99.9 /100 | #33 | Exceptional 4.2% |
| Dutch | 99.9 /100 | #34 | Exceptional 4.2% |
| Europeans | 99.9 /100 | #35 | Exceptional 4.2% |
| English | 99.9 /100 | #36 | Exceptional 4.2% |
| Iranians | 99.9 /100 | #37 | Exceptional 4.2% |
| Belgians | 99.9 /100 | #38 | Exceptional 4.2% |
| Immigrants | Northern Europe | 99.8 /100 | #39 | Exceptional 4.2% |