Immigrants from Bangladesh Disability Age 5 to 17
COMPARE
Immigrants from Bangladesh
Select to Compare
Disability Age 5 to 17
Immigrants from Bangladesh Disability Age 5 to 17
5.2%
DISABILITY | AGE 5 TO 17
99.8/ 100
METRIC RATING
63rd/ 347
METRIC RANK
Immigrants from Bangladesh Disability Age 5 to 17 Correlation Chart
The statistical analysis conducted on geographies consisting of 202,959,719 people shows no correlation between the proportion of Immigrants from Bangladesh and percentage of population with a disability between the ages 5 and 17 in the United States with a correlation coefficient (R) of -0.040 and weighted average of 5.2%. On average, for every 1% (one percent) increase in Immigrants from Bangladesh within a typical geography, there is a decrease of 0.032% in percentage of population with a disability between the ages 5 and 17.
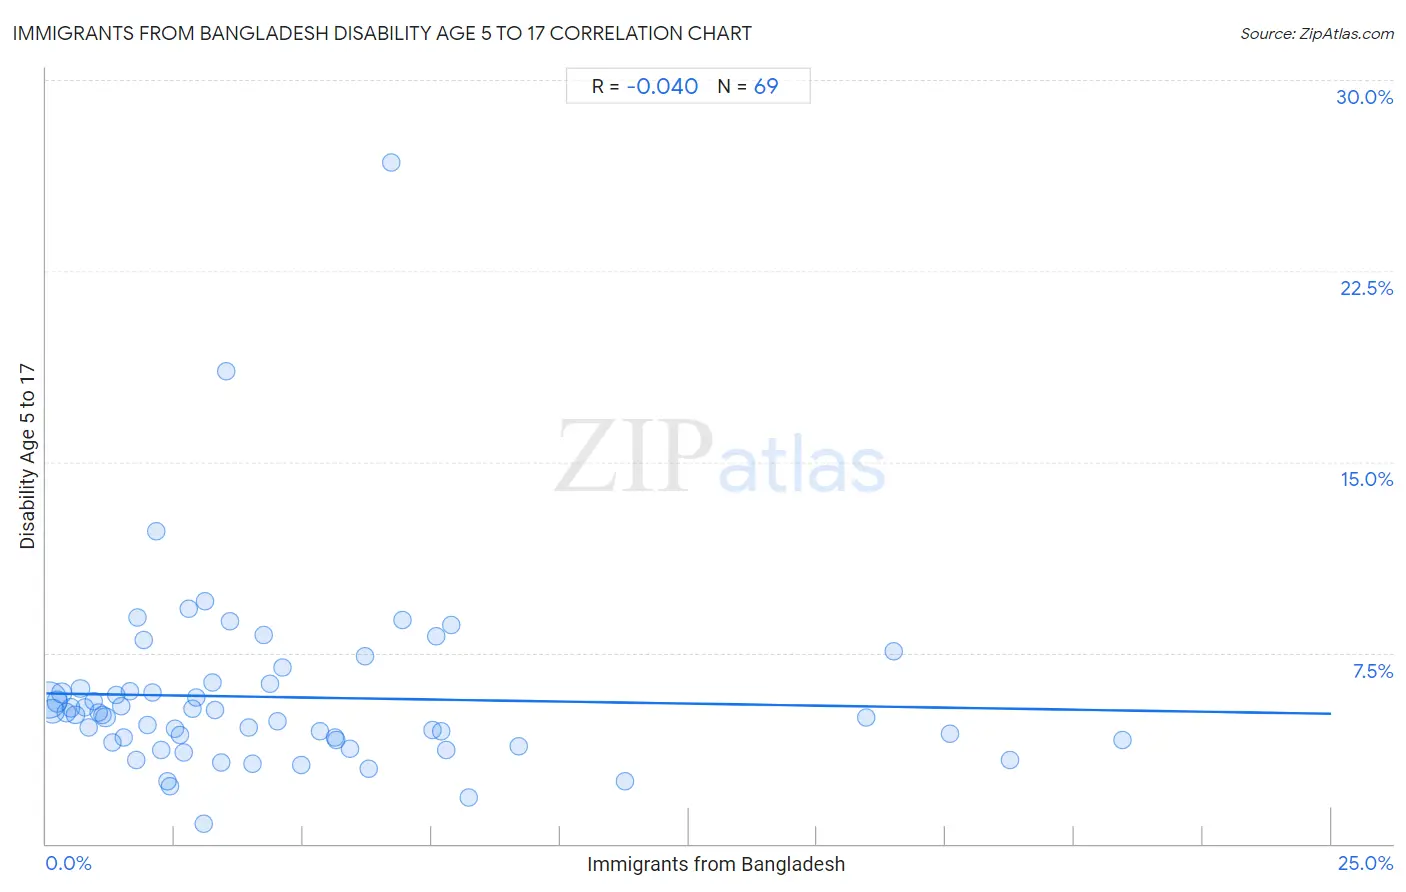
It is essential to understand that the correlation between the percentage of Immigrants from Bangladesh and percentage of population with a disability between the ages 5 and 17 does not imply a direct cause-and-effect relationship. It remains uncertain whether the presence of Immigrants from Bangladesh influences an upward or downward trend in the level of percentage of population with a disability between the ages 5 and 17 within an area, or if Immigrants from Bangladesh simply ended up residing in those areas with higher or lower levels of percentage of population with a disability between the ages 5 and 17 due to other factors.
Demographics Similar to Immigrants from Bangladesh by Disability Age 5 to 17
In terms of disability age 5 to 17, the demographic groups most similar to Immigrants from Bangladesh are Immigrants from South Eastern Asia (5.2%, a difference of 0.030%), Immigrants from Greece (5.2%, a difference of 0.040%), Palestinian (5.2%, a difference of 0.090%), Immigrants from Ireland (5.2%, a difference of 0.11%), and Macedonian (5.2%, a difference of 0.11%).
| Demographics | Rating | Rank | Disability Age 5 to 17 |
| Immigrants from Turkey | 99.9 /100 | #56 | Exceptional 5.1% |
| Immigrants from Poland | 99.9 /100 | #57 | Exceptional 5.1% |
| Immigrants from Ukraine | 99.9 /100 | #58 | Exceptional 5.1% |
| Immigrants from North Macedonia | 99.9 /100 | #59 | Exceptional 5.1% |
| Immigrants from Eastern Europe | 99.9 /100 | #60 | Exceptional 5.1% |
| Immigrants from Switzerland | 99.8 /100 | #61 | Exceptional 5.2% |
| Immigrants from Ireland | 99.8 /100 | #62 | Exceptional 5.2% |
| Immigrants from Bangladesh | 99.8 /100 | #63 | Exceptional 5.2% |
| Immigrants from South Eastern Asia | 99.8 /100 | #64 | Exceptional 5.2% |
| Immigrants from Greece | 99.8 /100 | #65 | Exceptional 5.2% |
| Palestinians | 99.8 /100 | #66 | Exceptional 5.2% |
| Macedonians | 99.8 /100 | #67 | Exceptional 5.2% |
| Immigrants from Syria | 99.7 /100 | #68 | Exceptional 5.2% |
| Guyanese | 99.7 /100 | #69 | Exceptional 5.2% |
| Immigrants from Belgium | 99.7 /100 | #70 | Exceptional 5.2% |
Immigrants from Bangladesh Disability Age 5 to 17 Correlation Summary
| Measurement | Immigrants from Bangladesh Data | Disability Age 5 to 17 Data |
| Minimum | 0.039% | 0.80% |
| Maximum | 20.9% | 26.8% |
| Range | 20.9% | 26.0% |
| Mean | 4.5% | 5.8% |
| Median | 3.1% | 5.1% |
| Interquartile 25% (IQ1) | 1.5% | 4.0% |
| Interquartile 75% (IQ3) | 6.1% | 6.2% |
| Interquartile Range (IQR) | 4.6% | 2.2% |
| Standard Deviation (Sample) | 4.6% | 3.7% |
| Standard Deviation (Population) | 4.5% | 3.6% |
Correlation Details
| Immigrants from Bangladesh Percentile | Sample Size | Disability Age 5 to 17 |
[ 0.0% - 0.5% ] 0.039% | 108,231,388 | 5.7% |
[ 0.0% - 0.5% ] 0.13% | 36,493,954 | 5.2% |
[ 0.0% - 0.5% ] 0.21% | 17,007,674 | 5.6% |
[ 0.0% - 0.5% ] 0.30% | 9,241,997 | 5.9% |
[ 0.0% - 0.5% ] 0.39% | 6,183,438 | 5.1% |
[ 0.0% - 0.5% ] 0.48% | 3,652,756 | 5.3% |
[ 0.5% - 1.0% ] 0.57% | 2,399,132 | 5.1% |
[ 0.5% - 1.0% ] 0.66% | 2,798,196 | 6.1% |
[ 0.5% - 1.0% ] 0.74% | 1,359,188 | 5.3% |
[ 0.5% - 1.0% ] 0.83% | 868,791 | 4.6% |
[ 0.5% - 1.0% ] 0.92% | 764,296 | 5.6% |
[ 1.0% - 1.5% ] 1.02% | 637,060 | 5.2% |
[ 1.0% - 1.5% ] 1.09% | 325,308 | 5.1% |
[ 1.0% - 1.5% ] 1.16% | 8,975,525 | 5.0% |
[ 1.0% - 1.5% ] 1.28% | 285,824 | 4.0% |
[ 1.0% - 1.5% ] 1.37% | 167,118 | 5.9% |
[ 1.0% - 1.5% ] 1.46% | 227,635 | 5.4% |
[ 1.5% - 2.0% ] 1.52% | 115,800 | 4.2% |
[ 1.5% - 2.0% ] 1.63% | 97,379 | 6.0% |
[ 1.5% - 2.0% ] 1.74% | 211,865 | 3.3% |
[ 1.5% - 2.0% ] 1.78% | 379,641 | 8.9% |
[ 1.5% - 2.0% ] 1.89% | 69,610 | 8.0% |
[ 1.5% - 2.0% ] 1.97% | 214,782 | 4.7% |
[ 2.0% - 2.5% ] 2.06% | 77,061 | 5.9% |
[ 2.0% - 2.5% ] 2.13% | 42,368 | 12.3% |
[ 2.0% - 2.5% ] 2.24% | 46,309 | 3.7% |
[ 2.0% - 2.5% ] 2.36% | 59,432 | 2.4% |
[ 2.0% - 2.5% ] 2.41% | 27,698 | 2.3% |
[ 2.5% - 3.0% ] 2.51% | 152,503 | 4.5% |
[ 2.5% - 3.0% ] 2.61% | 22,447 | 4.3% |
[ 2.5% - 3.0% ] 2.68% | 164,756 | 3.6% |
[ 2.5% - 3.0% ] 2.78% | 9,966 | 9.2% |
[ 2.5% - 3.0% ] 2.83% | 2,752 | 5.3% |
[ 2.5% - 3.0% ] 2.93% | 19,733 | 5.8% |
[ 3.0% - 3.5% ] 3.06% | 8,340 | 0.80% |
[ 3.0% - 3.5% ] 3.10% | 46,794 | 9.5% |
[ 3.0% - 3.5% ] 3.24% | 145,098 | 6.3% |
[ 3.0% - 3.5% ] 3.27% | 94,815 | 5.3% |
[ 3.0% - 3.5% ] 3.40% | 90,548 | 3.2% |
[ 3.0% - 3.5% ] 3.50% | 2,230 | 18.6% |
[ 3.5% - 4.0% ] 3.57% | 44,490 | 8.7% |
[ 3.5% - 4.0% ] 3.93% | 23,471 | 4.6% |
[ 4.0% - 4.5% ] 4.00% | 67,001 | 3.1% |
[ 4.0% - 4.5% ] 4.23% | 40,198 | 8.2% |
[ 4.0% - 4.5% ] 4.36% | 65,283 | 6.3% |
[ 4.5% - 5.0% ] 4.51% | 27,848 | 4.8% |
[ 4.5% - 5.0% ] 4.60% | 12,129 | 6.9% |
[ 4.5% - 5.0% ] 4.96% | 126,907 | 3.1% |
[ 5.0% - 5.5% ] 5.32% | 73,318 | 4.4% |
[ 5.5% - 6.0% ] 5.61% | 97,668 | 4.2% |
[ 5.5% - 6.0% ] 5.64% | 127,805 | 4.1% |
[ 5.5% - 6.0% ] 5.90% | 3,490 | 3.7% |
[ 6.0% - 6.5% ] 6.21% | 5,923 | 7.3% |
[ 6.0% - 6.5% ] 6.28% | 26,939 | 3.0% |
[ 6.5% - 7.0% ] 6.70% | 1,164 | 26.8% |
[ 6.5% - 7.0% ] 6.93% | 30,063 | 8.8% |
[ 7.5% - 8.0% ] 7.51% | 28,327 | 4.5% |
[ 7.5% - 8.0% ] 7.60% | 4,146 | 8.1% |
[ 7.5% - 8.0% ] 7.70% | 52,160 | 4.4% |
[ 7.5% - 8.0% ] 7.77% | 29,921 | 3.7% |
[ 7.5% - 8.0% ] 7.88% | 77,230 | 8.6% |
[ 8.0% - 8.5% ] 8.22% | 59,961 | 1.8% |
[ 9.0% - 9.5% ] 9.20% | 31,200 | 3.8% |
[ 11.0% - 11.5% ] 11.26% | 27,794 | 2.5% |
[ 15.5% - 16.0% ] 15.95% | 17,328 | 4.9% |
[ 16.0% - 16.5% ] 16.49% | 1,425 | 7.6% |
[ 17.5% - 18.0% ] 17.59% | 27,842 | 4.3% |
[ 18.5% - 19.0% ] 18.74% | 64,268 | 3.3% |
[ 20.5% - 21.0% ] 20.93% | 43,213 | 4.1% |