Immigrants from Bangladesh vs Immigrants from Venezuela Married-Couple Family Poverty
COMPARE
Immigrants from Bangladesh
Immigrants from Venezuela
Married-Couple Family Poverty
Married-Couple Family Poverty Comparison
Immigrants from Bangladesh
Immigrants from Venezuela
7.5%
MARRIED-COUPLE FAMILY POVERTY
0.0/ 100
METRIC RATING
326th/ 347
METRIC RANK
5.8%
MARRIED-COUPLE FAMILY POVERTY
1.8/ 100
METRIC RATING
246th/ 347
METRIC RANK
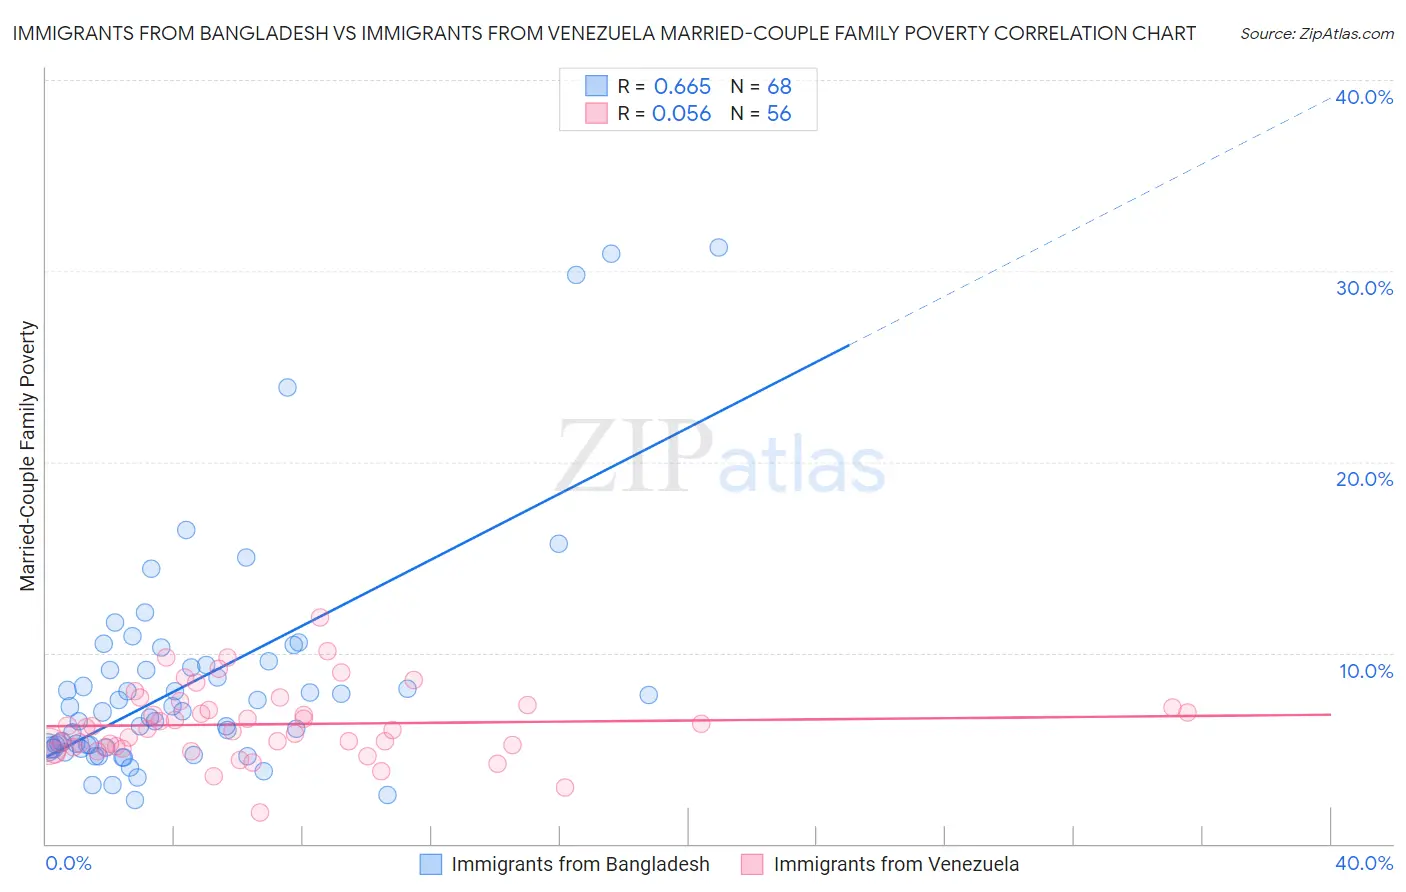
Immigrants from Bangladesh vs Immigrants from Venezuela Married-Couple Family Poverty Correlation Chart
The statistical analysis conducted on geographies consisting of 202,866,788 people shows a significant positive correlation between the proportion of Immigrants from Bangladesh and poverty level among married-couple families in the United States with a correlation coefficient (R) of 0.665 and weighted average of 7.5%. Similarly, the statistical analysis conducted on geographies consisting of 286,630,688 people shows a slight positive correlation between the proportion of Immigrants from Venezuela and poverty level among married-couple families in the United States with a correlation coefficient (R) of 0.056 and weighted average of 5.8%, a difference of 28.4%.
Married-Couple Family Poverty Correlation Summary
| Measurement | Immigrants from Bangladesh | Immigrants from Venezuela |
| Minimum | 2.3% | 1.7% |
| Maximum | 31.2% | 11.8% |
| Range | 29.0% | 10.2% |
| Mean | 8.5% | 6.3% |
| Median | 6.9% | 6.0% |
| Interquartile 25% (IQ1) | 5.0% | 5.1% |
| Interquartile 75% (IQ3) | 9.3% | 7.2% |
| Interquartile Range (IQR) | 4.3% | 2.1% |
| Standard Deviation (Sample) | 6.0% | 1.9% |
| Standard Deviation (Population) | 6.0% | 1.9% |
Similar Demographics by Married-Couple Family Poverty
Demographics Similar to Immigrants from Bangladesh by Married-Couple Family Poverty
In terms of married-couple family poverty, the demographic groups most similar to Immigrants from Bangladesh are Hispanic or Latino (7.5%, a difference of 0.0%), Immigrants from Cuba (7.5%, a difference of 0.20%), Immigrants from Central America (7.4%, a difference of 0.73%), Vietnamese (7.4%, a difference of 0.82%), and Immigrants from Mexico (7.6%, a difference of 1.2%).
| Demographics | Rating | Rank | Married-Couple Family Poverty |
| Immigrants | Latin America | 0.0 /100 | #319 | Tragic 7.2% |
| Immigrants | Grenada | 0.0 /100 | #320 | Tragic 7.3% |
| Immigrants | Caribbean | 0.0 /100 | #321 | Tragic 7.3% |
| Immigrants | Honduras | 0.0 /100 | #322 | Tragic 7.3% |
| Vietnamese | 0.0 /100 | #323 | Tragic 7.4% |
| Immigrants | Central America | 0.0 /100 | #324 | Tragic 7.4% |
| Immigrants | Cuba | 0.0 /100 | #325 | Tragic 7.5% |
| Immigrants | Bangladesh | 0.0 /100 | #326 | Tragic 7.5% |
| Hispanics or Latinos | 0.0 /100 | #327 | Tragic 7.5% |
| Immigrants | Mexico | 0.0 /100 | #328 | Tragic 7.6% |
| Natives/Alaskans | 0.0 /100 | #329 | Tragic 8.2% |
| Paiute | 0.0 /100 | #330 | Tragic 8.3% |
| Central American Indians | 0.0 /100 | #331 | Tragic 8.3% |
| Dominicans | 0.0 /100 | #332 | Tragic 8.3% |
| Lumbee | 0.0 /100 | #333 | Tragic 8.3% |
Demographics Similar to Immigrants from Venezuela by Married-Couple Family Poverty
In terms of married-couple family poverty, the demographic groups most similar to Immigrants from Venezuela are Immigrants from Afghanistan (5.8%, a difference of 0.52%), Iraqi (5.9%, a difference of 0.62%), Chickasaw (5.8%, a difference of 0.66%), Somali (5.8%, a difference of 0.68%), and Immigrants from Western Africa (5.8%, a difference of 0.83%).
| Demographics | Rating | Rank | Married-Couple Family Poverty |
| Venezuelans | 2.7 /100 | #239 | Tragic 5.8% |
| Fijians | 2.5 /100 | #240 | Tragic 5.8% |
| Immigrants | Panama | 2.5 /100 | #241 | Tragic 5.8% |
| Immigrants | Western Africa | 2.4 /100 | #242 | Tragic 5.8% |
| Somalis | 2.3 /100 | #243 | Tragic 5.8% |
| Chickasaw | 2.3 /100 | #244 | Tragic 5.8% |
| Immigrants | Afghanistan | 2.1 /100 | #245 | Tragic 5.8% |
| Immigrants | Venezuela | 1.8 /100 | #246 | Tragic 5.8% |
| Iraqis | 1.4 /100 | #247 | Tragic 5.9% |
| Cree | 1.2 /100 | #248 | Tragic 5.9% |
| Tsimshian | 1.1 /100 | #249 | Tragic 5.9% |
| Immigrants | Eritrea | 1.1 /100 | #250 | Tragic 5.9% |
| Immigrants | Ghana | 1.0 /100 | #251 | Tragic 5.9% |
| Immigrants | Western Asia | 0.7 /100 | #252 | Tragic 6.0% |
| Africans | 0.7 /100 | #253 | Tragic 6.0% |