Immigrants from Bangladesh Disability Age Under 5
COMPARE
Immigrants from Bangladesh
Select to Compare
Disability Age Under 5
Immigrants from Bangladesh Disability Age Under 5
0.85%
DISABILITY | AGE UNDER 5
100.0/ 100
METRIC RATING
5th/ 347
METRIC RANK
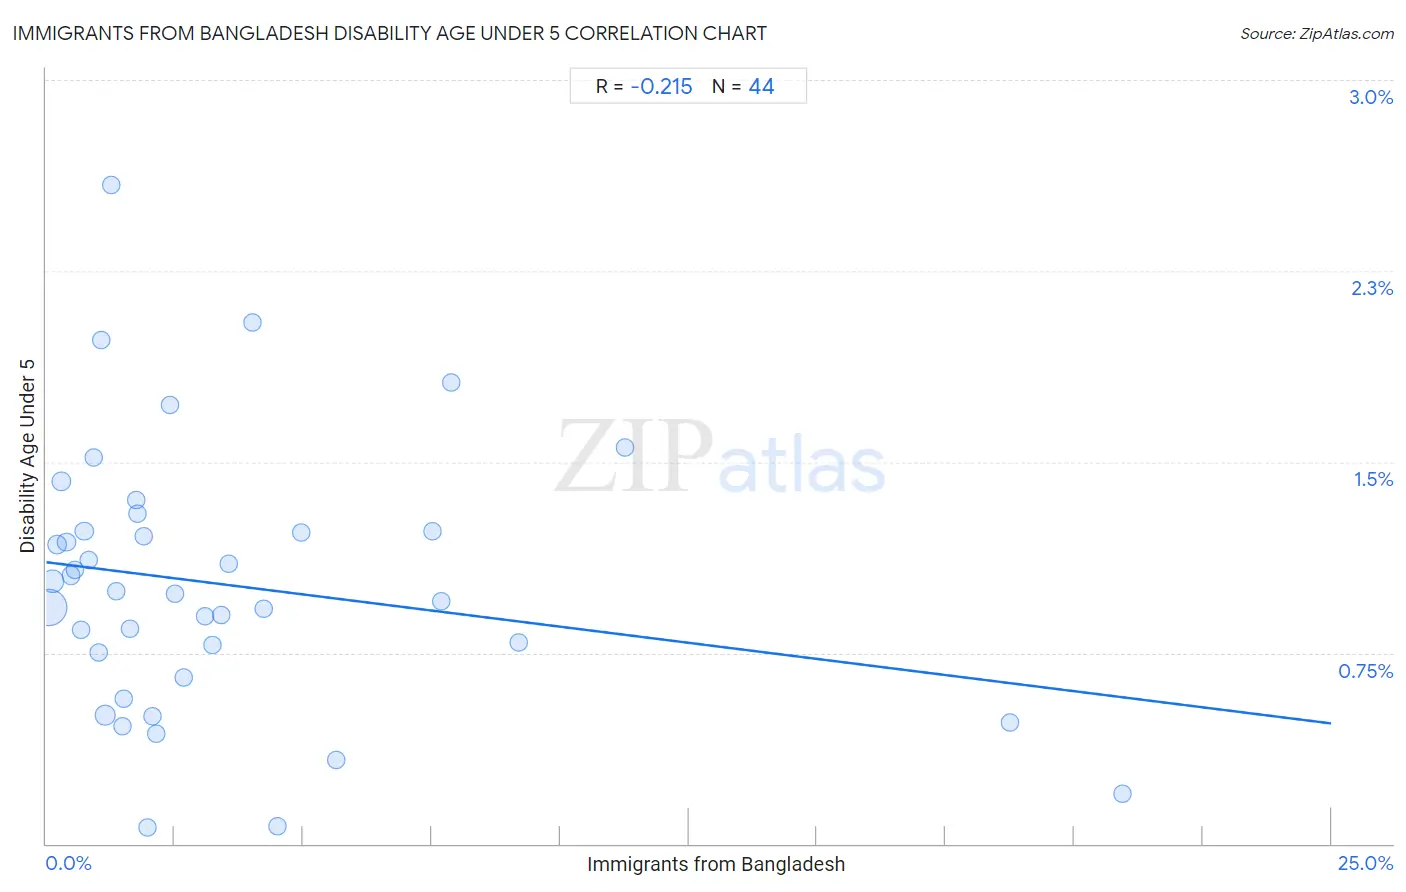
Immigrants from Bangladesh Disability Age Under 5 Correlation Chart
The statistical analysis conducted on geographies consisting of 131,826,697 people shows a weak negative correlation between the proportion of Immigrants from Bangladesh and percentage of population with a disability under the age of 5 in the United States with a correlation coefficient (R) of -0.215 and weighted average of 0.85%. On average, for every 1% (one percent) increase in Immigrants from Bangladesh within a typical geography, there is a decrease of 0.025% in percentage of population with a disability under the age of 5.
It is essential to understand that the correlation between the percentage of Immigrants from Bangladesh and percentage of population with a disability under the age of 5 does not imply a direct cause-and-effect relationship. It remains uncertain whether the presence of Immigrants from Bangladesh influences an upward or downward trend in the level of percentage of population with a disability under the age of 5 within an area, or if Immigrants from Bangladesh simply ended up residing in those areas with higher or lower levels of percentage of population with a disability under the age of 5 due to other factors.
Demographics Similar to Immigrants from Bangladesh by Disability Age Under 5
In terms of disability age under 5, the demographic groups most similar to Immigrants from Bangladesh are Immigrants from Uzbekistan (0.85%, a difference of 0.41%), Ute (0.86%, a difference of 0.93%), Vietnamese (0.81%, a difference of 5.0%), Immigrants from Afghanistan (0.91%, a difference of 6.3%), and Immigrants from Yemen (0.91%, a difference of 6.4%).
| Demographics | Rating | Rank | Disability Age Under 5 |
| Immigrants from Armenia | 100.0 /100 | #1 | Exceptional 0.76% |
| Immigrants from St. Vincent and the Grenadines | 100.0 /100 | #2 | Exceptional 0.79% |
| Vietnamese | 100.0 /100 | #3 | Exceptional 0.81% |
| Immigrants from Uzbekistan | 100.0 /100 | #4 | Exceptional 0.85% |
| Immigrants from Bangladesh | 100.0 /100 | #5 | Exceptional 0.85% |
| Ute | 100.0 /100 | #6 | Exceptional 0.86% |
| Immigrants from Afghanistan | 100.0 /100 | #7 | Exceptional 0.91% |
| Immigrants from Yemen | 100.0 /100 | #8 | Exceptional 0.91% |
| Immigrants from Fiji | 100.0 /100 | #9 | Exceptional 0.92% |
| Marshallese | 100.0 /100 | #10 | Exceptional 0.94% |
| Afghans | 100.0 /100 | #11 | Exceptional 0.94% |
| Immigrants from Grenada | 100.0 /100 | #12 | Exceptional 0.94% |
| Soviet Union | 100.0 /100 | #13 | Exceptional 0.95% |
| Yuman | 100.0 /100 | #14 | Exceptional 0.95% |
| Immigrants from Hong Kong | 100.0 /100 | #15 | Exceptional 0.95% |
Immigrants from Bangladesh Disability Age Under 5 Correlation Summary
| Measurement | Immigrants from Bangladesh Data | Disability Age Under 5 Data |
| Minimum | 0.038% | 0.063% |
| Maximum | 20.9% | 2.6% |
| Range | 20.9% | 2.5% |
| Mean | 3.5% | 1.0% |
| Median | 1.9% | 0.99% |
| Interquartile 25% (IQ1) | 0.97% | 0.70% |
| Interquartile 75% (IQ3) | 4.1% | 1.2% |
| Interquartile Range (IQR) | 3.1% | 0.53% |
| Standard Deviation (Sample) | 4.4% | 0.52% |
| Standard Deviation (Population) | 4.4% | 0.52% |
Correlation Details
| Immigrants from Bangladesh Percentile | Sample Size | Disability Age Under 5 |
[ 0.0% - 0.5% ] 0.038% | 77,858,881 | 0.93% |
[ 0.0% - 0.5% ] 0.13% | 20,877,715 | 1.0% |
[ 0.0% - 0.5% ] 0.21% | 8,566,391 | 1.2% |
[ 0.0% - 0.5% ] 0.30% | 4,528,959 | 1.4% |
[ 0.0% - 0.5% ] 0.39% | 3,328,845 | 1.2% |
[ 0.0% - 0.5% ] 0.49% | 1,745,383 | 1.1% |
[ 0.5% - 1.0% ] 0.57% | 882,804 | 1.1% |
[ 0.5% - 1.0% ] 0.67% | 1,460,473 | 0.84% |
[ 0.5% - 1.0% ] 0.74% | 809,682 | 1.2% |
[ 0.5% - 1.0% ] 0.83% | 322,262 | 1.1% |
[ 0.5% - 1.0% ] 0.92% | 232,922 | 1.5% |
[ 1.0% - 1.5% ] 1.03% | 313,469 | 0.75% |
[ 1.0% - 1.5% ] 1.08% | 145,713 | 2.0% |
[ 1.0% - 1.5% ] 1.15% | 8,740,175 | 0.50% |
[ 1.0% - 1.5% ] 1.27% | 76,591 | 2.6% |
[ 1.0% - 1.5% ] 1.36% | 35,872 | 0.99% |
[ 1.0% - 1.5% ] 1.48% | 42,140 | 0.46% |
[ 1.5% - 2.0% ] 1.50% | 38,756 | 0.57% |
[ 1.5% - 2.0% ] 1.62% | 46,816 | 0.84% |
[ 1.5% - 2.0% ] 1.74% | 88,504 | 1.3% |
[ 1.5% - 2.0% ] 1.78% | 329,710 | 1.3% |
[ 1.5% - 2.0% ] 1.89% | 27,498 | 1.2% |
[ 1.5% - 2.0% ] 1.96% | 98,713 | 0.063% |
[ 2.0% - 2.5% ] 2.07% | 66,751 | 0.50% |
[ 2.0% - 2.5% ] 2.13% | 42,368 | 0.43% |
[ 2.0% - 2.5% ] 2.42% | 19,923 | 1.7% |
[ 2.5% - 3.0% ] 2.52% | 50,868 | 0.98% |
[ 2.5% - 3.0% ] 2.68% | 157,864 | 0.65% |
[ 3.0% - 3.5% ] 3.09% | 42,847 | 0.89% |
[ 3.0% - 3.5% ] 3.24% | 138,588 | 0.78% |
[ 3.0% - 3.5% ] 3.41% | 34,279 | 0.90% |
[ 3.5% - 4.0% ] 3.56% | 22,377 | 1.1% |
[ 4.0% - 4.5% ] 4.00% | 67,001 | 2.0% |
[ 4.0% - 4.5% ] 4.23% | 40,198 | 0.92% |
[ 4.5% - 5.0% ] 4.51% | 27,848 | 0.070% |
[ 4.5% - 5.0% ] 4.96% | 108,180 | 1.2% |
[ 5.5% - 6.0% ] 5.65% | 102,618 | 0.33% |
[ 7.5% - 8.0% ] 7.51% | 24,143 | 1.2% |
[ 7.5% - 8.0% ] 7.70% | 38,865 | 0.95% |
[ 7.5% - 8.0% ] 7.88% | 77,230 | 1.8% |
[ 9.0% - 9.5% ] 9.20% | 31,200 | 0.79% |
[ 11.0% - 11.5% ] 11.26% | 27,794 | 1.6% |
[ 18.5% - 19.0% ] 18.74% | 64,268 | 0.48% |
[ 20.5% - 21.0% ] 20.93% | 43,213 | 0.20% |