Immigrants from Bangladesh Wage/Income Gap
COMPARE
Immigrants from Bangladesh
Select to Compare
Wage/Income Gap
Immigrants from Bangladesh Wage/Income Gap
20.9%
WAGE/INCOME GAP
100.0/ 100
METRIC RATING
30th/ 347
METRIC RANK
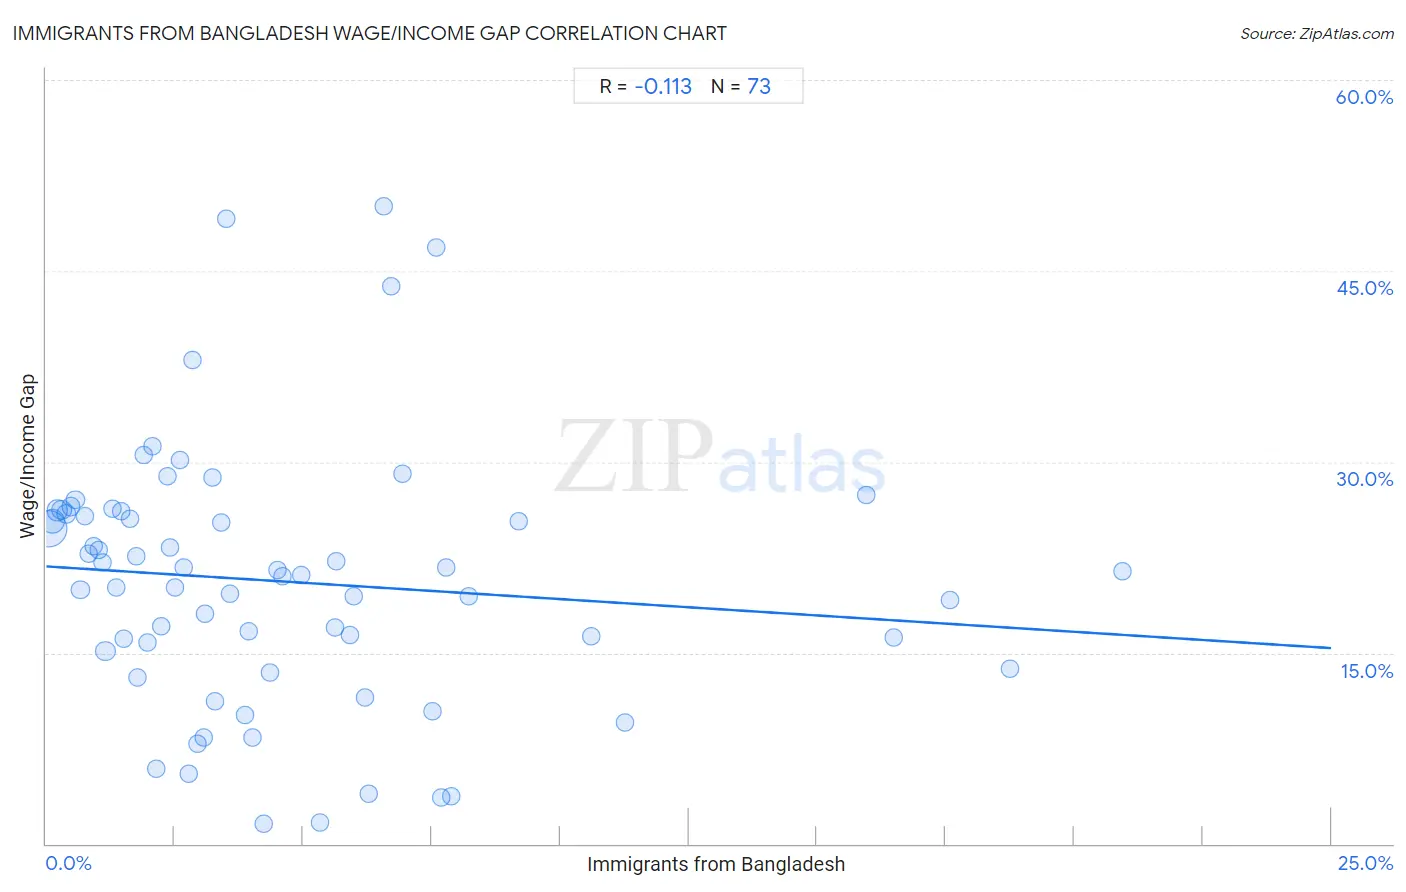
Immigrants from Bangladesh Wage/Income Gap Correlation Chart
The statistical analysis conducted on geographies consisting of 203,640,162 people shows a poor negative correlation between the proportion of Immigrants from Bangladesh and wage/income gap percentage in the United States with a correlation coefficient (R) of -0.113 and weighted average of 20.9%. On average, for every 1% (one percent) increase in Immigrants from Bangladesh within a typical geography, there is a decrease of 0.26% in wage/income gap percentage.
It is essential to understand that the correlation between the percentage of Immigrants from Bangladesh and wage/income gap percentage does not imply a direct cause-and-effect relationship. It remains uncertain whether the presence of Immigrants from Bangladesh influences an upward or downward trend in the level of wage/income gap percentage within an area, or if Immigrants from Bangladesh simply ended up residing in those areas with higher or lower levels of wage/income gap percentage due to other factors.
Demographics Similar to Immigrants from Bangladesh by Wage/Income Gap
In terms of wage/income gap, the demographic groups most similar to Immigrants from Bangladesh are Immigrants from Senegal (20.9%, a difference of 0.21%), Vietnamese (21.0%, a difference of 0.28%), Immigrants from Yemen (21.1%, a difference of 0.51%), Immigrants from Bahamas (21.1%, a difference of 0.53%), and Pima (21.1%, a difference of 0.81%).
| Demographics | Rating | Rank | Wage/Income Gap |
| Immigrants from Dominican Republic | 100.0 /100 | #23 | Exceptional 20.6% |
| Dominicans | 100.0 /100 | #24 | Exceptional 20.6% |
| Senegalese | 100.0 /100 | #25 | Exceptional 20.7% |
| Pueblo | 100.0 /100 | #26 | Exceptional 20.7% |
| Immigrants from Armenia | 100.0 /100 | #27 | Exceptional 20.7% |
| Inupiat | 100.0 /100 | #28 | Exceptional 20.8% |
| Immigrants from Senegal | 100.0 /100 | #29 | Exceptional 20.9% |
| Immigrants from Bangladesh | 100.0 /100 | #30 | Exceptional 20.9% |
| Vietnamese | 100.0 /100 | #31 | Exceptional 21.0% |
| Immigrants from Yemen | 100.0 /100 | #32 | Exceptional 21.1% |
| Immigrants from Bahamas | 100.0 /100 | #33 | Exceptional 21.1% |
| Pima | 100.0 /100 | #34 | Exceptional 21.1% |
| Somalis | 100.0 /100 | #35 | Exceptional 21.2% |
| Belizeans | 100.0 /100 | #36 | Exceptional 21.2% |
| Immigrants from Somalia | 100.0 /100 | #37 | Exceptional 21.2% |
Immigrants from Bangladesh Wage/Income Gap Correlation Summary
| Measurement | Immigrants from Bangladesh Data | Wage/Income Gap Data |
| Minimum | 0.039% | 1.6% |
| Maximum | 20.9% | 50.1% |
| Range | 20.9% | 48.5% |
| Mean | 4.6% | 20.6% |
| Median | 3.2% | 21.1% |
| Interquartile 25% (IQ1) | 1.6% | 14.5% |
| Interquartile 75% (IQ3) | 6.2% | 26.1% |
| Interquartile Range (IQR) | 4.7% | 11.6% |
| Standard Deviation (Sample) | 4.5% | 10.2% |
| Standard Deviation (Population) | 4.5% | 10.1% |
Correlation Details
| Immigrants from Bangladesh Percentile | Sample Size | Wage/Income Gap |
[ 0.0% - 0.5% ] 0.039% | 108,356,206 | 24.8% |
[ 0.0% - 0.5% ] 0.13% | 36,627,830 | 25.3% |
[ 0.0% - 0.5% ] 0.21% | 17,111,458 | 26.2% |
[ 0.0% - 0.5% ] 0.30% | 9,280,207 | 26.2% |
[ 0.0% - 0.5% ] 0.39% | 6,280,407 | 26.0% |
[ 0.0% - 0.5% ] 0.48% | 3,681,776 | 26.5% |
[ 0.5% - 1.0% ] 0.57% | 2,408,902 | 27.0% |
[ 0.5% - 1.0% ] 0.66% | 2,802,956 | 19.9% |
[ 0.5% - 1.0% ] 0.74% | 1,367,985 | 25.7% |
[ 0.5% - 1.0% ] 0.83% | 889,983 | 22.8% |
[ 0.5% - 1.0% ] 0.92% | 798,158 | 23.4% |
[ 1.0% - 1.5% ] 1.02% | 657,713 | 23.0% |
[ 1.0% - 1.5% ] 1.09% | 329,561 | 22.1% |
[ 1.0% - 1.5% ] 1.16% | 8,980,699 | 15.1% |
[ 1.0% - 1.5% ] 1.28% | 285,824 | 26.3% |
[ 1.0% - 1.5% ] 1.37% | 170,889 | 20.1% |
[ 1.0% - 1.5% ] 1.46% | 230,746 | 26.2% |
[ 1.5% - 2.0% ] 1.52% | 118,471 | 16.1% |
[ 1.5% - 2.0% ] 1.63% | 98,687 | 25.5% |
[ 1.5% - 2.0% ] 1.74% | 211,865 | 22.6% |
[ 1.5% - 2.0% ] 1.78% | 376,268 | 13.0% |
[ 1.5% - 2.0% ] 1.89% | 69,610 | 30.5% |
[ 1.5% - 2.0% ] 1.97% | 214,782 | 15.8% |
[ 2.0% - 2.5% ] 2.06% | 78,110 | 31.2% |
[ 2.0% - 2.5% ] 2.13% | 42,368 | 5.9% |
[ 2.0% - 2.5% ] 2.24% | 46,309 | 17.1% |
[ 2.0% - 2.5% ] 2.36% | 60,080 | 28.9% |
[ 2.0% - 2.5% ] 2.41% | 28,884 | 23.3% |
[ 2.5% - 3.0% ] 2.51% | 153,852 | 20.1% |
[ 2.5% - 3.0% ] 2.61% | 31,106 | 30.1% |
[ 2.5% - 3.0% ] 2.68% | 164,756 | 21.7% |
[ 2.5% - 3.0% ] 2.78% | 9,966 | 5.5% |
[ 2.5% - 3.0% ] 2.84% | 5,285 | 38.1% |
[ 2.5% - 3.0% ] 2.94% | 23,797 | 7.9% |
[ 3.0% - 3.5% ] 3.06% | 8,340 | 8.4% |
[ 3.0% - 3.5% ] 3.10% | 46,794 | 18.1% |
[ 3.0% - 3.5% ] 3.24% | 145,098 | 28.8% |
[ 3.0% - 3.5% ] 3.27% | 92,915 | 11.2% |
[ 3.0% - 3.5% ] 3.40% | 90,548 | 25.2% |
[ 3.0% - 3.5% ] 3.50% | 3,688 | 49.1% |
[ 3.5% - 4.0% ] 3.57% | 50,650 | 19.6% |
[ 3.5% - 4.0% ] 3.86% | 2,279 | 10.1% |
[ 3.5% - 4.0% ] 3.93% | 25,606 | 16.7% |
[ 4.0% - 4.5% ] 4.00% | 67,001 | 8.3% |
[ 4.0% - 4.5% ] 4.23% | 40,198 | 1.6% |
[ 4.0% - 4.5% ] 4.36% | 67,847 | 13.4% |
[ 4.5% - 5.0% ] 4.51% | 29,308 | 21.5% |
[ 4.5% - 5.0% ] 4.60% | 12,129 | 21.0% |
[ 4.5% - 5.0% ] 4.96% | 126,907 | 21.1% |
[ 5.0% - 5.5% ] 5.32% | 73,318 | 1.6% |
[ 5.5% - 6.0% ] 5.61% | 97,668 | 17.0% |
[ 5.5% - 6.0% ] 5.64% | 127,805 | 22.2% |
[ 5.5% - 6.0% ] 5.90% | 3,490 | 16.4% |
[ 5.5% - 6.0% ] 5.99% | 317 | 19.5% |
[ 6.0% - 6.5% ] 6.21% | 5,923 | 11.4% |
[ 6.0% - 6.5% ] 6.28% | 26,939 | 4.0% |
[ 6.5% - 7.0% ] 6.56% | 366 | 50.1% |
[ 6.5% - 7.0% ] 6.72% | 1,504 | 43.8% |
[ 6.5% - 7.0% ] 6.93% | 30,063 | 29.0% |
[ 7.5% - 8.0% ] 7.51% | 28,327 | 10.4% |
[ 7.5% - 8.0% ] 7.60% | 4,146 | 46.8% |
[ 7.5% - 8.0% ] 7.70% | 52,160 | 3.7% |
[ 7.5% - 8.0% ] 7.77% | 29,921 | 21.7% |
[ 7.5% - 8.0% ] 7.88% | 77,230 | 3.7% |
[ 8.0% - 8.5% ] 8.22% | 59,961 | 19.4% |
[ 9.0% - 9.5% ] 9.20% | 31,200 | 25.4% |
[ 10.5% - 11.0% ] 10.61% | 3,006 | 16.3% |
[ 11.0% - 11.5% ] 11.26% | 27,794 | 9.6% |
[ 15.5% - 16.0% ] 15.95% | 17,472 | 27.4% |
[ 16.0% - 16.5% ] 16.49% | 1,425 | 16.2% |
[ 17.5% - 18.0% ] 17.59% | 27,842 | 19.1% |
[ 18.5% - 19.0% ] 18.74% | 64,268 | 13.8% |
[ 20.5% - 21.0% ] 20.93% | 43,213 | 21.4% |