Immigrants from Bangladesh Married-couple Households
COMPARE
Immigrants from Bangladesh
Select to Compare
Married-couple Households
Immigrants from Bangladesh Married-couple Households
43.1%
MARRIED-COUPLE HOUSEHOLDS
0.0/ 100
METRIC RATING
275th/ 347
METRIC RANK
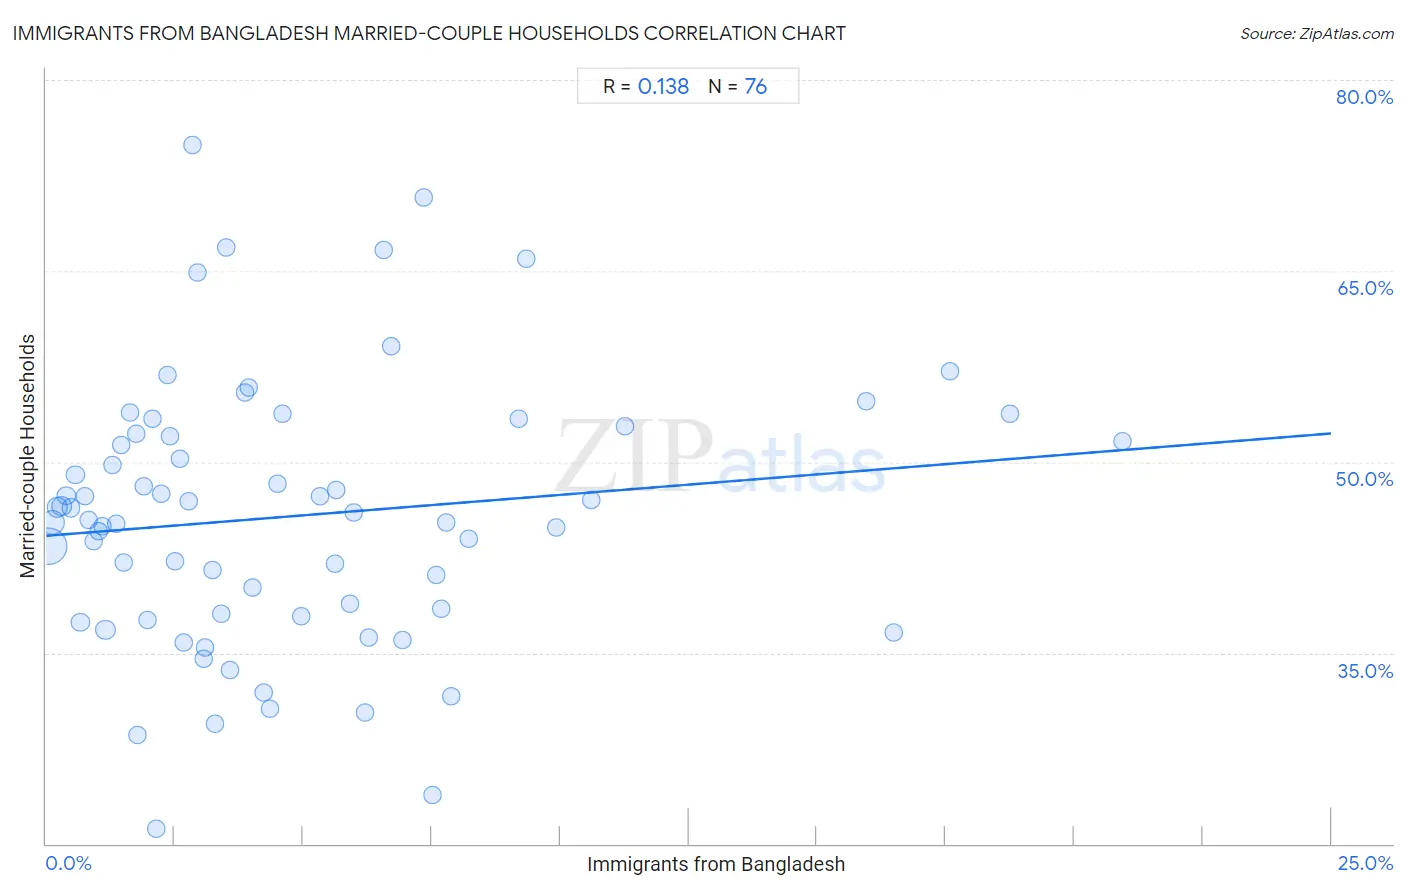
Immigrants from Bangladesh Married-couple Households Correlation Chart
The statistical analysis conducted on geographies consisting of 203,568,346 people shows a poor positive correlation between the proportion of Immigrants from Bangladesh and percentage of married-couple family households in the United States with a correlation coefficient (R) of 0.138 and weighted average of 43.1%. On average, for every 1% (one percent) increase in Immigrants from Bangladesh within a typical geography, there is an increase of 0.32% in percentage of married-couple family households.
It is essential to understand that the correlation between the percentage of Immigrants from Bangladesh and percentage of married-couple family households does not imply a direct cause-and-effect relationship. It remains uncertain whether the presence of Immigrants from Bangladesh influences an upward or downward trend in the level of percentage of married-couple family households within an area, or if Immigrants from Bangladesh simply ended up residing in those areas with higher or lower levels of percentage of married-couple family households due to other factors.
Demographics Similar to Immigrants from Bangladesh by Married-couple Households
In terms of married-couple households, the demographic groups most similar to Immigrants from Bangladesh are Immigrants from Ethiopia (43.1%, a difference of 0.11%), Nigerian (43.2%, a difference of 0.14%), Ethiopian (43.2%, a difference of 0.15%), Immigrants from Nigeria (43.2%, a difference of 0.25%), and Guatemalan (43.3%, a difference of 0.35%).
| Demographics | Rating | Rank | Married-couple Households |
| Immigrants from Burma/Myanmar | 0.1 /100 | #268 | Tragic 43.4% |
| Immigrants from Sierra Leone | 0.1 /100 | #269 | Tragic 43.3% |
| Yuman | 0.1 /100 | #270 | Tragic 43.3% |
| Guatemalans | 0.1 /100 | #271 | Tragic 43.3% |
| Immigrants from Nigeria | 0.1 /100 | #272 | Tragic 43.2% |
| Ethiopians | 0.1 /100 | #273 | Tragic 43.2% |
| Nigerians | 0.1 /100 | #274 | Tragic 43.2% |
| Immigrants from Bangladesh | 0.0 /100 | #275 | Tragic 43.1% |
| Immigrants from Ethiopia | 0.0 /100 | #276 | Tragic 43.1% |
| Immigrants from Eastern Africa | 0.0 /100 | #277 | Tragic 42.9% |
| Immigrants from Africa | 0.0 /100 | #278 | Tragic 42.9% |
| Sierra Leoneans | 0.0 /100 | #279 | Tragic 42.9% |
| Immigrants from Ecuador | 0.0 /100 | #280 | Tragic 42.9% |
| Immigrants from Guatemala | 0.0 /100 | #281 | Tragic 42.8% |
| Bermudans | 0.0 /100 | #282 | Tragic 42.4% |
Immigrants from Bangladesh Married-couple Households Correlation Summary
| Measurement | Immigrants from Bangladesh Data | Married-couple Households Data |
| Minimum | 0.039% | 21.2% |
| Maximum | 20.9% | 74.9% |
| Range | 20.9% | 53.7% |
| Mean | 4.8% | 45.7% |
| Median | 3.3% | 45.7% |
| Interquartile 25% (IQ1) | 1.7% | 38.0% |
| Interquartile 75% (IQ3) | 6.6% | 52.1% |
| Interquartile Range (IQR) | 5.0% | 14.1% |
| Standard Deviation (Sample) | 4.5% | 10.5% |
| Standard Deviation (Population) | 4.5% | 10.4% |
Correlation Details
| Immigrants from Bangladesh Percentile | Sample Size | Married-couple Households |
[ 0.0% - 0.5% ] 0.039% | 108,344,918 | 43.4% |
[ 0.0% - 0.5% ] 0.13% | 36,601,045 | 45.2% |
[ 0.0% - 0.5% ] 0.21% | 17,085,345 | 46.4% |
[ 0.0% - 0.5% ] 0.30% | 9,280,913 | 46.6% |
[ 0.0% - 0.5% ] 0.39% | 6,279,024 | 47.3% |
[ 0.0% - 0.5% ] 0.48% | 3,690,284 | 46.4% |
[ 0.5% - 1.0% ] 0.57% | 2,403,466 | 49.0% |
[ 0.5% - 1.0% ] 0.66% | 2,802,860 | 37.4% |
[ 0.5% - 1.0% ] 0.74% | 1,368,375 | 47.3% |
[ 0.5% - 1.0% ] 0.83% | 888,644 | 45.4% |
[ 0.5% - 1.0% ] 0.92% | 796,175 | 43.8% |
[ 1.0% - 1.5% ] 1.02% | 655,511 | 44.6% |
[ 1.0% - 1.5% ] 1.09% | 329,561 | 44.9% |
[ 1.0% - 1.5% ] 1.16% | 8,978,312 | 36.8% |
[ 1.0% - 1.5% ] 1.28% | 277,069 | 49.7% |
[ 1.0% - 1.5% ] 1.37% | 169,464 | 45.2% |
[ 1.0% - 1.5% ] 1.46% | 230,746 | 51.4% |
[ 1.5% - 2.0% ] 1.52% | 118,471 | 42.1% |
[ 1.5% - 2.0% ] 1.63% | 96,666 | 53.8% |
[ 1.5% - 2.0% ] 1.74% | 211,865 | 52.2% |
[ 1.5% - 2.0% ] 1.78% | 379,641 | 28.5% |
[ 1.5% - 2.0% ] 1.89% | 69,610 | 48.0% |
[ 1.5% - 2.0% ] 1.97% | 214,782 | 37.5% |
[ 2.0% - 2.5% ] 2.06% | 78,110 | 53.4% |
[ 2.0% - 2.5% ] 2.13% | 42,368 | 21.2% |
[ 2.0% - 2.5% ] 2.24% | 46,309 | 47.5% |
[ 2.0% - 2.5% ] 2.36% | 60,080 | 56.8% |
[ 2.0% - 2.5% ] 2.41% | 28,884 | 52.0% |
[ 2.5% - 3.0% ] 2.51% | 153,852 | 42.2% |
[ 2.5% - 3.0% ] 2.61% | 31,106 | 50.3% |
[ 2.5% - 3.0% ] 2.68% | 164,756 | 35.8% |
[ 2.5% - 3.0% ] 2.78% | 9,966 | 46.9% |
[ 2.5% - 3.0% ] 2.84% | 5,285 | 74.9% |
[ 2.5% - 3.0% ] 2.94% | 23,797 | 64.9% |
[ 3.0% - 3.5% ] 3.06% | 9,973 | 34.6% |
[ 3.0% - 3.5% ] 3.10% | 46,794 | 35.4% |
[ 3.0% - 3.5% ] 3.24% | 145,098 | 41.5% |
[ 3.0% - 3.5% ] 3.27% | 94,815 | 29.4% |
[ 3.0% - 3.5% ] 3.40% | 90,548 | 38.1% |
[ 3.0% - 3.5% ] 3.50% | 3,688 | 66.9% |
[ 3.5% - 4.0% ] 3.57% | 50,650 | 33.7% |
[ 3.5% - 4.0% ] 3.86% | 2,279 | 55.5% |
[ 3.5% - 4.0% ] 3.93% | 25,606 | 55.8% |
[ 4.0% - 4.5% ] 4.00% | 67,001 | 40.1% |
[ 4.0% - 4.5% ] 4.23% | 40,198 | 31.9% |
[ 4.0% - 4.5% ] 4.36% | 67,847 | 30.6% |
[ 4.5% - 5.0% ] 4.51% | 29,308 | 48.3% |
[ 4.5% - 5.0% ] 4.60% | 12,129 | 53.8% |
[ 4.5% - 5.0% ] 4.96% | 126,907 | 37.9% |
[ 5.0% - 5.5% ] 5.32% | 73,318 | 47.3% |
[ 5.5% - 6.0% ] 5.61% | 97,668 | 42.0% |
[ 5.5% - 6.0% ] 5.64% | 127,805 | 47.8% |
[ 5.5% - 6.0% ] 5.90% | 3,490 | 38.9% |
[ 5.5% - 6.0% ] 5.99% | 317 | 46.0% |
[ 6.0% - 6.5% ] 6.21% | 5,923 | 30.3% |
[ 6.0% - 6.5% ] 6.28% | 26,939 | 36.2% |
[ 6.5% - 7.0% ] 6.56% | 366 | 66.7% |
[ 6.5% - 7.0% ] 6.72% | 1,504 | 59.1% |
[ 6.5% - 7.0% ] 6.93% | 30,063 | 36.1% |
[ 7.0% - 7.5% ] 7.35% | 1,102 | 70.8% |
[ 7.5% - 8.0% ] 7.51% | 28,327 | 23.8% |
[ 7.5% - 8.0% ] 7.60% | 4,146 | 41.1% |
[ 7.5% - 8.0% ] 7.70% | 52,160 | 38.4% |
[ 7.5% - 8.0% ] 7.77% | 29,921 | 45.3% |
[ 7.5% - 8.0% ] 7.88% | 77,230 | 31.5% |
[ 8.0% - 8.5% ] 8.22% | 59,961 | 44.0% |
[ 9.0% - 9.5% ] 9.20% | 31,200 | 53.4% |
[ 9.0% - 9.5% ] 9.33% | 847 | 65.9% |
[ 9.5% - 10.0% ] 9.91% | 938 | 44.9% |
[ 10.5% - 11.0% ] 10.61% | 3,006 | 47.0% |
[ 11.0% - 11.5% ] 11.26% | 27,794 | 52.8% |
[ 15.5% - 16.0% ] 15.95% | 17,472 | 54.7% |
[ 16.0% - 16.5% ] 16.49% | 1,425 | 36.6% |
[ 17.5% - 18.0% ] 17.59% | 27,842 | 57.1% |
[ 18.5% - 19.0% ] 18.74% | 64,268 | 53.8% |
[ 20.5% - 21.0% ] 20.93% | 43,213 | 51.6% |