Immigrants from Bangladesh 3 or more Vehicles in Household
COMPARE
Immigrants from Bangladesh
Select to Compare
3 or more Vehicles in Household
Immigrants from Bangladesh 3 or more Vehicles in Household
12.5%
3+ VEHICLES AVAILABLE
0.0/ 100
METRIC RATING
337th/ 347
METRIC RANK
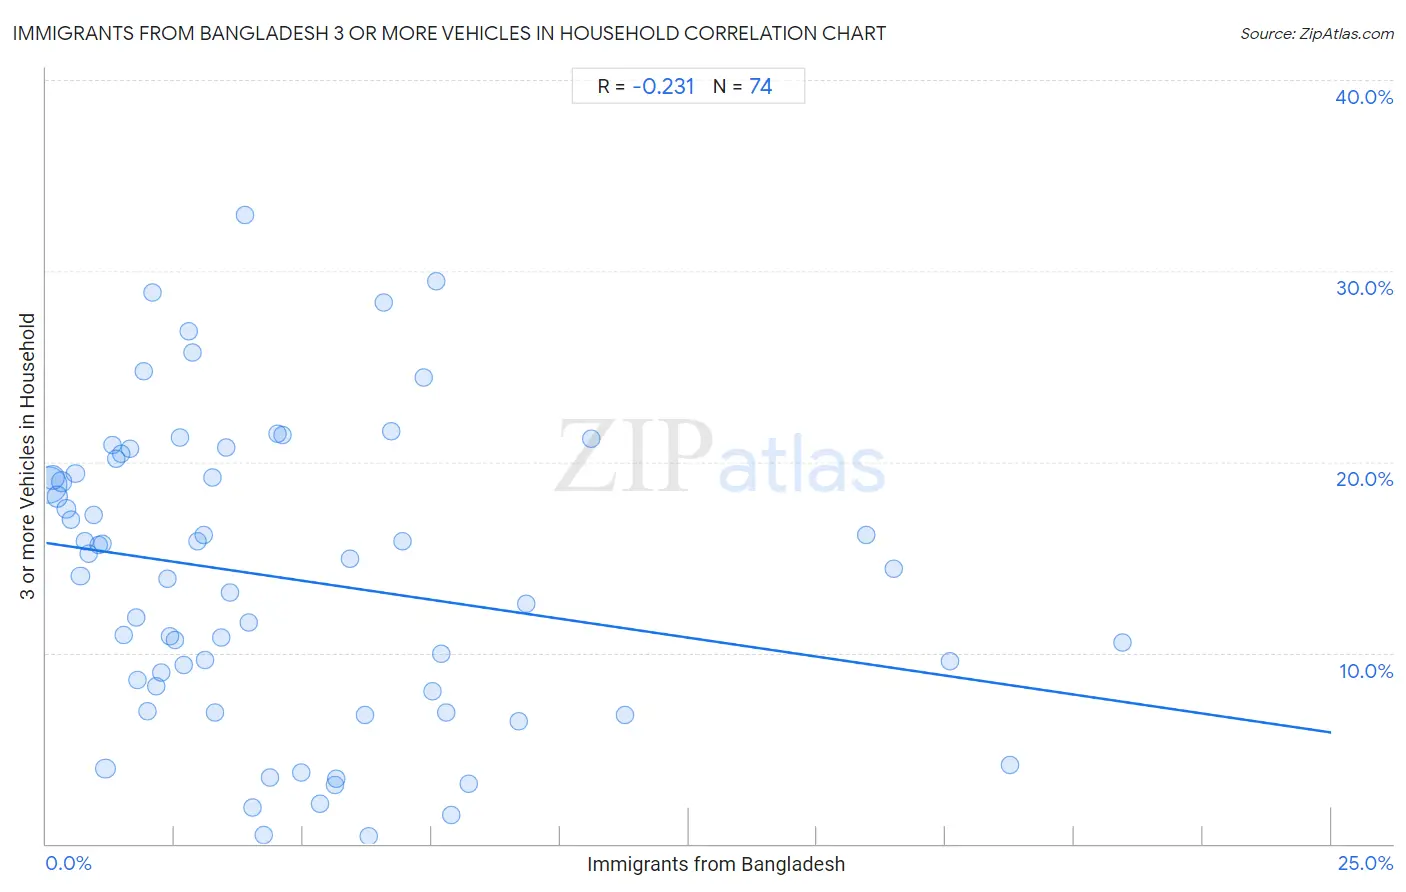
Immigrants from Bangladesh 3 or more Vehicles in Household Correlation Chart
The statistical analysis conducted on geographies consisting of 203,530,312 people shows a weak negative correlation between the proportion of Immigrants from Bangladesh and percentage of households with 3 or more vehicles available in the United States with a correlation coefficient (R) of -0.231 and weighted average of 12.5%. On average, for every 1% (one percent) increase in Immigrants from Bangladesh within a typical geography, there is a decrease of 0.40% in percentage of households with 3 or more vehicles available.
It is essential to understand that the correlation between the percentage of Immigrants from Bangladesh and percentage of households with 3 or more vehicles available does not imply a direct cause-and-effect relationship. It remains uncertain whether the presence of Immigrants from Bangladesh influences an upward or downward trend in the level of percentage of households with 3 or more vehicles available within an area, or if Immigrants from Bangladesh simply ended up residing in those areas with higher or lower levels of percentage of households with 3 or more vehicles available due to other factors.
Demographics Similar to Immigrants from Bangladesh by 3 or more Vehicles in Household
In terms of 3 or more vehicles in household, the demographic groups most similar to Immigrants from Bangladesh are Barbadian (12.6%, a difference of 0.44%), Vietnamese (12.5%, a difference of 0.54%), Immigrants from Uzbekistan (12.0%, a difference of 4.4%), Immigrants from Trinidad and Tobago (13.3%, a difference of 6.6%), and Immigrants from Barbados (11.7%, a difference of 6.8%).
| Demographics | Rating | Rank | 3 or more Vehicles in Household |
| West Indians | 0.0 /100 | #330 | Tragic 13.7% |
| Immigrants from Dominica | 0.0 /100 | #331 | Tragic 13.7% |
| Trinidadians and Tobagonians | 0.0 /100 | #332 | Tragic 13.6% |
| Immigrants from Cabo Verde | 0.0 /100 | #333 | Tragic 13.6% |
| Immigrants from Ecuador | 0.0 /100 | #334 | Tragic 13.4% |
| Immigrants from Trinidad and Tobago | 0.0 /100 | #335 | Tragic 13.3% |
| Barbadians | 0.0 /100 | #336 | Tragic 12.6% |
| Immigrants from Bangladesh | 0.0 /100 | #337 | Tragic 12.5% |
| Vietnamese | 0.0 /100 | #338 | Tragic 12.5% |
| Immigrants from Uzbekistan | 0.0 /100 | #339 | Tragic 12.0% |
| Immigrants from Barbados | 0.0 /100 | #340 | Tragic 11.7% |
| Guyanese | 0.0 /100 | #341 | Tragic 11.5% |
| British West Indians | 0.0 /100 | #342 | Tragic 11.4% |
| Immigrants from Guyana | 0.0 /100 | #343 | Tragic 11.2% |
| Dominicans | 0.0 /100 | #344 | Tragic 11.2% |
Immigrants from Bangladesh 3 or more Vehicles in Household Correlation Summary
| Measurement | Immigrants from Bangladesh Data | 3 or more Vehicles in Household Data |
| Minimum | 0.039% | 0.43% |
| Maximum | 20.9% | 33.0% |
| Range | 20.9% | 32.5% |
| Mean | 4.7% | 13.9% |
| Median | 3.3% | 14.2% |
| Interquartile 25% (IQ1) | 1.6% | 8.0% |
| Interquartile 75% (IQ3) | 6.6% | 19.4% |
| Interquartile Range (IQR) | 4.9% | 11.4% |
| Standard Deviation (Sample) | 4.5% | 7.8% |
| Standard Deviation (Population) | 4.5% | 7.7% |
Correlation Details
| Immigrants from Bangladesh Percentile | Sample Size | 3 or more Vehicles in Household |
[ 0.0% - 0.5% ] 0.039% | 108,344,918 | 18.8% |
[ 0.0% - 0.5% ] 0.13% | 36,586,917 | 19.2% |
[ 0.0% - 0.5% ] 0.21% | 17,100,729 | 18.2% |
[ 0.0% - 0.5% ] 0.30% | 9,259,111 | 19.0% |
[ 0.0% - 0.5% ] 0.39% | 6,279,024 | 17.5% |
[ 0.0% - 0.5% ] 0.48% | 3,687,906 | 17.0% |
[ 0.5% - 1.0% ] 0.57% | 2,403,466 | 19.4% |
[ 0.5% - 1.0% ] 0.66% | 2,802,860 | 14.0% |
[ 0.5% - 1.0% ] 0.74% | 1,362,017 | 15.9% |
[ 0.5% - 1.0% ] 0.83% | 882,455 | 15.2% |
[ 0.5% - 1.0% ] 0.92% | 796,175 | 17.2% |
[ 1.0% - 1.5% ] 1.02% | 655,511 | 15.6% |
[ 1.0% - 1.5% ] 1.09% | 329,561 | 15.7% |
[ 1.0% - 1.5% ] 1.16% | 8,978,312 | 3.9% |
[ 1.0% - 1.5% ] 1.28% | 277,069 | 20.9% |
[ 1.0% - 1.5% ] 1.37% | 169,464 | 20.2% |
[ 1.0% - 1.5% ] 1.46% | 230,746 | 20.4% |
[ 1.5% - 2.0% ] 1.52% | 118,471 | 10.9% |
[ 1.5% - 2.0% ] 1.63% | 95,358 | 20.7% |
[ 1.5% - 2.0% ] 1.74% | 211,865 | 11.9% |
[ 1.5% - 2.0% ] 1.78% | 379,641 | 8.5% |
[ 1.5% - 2.0% ] 1.89% | 69,610 | 24.8% |
[ 1.5% - 2.0% ] 1.97% | 214,782 | 6.9% |
[ 2.0% - 2.5% ] 2.06% | 78,110 | 28.9% |
[ 2.0% - 2.5% ] 2.13% | 42,368 | 8.2% |
[ 2.0% - 2.5% ] 2.24% | 46,309 | 9.0% |
[ 2.0% - 2.5% ] 2.36% | 60,080 | 13.9% |
[ 2.0% - 2.5% ] 2.41% | 28,884 | 10.9% |
[ 2.5% - 3.0% ] 2.51% | 153,852 | 10.7% |
[ 2.5% - 3.0% ] 2.61% | 31,106 | 21.3% |
[ 2.5% - 3.0% ] 2.68% | 164,756 | 9.4% |
[ 2.5% - 3.0% ] 2.78% | 9,966 | 26.8% |
[ 2.5% - 3.0% ] 2.84% | 5,285 | 25.7% |
[ 2.5% - 3.0% ] 2.94% | 23,797 | 15.9% |
[ 3.0% - 3.5% ] 3.06% | 9,973 | 16.2% |
[ 3.0% - 3.5% ] 3.10% | 46,794 | 9.6% |
[ 3.0% - 3.5% ] 3.24% | 145,098 | 19.2% |
[ 3.0% - 3.5% ] 3.27% | 94,815 | 6.9% |
[ 3.0% - 3.5% ] 3.40% | 90,548 | 10.8% |
[ 3.0% - 3.5% ] 3.50% | 3,688 | 20.8% |
[ 3.5% - 4.0% ] 3.57% | 50,650 | 13.2% |
[ 3.5% - 4.0% ] 3.86% | 2,279 | 33.0% |
[ 3.5% - 4.0% ] 3.93% | 25,606 | 11.6% |
[ 4.0% - 4.5% ] 4.00% | 67,001 | 1.9% |
[ 4.0% - 4.5% ] 4.23% | 40,198 | 0.47% |
[ 4.0% - 4.5% ] 4.36% | 67,847 | 3.5% |
[ 4.5% - 5.0% ] 4.51% | 29,308 | 21.5% |
[ 4.5% - 5.0% ] 4.60% | 12,129 | 21.4% |
[ 4.5% - 5.0% ] 4.96% | 126,907 | 3.7% |
[ 5.0% - 5.5% ] 5.32% | 73,318 | 2.1% |
[ 5.5% - 6.0% ] 5.61% | 97,668 | 3.1% |
[ 5.5% - 6.0% ] 5.64% | 127,805 | 3.4% |
[ 5.5% - 6.0% ] 5.90% | 3,490 | 14.9% |
[ 6.0% - 6.5% ] 6.21% | 5,923 | 6.7% |
[ 6.0% - 6.5% ] 6.28% | 26,939 | 0.43% |
[ 6.5% - 7.0% ] 6.56% | 366 | 28.3% |
[ 6.5% - 7.0% ] 6.72% | 1,504 | 21.6% |
[ 6.5% - 7.0% ] 6.93% | 30,063 | 15.8% |
[ 7.0% - 7.5% ] 7.35% | 1,102 | 24.4% |
[ 7.5% - 8.0% ] 7.51% | 28,327 | 8.0% |
[ 7.5% - 8.0% ] 7.60% | 4,146 | 29.4% |
[ 7.5% - 8.0% ] 7.70% | 52,160 | 9.9% |
[ 7.5% - 8.0% ] 7.77% | 29,921 | 6.9% |
[ 7.5% - 8.0% ] 7.88% | 77,230 | 1.5% |
[ 8.0% - 8.5% ] 8.22% | 59,961 | 3.1% |
[ 9.0% - 9.5% ] 9.20% | 31,200 | 6.4% |
[ 9.0% - 9.5% ] 9.33% | 847 | 12.5% |
[ 10.5% - 11.0% ] 10.61% | 3,006 | 21.2% |
[ 11.0% - 11.5% ] 11.26% | 27,794 | 6.7% |
[ 15.5% - 16.0% ] 15.95% | 17,472 | 16.1% |
[ 16.0% - 16.5% ] 16.49% | 1,425 | 14.4% |
[ 17.5% - 18.0% ] 17.59% | 27,842 | 9.6% |
[ 18.5% - 19.0% ] 18.74% | 64,268 | 4.1% |
[ 20.5% - 21.0% ] 20.93% | 43,213 | 10.5% |