Area Code 301 Map & Demographics
Area Code 301 Map
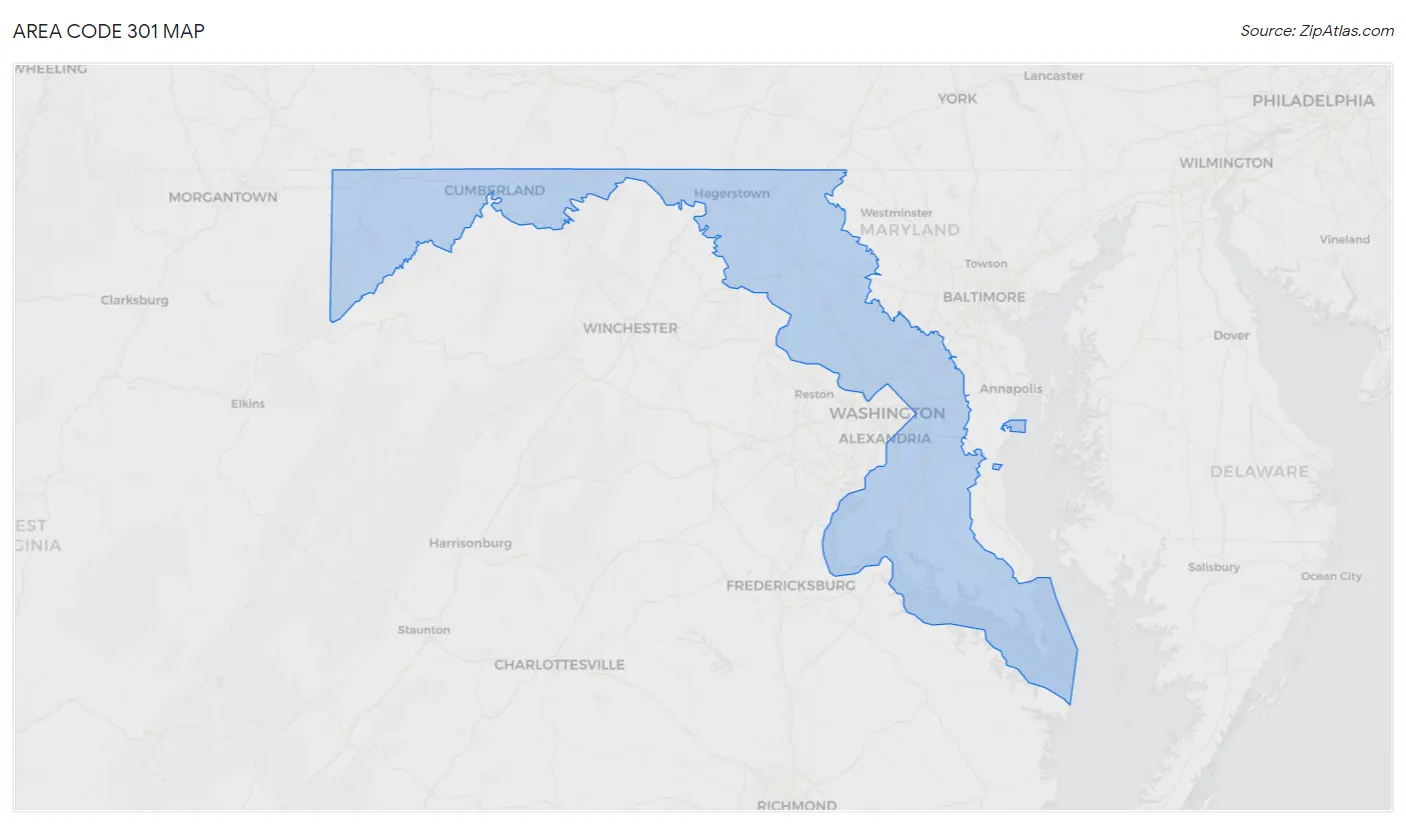
Area Code 301 Overview
$51,892
PER CAPITA INCOME
$130,599
AVG FAMILY INCOME
$113,771
AVG HOUSEHOLD INCOME
25.4%
WAGE / INCOME GAP [ % ]
74.6¢/ $1
WAGE / INCOME GAP [ $ ]
$11,381
FAMILY INCOME DEFICIT
59.99
INEQUALITY / GINI INDEX
2,952,943
TOTAL POPULATION
1,441,505
MALE POPULATION
1,511,438
FEMALE POPULATION
95.37
MALES / 100 FEMALES
104.85
FEMALES / 100 MALES
41.3
MEDIAN AGE
3.2
AVG FAMILY SIZE
2.7
AVG HOUSEHOLD SIZE
1,580,161
LABOR FORCE [ PEOPLE ]
66.8%
PERCENT IN LABOR FORCE
5.6%
UNEMPLOYMENT RATE
Nearby Area Codes
Income in Area Code 301
Income Overview in Area Code 301
Per Capita Income in Area Code 301 is $51,892, while median incomes of families and households are $130,599 and $113,771 respectively.
| Characteristic | Number | Measure |
| Per Capita Income | 2,952,943 | $51,892 |
| Median Family Income | 722,496 | $130,599 |
| Mean Family Income | 722,496 | $23,275,883 |
| Median Household Income | 1,094,871 | $113,771 |
| Mean Household Income | 1,094,871 | $20,681,655 |
| Income Deficit | 722,496 | $11,381 |
| Wage / Income Gap (%) | 2,952,943 | 25.45% |
| Wage / Income Gap ($) | 2,952,943 | 74.55¢ per $1 |
| Gini / Inequality Index | 2,952,943 | 59.99 |
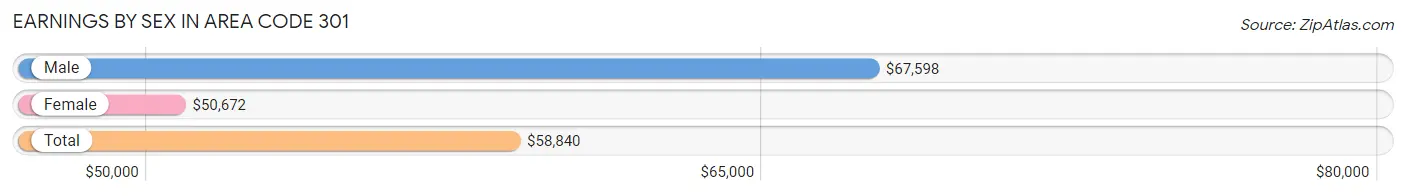
Earnings by Sex in Area Code 301
Average Earnings in Area Code 301 are $58,840, $67,598 for men and $50,672 for women, a difference of 25.0%.
| Sex | Number | Average Earnings |
| Male | 863,653 (51.4%) | $67,598 |
| Female | 817,042 (48.6%) | $50,672 |
| Total | 1,680,695 (100.0%) | $58,840 |
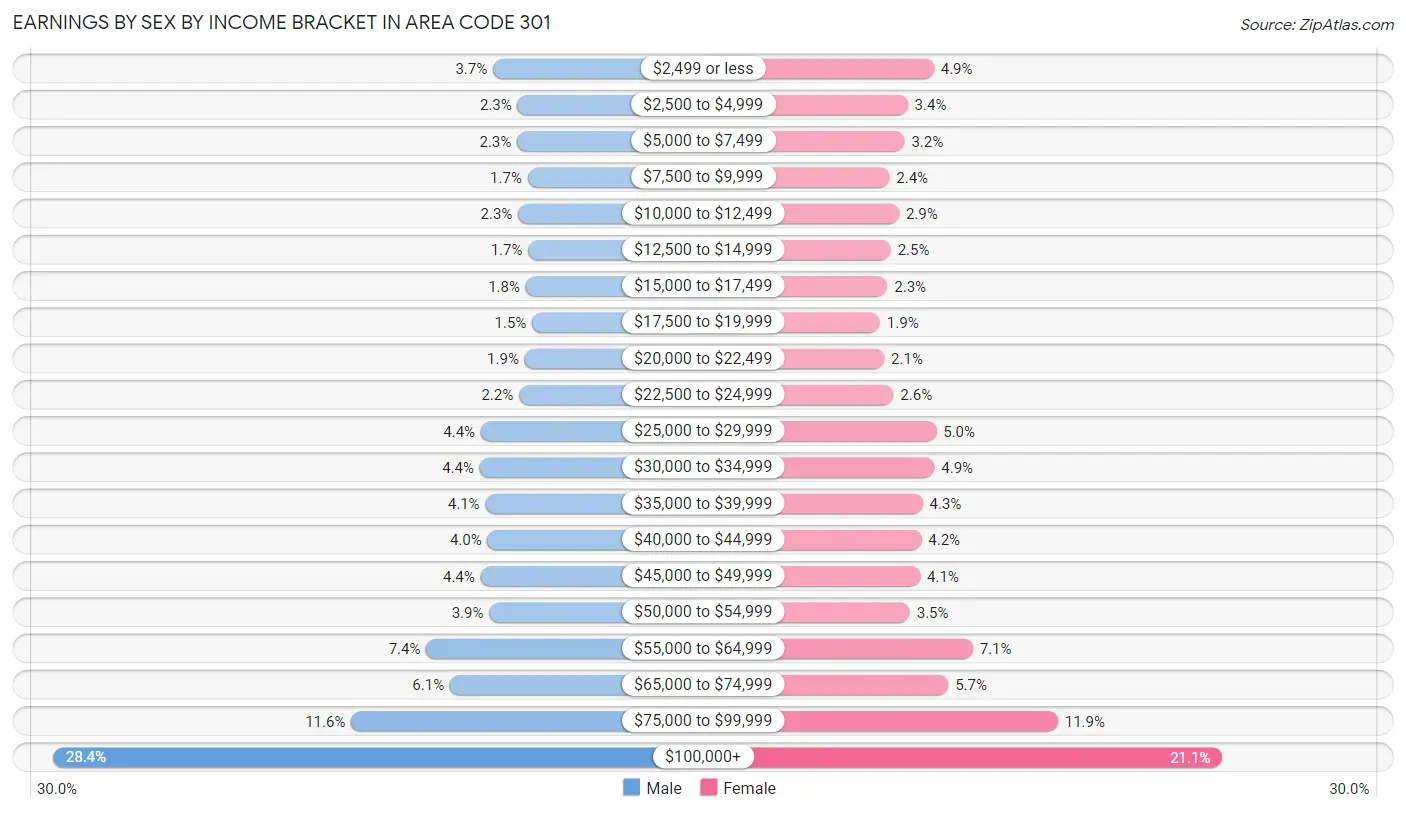
Earnings by Sex by Income Bracket in Area Code 301
The most common earnings brackets in Area Code 301 are $100,000+ for men (245,381 | 28.4%) and $100,000+ for women (172,370 | 21.1%).
| Income | Male | Female |
| $2,499 or less | 31,659 (3.7%) | 39,916 (4.9%) |
| $2,500 to $4,999 | 19,767 (2.3%) | 27,935 (3.4%) |
| $5,000 to $7,499 | 20,001 (2.3%) | 26,498 (3.2%) |
| $7,500 to $9,999 | 14,876 (1.7%) | 19,554 (2.4%) |
| $10,000 to $12,499 | 19,521 (2.3%) | 23,943 (2.9%) |
| $12,500 to $14,999 | 14,584 (1.7%) | 20,215 (2.5%) |
| $15,000 to $17,499 | 15,818 (1.8%) | 18,600 (2.3%) |
| $17,500 to $19,999 | 12,718 (1.5%) | 15,209 (1.9%) |
| $20,000 to $22,499 | 16,315 (1.9%) | 17,133 (2.1%) |
| $22,500 to $24,999 | 19,059 (2.2%) | 21,421 (2.6%) |
| $25,000 to $29,999 | 37,574 (4.3%) | 41,127 (5.0%) |
| $30,000 to $34,999 | 38,127 (4.4%) | 40,159 (4.9%) |
| $35,000 to $39,999 | 35,397 (4.1%) | 34,808 (4.3%) |
| $40,000 to $44,999 | 34,369 (4.0%) | 34,212 (4.2%) |
| $45,000 to $49,999 | 37,724 (4.4%) | 33,681 (4.1%) |
| $50,000 to $54,999 | 33,549 (3.9%) | 28,949 (3.5%) |
| $55,000 to $64,999 | 64,101 (7.4%) | 57,825 (7.1%) |
| $65,000 to $74,999 | 52,599 (6.1%) | 46,564 (5.7%) |
| $75,000 to $99,999 | 100,514 (11.6%) | 96,923 (11.9%) |
| $100,000+ | 245,381 (28.4%) | 172,370 (21.1%) |
| Total | 863,653 (100.0%) | 817,042 (100.0%) |
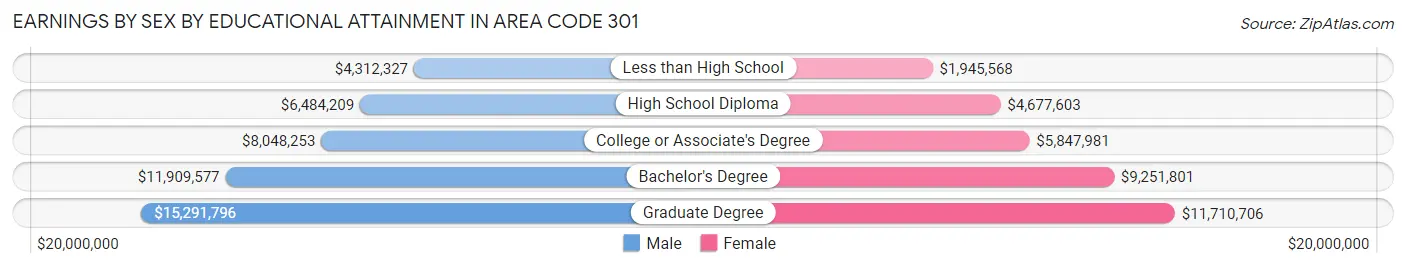
Earnings by Sex by Educational Attainment in Area Code 301
Average earnings in Area Code 301 are $10,997,835 for men and $8,202,364 for women, a difference of 25.4%. Men with an educational attainment of graduate degree enjoy the highest average annual earnings of $15,291,796, while those with less than high school education earn the least with $4,312,327. Women with an educational attainment of graduate degree earn the most with the average annual earnings of $11,710,706, while those with less than high school education have the smallest earnings of $1,945,568.
| Educational Attainment | Male Income | Female Income |
| Less than High School | $4,312,327 | $1,945,568 |
| High School Diploma | $6,484,209 | $4,677,603 |
| College or Associate's Degree | $8,048,253 | $5,847,981 |
| Bachelor's Degree | $11,909,577 | $9,251,801 |
| Graduate Degree | $15,291,796 | $11,710,706 |
| Total | $10,997,835 | $8,202,364 |
Family Income in Area Code 301
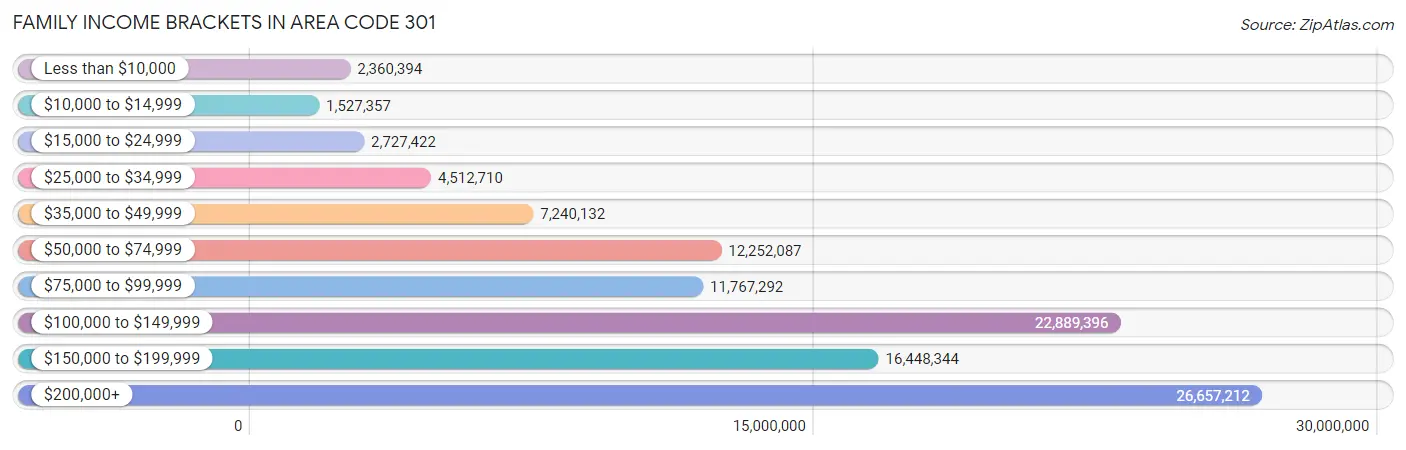
Family Income Brackets in Area Code 301
According to the Area Code 301 family income data, there are 26,657,212 families falling into the $200,000+ income range, which is the most common income bracket and makes up 3,689.6% of all families. Conversely, the $10,000 to $14,999 income bracket is the least frequent group with only 1,527,357 families (211.4%) belonging to this category.
| Income Bracket | # Families | % Families |
| Less than $10,000 | 2,360,394 | 326.7% |
| $10,000 to $14,999 | 1,527,357 | 211.4% |
| $15,000 to $24,999 | 2,727,422 | 377.5% |
| $25,000 to $34,999 | 4,512,710 | 624.6% |
| $35,000 to $49,999 | 7,240,132 | 1,002.1% |
| $50,000 to $74,999 | 12,252,087 | 1,695.8% |
| $75,000 to $99,999 | 11,767,292 | 1,628.7% |
| $100,000 to $149,999 | 22,889,396 | 3,168.1% |
| $150,000 to $199,999 | 16,448,344 | 2,276.6% |
| $200,000+ | 26,657,212 | 3,689.6% |
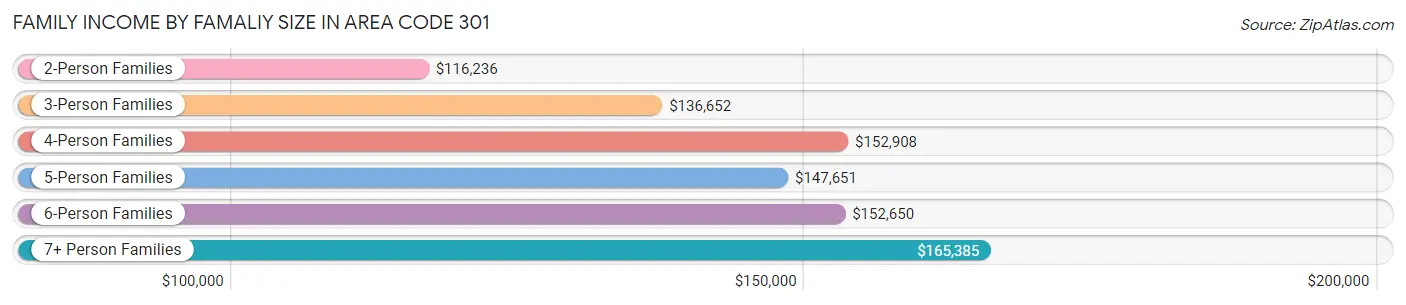
Family Income by Famaliy Size in Area Code 301
7+ person families (15,894 | 2.2%) account for the highest median family income in Area Code 301 with $165,385 per family, while 2-person families (305,098 | 42.2%) have the highest median income of $58,118 per family member.
| Income Bracket | # Families | Median Income |
| 2-Person Families | 305,098 (42.2%) | $116,236 |
| 3-Person Families | 168,109 (23.3%) | $136,652 |
| 4-Person Families | 146,321 (20.3%) | $152,908 |
| 5-Person Families | 62,752 (8.7%) | $147,651 |
| 6-Person Families | 24,322 (3.4%) | $152,650 |
| 7+ Person Families | 15,894 (2.2%) | $165,385 |
| Total | 722,496 (100.0%) | $130,599 |
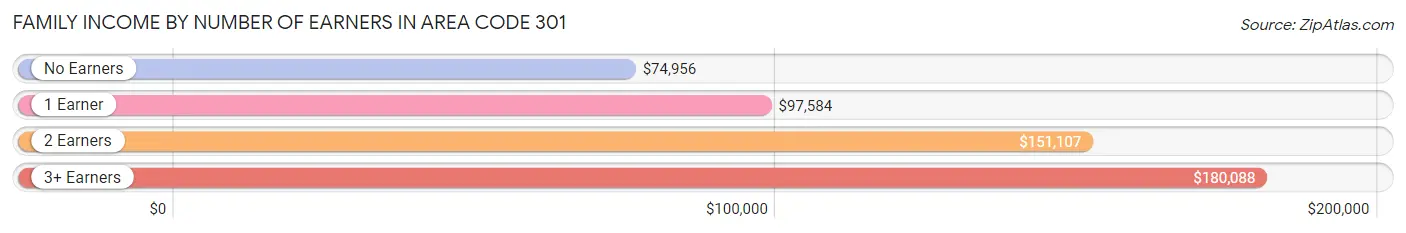
Family Income by Number of Earners in Area Code 301
The median family income in Area Code 301 is $130,599, with families comprising 3+ earners (112,601) having the highest median family income of $180,088, while families with no earners (73,324) have the lowest median family income of $74,956, accounting for 15.6% and 10.2% of families, respectively.
| Number of Earners | # Families | Median Income |
| No Earners | 73,324 (10.2%) | $74,956 |
| 1 Earner | 211,974 (29.3%) | $97,584 |
| 2 Earners | 324,597 (44.9%) | $151,107 |
| 3+ Earners | 112,601 (15.6%) | $180,088 |
| Total | 722,496 (100.0%) | $130,599 |
Household Income in Area Code 301
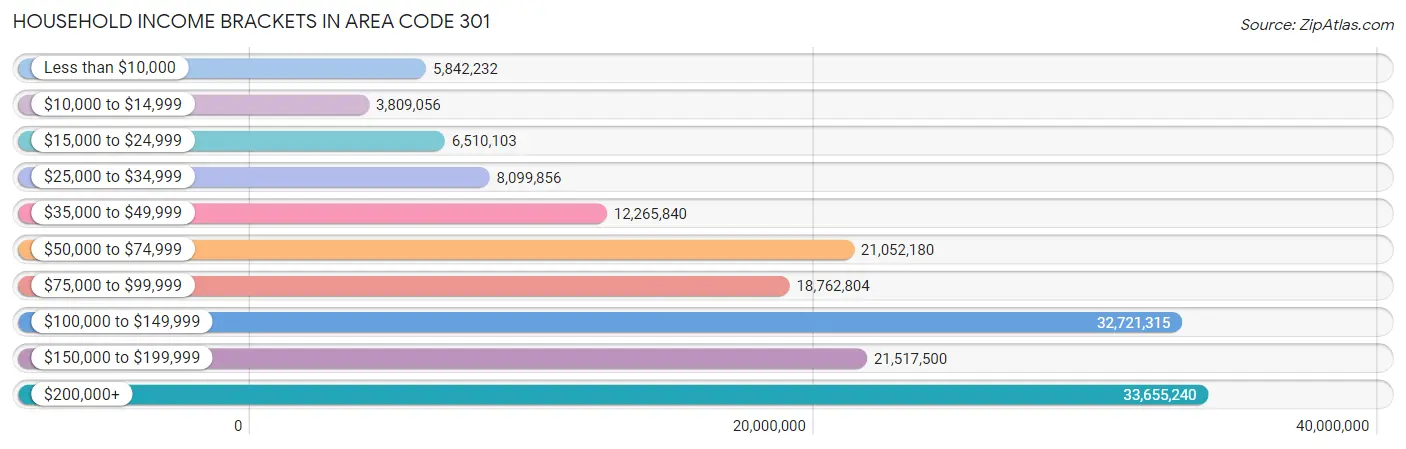
Household Income Brackets in Area Code 301
With 33,655,240 households falling in the category, the $200,000+ income range is the most frequent in Area Code 301, accounting for 3,073.9% of all households. In contrast, only 3,809,056 households (347.9%) fall into the $10,000 to $14,999 income bracket, making it the least populous group.
| Income Bracket | # Households | % Households |
| Less than $10,000 | 5,842,232 | 533.6% |
| $10,000 to $14,999 | 3,809,056 | 347.9% |
| $15,000 to $24,999 | 6,510,103 | 594.6% |
| $25,000 to $34,999 | 8,099,856 | 739.8% |
| $35,000 to $49,999 | 12,265,840 | 1,120.3% |
| $50,000 to $74,999 | 21,052,180 | 1,922.8% |
| $75,000 to $99,999 | 18,762,804 | 1,713.7% |
| $100,000 to $149,999 | 32,721,315 | 2,988.6% |
| $150,000 to $199,999 | 21,517,500 | 1,965.3% |
| $200,000+ | 33,655,240 | 3,073.9% |
Household Income by Householder Age in Area Code 301
The median household income in Area Code 301 is $113,771, with the highest median household income of $134,312 found in the 45 to 64 years age bracket for the primary householder. A total of 437,843 households (40.0%) fall into this category. Meanwhile, the 15 to 24 years age bracket for the primary householder has the lowest median household income of $65,199, with 28,064 households (2.6%) in this group.
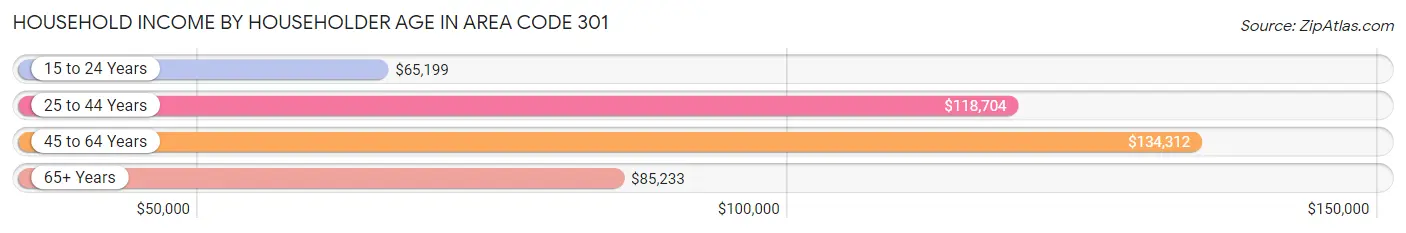
| Income Bracket | # Households | Median Income |
| 15 to 24 Years | 28,064 (2.6%) | $65,199 |
| 25 to 44 Years | 356,897 (32.6%) | $118,704 |
| 45 to 64 Years | 437,843 (40.0%) | $134,312 |
| 65+ Years | 272,067 (24.8%) | $85,233 |
| Total | 1,094,871 (100.0%) | $113,771 |
Poverty in Area Code 301
Income Below Poverty by Sex and Age in Area Code 301
With 7.5% poverty level for males and 9.5% for females among the residents of Area Code 301, 5 year old males and 18 to 24 year old females are the most vulnerable to poverty, with 2,131 males (12.3%) and 18,556 females (15.7%) in their respective age groups living below the poverty level.
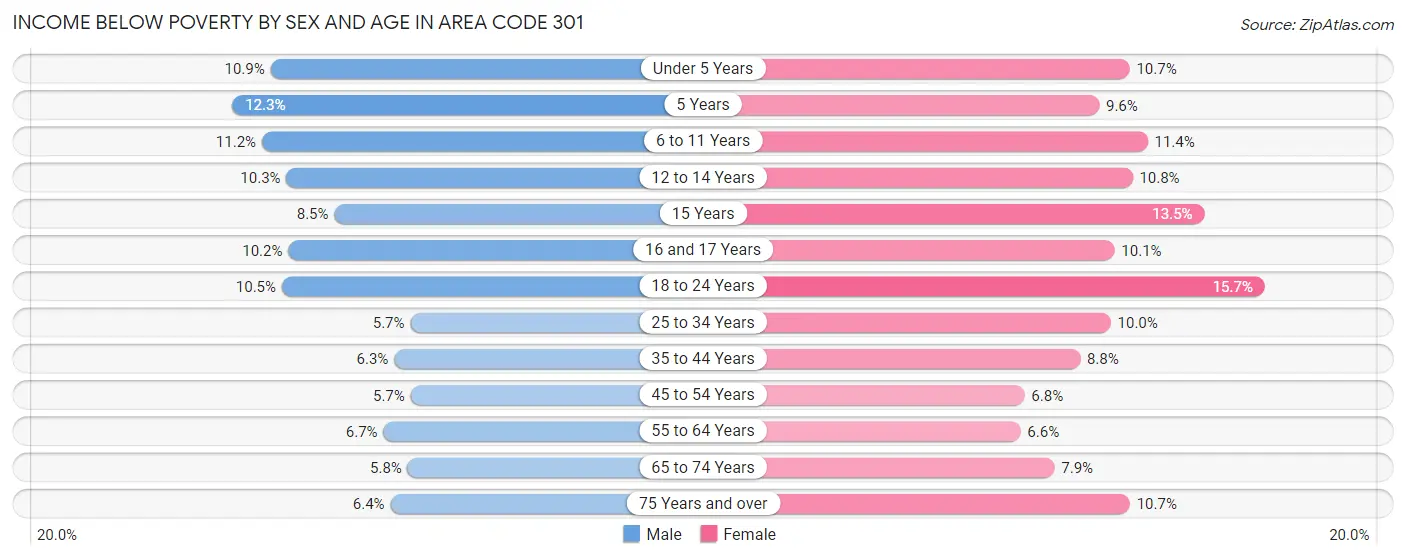
| Age Bracket | Male | Female |
| Under 5 Years | 9,581 (10.9%) | 9,125 (10.7%) |
| 5 Years | 2,131 (12.3%) | 1,634 (9.6%) |
| 6 to 11 Years | 12,456 (11.2%) | 12,098 (11.4%) |
| 12 to 14 Years | 5,790 (10.3%) | 5,866 (10.8%) |
| 15 Years | 1,687 (8.5%) | 2,496 (13.5%) |
| 16 and 17 Years | 3,791 (10.2%) | 3,582 (10.1%) |
| 18 to 24 Years | 12,584 (10.4%) | 18,556 (15.7%) |
| 25 to 34 Years | 11,067 (5.7%) | 19,689 (10.0%) |
| 35 to 44 Years | 12,410 (6.3%) | 17,873 (8.8%) |
| 45 to 54 Years | 10,834 (5.7%) | 13,622 (6.8%) |
| 55 to 64 Years | 12,376 (6.7%) | 13,329 (6.6%) |
| 65 to 74 Years | 6,976 (5.8%) | 11,411 (7.9%) |
| 75 Years and over | 4,613 (6.4%) | 11,588 (10.7%) |
| Total | 106,296 (7.5%) | 140,869 (9.5%) |
Income Above Poverty by Sex and Age in Area Code 301
According to the poverty statistics in Area Code 301, males aged 45 to 54 years and females aged 55 to 64 years are the age groups that are most secure financially, with 94.3% of males and 93.4% of females in these age groups living above the poverty line.
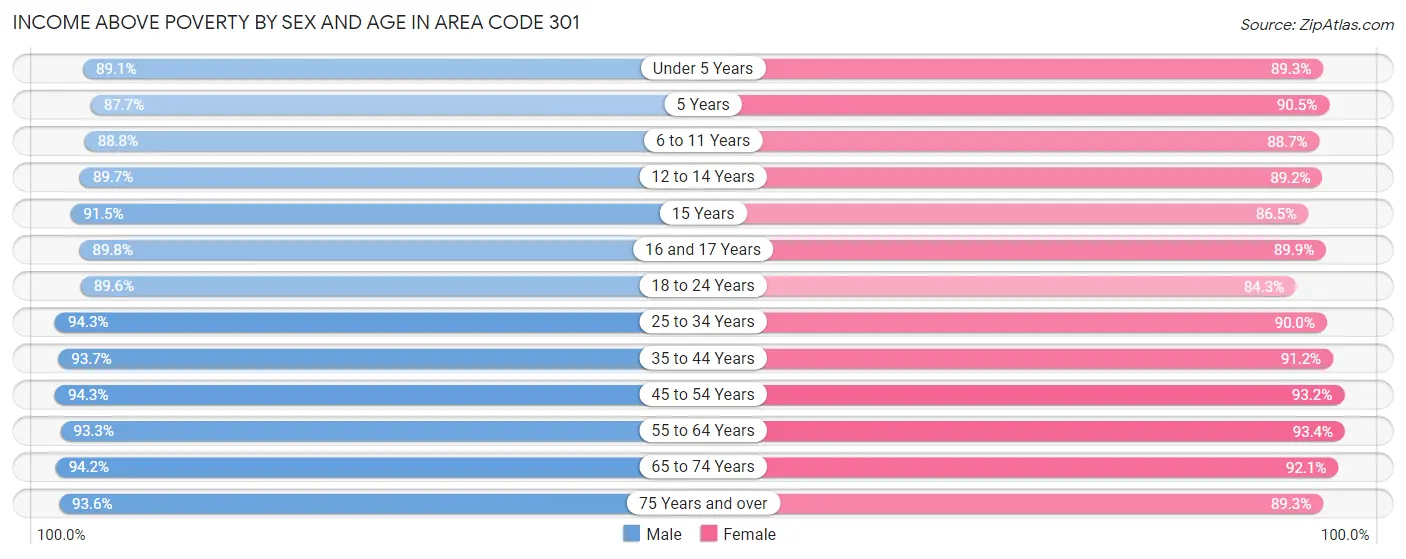
| Age Bracket | Male | Female |
| Under 5 Years | 78,539 (89.1%) | 76,285 (89.3%) |
| 5 Years | 15,202 (87.7%) | 15,477 (90.4%) |
| 6 to 11 Years | 98,836 (88.8%) | 94,535 (88.6%) |
| 12 to 14 Years | 50,548 (89.7%) | 48,480 (89.2%) |
| 15 Years | 18,164 (91.5%) | 16,051 (86.5%) |
| 16 and 17 Years | 33,333 (89.8%) | 31,825 (89.9%) |
| 18 to 24 Years | 107,852 (89.5%) | 99,643 (84.3%) |
| 25 to 34 Years | 183,687 (94.3%) | 177,612 (90.0%) |
| 35 to 44 Years | 185,046 (93.7%) | 184,265 (91.2%) |
| 45 to 54 Years | 180,288 (94.3%) | 187,397 (93.2%) |
| 55 to 64 Years | 172,970 (93.3%) | 187,847 (93.4%) |
| 65 to 74 Years | 113,748 (94.2%) | 133,270 (92.1%) |
| 75 Years and over | 67,193 (93.6%) | 96,765 (89.3%) |
| Total | 1,305,406 (92.5%) | 1,349,452 (90.5%) |
Income Below Poverty Among Married-Couple Families in Area Code 301
The poverty statistics for married-couple families in Area Code 301 show that 3.0% or 15,310 of the total 515,767 families live below the poverty line. Families with 5 or more children have the highest poverty rate of 12.0%, comprising of 358 families. On the other hand, families with no children have the lowest poverty rate of 2.2%, which includes 6,266 families.
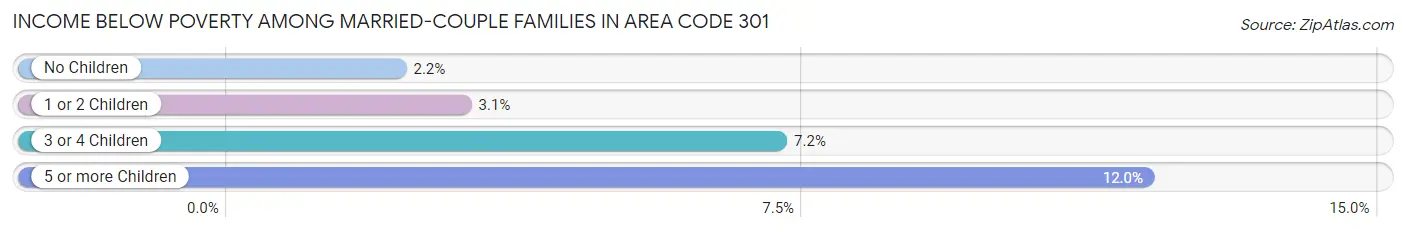
| Children | Above Poverty | Below Poverty |
| No Children | 279,070 (97.8%) | 6,266 (2.2%) |
| 1 or 2 Children | 179,556 (97.0%) | 5,658 (3.0%) |
| 3 or 4 Children | 39,198 (92.8%) | 3,028 (7.2%) |
| 5 or more Children | 2,633 (88.0%) | 358 (12.0%) |
| Total | 500,457 (97.0%) | 15,310 (3.0%) |
Income Below Poverty Among Single-Parent Households in Area Code 301
According to the poverty data in Area Code 301, 7.8% or 4,323 single-father households and 14.4% or 21,830 single-mother households are living below the poverty line. Among single-father households, those with 5 or more children have the highest poverty rate, with 87 households (23.9%) experiencing poverty. Likewise, among single-mother households, those with 5 or more children have the highest poverty rate, with 471 households (45.6%) falling below the poverty line.
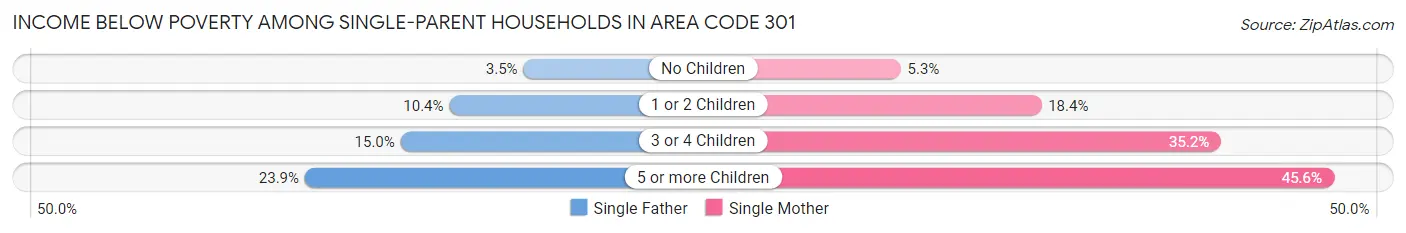
| Children | Single Father | Single Mother |
| No Children | 890 (3.5%) | 3,452 (5.3%) |
| 1 or 2 Children | 2,571 (10.4%) | 13,245 (18.4%) |
| 3 or 4 Children | 775 (15.0%) | 4,662 (35.1%) |
| 5 or more Children | 87 (23.9%) | 471 (45.6%) |
| Total | 4,323 (7.8%) | 21,830 (14.4%) |
Income Below Poverty Among Married-Couple vs Single-Parent Households in Area Code 301
The poverty data for Area Code 301 shows that 15,310 of the married-couple family households (3.0%) and 26,153 of the single-parent households (12.7%) are living below the poverty level. Within the married-couple family households, those with 5 or more children have the highest poverty rate, with 358 households (12.0%) falling below the poverty line. Among the single-parent households, those with 5 or more children have the highest poverty rate, with 558 household (40.0%) living below poverty.
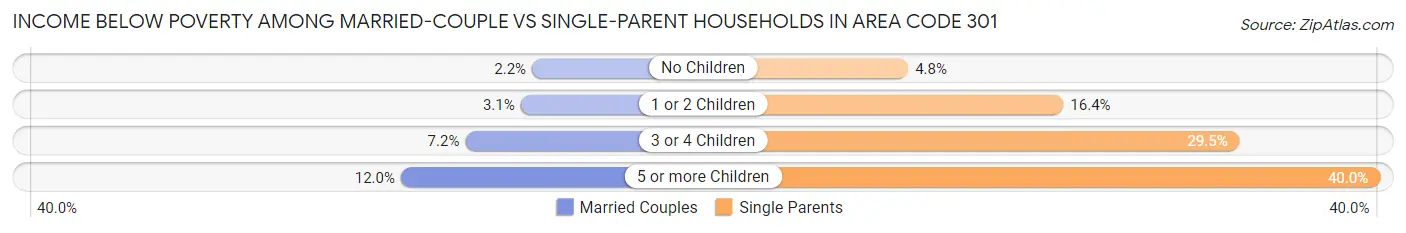
| Children | Married-Couple Families | Single-Parent Households |
| No Children | 6,266 (2.2%) | 4,342 (4.8%) |
| 1 or 2 Children | 5,658 (3.0%) | 15,816 (16.4%) |
| 3 or 4 Children | 3,028 (7.2%) | 5,437 (29.5%) |
| 5 or more Children | 358 (12.0%) | 558 (40.0%) |
| Total | 15,310 (3.0%) | 26,153 (12.7%) |
Race in Area Code 301
The most populous races in Area Code 301 are White / Caucasian (1,250,130 | 42.3%), Black / African American (988,989 | 33.5%), and Hispanic or Latino (465,534 | 15.8%).
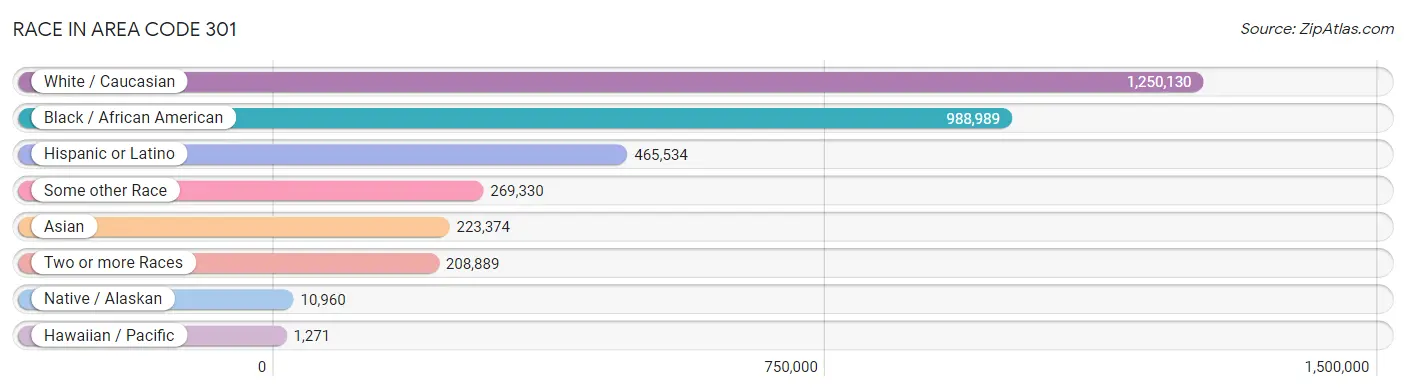
| Race | # Population | % Population |
| Asian | 223,374 | 7.6% |
| Black / African American | 988,989 | 33.5% |
| Hawaiian / Pacific | 1,271 | 0.0% |
| Hispanic or Latino | 465,534 | 15.8% |
| Native / Alaskan | 10,960 | 0.4% |
| White / Caucasian | 1,250,130 | 42.3% |
| Two or more Races | 208,889 | 7.1% |
| Some other Race | 269,330 | 9.1% |
| Total | 2,952,943 | 100.0% |
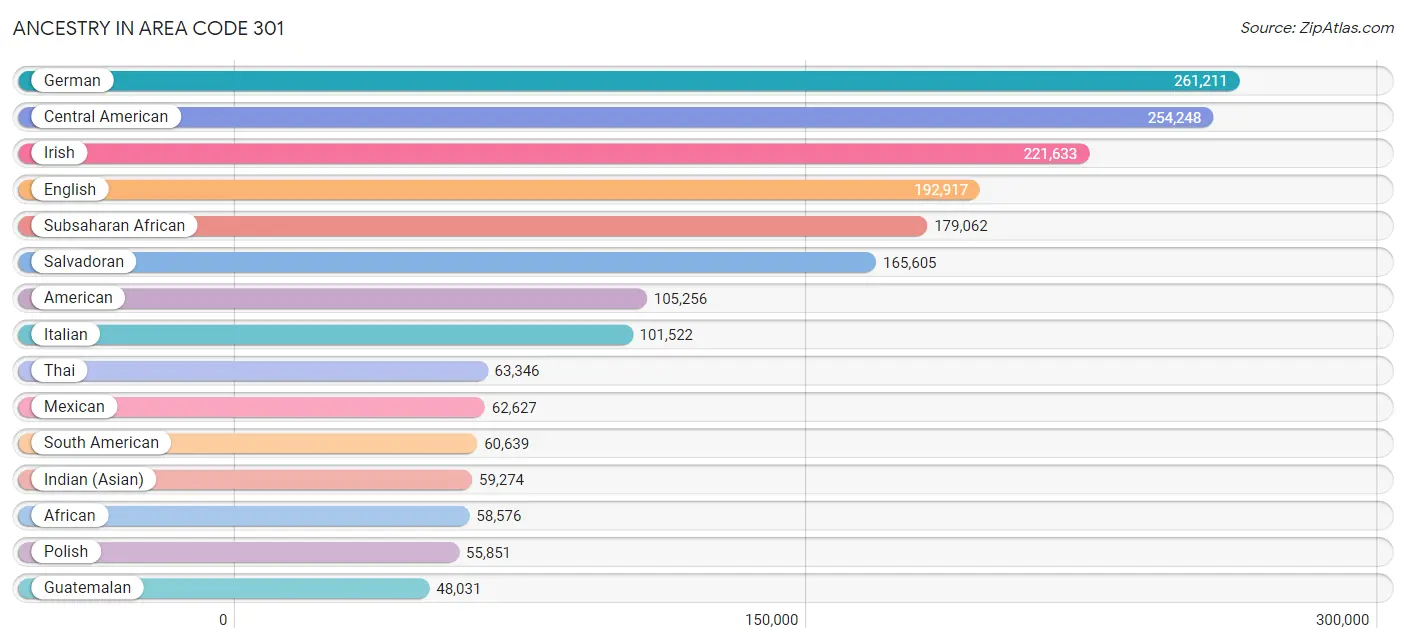
Ancestry in Area Code 301
The most populous ancestries reported in Area Code 301 are German (261,211 | 8.8%), Central American (254,248 | 8.6%), Irish (221,633 | 7.5%), English (192,917 | 6.5%), and Subsaharan African (179,062 | 6.1%), together accounting for 37.6% of all Area Code 301 residents.
| Ancestry | # Population | % Population |
| Afghan | 3,253 | 0.1% |
| African | 58,576 | 2.0% |
| Alaska Native | 39 | 0.0% |
| Albanian | 704 | 0.0% |
| Aleut | 156 | 0.0% |
| Alsatian | 149 | 0.0% |
| American | 105,256 | 3.6% |
| Apache | 517 | 0.0% |
| Arab | 20,041 | 0.7% |
| Arapaho | 39 | 0.0% |
| Argentinean | 4,909 | 0.2% |
| Armenian | 2,398 | 0.1% |
| Assyrian / Chaldean / Syriac | 124 | 0.0% |
| Australian | 962 | 0.0% |
| Austrian | 6,024 | 0.2% |
| Bahamian | 624 | 0.0% |
| Bangladeshi | 127 | 0.0% |
| Barbadian | 1,336 | 0.1% |
| Basque | 277 | 0.0% |
| Belgian | 2,032 | 0.1% |
| Belizean | 413 | 0.0% |
| Bermudan | 463 | 0.0% |
| Bhutanese | 11,348 | 0.4% |
| Blackfeet | 2,291 | 0.1% |
| Bolivian | 8,098 | 0.3% |
| Brazilian | 8,617 | 0.3% |
| British | 16,147 | 0.5% |
| British West Indian | 2,644 | 0.1% |
| Bulgarian | 1,537 | 0.1% |
| Burmese | 29,590 | 1.0% |
| Cajun | 153 | 0.0% |
| Cambodian | 489 | 0.0% |
| Canadian | 2,877 | 0.1% |
| Cape Verdean | 809 | 0.0% |
| Carpatho Rusyn | 204 | 0.0% |
| Celtic | 405 | 0.0% |
| Central American | 254,248 | 8.6% |
| Central American Indian | 5,287 | 0.2% |
| Cherokee | 6,489 | 0.2% |
| Cheyenne | 109 | 0.0% |
| Chickasaw | 41 | 0.0% |
| Chilean | 2,701 | 0.1% |
| Chinese | 39 | 0.0% |
| Chippewa | 232 | 0.0% |
| Choctaw | 333 | 0.0% |
| Colombian | 14,437 | 0.5% |
| Colville | 18 | 0.0% |
| Comanche | 10 | 0.0% |
| Costa Rican | 2,152 | 0.1% |
| Cree | 118 | 0.0% |
| Creek | 271 | 0.0% |
| Croatian | 2,383 | 0.1% |
| Crow | 21 | 0.0% |
| Cuban | 6,649 | 0.2% |
| Cypriot | 213 | 0.0% |
| Czech | 6,394 | 0.2% |
| Czechoslovakian | 1,507 | 0.1% |
| Danish | 4,749 | 0.2% |
| Delaware | 385 | 0.0% |
| Dominican | 18,630 | 0.6% |
| Dutch | 15,500 | 0.5% |
| Dutch West Indian | 17 | 0.0% |
| Eastern European | 18,288 | 0.6% |
| Ecuadorian | 6,120 | 0.2% |
| Egyptian | 3,590 | 0.1% |
| English | 192,917 | 6.5% |
| Estonian | 490 | 0.0% |
| Ethiopian | 31,319 | 1.1% |
| European | 39,910 | 1.3% |
| Filipino | 4,369 | 0.2% |
| Finnish | 2,892 | 0.1% |
| French | 34,585 | 1.2% |
| French American Indian | 112 | 0.0% |
| French Canadian | 6,845 | 0.2% |
| German | 261,211 | 8.8% |
| German Russian | 177 | 0.0% |
| Ghanaian | 11,383 | 0.4% |
| Greek | 11,739 | 0.4% |
| Guamanian / Chamorro | 840 | 0.0% |
| Guatemalan | 48,031 | 1.6% |
| Guyanese | 6,523 | 0.2% |
| Haitian | 10,958 | 0.4% |
| Honduran | 26,083 | 0.9% |
| Hungarian | 9,663 | 0.3% |
| Icelander | 459 | 0.0% |
| Indian (Asian) | 59,274 | 2.0% |
| Indonesian | 2,529 | 0.1% |
| Inupiat | 56 | 0.0% |
| Iranian | 11,225 | 0.4% |
| Iraqi | 593 | 0.0% |
| Irish | 221,633 | 7.5% |
| Iroquois | 545 | 0.0% |
| Israeli | 1,736 | 0.1% |
| Italian | 101,522 | 3.4% |
| Jamaican | 30,943 | 1.1% |
| Japanese | 2,664 | 0.1% |
| Jordanian | 603 | 0.0% |
| Kenyan | 2,403 | 0.1% |
| Kiowa | 8 | 0.0% |
| Korean | 40,081 | 1.4% |
| Laotian | 2,765 | 0.1% |
| Latvian | 1,171 | 0.0% |
| Lebanese | 4,542 | 0.2% |
| Liberian | 3,196 | 0.1% |
| Lithuanian | 5,945 | 0.2% |
| Lumbee | 290 | 0.0% |
| Luxembourger | 183 | 0.0% |
| Macedonian | 230 | 0.0% |
| Malaysian | 937 | 0.0% |
| Maltese | 108 | 0.0% |
| Mexican | 62,627 | 2.1% |
| Mexican American Indian | 2,096 | 0.1% |
| Mongolian | 455 | 0.0% |
| Moroccan | 2,304 | 0.1% |
| Native Hawaiian | 1,420 | 0.1% |
| Navajo | 315 | 0.0% |
| Nepalese | 56 | 0.0% |
| New Zealander | 182 | 0.0% |
| Nicaraguan | 7,950 | 0.3% |
| Nigerian | 34,374 | 1.2% |
| Northern European | 4,193 | 0.1% |
| Norwegian | 13,833 | 0.5% |
| Okinawan | 63 | 0.0% |
| Osage | 223 | 0.0% |
| Paiute | 48 | 0.0% |
| Pakistani | 4,355 | 0.2% |
| Palestinian | 1,549 | 0.1% |
| Panamanian | 4,041 | 0.1% |
| Paraguayan | 885 | 0.0% |
| Pennsylvania German | 1,168 | 0.0% |
| Peruvian | 17,228 | 0.6% |
| Polish | 55,851 | 1.9% |
| Portuguese | 6,984 | 0.2% |
| Potawatomi | 19 | 0.0% |
| Pueblo | 137 | 0.0% |
| Puerto Rican | 30,154 | 1.0% |
| Puget Sound Salish | 23 | 0.0% |
| Romanian | 4,085 | 0.1% |
| Russian | 31,092 | 1.1% |
| Salvadoran | 165,605 | 5.6% |
| Samoan | 529 | 0.0% |
| Scandinavian | 4,412 | 0.2% |
| Scotch-Irish | 17,747 | 0.6% |
| Scottish | 35,890 | 1.2% |
| Seminole | 297 | 0.0% |
| Senegalese | 1,592 | 0.1% |
| Serbian | 1,891 | 0.1% |
| Shoshone | 23 | 0.0% |
| Sierra Leonean | 5,510 | 0.2% |
| Sioux | 495 | 0.0% |
| Slavic | 1,173 | 0.0% |
| Slovak | 4,995 | 0.2% |
| Slovene | 1,558 | 0.1% |
| Somali | 377 | 0.0% |
| South African | 1,563 | 0.1% |
| South American | 60,639 | 2.1% |
| South American Indian | 1,397 | 0.1% |
| Soviet Union | 67 | 0.0% |
| Spaniard | 5,637 | 0.2% |
| Spanish | 4,237 | 0.1% |
| Spanish American | 52 | 0.0% |
| Spanish American Indian | 102 | 0.0% |
| Sri Lankan | 21,246 | 0.7% |
| Subsaharan African | 179,062 | 6.1% |
| Sudanese | 958 | 0.0% |
| Swedish | 13,806 | 0.5% |
| Swiss | 6,183 | 0.2% |
| Syrian | 1,396 | 0.1% |
| Taiwanese | 56 | 0.0% |
| Thai | 63,346 | 2.1% |
| Tlingit-Haida | 2 | 0.0% |
| Tongan | 164 | 0.0% |
| Trinidadian and Tobagonian | 7,253 | 0.3% |
| Turkish | 3,242 | 0.1% |
| U.S. Virgin Islander | 530 | 0.0% |
| Ugandan | 975 | 0.0% |
| Ukrainian | 9,447 | 0.3% |
| Uruguayan | 1,047 | 0.0% |
| Venezuelan | 4,661 | 0.2% |
| Vietnamese | 3,312 | 0.1% |
| Welsh | 13,291 | 0.4% |
| West Indian | 6,353 | 0.2% |
| Yugoslavian | 501 | 0.0% |
| Yuman | 78 | 0.0% |
| Yup'ik | 23 | 0.0% |
| Zimbabwean | 844 | 0.0% | View All 186 Rows |
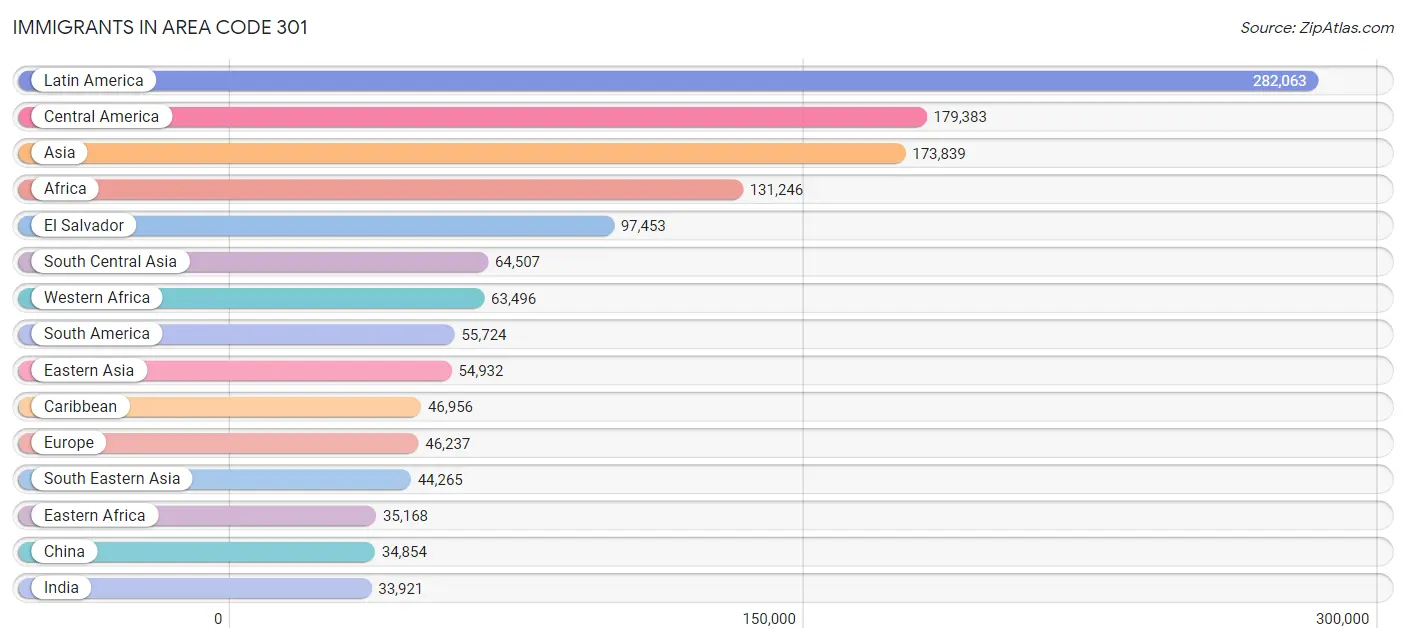
Immigrants in Area Code 301
The most numerous immigrant groups reported in Area Code 301 came from Latin America (282,063 | 9.6%), Central America (179,383 | 6.1%), Asia (173,839 | 5.9%), Africa (131,246 | 4.4%), and El Salvador (97,453 | 3.3%), together accounting for 29.2% of all Area Code 301 residents.
| Immigration Origin | # Population | % Population |
| Afghanistan | 2,834 | 0.1% |
| Africa | 131,246 | 4.4% |
| Albania | 323 | 0.0% |
| Argentina | 2,592 | 0.1% |
| Armenia | 318 | 0.0% |
| Asia | 173,839 | 5.9% |
| Australia | 967 | 0.0% |
| Austria | 273 | 0.0% |
| Azores | 15 | 0.0% |
| Bahamas | 444 | 0.0% |
| Bangladesh | 4,306 | 0.2% |
| Barbados | 983 | 0.0% |
| Belarus | 601 | 0.0% |
| Belgium | 815 | 0.0% |
| Belize | 433 | 0.0% |
| Bolivia | 5,451 | 0.2% |
| Bosnia and Herzegovina | 346 | 0.0% |
| Brazil | 8,698 | 0.3% |
| Bulgaria | 1,036 | 0.0% |
| Cabo Verde | 106 | 0.0% |
| Cambodia | 1,295 | 0.0% |
| Cameroon | 20,133 | 0.7% |
| Canada | 4,770 | 0.2% |
| Caribbean | 46,956 | 1.6% |
| Central America | 179,383 | 6.1% |
| Chile | 1,726 | 0.1% |
| China | 34,854 | 1.2% |
| Colombia | 9,628 | 0.3% |
| Congo | 409 | 0.0% |
| Costa Rica | 1,952 | 0.1% |
| Croatia | 139 | 0.0% |
| Cuba | 1,866 | 0.1% |
| Czechoslovakia | 782 | 0.0% |
| Denmark | 252 | 0.0% |
| Dominica | 240 | 0.0% |
| Dominican Republic | 9,945 | 0.3% |
| Eastern Africa | 35,168 | 1.2% |
| Eastern Asia | 54,932 | 1.9% |
| Eastern Europe | 18,515 | 0.6% |
| Ecuador | 3,904 | 0.1% |
| Egypt | 2,132 | 0.1% |
| El Salvador | 97,453 | 3.3% |
| England | 2,846 | 0.1% |
| Eritrea | 2,202 | 0.1% |
| Ethiopia | 25,630 | 0.9% |
| Europe | 46,237 | 1.6% |
| Fiji | 140 | 0.0% |
| France | 3,428 | 0.1% |
| Germany | 5,975 | 0.2% |
| Ghana | 12,605 | 0.4% |
| Greece | 976 | 0.0% |
| Grenada | 551 | 0.0% |
| Guatemala | 32,954 | 1.1% |
| Guyana | 6,160 | 0.2% |
| Haiti | 5,709 | 0.2% |
| Honduras | 17,536 | 0.6% |
| Hong Kong | 1,922 | 0.1% |
| Hungary | 562 | 0.0% |
| India | 33,921 | 1.1% |
| Indonesia | 1,980 | 0.1% |
| Iran | 8,375 | 0.3% |
| Iraq | 709 | 0.0% |
| Ireland | 745 | 0.0% |
| Israel | 2,067 | 0.1% |
| Italy | 2,737 | 0.1% |
| Jamaica | 18,738 | 0.6% |
| Japan | 3,426 | 0.1% |
| Jordan | 713 | 0.0% |
| Kazakhstan | 277 | 0.0% |
| Kenya | 2,783 | 0.1% |
| Korea | 16,397 | 0.6% |
| Kuwait | 517 | 0.0% |
| Laos | 927 | 0.0% |
| Latin America | 282,063 | 9.6% |
| Latvia | 404 | 0.0% |
| Lebanon | 989 | 0.0% |
| Liberia | 3,696 | 0.1% |
| Lithuania | 130 | 0.0% |
| Malaysia | 750 | 0.0% |
| Mexico | 22,555 | 0.8% |
| Micronesia | 6 | 0.0% |
| Middle Africa | 22,342 | 0.8% |
| Moldova | 546 | 0.0% |
| Morocco | 1,161 | 0.0% |
| Nepal | 3,724 | 0.1% |
| Netherlands | 880 | 0.0% |
| Nicaragua | 4,632 | 0.2% |
| Nigeria | 25,248 | 0.9% |
| North Macedonia | 140 | 0.0% |
| Northern Africa | 4,622 | 0.2% |
| Northern Europe | 9,355 | 0.3% |
| Norway | 363 | 0.0% |
| Oceania | 1,346 | 0.1% |
| Pakistan | 7,929 | 0.3% |
| Panama | 1,649 | 0.1% |
| Peru | 12,622 | 0.4% |
| Philippines | 21,624 | 0.7% |
| Poland | 1,175 | 0.0% |
| Portugal | 953 | 0.0% |
| Romania | 1,467 | 0.1% |
| Russia | 5,469 | 0.2% |
| Saudi Arabia | 455 | 0.0% |
| Scotland | 273 | 0.0% |
| Senegal | 1,783 | 0.1% |
| Serbia | 618 | 0.0% |
| Sierra Leone | 9,172 | 0.3% |
| Singapore | 423 | 0.0% |
| Somalia | 321 | 0.0% |
| South Africa | 2,074 | 0.1% |
| South America | 55,724 | 1.9% |
| South Central Asia | 64,507 | 2.2% |
| South Eastern Asia | 44,265 | 1.5% |
| Southern Europe | 6,280 | 0.2% |
| Spain | 1,569 | 0.1% |
| Sri Lanka | 2,307 | 0.1% |
| St. Vincent and the Grenadines | 265 | 0.0% |
| Sudan | 714 | 0.0% |
| Sweden | 375 | 0.0% |
| Switzerland | 598 | 0.0% |
| Syria | 601 | 0.0% |
| Taiwan | 5,768 | 0.2% |
| Thailand | 2,585 | 0.1% |
| Trinidad and Tobago | 6,561 | 0.2% |
| Turkey | 1,913 | 0.1% |
| Uganda | 996 | 0.0% |
| Ukraine | 3,198 | 0.1% |
| Uruguay | 448 | 0.0% |
| Uzbekistan | 565 | 0.0% |
| Venezuela | 3,578 | 0.1% |
| Vietnam | 12,682 | 0.4% |
| West Indies | 438 | 0.0% |
| Western Africa | 63,496 | 2.1% |
| Western Asia | 9,773 | 0.3% |
| Western Europe | 12,030 | 0.4% |
| Yemen | 202 | 0.0% |
| Zaire | 1,145 | 0.0% |
| Zimbabwe | 824 | 0.0% | View All 137 Rows |
Sex and Age in Area Code 301
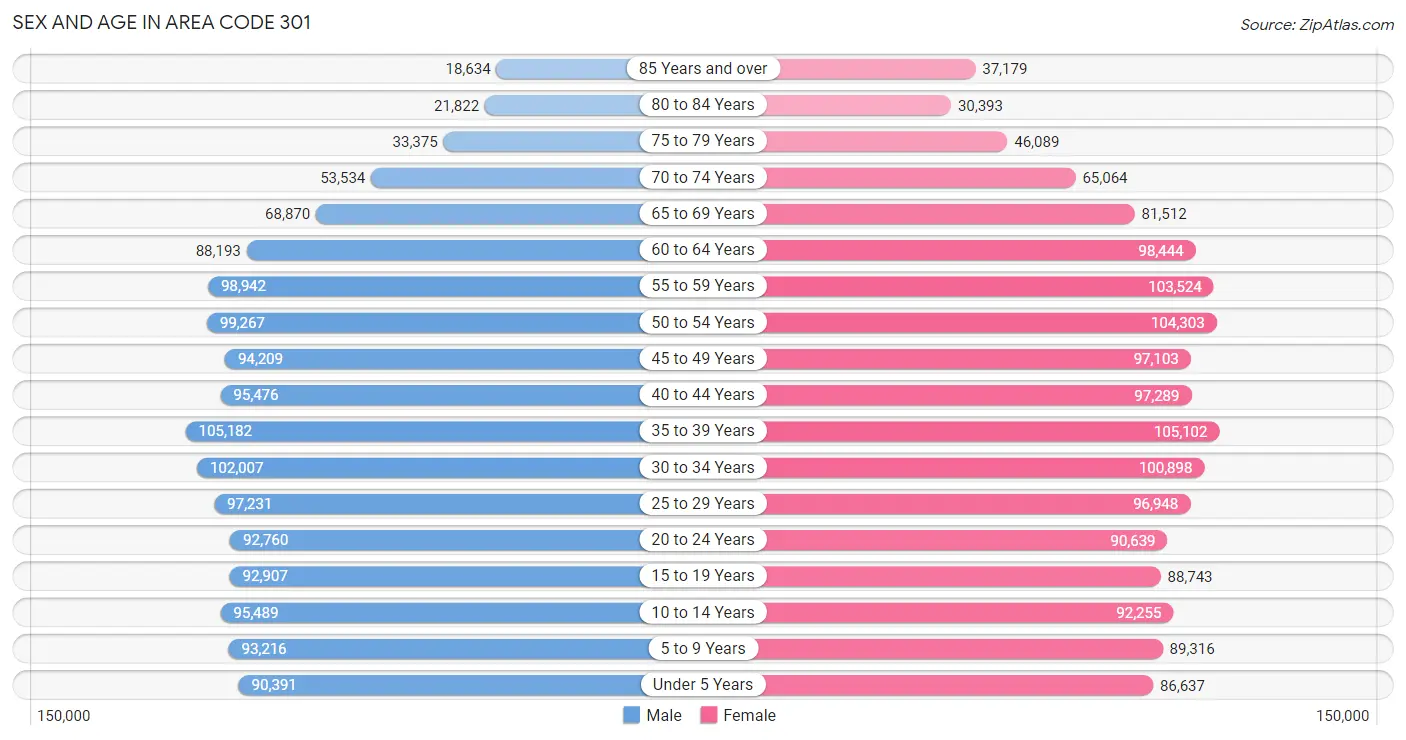
Sex and Age in Area Code 301
The most populous age groups in Area Code 301 are 35 to 39 Years (105,182 | 7.3%) for men and 35 to 39 Years (105,102 | 7.0%) for women.
| Age Bracket | Male | Female |
| Under 5 Years | 90,391 (6.3%) | 86,637 (5.7%) |
| 5 to 9 Years | 93,216 (6.5%) | 89,316 (5.9%) |
| 10 to 14 Years | 95,489 (6.6%) | 92,255 (6.1%) |
| 15 to 19 Years | 92,907 (6.5%) | 88,743 (5.9%) |
| 20 to 24 Years | 92,760 (6.4%) | 90,639 (6.0%) |
| 25 to 29 Years | 97,231 (6.8%) | 96,948 (6.4%) |
| 30 to 34 Years | 102,007 (7.1%) | 100,898 (6.7%) |
| 35 to 39 Years | 105,182 (7.3%) | 105,102 (7.0%) |
| 40 to 44 Years | 95,476 (6.6%) | 97,289 (6.4%) |
| 45 to 49 Years | 94,209 (6.5%) | 97,103 (6.4%) |
| 50 to 54 Years | 99,267 (6.9%) | 104,303 (6.9%) |
| 55 to 59 Years | 98,942 (6.9%) | 103,524 (6.9%) |
| 60 to 64 Years | 88,193 (6.1%) | 98,444 (6.5%) |
| 65 to 69 Years | 68,870 (4.8%) | 81,512 (5.4%) |
| 70 to 74 Years | 53,534 (3.7%) | 65,064 (4.3%) |
| 75 to 79 Years | 33,375 (2.3%) | 46,089 (3.0%) |
| 80 to 84 Years | 21,822 (1.5%) | 30,393 (2.0%) |
| 85 Years and over | 18,634 (1.3%) | 37,179 (2.5%) |
| Total | 1,441,505 (100.0%) | 1,511,438 (100.0%) |
Families and Households in Area Code 301
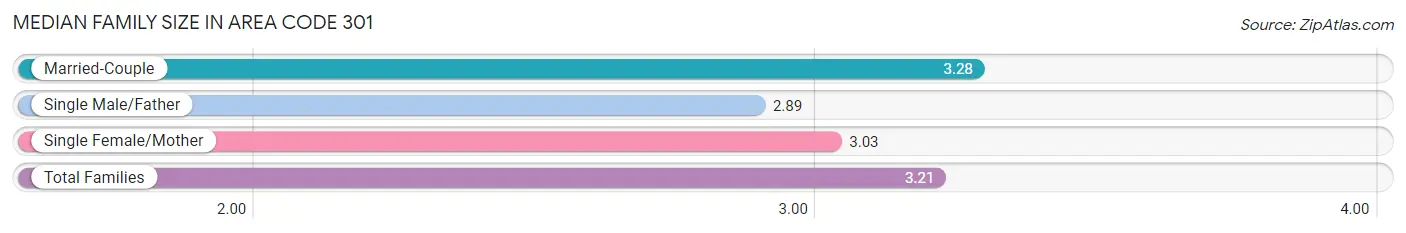
Median Family Size in Area Code 301
The median family size in Area Code 301 is 3.21 persons per family, with married-couple families (515,767 | 71.4%) accounting for the largest median family size of 3.28255 persons per family. On the other hand, single male/father families (55,298 | 7.6%) represent the smallest median family size with 2.89 persons per family.
| Family Type | # Families | Family Size |
| Married-Couple | 515,767 (71.4%) | 3.28 |
| Single Male/Father | 55,298 (7.6%) | 2.89 |
| Single Female/Mother | 151,431 (21.0%) | 3.03 |
| Total Families | 722,496 (100.0%) | 3.21 |
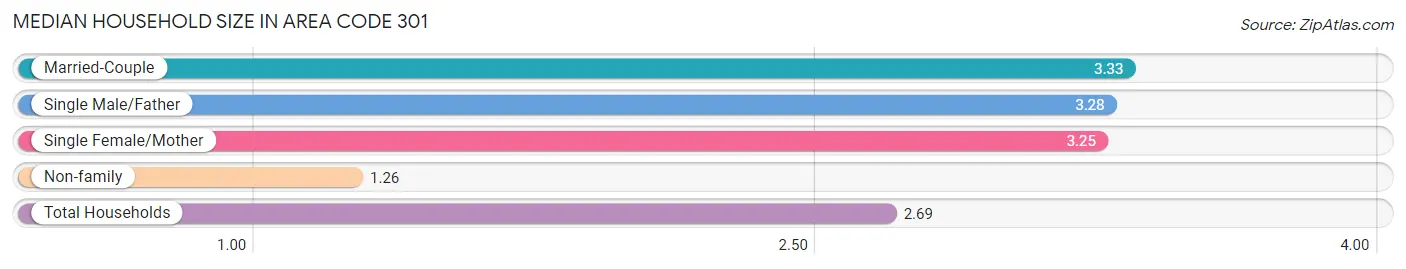
Median Household Size in Area Code 301
The median household size in Area Code 301 is 2.69 persons per household, with married-couple households (515,767 | 47.1%) accounting for the largest median household size of 3.3263 persons per household. non-family households (372,375 | 34.0%) represent the smallest median household size with 1.26 persons per household.
| Household Type | # Households | Household Size |
| Married-Couple | 515,767 (47.1%) | 3.33 |
| Single Male/Father | 55,298 (5.1%) | 3.28 |
| Single Female/Mother | 151,431 (13.8%) | 3.25 |
| Non-family | 372,375 (34.0%) | 1.26 |
| Total Households | 1,094,871 (100.0%) | 2.69 |
Household Size by Marriage Status in Area Code 301
Out of a total of 1,094,871 households in Area Code 301, 722,496 (66.0%) are family households, while 372,375 (34.0%) are nonfamily households. The most numerous type of family households are 2-person households, comprising 283,437, and the most common type of nonfamily households are 1-person households, comprising 304,299.
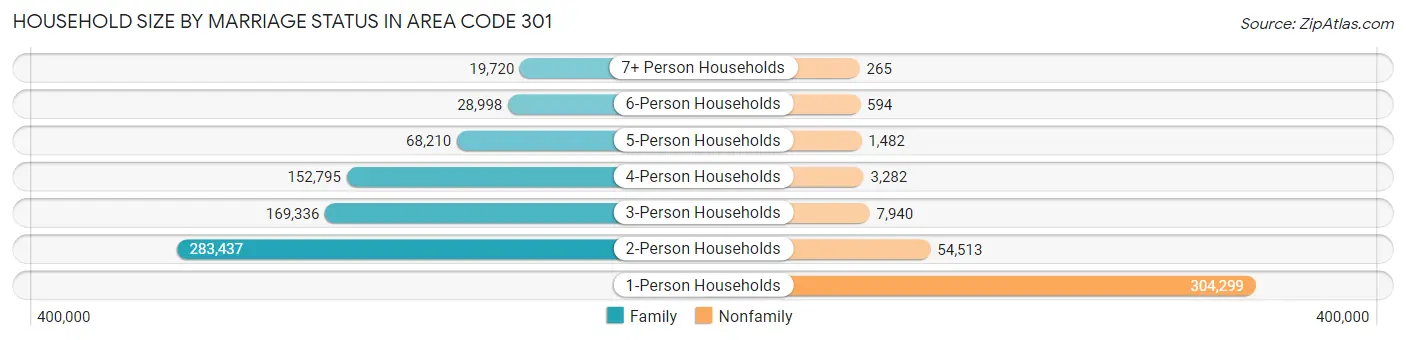
| Household Size | Family Households | Nonfamily Households |
| 1-Person Households | - | 304,299 (27.8%) |
| 2-Person Households | 283,437 (25.9%) | 54,513 (5.0%) |
| 3-Person Households | 169,336 (15.5%) | 7,940 (0.7%) |
| 4-Person Households | 152,795 (14.0%) | 3,282 (0.3%) |
| 5-Person Households | 68,210 (6.2%) | 1,482 (0.1%) |
| 6-Person Households | 28,998 (2.6%) | 594 (0.1%) |
| 7+ Person Households | 19,720 (1.8%) | 265 (0.0%) |
| Total | 722,496 (66.0%) | 372,375 (34.0%) |
Female Fertility in Area Code 301
Fertility by Age in Area Code 301
Average fertility rate in Area Code 301 is 61.0 births per 1,000 women. Women in the age bracket of 20 to 34 years have the highest fertility rate with 106.6 births per 1,000 women. Women in the age bracket of 20 to 34 years acount for 63.2% of all women with births.
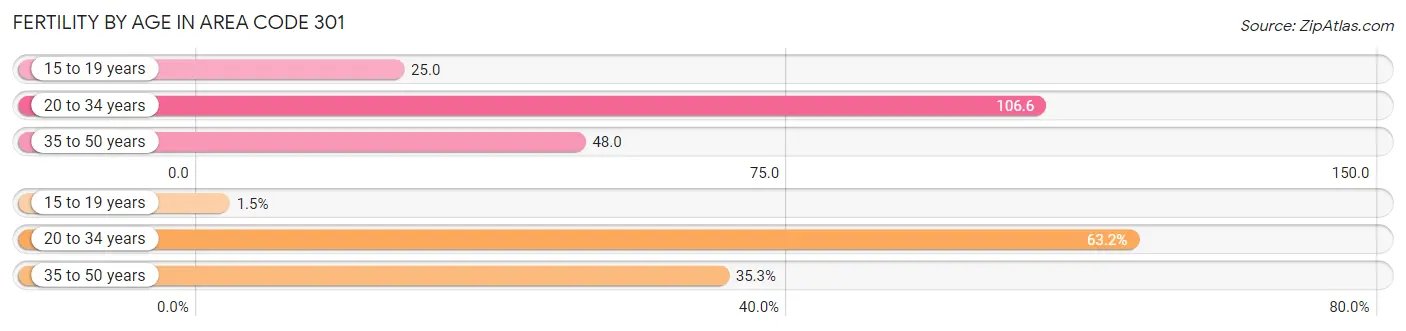
| Age Bracket | Women with Births | Births / 1,000 Women |
| 15 to 19 years | 551 (1.5%) | 25.0 |
| 20 to 34 years | 23,749 (63.2%) | 106.6 |
| 35 to 50 years | 13,284 (35.3%) | 48.0 |
| Total | 37,584 (100.0%) | 61.0 |
Fertility by Age by Marriage Status in Area Code 301
65.1% of women with births (37,584) in Area Code 301 are married. The highest percentage of unmarried women with births falls into 15 to 19 years age bracket with 100.0% of them unmarried at the time of birth, while the lowest percentage of unmarried women with births belong to 35 to 50 years age bracket with 36.2% of them unmarried.
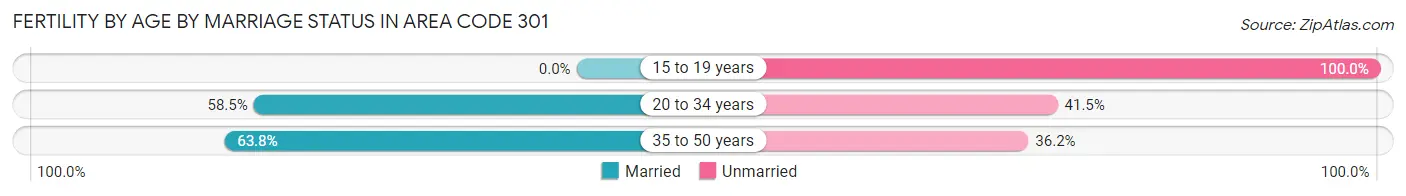
| Age Bracket | Married | Unmarried |
| 15 to 19 years | 0 (0.0%) | 551 (100.0%) |
| 20 to 34 years | 13,899 (58.5%) | 9,850 (41.5%) |
| 35 to 50 years | 8,477 (63.8%) | 4,807 (36.2%) |
| Total | 24,477 (65.1%) | 13,107 (34.9%) |
Fertility by Education in Area Code 301
Average fertility rate in Area Code 301 is 61.0 births per 1,000 women. Women with the education attainment of graduate degree have the highest fertility rate of 120.0 births per 1,000 women, while women with the education attainment of less than high school have the lowest fertility at 54.3 births per 1,000 women. Women with the education attainment of graduate degree represent 26.0% of all women with births.
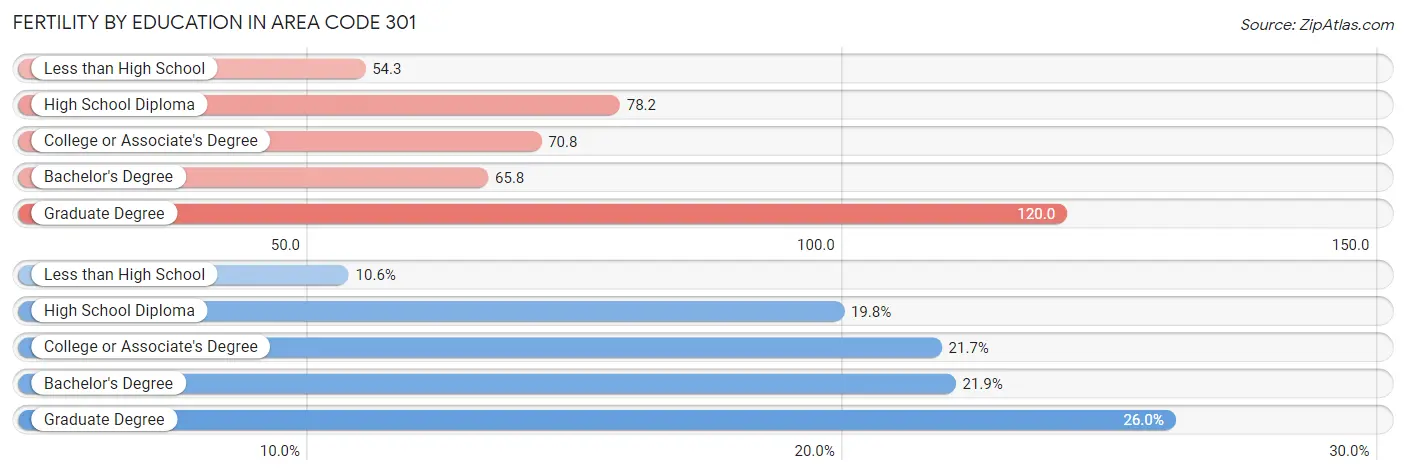
| Educational Attainment | Women with Births | Births / 1,000 Women |
| Less than High School | 3,966 (10.5%) | 54.3 |
| High School Diploma | 7,453 (19.8%) | 78.2 |
| College or Associate's Degree | 8,139 (21.7%) | 70.8 |
| Bachelor's Degree | 8,240 (21.9%) | 65.8 |
| Graduate Degree | 9,786 (26.0%) | 120.0 |
| Total | 37,584 (100.0%) | 61.0 |
Fertility by Education by Marriage Status in Area Code 301
34.9% of women with births in Area Code 301 are unmarried. Women with the educational attainment of graduate degree are most likely to be married with 70.9% of them married at childbirth, while women with the educational attainment of less than high school are least likely to be married with 70.1% of them unmarried at childbirth.
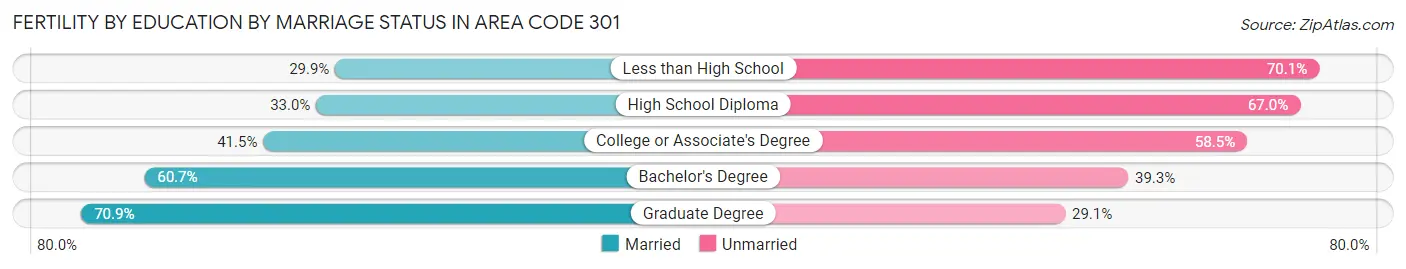
| Educational Attainment | Married | Unmarried |
| Less than High School | 1,187 (29.9%) | 2,779 (70.1%) |
| High School Diploma | 2,459 (33.0%) | 4,994 (67.0%) |
| College or Associate's Degree | 3,380 (41.5%) | 4,759 (58.5%) |
| Bachelor's Degree | 5,002 (60.7%) | 3,238 (39.3%) |
| Graduate Degree | 6,934 (70.9%) | 2,852 (29.1%) |
| Total | 24,477 (65.1%) | 13,107 (34.9%) |
Employment Characteristics in Area Code 301
Employment by Class of Employer in Area Code 301
Among the 1,514,257 employed individuals in Area Code 301, private company employees (851,258 | 56.2%), federal government employees (214,520 | 14.2%), and not-for-profit organizations (155,333 | 10.3%) make up the most common classes of employment.
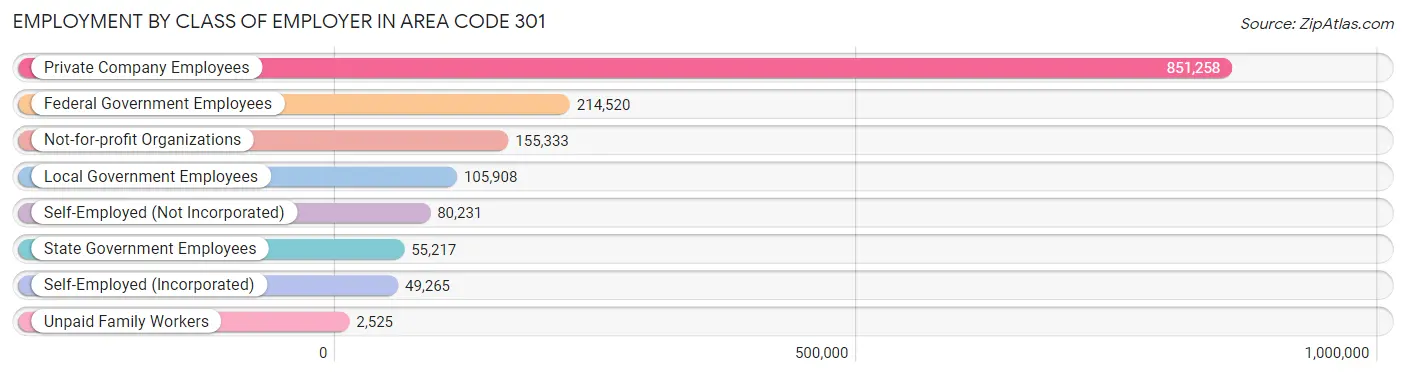
| Employer Class | # Employees | % Employees |
| Private Company Employees | 851,258 | 56.2% |
| Self-Employed (Incorporated) | 49,265 | 3.3% |
| Self-Employed (Not Incorporated) | 80,231 | 5.3% |
| Not-for-profit Organizations | 155,333 | 10.3% |
| Local Government Employees | 105,908 | 7.0% |
| State Government Employees | 55,217 | 3.6% |
| Federal Government Employees | 214,520 | 14.2% |
| Unpaid Family Workers | 2,525 | 0.2% |
| Total | 1,514,257 | 100.0% |
Employment Status by Age in Area Code 301
According to the labor force statistics for Area Code 301, out of the total population over 16 years of age (2,367,188), 66.7% or 1,580,098 individuals are in the labor force, with 5.6% or 88,011 of them unemployed. The age group with the highest labor force participation rate is 30 to 34 years, with 87.8% or 178,252 individuals in the labor force. Within the labor force, the 16 to 19 years age range has the highest percentage of unemployed individuals, with 2,497.8% or 1,402,465 of them being unemployed.
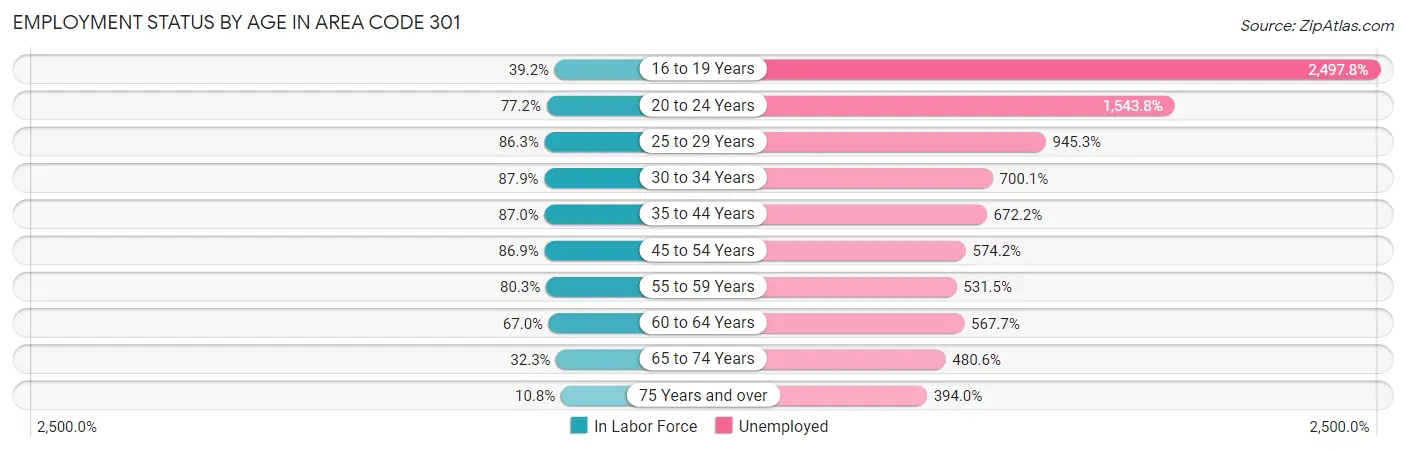
| Age Bracket | In Labor Force | Unemployed |
| 16 to 19 Years | 56,141 (39.2%) | 1,402,465 (2,497.8%) |
| 20 to 24 Years | 141,502 (77.2%) | 2,184,647 (1,543.8%) |
| 25 to 29 Years | 167,657 (86.3%) | 1,584,833 (945.3%) |
| 30 to 34 Years | 178,249 (87.8%) | 1,247,942 (700.1%) |
| 35 to 44 Years | 350,612 (87.0%) | 2,356,814 (672.2%) |
| 45 to 54 Years | 343,147 (86.9%) | 1,970,379 (574.2%) |
| 55 to 59 Years | 162,579 (80.3%) | 864,113 (531.5%) |
| 60 to 64 Years | 125,059 (67.0%) | 709,994 (567.7%) |
| 65 to 74 Years | 86,783 (32.3%) | 417,031 (480.6%) |
| 75 Years and over | 20,287 (10.8%) | 79,931 (394.0%) |
| Total | 1,580,161 (66.7%) | 88,045 (5.6%) |
Employment Status by Educational Attainment in Area Code 301
According to labor force statistics for Area Code 301, 83.1% of individuals (1,316,719) out of the total population between 25 and 64 years of age (1,584,118) are in the labor force, with 650.7% or 8,567,891 of them being unemployed. The group with the highest labor force participation rate are those with the educational attainment of bachelor's degree or higher, with 89.5% or 655,826 individuals in the labor force. Within the labor force, individuals with less than high school education have the highest percentage of unemployment, with 1,225.0% or 1,189,022 of them being unemployed.
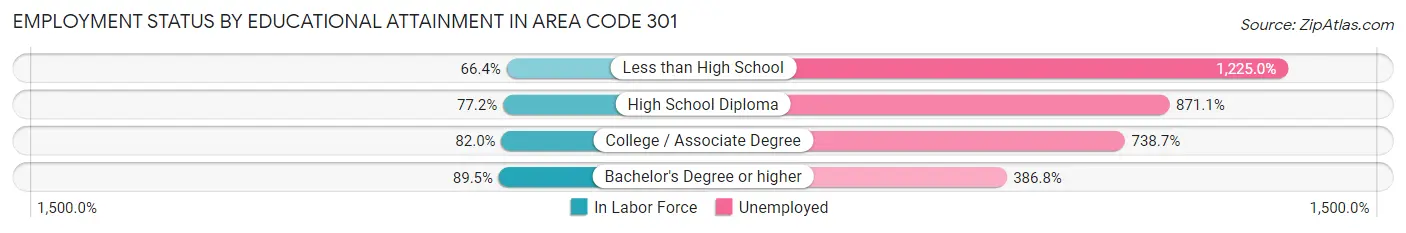
| Educational Attainment | In Labor Force | Unemployed |
| Less than High School | 97,068 (66.4%) | 1,791,514 (1,225.0%) |
| High School Diploma | 252,197 (77.2%) | 2,845,335 (871.1%) |
| College / Associate Degree | 310,391 (82.0%) | 2,796,349 (738.7%) |
| Bachelor's Degree or higher | 655,808 (89.5%) | 2,834,026 (386.8%) |
| Total | 1,316,698 (83.1%) | 10,307,856 (650.7%) |
Employment Occupations by Sex in Area Code 301
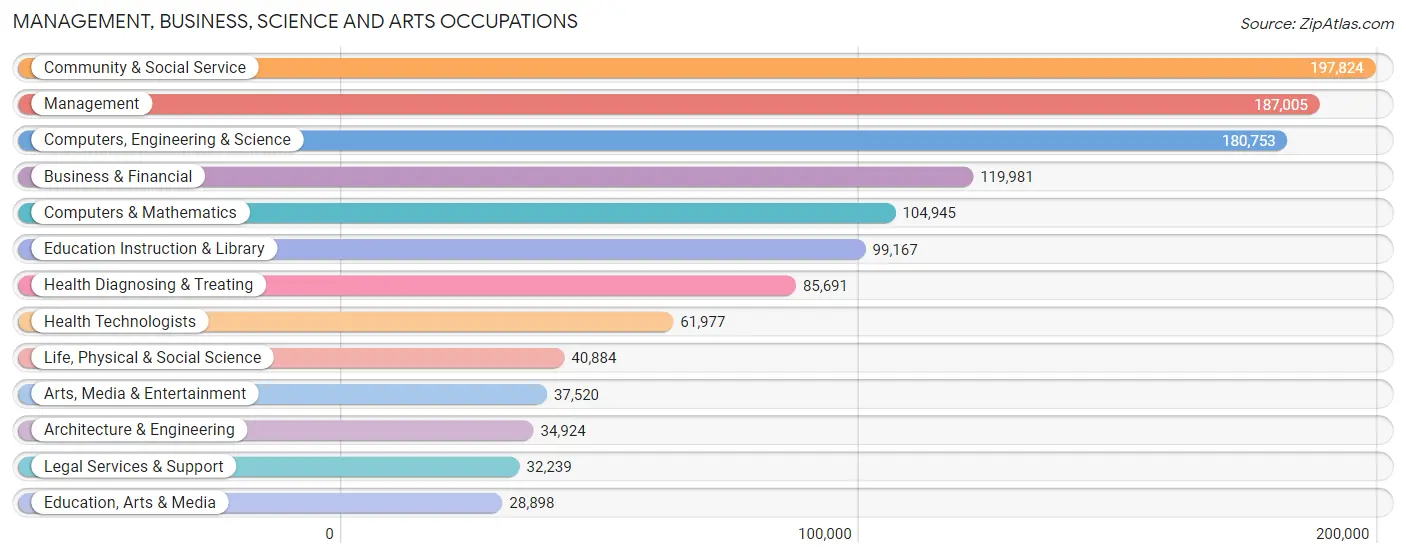
Management, Business, Science and Arts Occupations
The most common Management, Business, Science and Arts occupations in Area Code 301 are Community & Social Service (197,824 | 12.9%), Management (187,005 | 12.2%), Computers, Engineering & Science (180,753 | 11.8%), Business & Financial (119,981 | 7.8%), and Computers & Mathematics (104,945 | 6.9%).
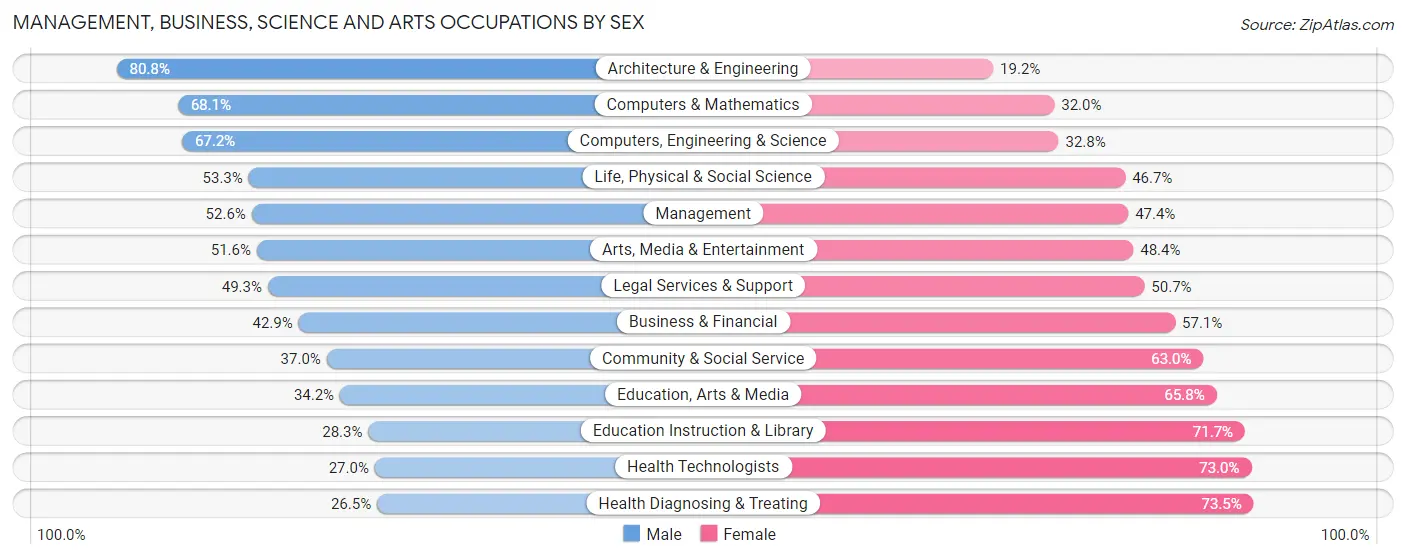
Management, Business, Science and Arts Occupations by Sex
Within the Management, Business, Science and Arts occupations in Area Code 301, the most male-oriented occupations are Architecture & Engineering (80.8%), Computers & Mathematics (68.0%), and Computers, Engineering & Science (67.2%), while the most female-oriented occupations are Health Diagnosing & Treating (73.5%), Health Technologists (73.0%), and Education Instruction & Library (71.7%).
| Occupation | Male | Female |
| Management | 98,440 (52.6%) | 88,565 (47.4%) |
| Business & Financial | 51,427 (42.9%) | 68,554 (57.1%) |
| Computers, Engineering & Science | 121,418 (67.2%) | 59,335 (32.8%) |
| Computers & Mathematics | 71,417 (68.0%) | 33,528 (32.0%) |
| Architecture & Engineering | 28,221 (80.8%) | 6,703 (19.2%) |
| Life, Physical & Social Science | 21,780 (53.3%) | 19,104 (46.7%) |
| Community & Social Service | 73,183 (37.0%) | 124,641 (63.0%) |
| Education, Arts & Media | 9,889 (34.2%) | 19,009 (65.8%) |
| Legal Services & Support | 15,880 (49.3%) | 16,359 (50.7%) |
| Education Instruction & Library | 28,064 (28.3%) | 71,103 (71.7%) |
| Arts, Media & Entertainment | 19,350 (51.6%) | 18,170 (48.4%) |
| Health Diagnosing & Treating | 22,696 (26.5%) | 62,995 (73.5%) |
| Health Technologists | 16,712 (27.0%) | 45,265 (73.0%) |
| Total (Category) | 367,164 (47.6%) | 404,090 (52.4%) |
| Total (Overall) | 787,413 (51.4%) | 744,145 (48.6%) |
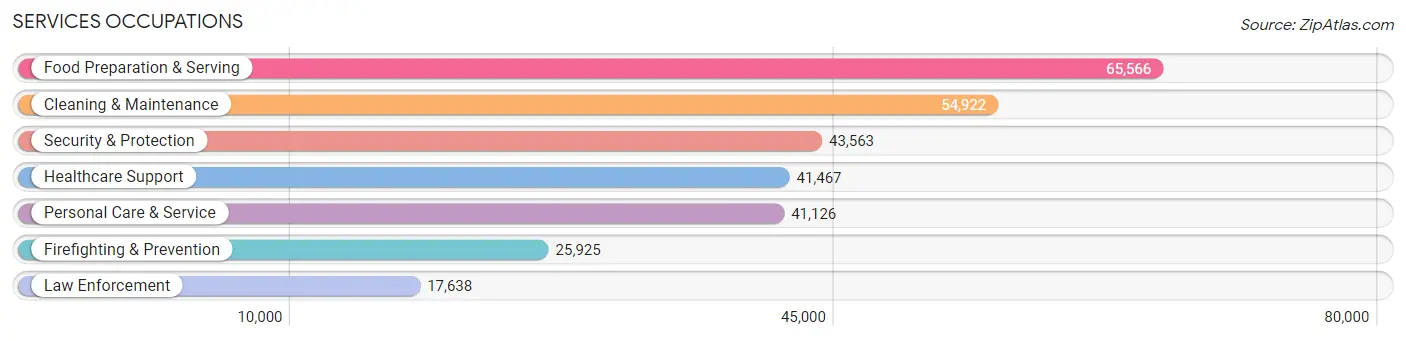
Services Occupations
The most common Services occupations in Area Code 301 are Food Preparation & Serving (65,566 | 4.3%), Cleaning & Maintenance (54,922 | 3.6%), Security & Protection (43,563 | 2.8%), Healthcare Support (41,467 | 2.7%), and Personal Care & Service (41,126 | 2.7%).
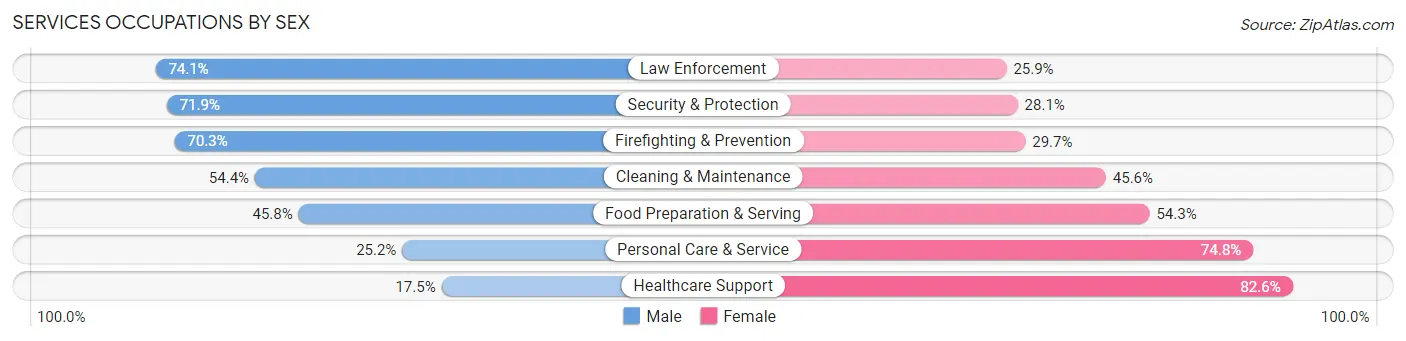
Services Occupations by Sex
Within the Services occupations in Area Code 301, the most male-oriented occupations are Law Enforcement (74.1%), Security & Protection (71.9%), and Firefighting & Prevention (70.3%), while the most female-oriented occupations are Healthcare Support (82.6%), Personal Care & Service (74.8%), and Food Preparation & Serving (54.2%).
| Occupation | Male | Female |
| Healthcare Support | 7,237 (17.4%) | 34,230 (82.6%) |
| Security & Protection | 31,303 (71.9%) | 12,260 (28.1%) |
| Firefighting & Prevention | 18,236 (70.3%) | 7,689 (29.7%) |
| Law Enforcement | 13,067 (74.1%) | 4,571 (25.9%) |
| Food Preparation & Serving | 29,996 (45.8%) | 35,570 (54.2%) |
| Cleaning & Maintenance | 29,871 (54.4%) | 25,051 (45.6%) |
| Personal Care & Service | 10,376 (25.2%) | 30,750 (74.8%) |
| Total (Category) | 108,783 (44.1%) | 137,861 (55.9%) |
| Total (Overall) | 787,413 (51.4%) | 744,145 (48.6%) |
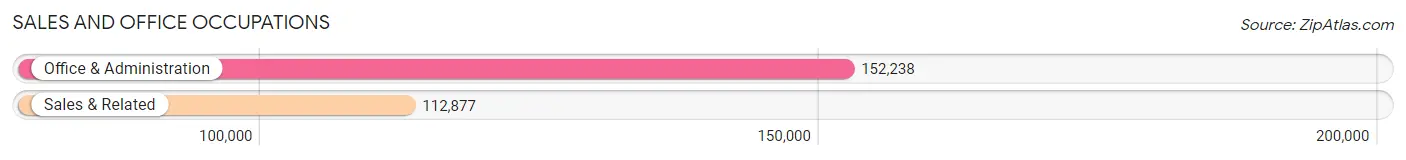
Sales and Office Occupations
The most common Sales and Office occupations in Area Code 301 are Office & Administration (152,238 | 9.9%), and Sales & Related (112,877 | 7.4%).
Sales and Office Occupations by Sex
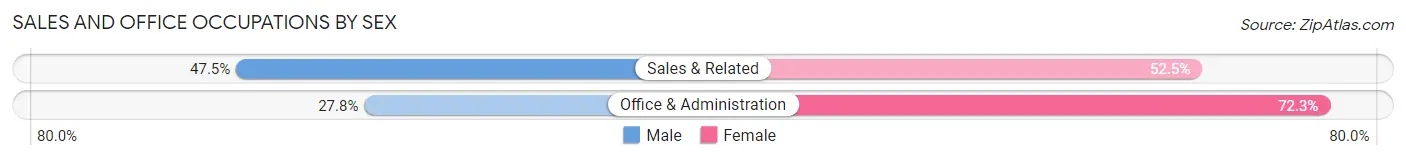
| Occupation | Male | Female |
| Sales & Related | 53,576 (47.5%) | 59,301 (52.5%) |
| Office & Administration | 42,249 (27.8%) | 109,989 (72.3%) |
| Total (Category) | 95,825 (36.1%) | 169,290 (63.9%) |
| Total (Overall) | 787,413 (51.4%) | 744,145 (48.6%) |
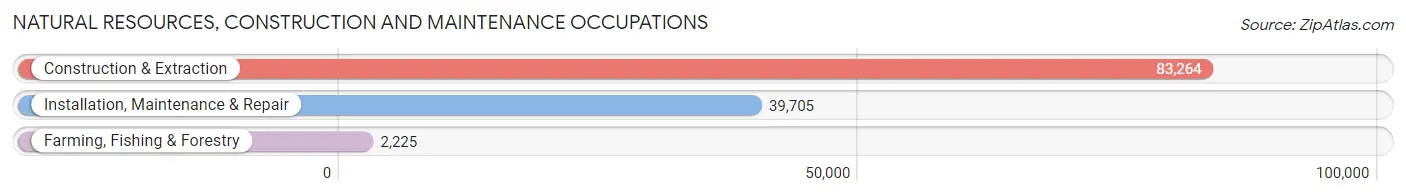
Natural Resources, Construction and Maintenance Occupations
The most common Natural Resources, Construction and Maintenance occupations in Area Code 301 are Construction & Extraction (83,264 | 5.4%), Installation, Maintenance & Repair (39,705 | 2.6%), and Farming, Fishing & Forestry (2,225 | 0.2%).
Natural Resources, Construction and Maintenance Occupations by Sex
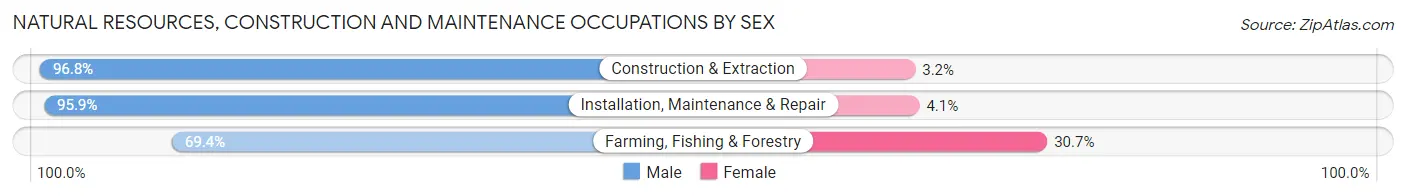
| Occupation | Male | Female |
| Farming, Fishing & Forestry | 1,543 (69.4%) | 682 (30.6%) |
| Construction & Extraction | 80,602 (96.8%) | 2,662 (3.2%) |
| Installation, Maintenance & Repair | 38,094 (95.9%) | 1,611 (4.1%) |
| Total (Category) | 120,239 (96.0%) | 4,955 (4.0%) |
| Total (Overall) | 787,413 (51.4%) | 744,145 (48.6%) |
Production, Transportation and Moving Occupations
The most common Production, Transportation and Moving occupations in Area Code 301 are Transportation (52,446 | 3.4%), Material Moving (37,423 | 2.4%), and Production (33,482 | 2.2%).
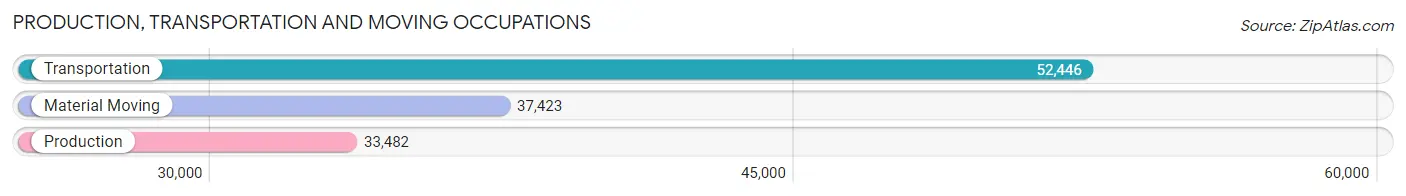
Production, Transportation and Moving Occupations by Sex
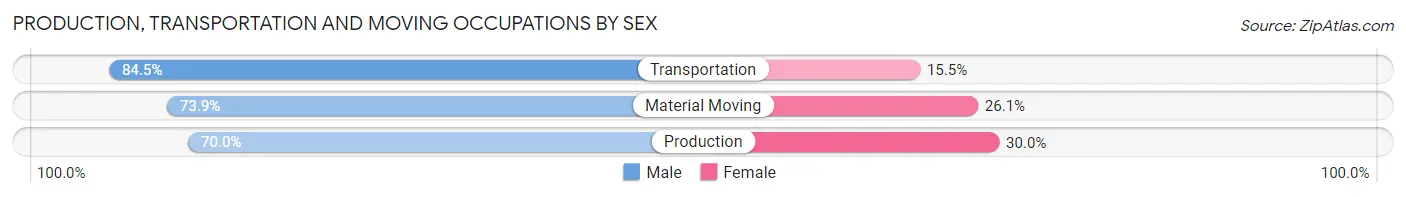
| Occupation | Male | Female |
| Production | 23,431 (70.0%) | 10,051 (30.0%) |
| Transportation | 44,322 (84.5%) | 8,124 (15.5%) |
| Material Moving | 27,649 (73.9%) | 9,774 (26.1%) |
| Total (Category) | 95,402 (77.3%) | 27,949 (22.7%) |
| Total (Overall) | 787,413 (51.4%) | 744,145 (48.6%) |
Employment Industries by Sex in Area Code 301
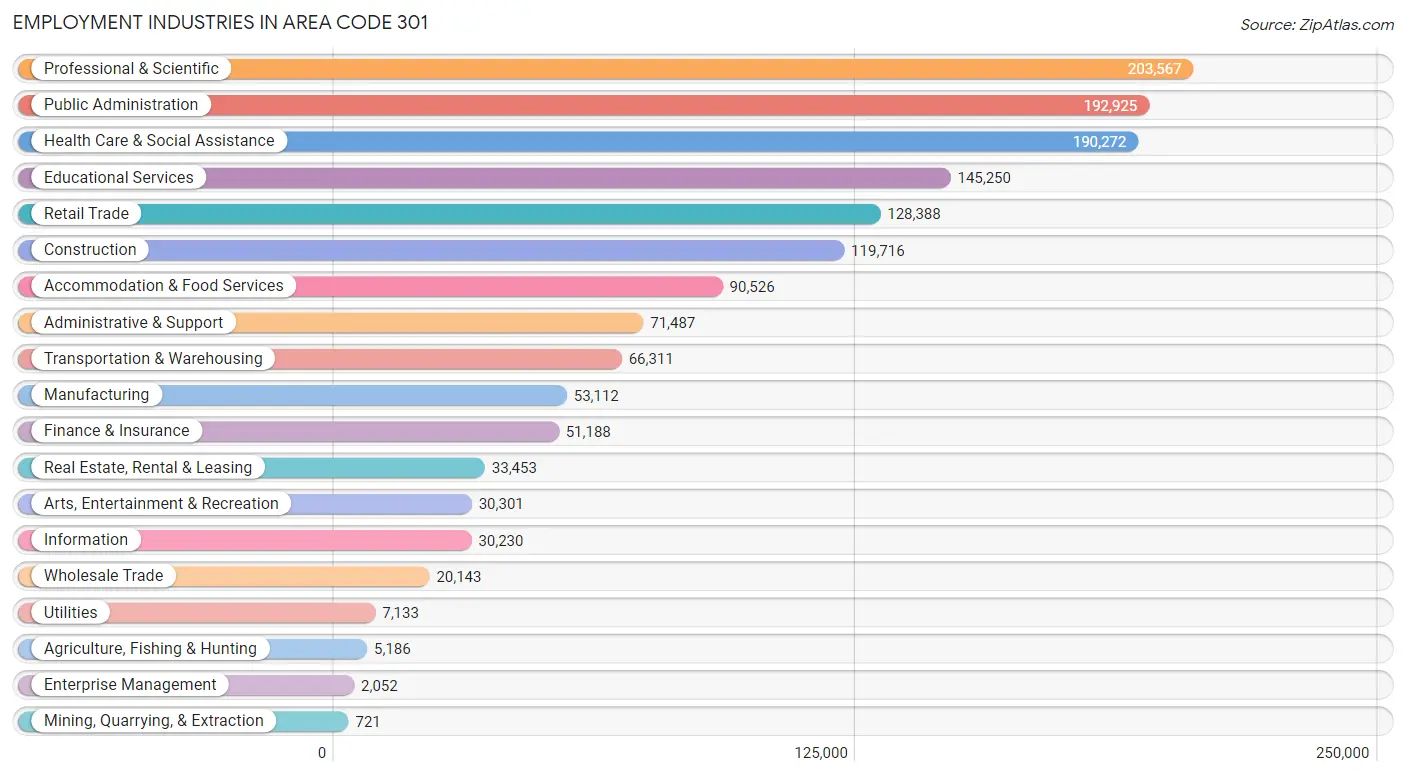
Employment Industries in Area Code 301
The major employment industries in Area Code 301 include Professional & Scientific (203,567 | 13.3%), Public Administration (192,925 | 12.6%), Health Care & Social Assistance (190,272 | 12.4%), Educational Services (145,250 | 9.5%), and Retail Trade (128,388 | 8.4%).
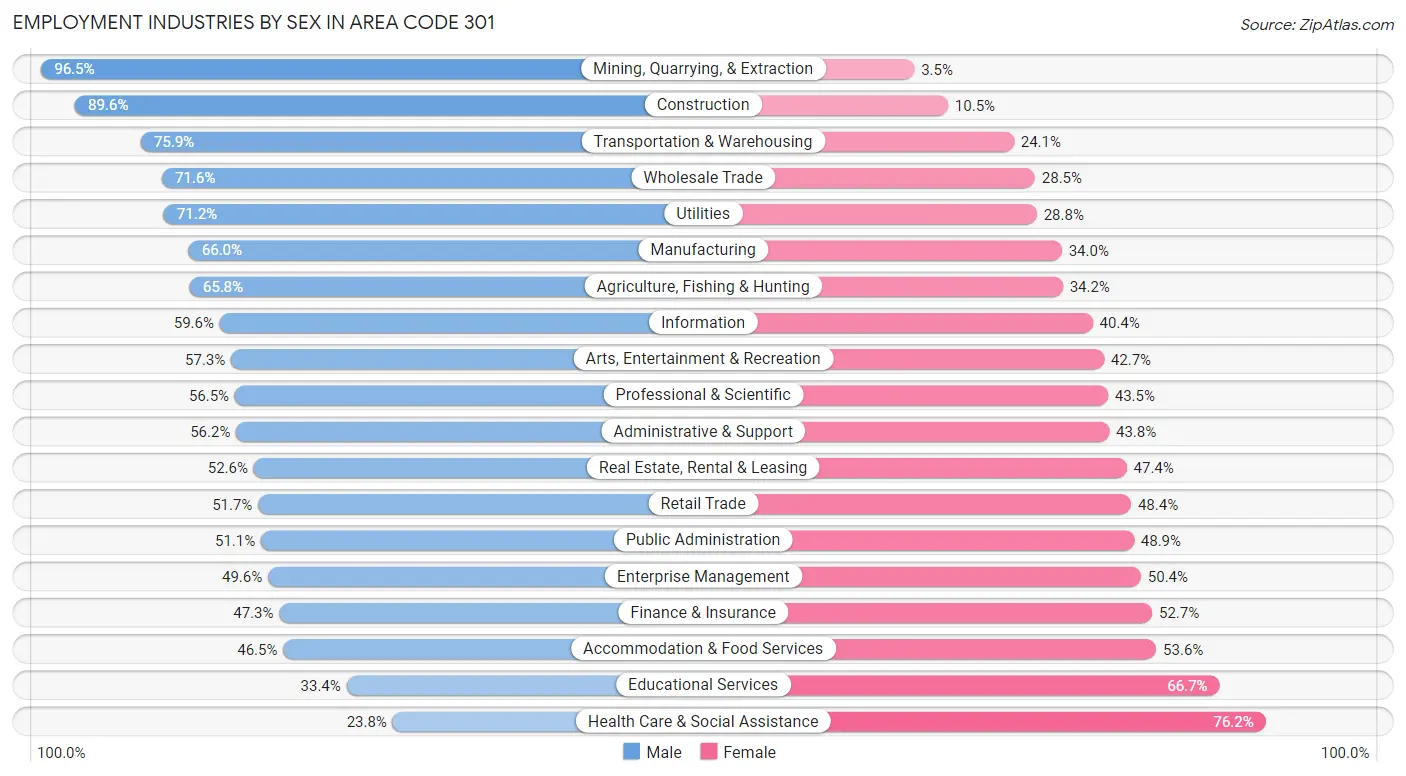
Employment Industries by Sex in Area Code 301
The Area Code 301 industries that see more men than women are Mining, Quarrying, & Extraction (96.5%), Construction (89.5%), and Transportation & Warehousing (75.9%), whereas the industries that tend to have a higher number of women are Health Care & Social Assistance (76.2%), Educational Services (66.6%), and Accommodation & Food Services (53.5%).
| Industry | Male | Female |
| Agriculture, Fishing & Hunting | 3,412 (65.8%) | 1,774 (34.2%) |
| Mining, Quarrying, & Extraction | 696 (96.5%) | 25 (3.5%) |
| Construction | 107,205 (89.5%) | 12,511 (10.4%) |
| Manufacturing | 35,049 (66.0%) | 18,063 (34.0%) |
| Wholesale Trade | 14,413 (71.6%) | 5,730 (28.4%) |
| Retail Trade | 66,316 (51.6%) | 62,072 (48.3%) |
| Transportation & Warehousing | 50,339 (75.9%) | 15,972 (24.1%) |
| Utilities | 5,076 (71.2%) | 2,057 (28.8%) |
| Information | 18,017 (59.6%) | 12,213 (40.4%) |
| Finance & Insurance | 24,206 (47.3%) | 26,982 (52.7%) |
| Real Estate, Rental & Leasing | 17,584 (52.6%) | 15,869 (47.4%) |
| Professional & Scientific | 114,930 (56.5%) | 88,637 (43.5%) |
| Enterprise Management | 1,018 (49.6%) | 1,034 (50.4%) |
| Administrative & Support | 40,168 (56.2%) | 31,319 (43.8%) |
| Educational Services | 48,437 (33.4%) | 96,813 (66.6%) |
| Health Care & Social Assistance | 45,304 (23.8%) | 144,968 (76.2%) |
| Arts, Entertainment & Recreation | 17,349 (57.3%) | 12,952 (42.7%) |
| Accommodation & Food Services | 42,048 (46.5%) | 48,478 (53.5%) |
| Public Administration | 98,510 (51.1%) | 94,415 (48.9%) |
| Total | 787,413 (51.4%) | 744,145 (48.6%) |
Education in Area Code 301
School Enrollment in Area Code 301
The most common levels of schooling among the 735,266 students in Area Code 301 are high school (154,047 | 20.9%), college / undergraduate (149,663 | 20.3%), and middle school (148,821 | 20.2%).
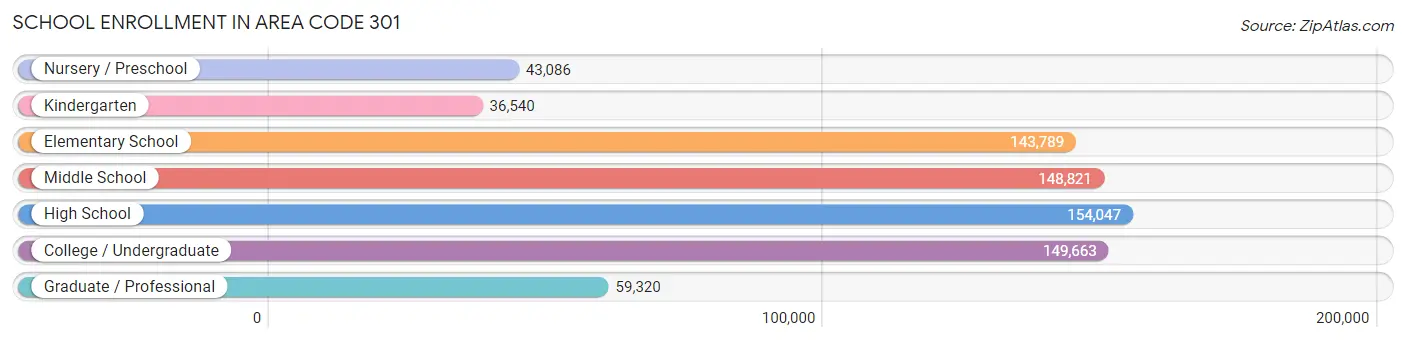
| School Level | # Students | % Students |
| Nursery / Preschool | 43,086 | 5.9% |
| Kindergarten | 36,540 | 5.0% |
| Elementary School | 143,789 | 19.6% |
| Middle School | 148,821 | 20.2% |
| High School | 154,047 | 20.9% |
| College / Undergraduate | 149,663 | 20.3% |
| Graduate / Professional | 59,320 | 8.1% |
| Total | 735,266 | 100.0% |
School Enrollment by Age by Funding Source in Area Code 301
Out of a total of 735,266 students who are enrolled in schools in Area Code 301, 143,170 (19.5%) attend a private institution, while the remaining 592,096 (80.5%) are enrolled in public schools. The age group of 3 to 4 year olds has the highest likelihood of being enrolled in private schools, with 16,971 (51.3% in the age bracket) enrolled. Conversely, the age group of 15 to 17 year olds has the lowest likelihood of being enrolled in a private school, with 93,285 (86.1% in the age bracket) attending a public institution.
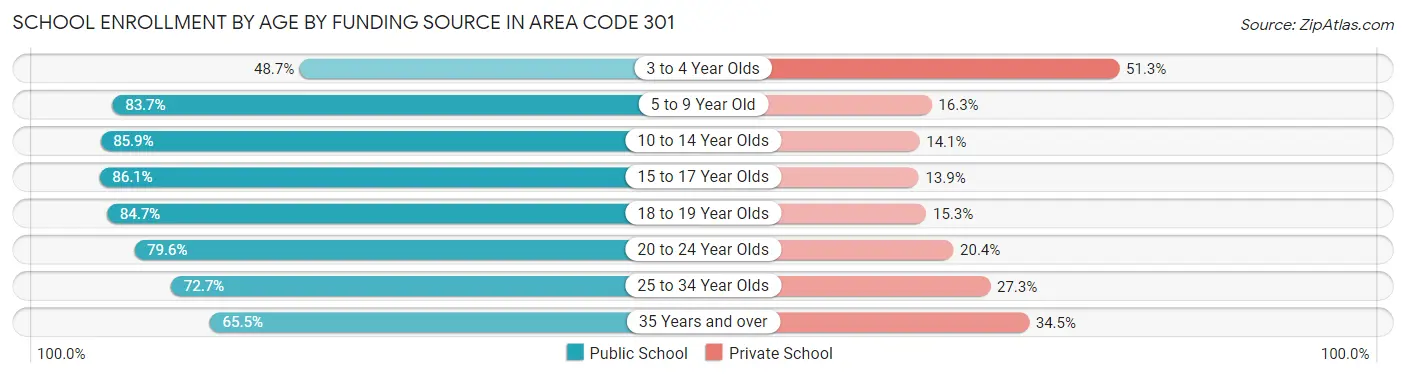
| Age Bracket | Public School | Private School |
| 3 to 4 Year Olds | 16,114 (48.7%) | 16,971 (51.3%) |
| 5 to 9 Year Old | 144,563 (83.7%) | 28,226 (16.3%) |
| 10 to 14 Year Olds | 157,411 (85.9%) | 25,810 (14.1%) |
| 15 to 17 Year Olds | 93,285 (86.1%) | 15,092 (13.9%) |
| 18 to 19 Year Olds | 46,707 (84.7%) | 8,464 (15.3%) |
| 20 to 24 Year Olds | 59,303 (79.6%) | 15,191 (20.4%) |
| 25 to 34 Year Olds | 38,640 (72.7%) | 14,479 (27.3%) |
| 35 Years and over | 36,042 (65.5%) | 18,968 (34.5%) |
| Total | 592,096 (80.5%) | 143,170 (19.5%) |
Educational Attainment by Field of Study in Area Code 301
Business (171,352 | 17.0%), social sciences (121,338 | 12.1%), science & technology (81,485 | 8.1%), engineering (77,580 | 7.7%), and education (77,518 | 7.7%) are the most common fields of study among 1,005,451 individuals in Area Code 301 who have obtained a bachelor's degree or higher.
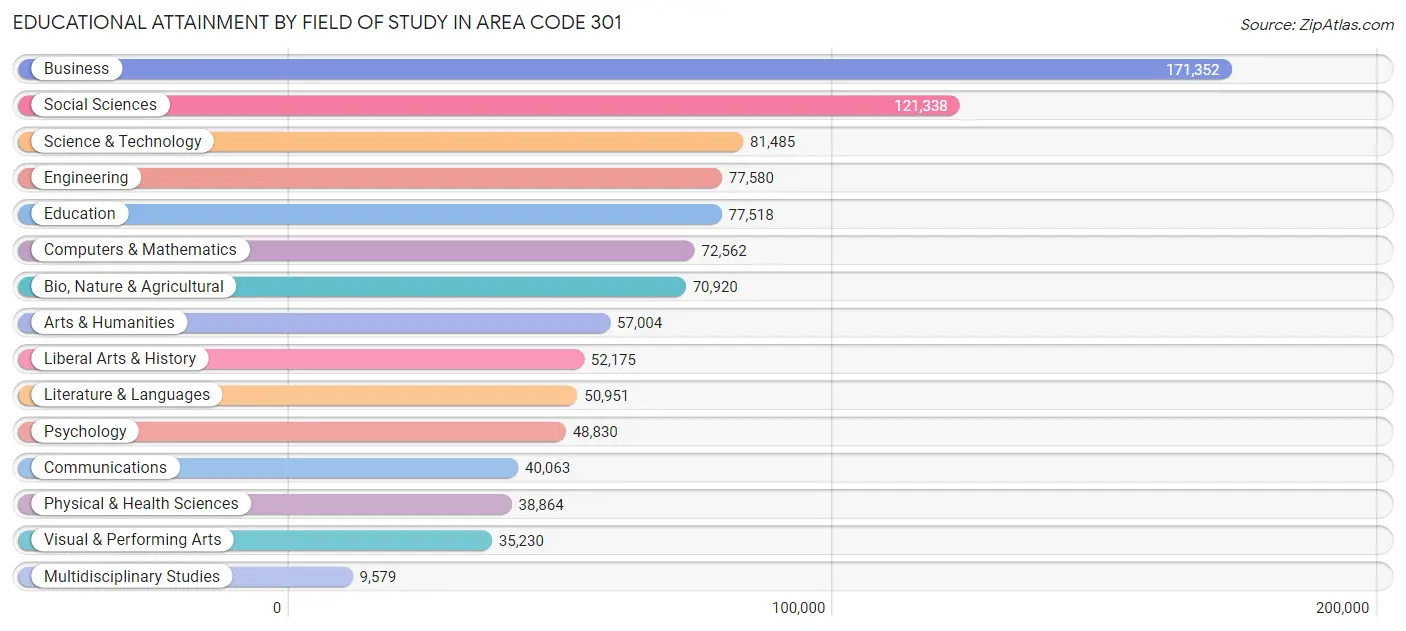
| Field of Study | # Graduates | % Graduates |
| Computers & Mathematics | 72,562 | 7.2% |
| Bio, Nature & Agricultural | 70,920 | 7.0% |
| Physical & Health Sciences | 38,864 | 3.9% |
| Psychology | 48,830 | 4.9% |
| Social Sciences | 121,338 | 12.1% |
| Engineering | 77,580 | 7.7% |
| Multidisciplinary Studies | 9,579 | 0.9% |
| Science & Technology | 81,485 | 8.1% |
| Business | 171,352 | 17.0% |
| Education | 77,518 | 7.7% |
| Literature & Languages | 50,951 | 5.1% |
| Liberal Arts & History | 52,175 | 5.2% |
| Visual & Performing Arts | 35,230 | 3.5% |
| Communications | 40,063 | 4.0% |
| Arts & Humanities | 57,004 | 5.7% |
| Total | 1,005,451 | 100.0% |
Transportation & Commute in Area Code 301
Vehicle Availability by Sex in Area Code 301
The most prevalent vehicle ownership categories in Area Code 301 are males with 2 vehicles (317,116, accounting for 40.5%) and females with 2 vehicles (277,680, making up 43.6%).
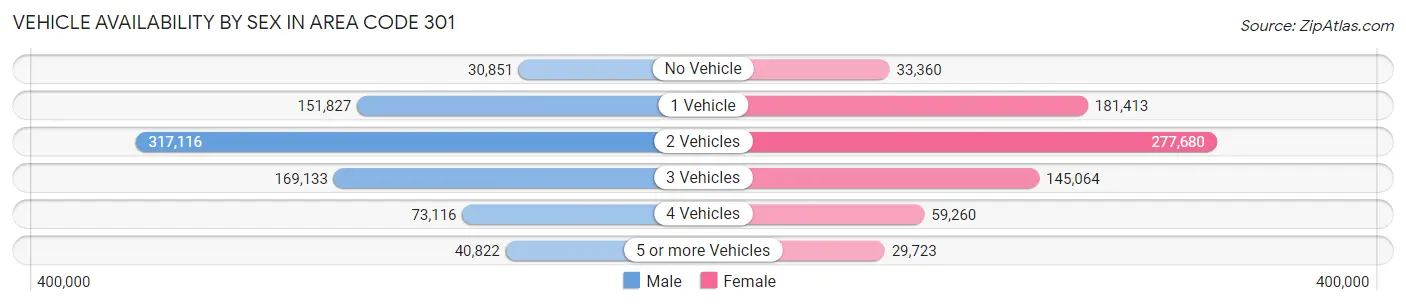
| Vehicles Available | Male | Female |
| No Vehicle | 30,851 (3.9%) | 33,360 (4.6%) |
| 1 Vehicle | 151,827 (19.4%) | 181,413 (25.0%) |
| 2 Vehicles | 317,116 (40.5%) | 277,680 (38.2%) |
| 3 Vehicles | 169,133 (21.6%) | 145,064 (20.0%) |
| 4 Vehicles | 73,116 (9.3%) | 59,260 (8.2%) |
| 5 or more Vehicles | 40,822 (5.2%) | 29,723 (4.1%) |
| Total | 782,865 (100.0%) | 726,500 (100.0%) |
Commute Time in Area Code 301
The most frequently occuring commute durations in Area Code 301 are 30 to 34 minutes (192,760 commuters, 15.2%), 45 to 59 minutes (165,134 commuters, 13.1%), and 60 to 89 minutes (152,618 commuters, 12.1%).
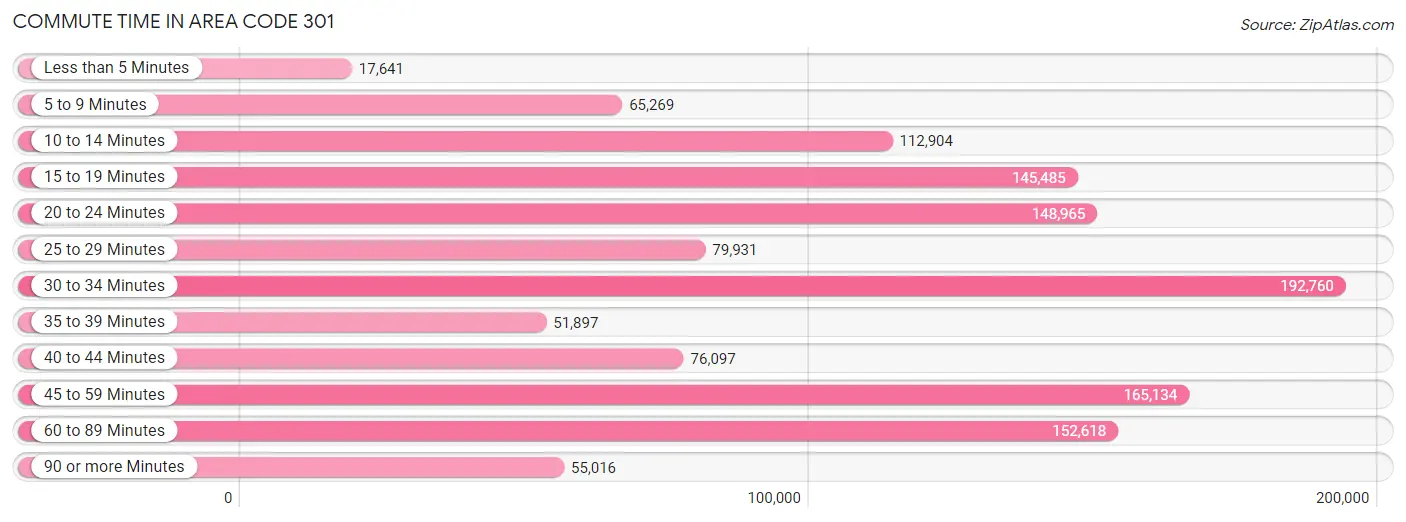
| Commute Time | # Commuters | % Commuters |
| Less than 5 Minutes | 17,641 | 1.4% |
| 5 to 9 Minutes | 65,269 | 5.2% |
| 10 to 14 Minutes | 112,904 | 8.9% |
| 15 to 19 Minutes | 145,485 | 11.5% |
| 20 to 24 Minutes | 148,965 | 11.8% |
| 25 to 29 Minutes | 79,931 | 6.3% |
| 30 to 34 Minutes | 192,760 | 15.2% |
| 35 to 39 Minutes | 51,897 | 4.1% |
| 40 to 44 Minutes | 76,097 | 6.0% |
| 45 to 59 Minutes | 165,134 | 13.1% |
| 60 to 89 Minutes | 152,618 | 12.1% |
| 90 or more Minutes | 55,016 | 4.3% |
Commute Time by Sex in Area Code 301
The most common commute times in Area Code 301 are 30 to 34 minutes (106,941 commuters, 16.0%) for males and 30 to 34 minutes (85,819 commuters, 14.4%) for females.
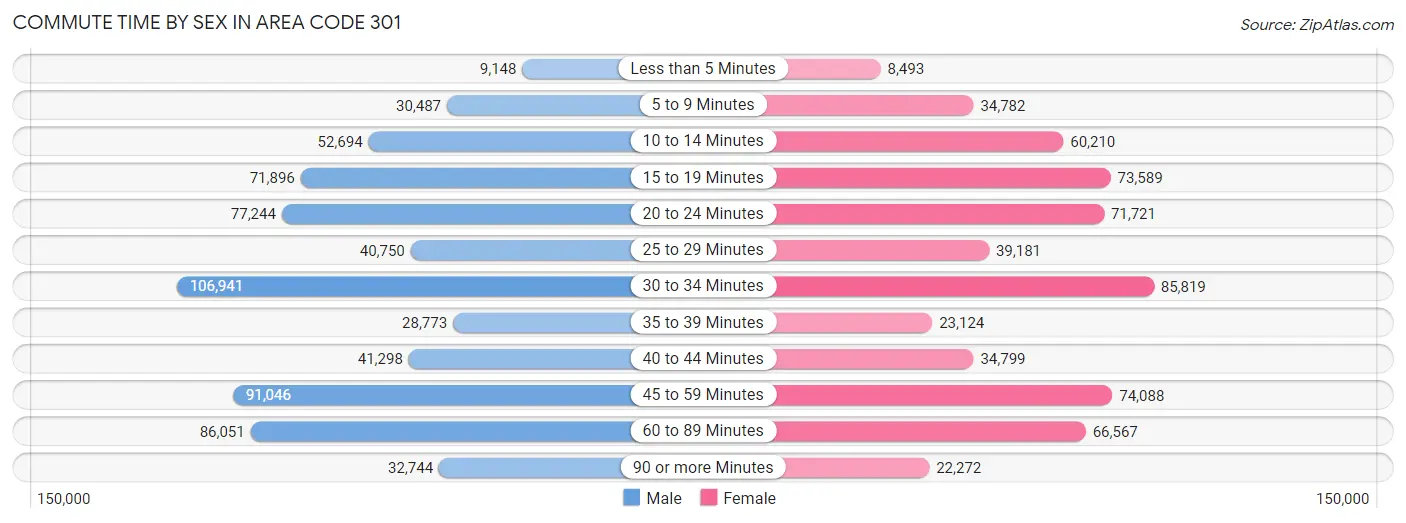
| Commute Time | Male | Female |
| Less than 5 Minutes | 9,148 (1.4%) | 8,493 (1.4%) |
| 5 to 9 Minutes | 30,487 (4.6%) | 34,782 (5.9%) |
| 10 to 14 Minutes | 52,694 (7.9%) | 60,210 (10.1%) |
| 15 to 19 Minutes | 71,896 (10.7%) | 73,589 (12.4%) |
| 20 to 24 Minutes | 77,244 (11.5%) | 71,721 (12.1%) |
| 25 to 29 Minutes | 40,750 (6.1%) | 39,181 (6.6%) |
| 30 to 34 Minutes | 106,941 (16.0%) | 85,819 (14.4%) |
| 35 to 39 Minutes | 28,773 (4.3%) | 23,124 (3.9%) |
| 40 to 44 Minutes | 41,298 (6.2%) | 34,799 (5.9%) |
| 45 to 59 Minutes | 91,046 (13.6%) | 74,088 (12.5%) |
| 60 to 89 Minutes | 86,051 (12.9%) | 66,567 (11.2%) |
| 90 or more Minutes | 32,744 (4.9%) | 22,272 (3.7%) |
Time of Departure to Work by Sex in Area Code 301
The most frequent times of departure to work in Area Code 301 are 7:00 AM to 7:29 AM (85,664, 12.8%) for males and 7:00 AM to 7:29 AM (86,916, 14.6%) for females.
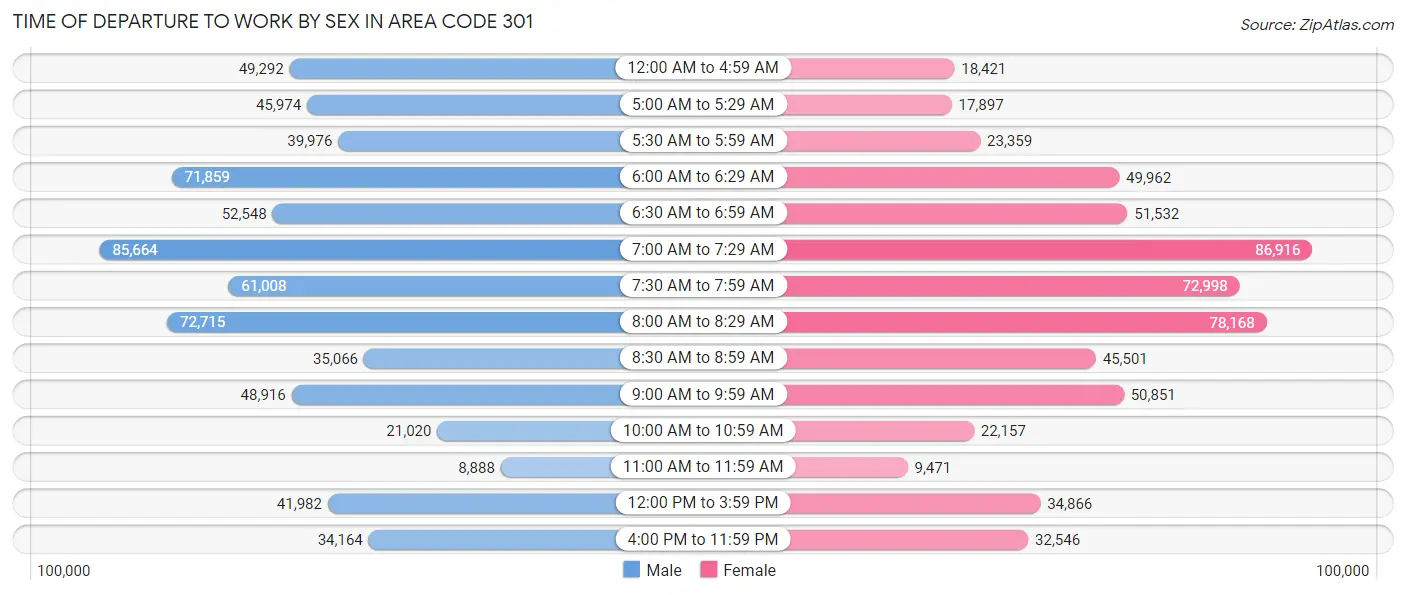
| Time of Departure | Male | Female |
| 12:00 AM to 4:59 AM | 49,292 (7.4%) | 18,421 (3.1%) |
| 5:00 AM to 5:29 AM | 45,974 (6.9%) | 17,897 (3.0%) |
| 5:30 AM to 5:59 AM | 39,976 (6.0%) | 23,359 (3.9%) |
| 6:00 AM to 6:29 AM | 71,859 (10.7%) | 49,962 (8.4%) |
| 6:30 AM to 6:59 AM | 52,548 (7.9%) | 51,532 (8.7%) |
| 7:00 AM to 7:29 AM | 85,664 (12.8%) | 86,916 (14.6%) |
| 7:30 AM to 7:59 AM | 61,008 (9.1%) | 72,998 (12.3%) |
| 8:00 AM to 8:29 AM | 72,715 (10.9%) | 78,168 (13.2%) |
| 8:30 AM to 8:59 AM | 35,066 (5.2%) | 45,501 (7.6%) |
| 9:00 AM to 9:59 AM | 48,916 (7.3%) | 50,851 (8.6%) |
| 10:00 AM to 10:59 AM | 21,020 (3.1%) | 22,157 (3.7%) |
| 11:00 AM to 11:59 AM | 8,888 (1.3%) | 9,471 (1.6%) |
| 12:00 PM to 3:59 PM | 41,982 (6.3%) | 34,866 (5.9%) |
| 4:00 PM to 11:59 PM | 34,164 (5.1%) | 32,546 (5.5%) |
| Total | 669,072 (100.0%) | 594,645 (100.0%) |
Housing Occupancy in Area Code 301
Occupancy by Ownership in Area Code 301
Of the total 1,094,871 dwellings in Area Code 301, owner-occupied units account for 716,195 (65.4%), while renter-occupied units make up 378,676 (34.6%).
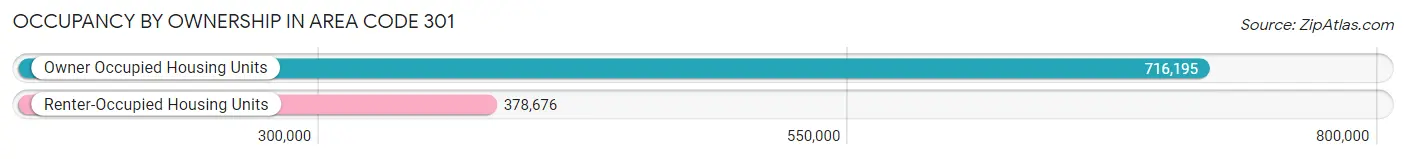
| Occupancy | # Housing Units | % Housing Units |
| Owner Occupied Housing Units | 716,195 | 65.4% |
| Renter-Occupied Housing Units | 378,676 | 34.6% |
| Total Occupied Housing Units | 1,094,871 | 100.0% |
Occupancy by Household Size in Area Code 301
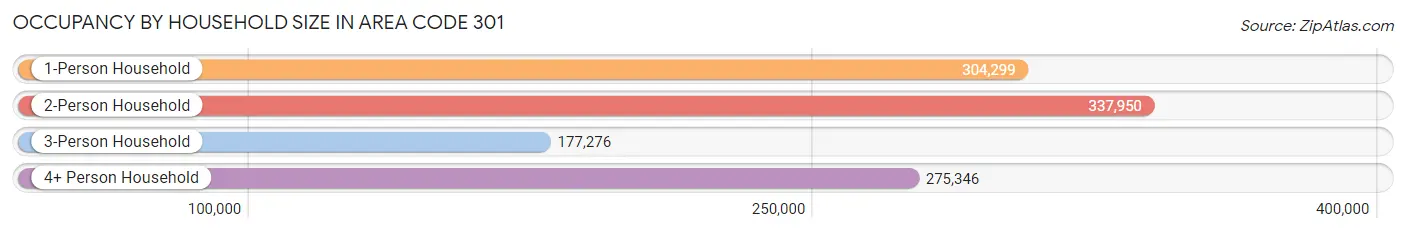
| Household Size | # Housing Units | % Housing Units |
| 1-Person Household | 304,299 | 27.8% |
| 2-Person Household | 337,950 | 30.9% |
| 3-Person Household | 177,276 | 16.2% |
| 4+ Person Household | 275,346 | 25.2% |
| Total Housing Units | 1,094,871 | 100.0% |
Occupancy by Ownership by Household Size in Area Code 301
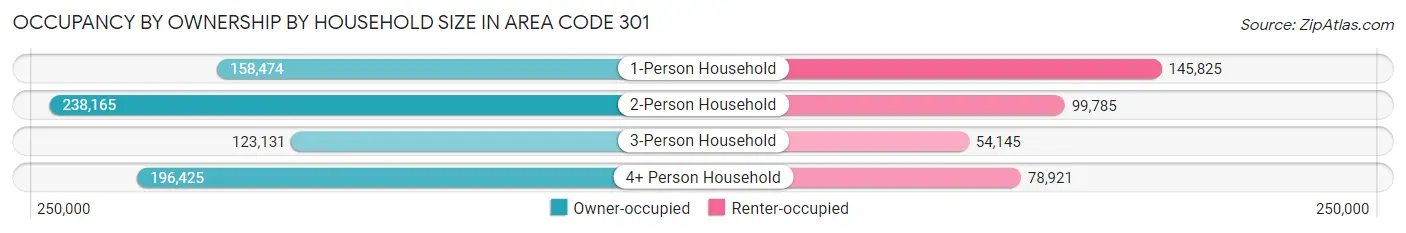
| Household Size | Owner-occupied | Renter-occupied |
| 1-Person Household | 158,474 (52.1%) | 145,825 (47.9%) |
| 2-Person Household | 238,165 (70.5%) | 99,785 (29.5%) |
| 3-Person Household | 123,131 (69.5%) | 54,145 (30.5%) |
| 4+ Person Household | 196,425 (71.3%) | 78,921 (28.7%) |
| Total Housing Units | 716,195 (65.4%) | 378,676 (34.6%) |
Occupancy by Educational Attainment in Area Code 301
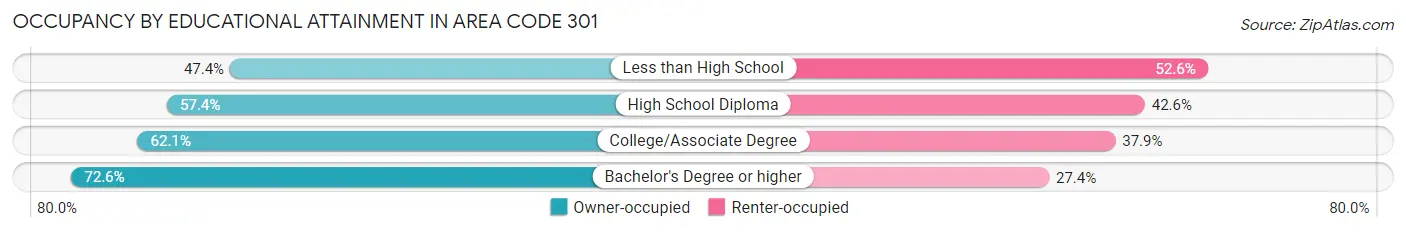
| Household Size | Owner-occupied | Renter-occupied |
| Less than High School | 37,519 (47.4%) | 41,585 (52.6%) |
| High School Diploma | 114,256 (57.4%) | 84,839 (42.6%) |
| College/Associate Degree | 167,313 (62.1%) | 102,252 (37.9%) |
| Bachelor's Degree or higher | 397,107 (72.6%) | 150,000 (27.4%) |
Occupancy by Age of Householder in Area Code 301
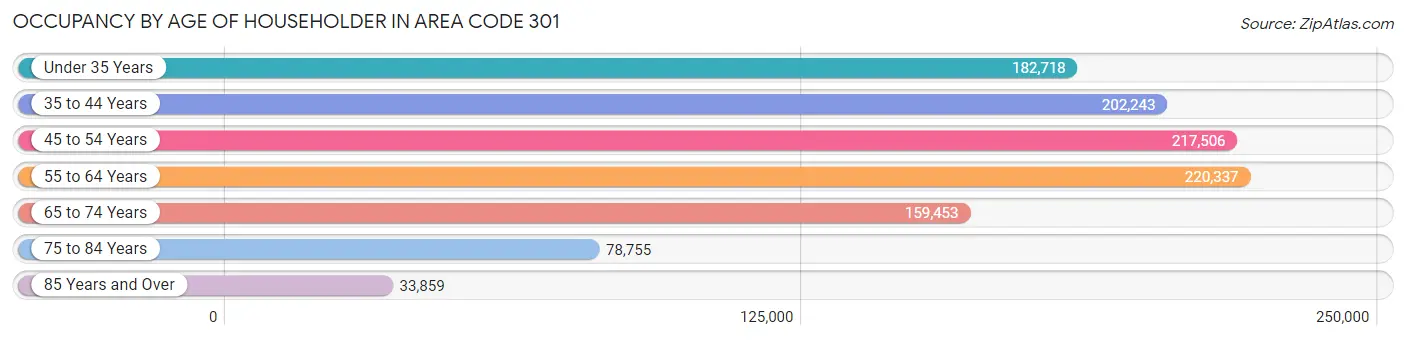
| Age Bracket | # Households | % Households |
| Under 35 Years | 182,718 | 16.7% |
| 35 to 44 Years | 202,243 | 18.5% |
| 45 to 54 Years | 217,506 | 19.9% |
| 55 to 64 Years | 220,337 | 20.1% |
| 65 to 74 Years | 159,453 | 14.6% |
| 75 to 84 Years | 78,755 | 7.2% |
| 85 Years and Over | 33,859 | 3.1% |
| Total | 1,094,871 | 100.0% |
Housing Finances in Area Code 301
Median Income by Occupancy in Area Code 301
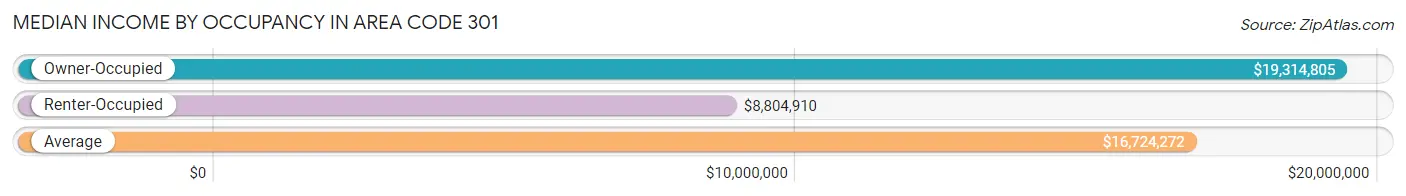
| Occupancy Type | # Households | Median Income |
| Owner-Occupied | 716,195 (65.4%) | $19,314,805 |
| Renter-Occupied | 378,676 (34.6%) | $8,804,910 |
| Average | 1,094,871 (100.0%) | $16,724,272 |
Occupancy by Householder Income Bracket in Area Code 301
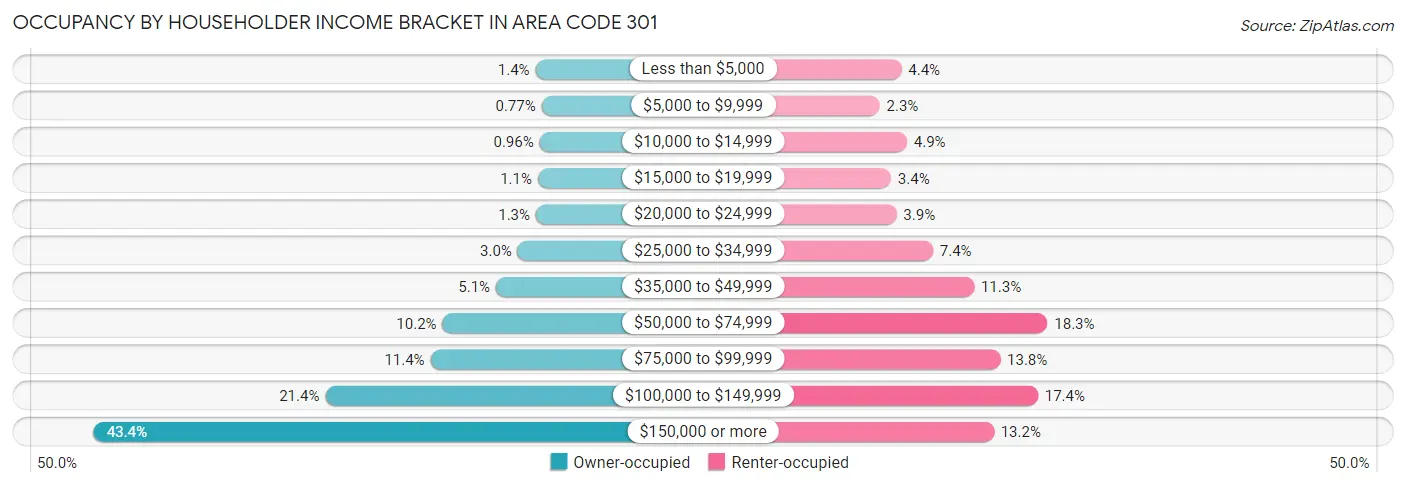
| Income Bracket | Owner-occupied | Renter-occupied |
| Less than $5,000 | 9,659 (1.3%) | 16,496 (4.4%) |
| $5,000 to $9,999 | 5,543 (0.8%) | 8,690 (2.3%) |
| $10,000 to $14,999 | 6,844 (1.0%) | 18,520 (4.9%) |
| $15,000 to $19,999 | 8,001 (1.1%) | 12,759 (3.4%) |
| $20,000 to $24,999 | 9,383 (1.3%) | 14,726 (3.9%) |
| $25,000 to $34,999 | 21,799 (3.0%) | 27,888 (7.4%) |
| $35,000 to $49,999 | 36,595 (5.1%) | 42,712 (11.3%) |
| $50,000 to $74,999 | 73,116 (10.2%) | 69,193 (18.3%) |
| $75,000 to $99,999 | 81,259 (11.4%) | 52,127 (13.8%) |
| $100,000 to $149,999 | 153,066 (21.4%) | 65,743 (17.4%) |
| $150,000 or more | 310,930 (43.4%) | 49,822 (13.2%) |
| Total | 716,195 (100.0%) | 378,676 (100.0%) |
Monthly Housing Cost Tiers in Area Code 301
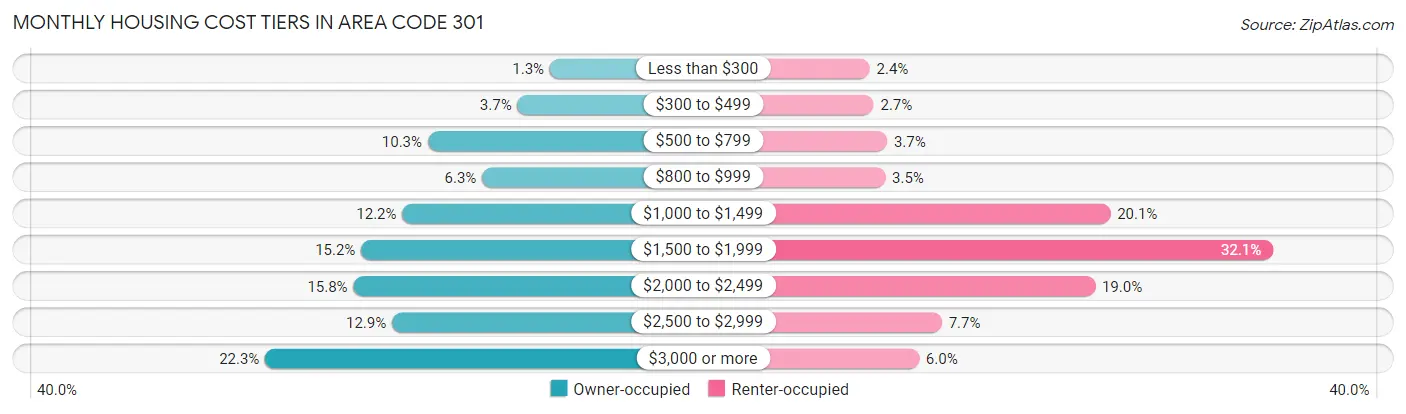
| Monthly Cost | Owner-occupied | Renter-occupied |
| Less than $300 | 9,358 (1.3%) | 8,975 (2.4%) |
| $300 to $499 | 26,524 (3.7%) | 10,074 (2.7%) |
| $500 to $799 | 73,795 (10.3%) | 13,839 (3.6%) |
| $800 to $999 | 45,093 (6.3%) | 13,302 (3.5%) |
| $1,000 to $1,499 | 87,254 (12.2%) | 76,059 (20.1%) |
| $1,500 to $1,999 | 108,933 (15.2%) | 121,475 (32.1%) |
| $2,000 to $2,499 | 113,000 (15.8%) | 71,849 (19.0%) |
| $2,500 to $2,999 | 92,650 (12.9%) | 29,091 (7.7%) |
| $3,000 or more | 159,588 (22.3%) | 22,719 (6.0%) |
| Total | 716,195 (100.0%) | 378,676 (100.0%) |
Physical Housing Characteristics in Area Code 301
Housing Structures in Area Code 301
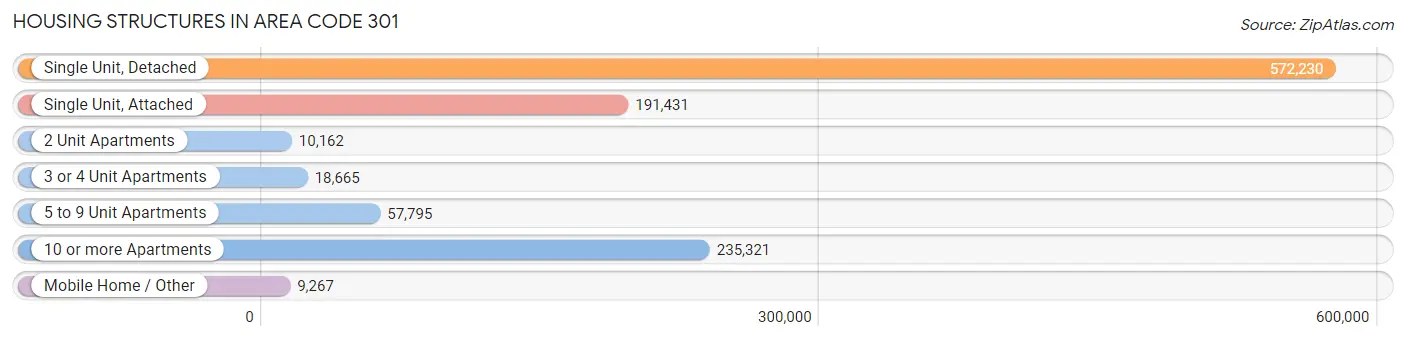
| Structure Type | # Housing Units | % Housing Units |
| Single Unit, Detached | 572,230 | 52.3% |
| Single Unit, Attached | 191,431 | 17.5% |
| 2 Unit Apartments | 10,162 | 0.9% |
| 3 or 4 Unit Apartments | 18,665 | 1.7% |
| 5 to 9 Unit Apartments | 57,795 | 5.3% |
| 10 or more Apartments | 235,321 | 21.5% |
| Mobile Home / Other | 9,267 | 0.9% |
| Total | 1,094,871 | 100.0% |
Housing Structures by Occupancy in Area Code 301
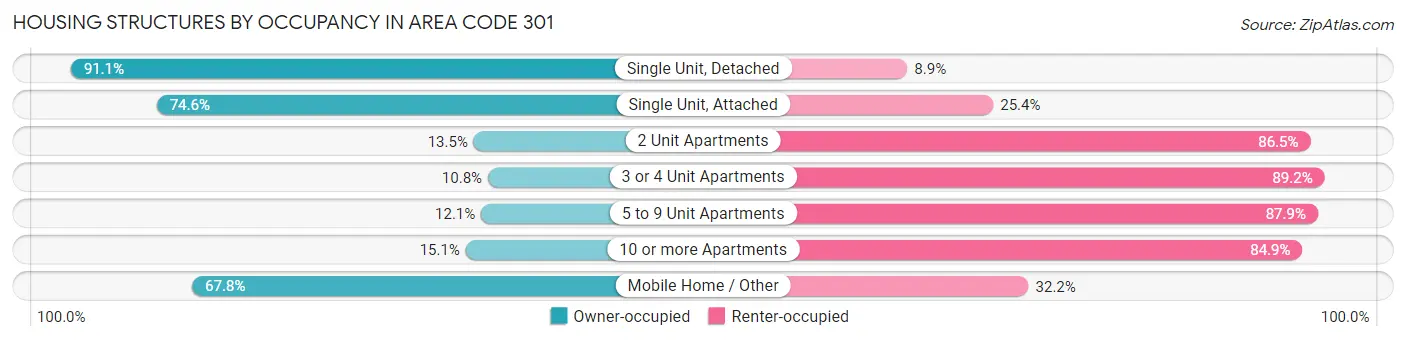
| Structure Type | Owner-occupied | Renter-occupied |
| Single Unit, Detached | 521,325 (91.1%) | 50,905 (8.9%) |
| Single Unit, Attached | 142,733 (74.6%) | 48,698 (25.4%) |
| 2 Unit Apartments | 1,374 (13.5%) | 8,788 (86.5%) |
| 3 or 4 Unit Apartments | 2,016 (10.8%) | 16,649 (89.2%) |
| 5 to 9 Unit Apartments | 6,994 (12.1%) | 50,801 (87.9%) |
| 10 or more Apartments | 35,474 (15.1%) | 199,847 (84.9%) |
| Mobile Home / Other | 6,279 (67.8%) | 2,988 (32.2%) |
| Total | 716,195 (65.4%) | 378,676 (34.6%) |
Housing Structures by Number of Rooms in Area Code 301
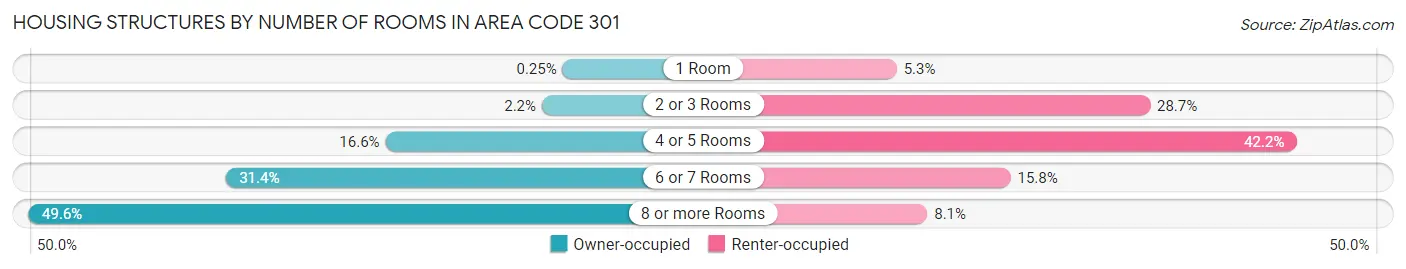
| Number of Rooms | Owner-occupied | Renter-occupied |
| 1 Room | 1,822 (0.3%) | 19,899 (5.2%) |
| 2 or 3 Rooms | 15,455 (2.2%) | 108,612 (28.7%) |
| 4 or 5 Rooms | 119,130 (16.6%) | 159,800 (42.2%) |
| 6 or 7 Rooms | 224,553 (31.4%) | 59,764 (15.8%) |
| 8 or more Rooms | 355,235 (49.6%) | 30,601 (8.1%) |
| Total | 716,195 (100.0%) | 378,676 (100.0%) |
Housing Structure by Heating Type in Area Code 301
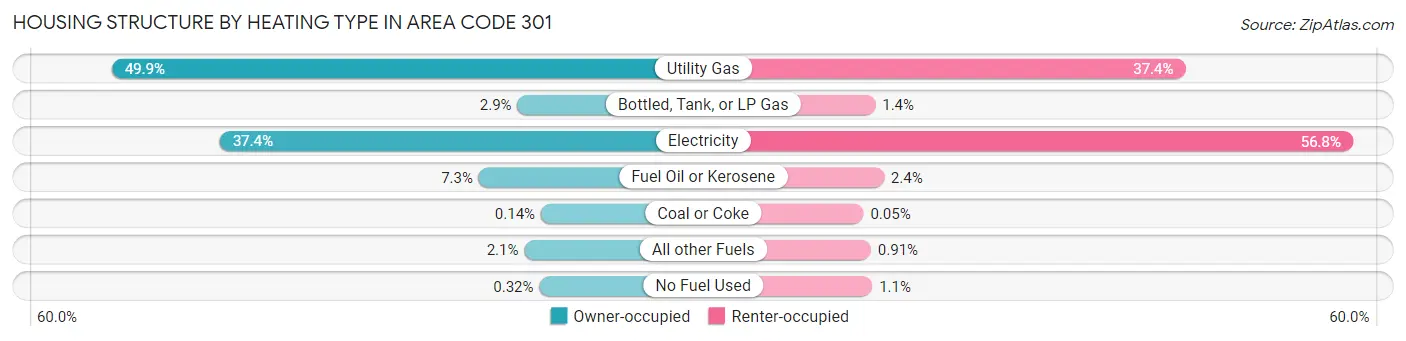
| Heating Type | Owner-occupied | Renter-occupied |
| Utility Gas | 357,411 (49.9%) | 141,487 (37.4%) |
| Bottled, Tank, or LP Gas | 20,484 (2.9%) | 5,376 (1.4%) |
| Electricity | 267,676 (37.4%) | 214,998 (56.8%) |
| Fuel Oil or Kerosene | 52,534 (7.3%) | 9,152 (2.4%) |
| Coal or Coke | 1,022 (0.1%) | 199 (0.1%) |
| All other Fuels | 14,771 (2.1%) | 3,456 (0.9%) |
| No Fuel Used | 2,297 (0.3%) | 4,008 (1.1%) |
| Total | 716,195 (100.0%) | 378,676 (100.0%) |
Household Vehicle Usage in Area Code 301
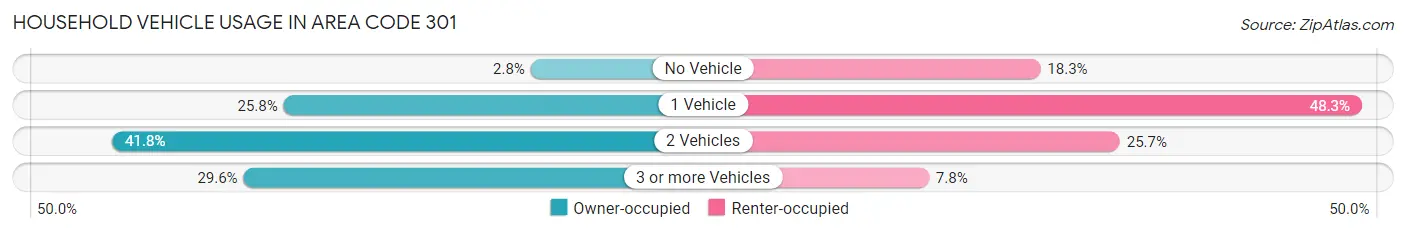
| Vehicles per Household | Owner-occupied | Renter-occupied |
| No Vehicle | 19,792 (2.8%) | 69,104 (18.2%) |
| 1 Vehicle | 184,989 (25.8%) | 182,703 (48.2%) |
| 2 Vehicles | 299,665 (41.8%) | 97,181 (25.7%) |
| 3 or more Vehicles | 211,749 (29.6%) | 29,688 (7.8%) |
| Total | 716,195 (100.0%) | 378,676 (100.0%) |
Real Estate & Mortgages in Area Code 301
Real Estate and Mortgage Overview in Area Code 301
| Characteristic | Without Mortgage | With Mortgage |
| Housing Units | 186,533 | 529,662 |
| Median Property Value | $59,432,301 | $65,901,800 |
| Median Household Income | $13,628,983 | $250,741 |
| Monthly Housing Costs | $107,397 | $157,727 |
| Real Estate Taxes | $603,234 | $11,031 |
Property Value by Mortgage Status in Area Code 301
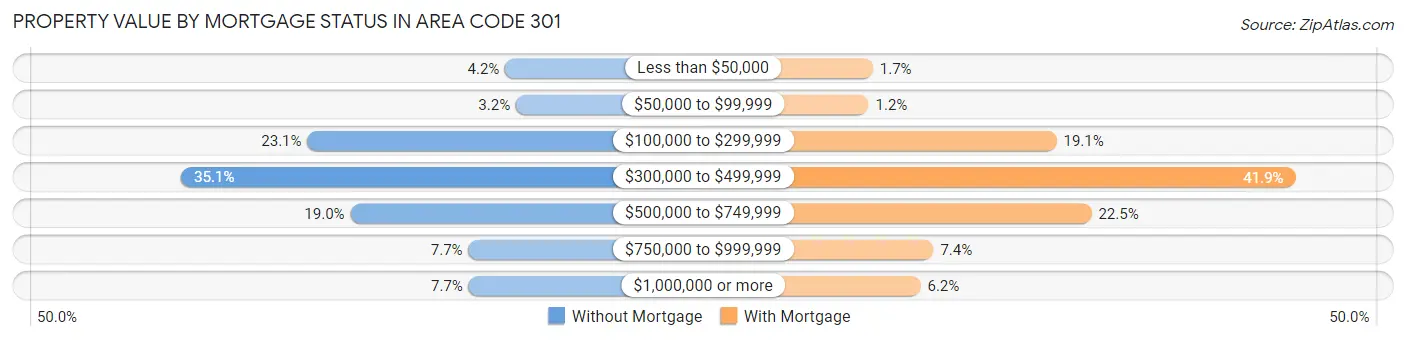
| Property Value | Without Mortgage | With Mortgage |
| Less than $50,000 | 7,886 (4.2%) | 8,750 (1.7%) |
| $50,000 to $99,999 | 5,972 (3.2%) | 6,560 (1.2%) |
| $100,000 to $299,999 | 43,025 (23.1%) | 101,360 (19.1%) |
| $300,000 to $499,999 | 65,465 (35.1%) | 221,884 (41.9%) |
| $500,000 to $749,999 | 35,380 (19.0%) | 118,998 (22.5%) |
| $750,000 to $999,999 | 14,420 (7.7%) | 39,304 (7.4%) |
| $1,000,000 or more | 14,385 (7.7%) | 32,806 (6.2%) |
| Total | 186,533 (100.0%) | 529,662 (100.0%) |
Household Income by Mortgage Status in Area Code 301
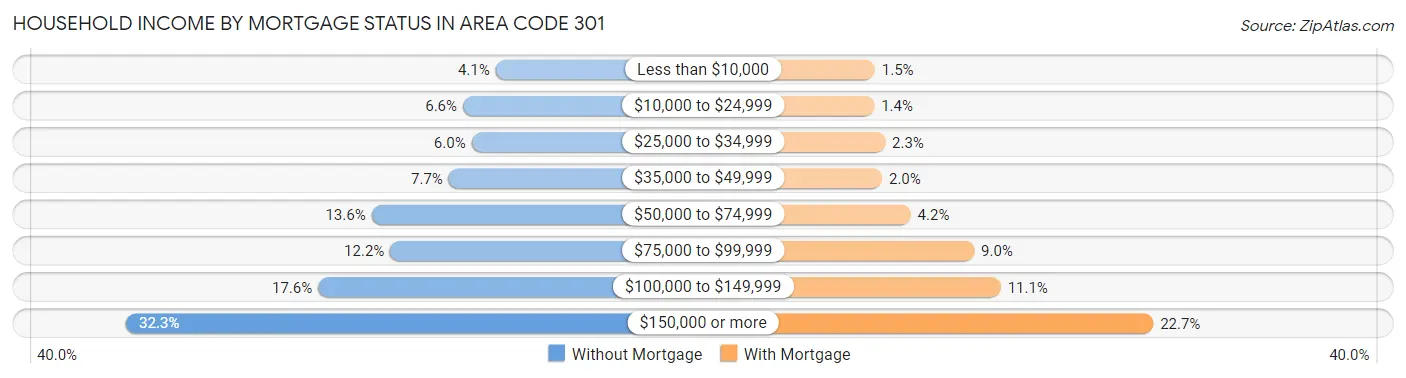
| Household Income | Without Mortgage | With Mortgage |
| Less than $10,000 | 7,682 (4.1%) | 7,776 (1.5%) |
| $10,000 to $24,999 | 12,326 (6.6%) | 7,520 (1.4%) |
| $25,000 to $34,999 | 11,098 (5.9%) | 11,902 (2.2%) |
| $35,000 to $49,999 | 14,343 (7.7%) | 10,701 (2.0%) |
| $50,000 to $74,999 | 25,309 (13.6%) | 22,252 (4.2%) |
| $75,000 to $99,999 | 22,673 (12.1%) | 47,807 (9.0%) |
| $100,000 to $149,999 | 32,913 (17.6%) | 58,586 (11.1%) |
| $150,000 or more | 60,189 (32.3%) | 120,153 (22.7%) |
| Total | 186,533 (100.0%) | 529,662 (100.0%) |
Property Value to Household Income Ratio in Area Code 301
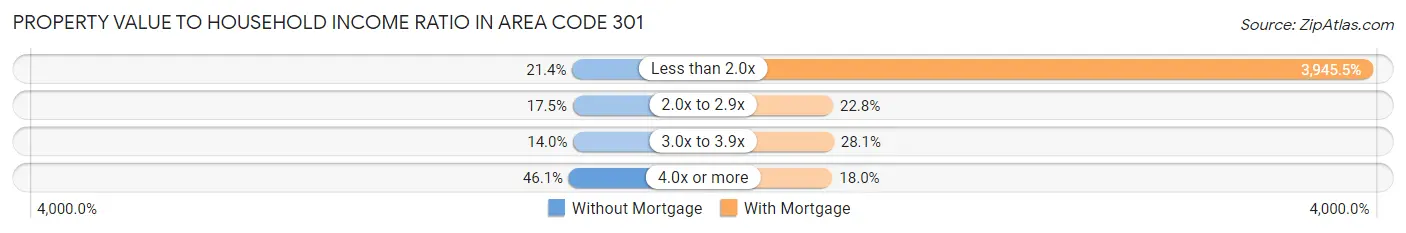
| Value-to-Income Ratio | Without Mortgage | With Mortgage |
| Less than 2.0x | 39,840 (21.4%) | 20,897,909 (3,945.5%) |
| 2.0x to 2.9x | 32,706 (17.5%) | 120,630 (22.8%) |
| 3.0x to 3.9x | 26,047 (14.0%) | 148,550 (28.1%) |
| 4.0x or more | 85,900 (46.1%) | 95,068 (17.9%) |
| Total | 186,533 (100.0%) | 529,662 (100.0%) |
Real Estate Taxes by Mortgage Status in Area Code 301
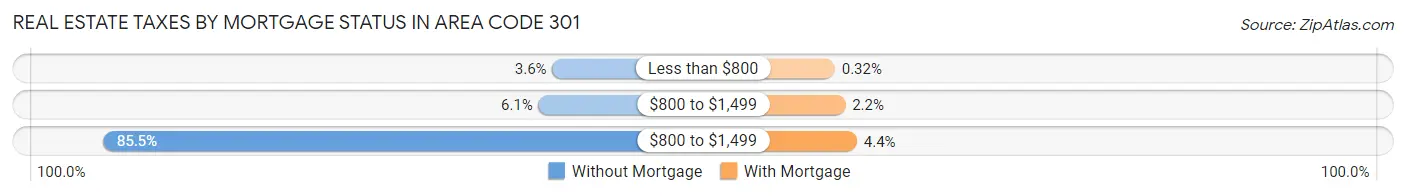
| Property Taxes | Without Mortgage | With Mortgage |
| Less than $800 | 6,704 (3.6%) | 1,681 (0.3%) |
| $800 to $1,499 | 11,379 (6.1%) | 11,744 (2.2%) |
| $800 to $1,499 | 159,526 (85.5%) | 23,015 (4.3%) |
| Total | 186,533 (100.0%) | 529,662 (100.0%) |
Health & Disability in Area Code 301
Health Insurance Coverage by Age in Area Code 301
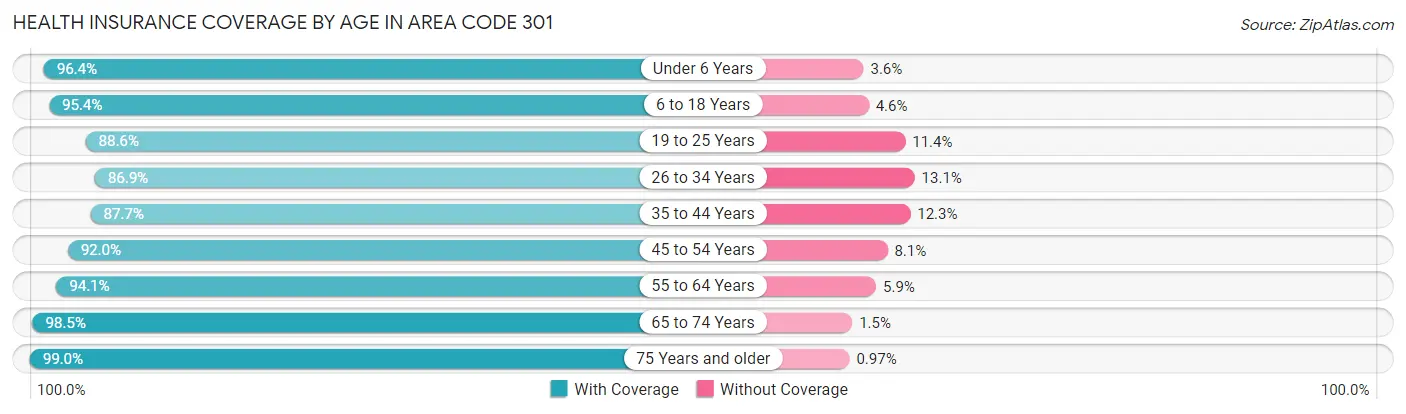
| Age Bracket | With Coverage | Without Coverage |
| Under 6 Years | 204,721 (96.4%) | 7,617 (3.6%) |
| 6 to 18 Years | 461,195 (95.4%) | 22,055 (4.6%) |
| 19 to 25 Years | 220,104 (88.6%) | 28,265 (11.4%) |
| 26 to 34 Years | 303,599 (86.9%) | 45,853 (13.1%) |
| 35 to 44 Years | 346,530 (87.7%) | 48,659 (12.3%) |
| 45 to 54 Years | 358,779 (91.9%) | 31,391 (8.1%) |
| 55 to 64 Years | 363,454 (94.1%) | 22,894 (5.9%) |
| 65 to 74 Years | 261,485 (98.5%) | 3,920 (1.5%) |
| 75 Years and older | 178,404 (99.0%) | 1,755 (1.0%) |
| Total | 2,698,271 (92.7%) | 212,409 (7.3%) |
Health Insurance Coverage by Citizenship Status in Area Code 301
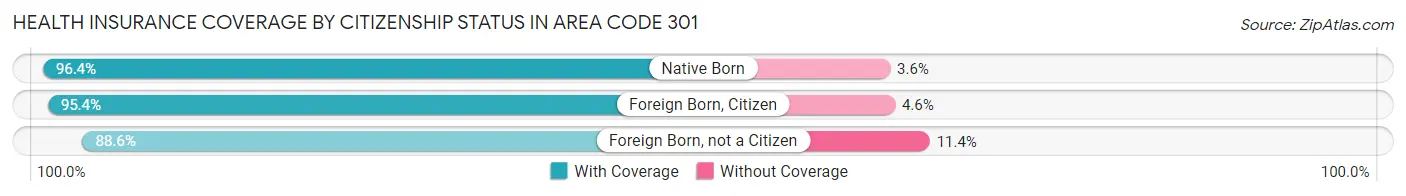
| Citizenship Status | With Coverage | Without Coverage |
| Native Born | 204,721 (96.4%) | 7,617 (3.6%) |
| Foreign Born, Citizen | 461,195 (95.4%) | 22,055 (4.6%) |
| Foreign Born, not a Citizen | 220,104 (88.6%) | 28,265 (11.4%) |
Health Insurance Coverage by Household Income in Area Code 301
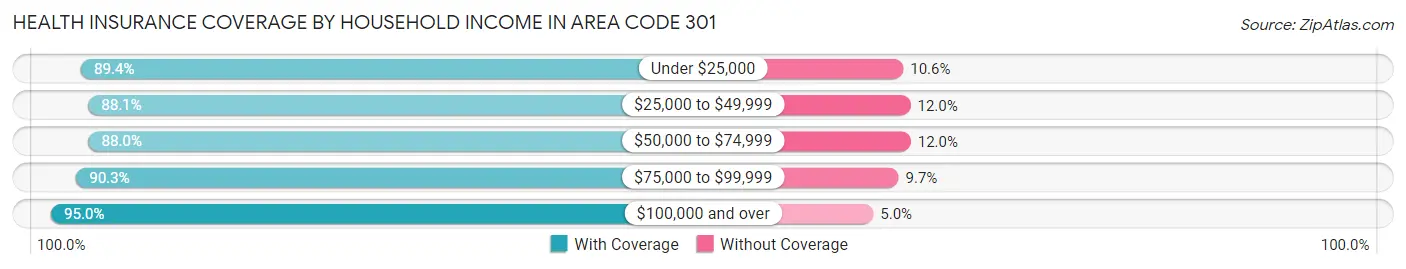
| Household Income | With Coverage | Without Coverage |
| Under $25,000 | 170,308 (89.4%) | 20,145 (10.6%) |
| $25,000 to $49,999 | 244,642 (88.0%) | 33,217 (11.9%) |
| $50,000 to $74,999 | 284,940 (88.0%) | 38,812 (12.0%) |
| $75,000 to $99,999 | 295,874 (90.3%) | 31,780 (9.7%) |
| $100,000 and over | 1,682,130 (95.0%) | 87,883 (5.0%) |
Public vs Private Health Insurance Coverage by Age in Area Code 301
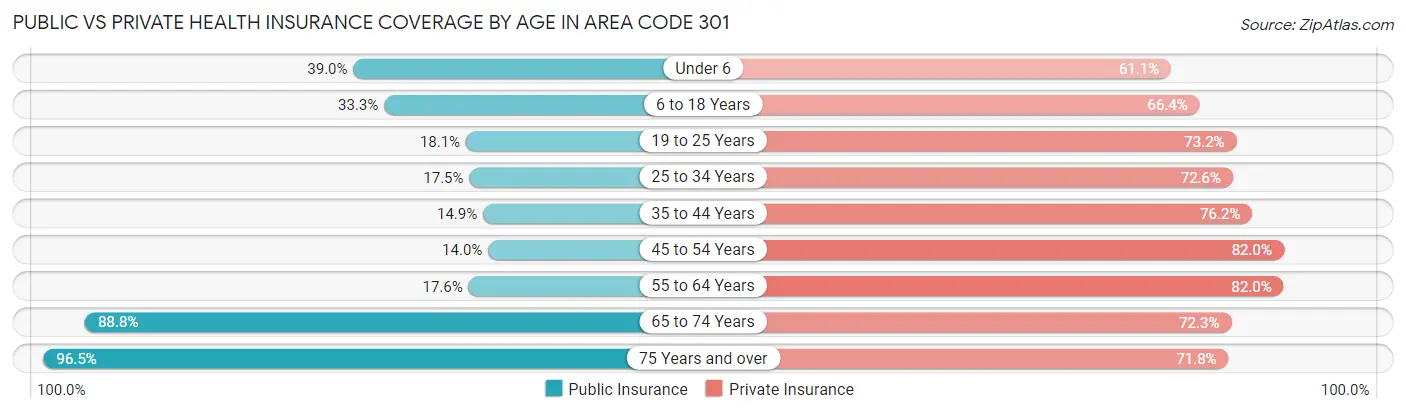
| Age Bracket | Public Insurance | Private Insurance |
| Under 6 | 82,775 (39.0%) | 129,778 (61.1%) |
| 6 to 18 Years | 160,774 (33.3%) | 320,977 (66.4%) |
| 19 to 25 Years | 44,913 (18.1%) | 181,905 (73.2%) |
| 25 to 34 Years | 60,962 (17.4%) | 253,604 (72.6%) |
| 35 to 44 Years | 58,904 (14.9%) | 301,058 (76.2%) |
| 45 to 54 Years | 54,481 (14.0%) | 320,005 (82.0%) |
| 55 to 64 Years | 67,955 (17.6%) | 316,799 (82.0%) |
| 65 to 74 Years | 235,628 (88.8%) | 191,825 (72.3%) |
| 75 Years and over | 173,850 (96.5%) | 129,281 (71.8%) |
| Total | 940,242 (32.3%) | 2,145,232 (73.7%) |
Disability Status by Sex by Age in Area Code 301
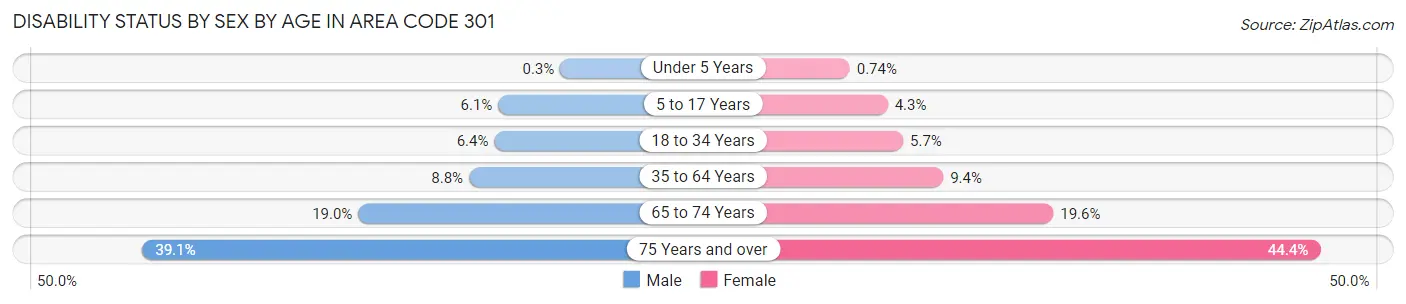
| Age Bracket | Male | Female |
| Under 5 Years | 275 (0.3%) | 639 (0.7%) |
| 5 to 17 Years | 14,860 (6.0%) | 10,042 (4.3%) |
| 18 to 34 Years | 20,181 (6.4%) | 18,210 (5.7%) |
| 35 to 64 Years | 49,777 (8.8%) | 56,786 (9.4%) |
| 65 to 74 Years | 22,987 (19.0%) | 28,401 (19.6%) |
| 75 Years and over | 28,052 (39.1%) | 48,099 (44.4%) |
Disability Class by Sex by Age in Area Code 301
Disability Class: Hearing Difficulty
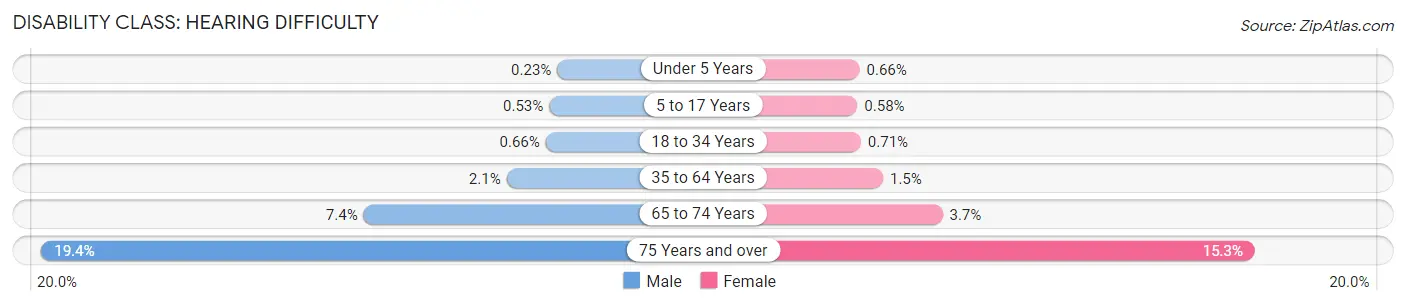
| Age Bracket | Male | Female |
| Under 5 Years | 212 (0.2%) | 572 (0.7%) |
| 5 to 17 Years | 1,290 (0.5%) | 1,378 (0.6%) |
| 18 to 34 Years | 2,085 (0.7%) | 2,287 (0.7%) |
| 35 to 64 Years | 11,975 (2.1%) | 9,248 (1.5%) |
| 65 to 74 Years | 8,955 (7.4%) | 5,417 (3.7%) |
| 75 Years and over | 13,913 (19.4%) | 16,615 (15.3%) |
Disability Class: Vision Difficulty
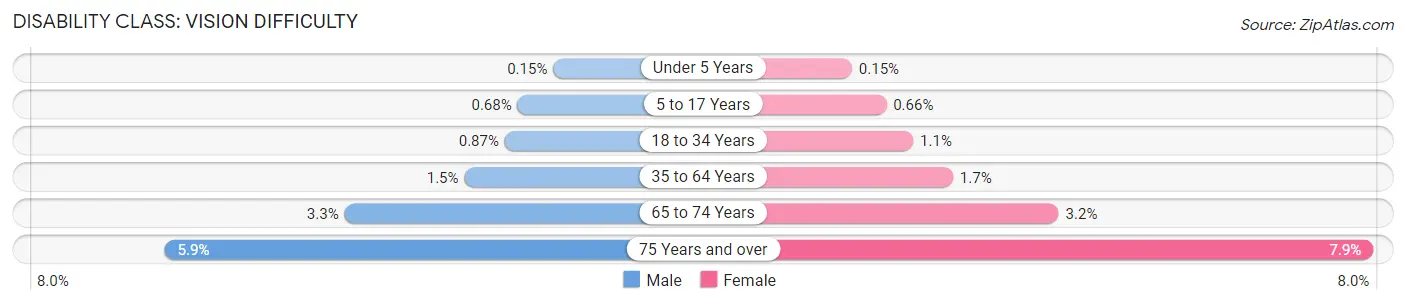
| Age Bracket | Male | Female |
| Under 5 Years | 133 (0.2%) | 128 (0.2%) |
| 5 to 17 Years | 1,667 (0.7%) | 1,553 (0.7%) |
| 18 to 34 Years | 2,747 (0.9%) | 3,395 (1.1%) |
| 35 to 64 Years | 8,373 (1.5%) | 9,965 (1.7%) |
| 65 to 74 Years | 3,926 (3.3%) | 4,657 (3.2%) |
| 75 Years and over | 4,248 (5.9%) | 8,550 (7.9%) |
Disability Class: Cognitive Difficulty
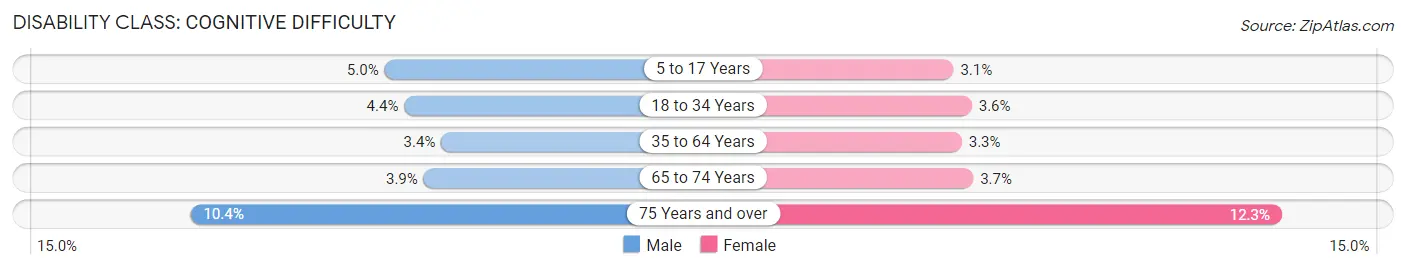
| Age Bracket | Male | Female |
| 5 to 17 Years | 12,235 (5.0%) | 7,331 (3.1%) |
| 18 to 34 Years | 13,945 (4.4%) | 11,580 (3.6%) |
| 35 to 64 Years | 19,307 (3.4%) | 20,154 (3.3%) |
| 65 to 74 Years | 4,702 (3.9%) | 5,297 (3.7%) |
| 75 Years and over | 7,457 (10.4%) | 13,270 (12.2%) |
Disability Class: Ambulatory Difficulty
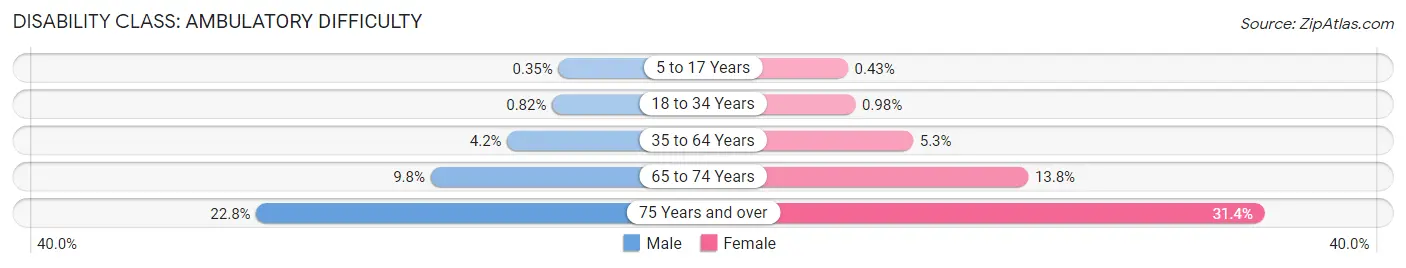
| Age Bracket | Male | Female |
| 5 to 17 Years | 867 (0.4%) | 1,014 (0.4%) |
| 18 to 34 Years | 2,594 (0.8%) | 3,128 (1.0%) |
| 35 to 64 Years | 23,599 (4.2%) | 31,813 (5.3%) |
| 65 to 74 Years | 11,885 (9.8%) | 19,990 (13.8%) |
| 75 Years and over | 16,368 (22.8%) | 34,022 (31.4%) |
Disability Class: Self-Care Difficulty
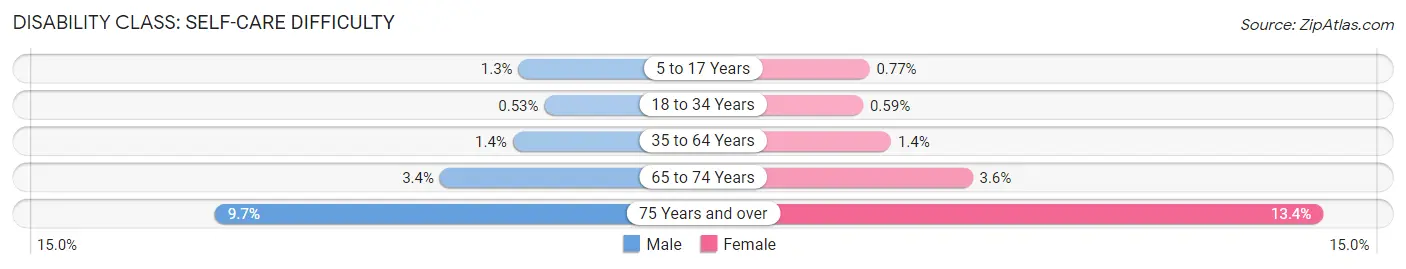
| Age Bracket | Male | Female |
| 5 to 17 Years | 3,071 (1.3%) | 1,814 (0.8%) |
| 18 to 34 Years | 1,668 (0.5%) | 1,876 (0.6%) |
| 35 to 64 Years | 8,002 (1.4%) | 8,261 (1.4%) |
| 65 to 74 Years | 4,153 (3.4%) | 5,267 (3.6%) |
| 75 Years and over | 6,968 (9.7%) | 14,520 (13.4%) |
Technology Access in Area Code 301
Computing Device Access in Area Code 301
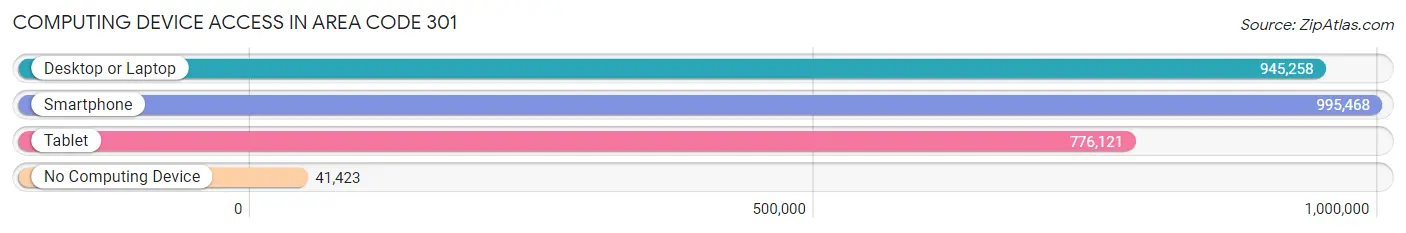
| Device Type | # Households | % Households |
| Desktop or Laptop | 945,258 | 86.3% |
| Smartphone | 995,468 | 90.9% |
| Tablet | 776,121 | 70.9% |
| No Computing Device | 41,423 | 3.8% |
| Total | 1,094,871 | 100.0% |
Internet Access in Area Code 301
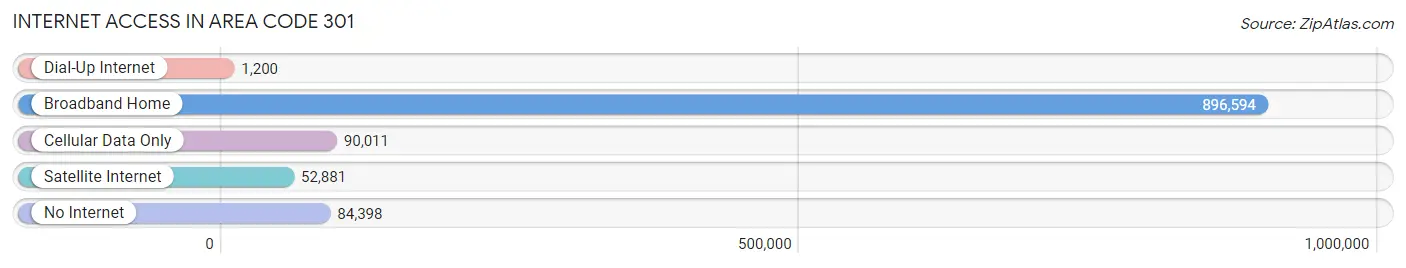
| Internet Type | # Households | % Households |
| Dial-Up Internet | 1,200 | 0.1% |
| Broadband Home | 896,594 | 81.9% |
| Cellular Data Only | 90,011 | 8.2% |
| Satellite Internet | 52,881 | 4.8% |
| No Internet | 84,398 | 7.7% |
| Total | 1,094,871 | 100.0% |
Area Code 301 Summary
Geography
Area code 301 is a telephone area code in the North American Numbering Plan (NANP) for the state of Maryland. It serves the entire state, including the cities of Baltimore, Frederick, Gaithersburg, Rockville, and Silver Spring.
Social
Area code 301 is a major hub for social media activity in Maryland. It is home to many popular social media accounts, including those of celebrities, politicians, and businesses. It is also home to many popular online communities, such as Reddit and Twitter.
Economics
Area code 301 is a major economic center in Maryland. It is home to many large businesses, including the headquarters of Marriott International, Lockheed Martin, and Discovery Communications. It is also home to many smaller businesses, such as restaurants, retail stores, and professional services.
Demographics
Area code 301 is home to a diverse population. According to the U.S. Census Bureau, the population of the area code is approximately 2.5 million people. The population is made up of a variety of ethnicities, including African American, Hispanic, Asian, and White. The median household income is approximately $75,000.
Common Questions
What is Per Capita Income in Area Code 301?
Per Capita income in Area Code 301 is $51,892.
What is the Median Family Income in Area Code 301?
Median Family Income in Area Code 301 is $130,599.
What is the Median Household income in Area Code 301?
Median Household Income in Area Code 301 is $113,771.
What is Income or Wage Gap in Area Code 301?
Income or Wage Gap in Area Code 301 is 25.4%.
Women in Area Code 301 earn 74.6 cents for every dollar earned by a man.
What is Family Income Deficit in Area Code 301?
Family Income Deficit in Area Code 301 is $11,381.
Families that are below poverty line in Area Code 301 earn $11,381 less on average than the poverty threshold level.
What is Inequality or Gini Index in Area Code 301?
Inequality or Gini Index in Area Code 301 is 59.99.
What is the Total Population of Area Code 301?
Total Population of Area Code 301 is 2,952,943.
What is the Total Male Population of Area Code 301?
Total Male Population of Area Code 301 is 1,441,505.
What is the Total Female Population of Area Code 301?
Total Female Population of Area Code 301 is 1,511,438.
What is the Ratio of Males per 100 Females in Area Code 301?
There are 95.37 Males per 100 Females in Area Code 301.
What is the Ratio of Females per 100 Males in Area Code 301?
There are 104.85 Females per 100 Males in Area Code 301.
What is the Median Population Age in Area Code 301?
Median Population Age in Area Code 301 is 41.3 Years.
What is the Average Family Size in Area Code 301
Average Family Size in Area Code 301 is 3.2 People.
What is the Average Household Size in Area Code 301
Average Household Size in Area Code 301 is 2.7 People.
How Large is the Labor Force in Area Code 301?
There are 1,580,161 People in the Labor Forcein in Area Code 301.
What is the Percentage of People in the Labor Force in Area Code 301?
66.8% of People are in the Labor Force in Area Code 301.
What is the Unemployment Rate in Area Code 301?
Unemployment Rate in Area Code 301 is 5.6%.