Area Code 240 Map & Demographics
Area Code 240 Map
Area Code 240 Overview
$50,925
PER CAPITA INCOME
$134,275
AVG FAMILY INCOME
$116,360
AVG HOUSEHOLD INCOME
26.1%
WAGE / INCOME GAP [ % ]
73.9¢/ $1
WAGE / INCOME GAP [ $ ]
$11,442
FAMILY INCOME DEFICIT
62.24
INEQUALITY / GINI INDEX
2,725,859
TOTAL POPULATION
1,330,963
MALE POPULATION
1,394,896
FEMALE POPULATION
95.42
MALES / 100 FEMALES
104.80
FEMALES / 100 MALES
41.8
MEDIAN AGE
3.2
AVG FAMILY SIZE
2.7
AVG HOUSEHOLD SIZE
1,425,680
LABOR FORCE [ PEOPLE ]
65.3%
PERCENT IN LABOR FORCE
6.7%
UNEMPLOYMENT RATE
Nearby Area Codes
Income in Area Code 240
Income Overview in Area Code 240
Per Capita Income in Area Code 240 is $50,925, while median incomes of families and households are $134,275 and $116,360 respectively.
| Characteristic | Number | Measure |
| Per Capita Income | 2,725,859 | $50,925 |
| Median Family Income | 672,791 | $134,275 |
| Mean Family Income | 672,791 | $24,397,775 |
| Median Household Income | 1,003,532 | $116,360 |
| Mean Household Income | 1,003,532 | $21,973,092 |
| Income Deficit | 672,791 | $11,442 |
| Wage / Income Gap (%) | 2,725,859 | 26.11% |
| Wage / Income Gap ($) | 2,725,859 | 73.89¢ per $1 |
| Gini / Inequality Index | 2,725,859 | 62.24 |
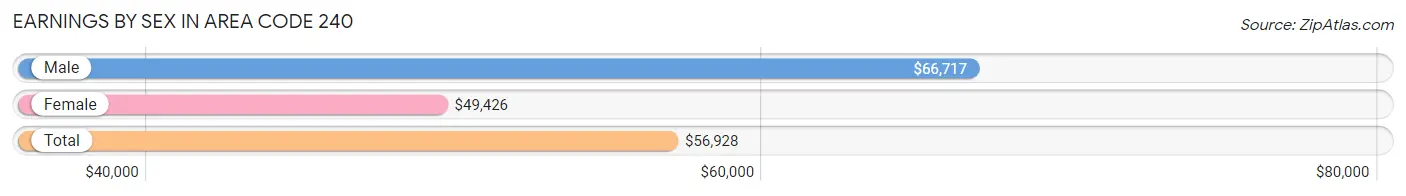
Earnings by Sex in Area Code 240
Average Earnings in Area Code 240 are $56,928, $66,717 for men and $49,426 for women, a difference of 25.9%.
| Sex | Number | Average Earnings |
| Male | 794,626 (51.1%) | $66,717 |
| Female | 761,316 (48.9%) | $49,426 |
| Total | 1,555,942 (100.0%) | $56,928 |
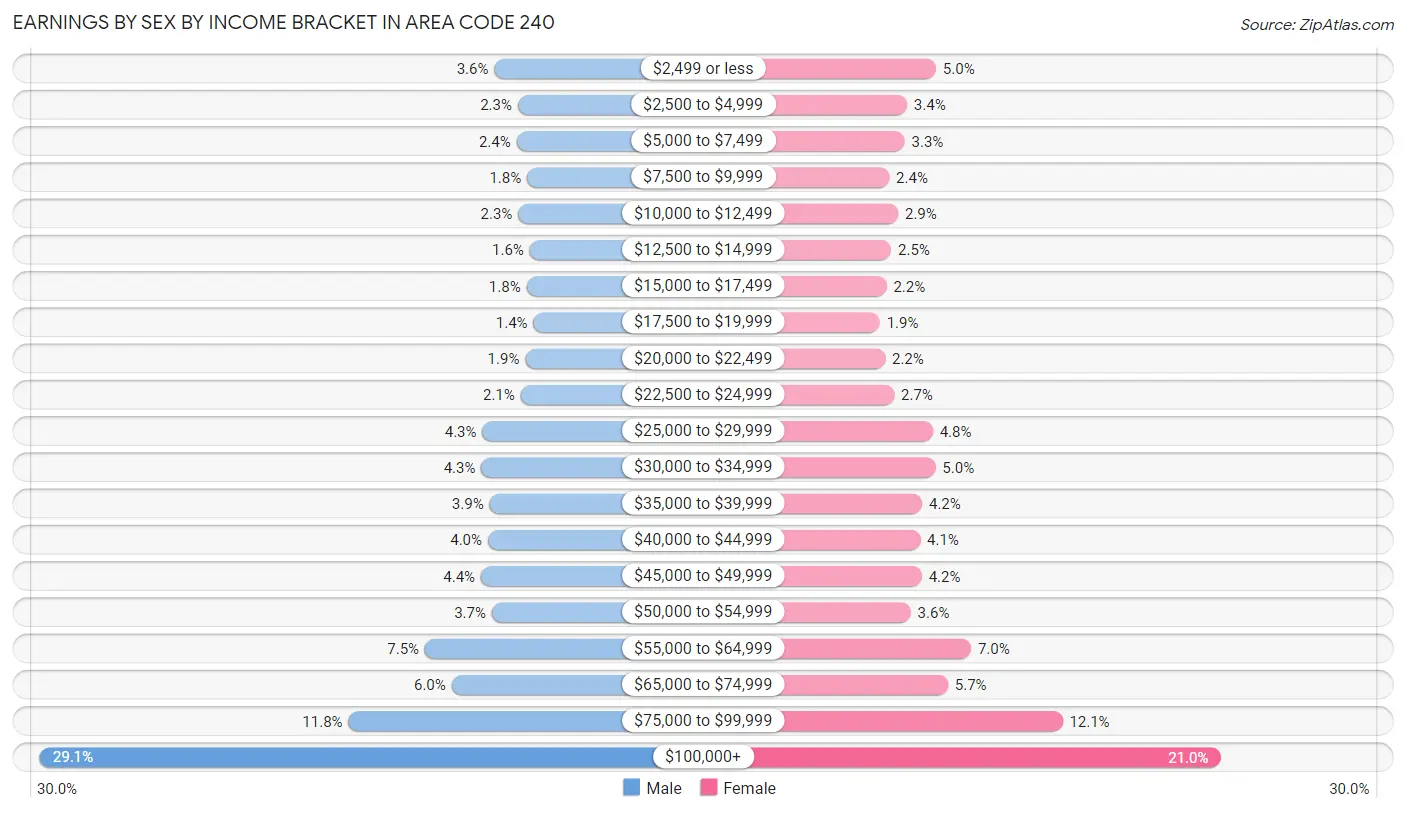
Earnings by Sex by Income Bracket in Area Code 240
The most common earnings brackets in Area Code 240 are $100,000+ for men (231,569 | 29.1%) and $100,000+ for women (159,822 | 21.0%).
| Income | Male | Female |
| $2,499 or less | 28,643 (3.6%) | 38,140 (5.0%) |
| $2,500 to $4,999 | 18,099 (2.3%) | 25,756 (3.4%) |
| $5,000 to $7,499 | 18,661 (2.4%) | 24,729 (3.3%) |
| $7,500 to $9,999 | 13,950 (1.8%) | 18,144 (2.4%) |
| $10,000 to $12,499 | 17,936 (2.3%) | 21,938 (2.9%) |
| $12,500 to $14,999 | 12,791 (1.6%) | 18,953 (2.5%) |
| $15,000 to $17,499 | 14,256 (1.8%) | 16,949 (2.2%) |
| $17,500 to $19,999 | 11,125 (1.4%) | 14,066 (1.8%) |
| $20,000 to $22,499 | 14,783 (1.9%) | 16,349 (2.1%) |
| $22,500 to $24,999 | 16,864 (2.1%) | 20,233 (2.7%) |
| $25,000 to $29,999 | 33,963 (4.3%) | 36,753 (4.8%) |
| $30,000 to $34,999 | 34,406 (4.3%) | 37,941 (5.0%) |
| $35,000 to $39,999 | 30,788 (3.9%) | 32,215 (4.2%) |
| $40,000 to $44,999 | 31,462 (4.0%) | 31,350 (4.1%) |
| $45,000 to $49,999 | 34,528 (4.3%) | 32,036 (4.2%) |
| $50,000 to $54,999 | 29,708 (3.7%) | 27,311 (3.6%) |
| $55,000 to $64,999 | 59,634 (7.5%) | 53,110 (7.0%) |
| $65,000 to $74,999 | 47,670 (6.0%) | 43,270 (5.7%) |
| $75,000 to $99,999 | 93,790 (11.8%) | 92,251 (12.1%) |
| $100,000+ | 231,569 (29.1%) | 159,822 (21.0%) |
| Total | 794,626 (100.0%) | 761,316 (100.0%) |
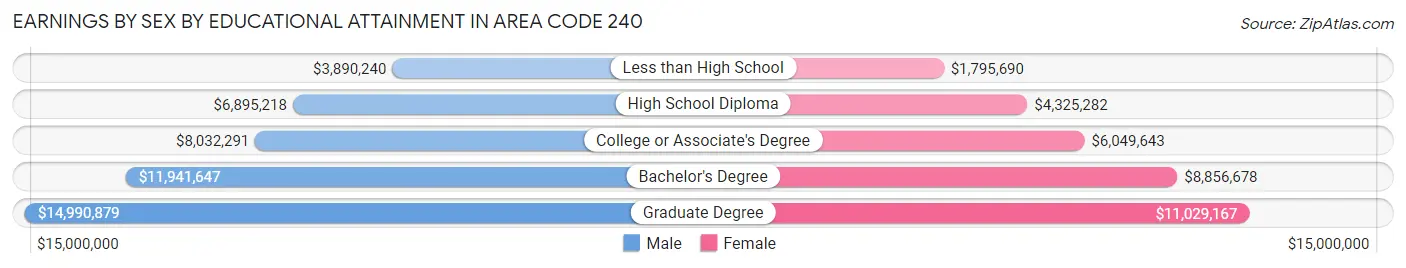
Earnings by Sex by Educational Attainment in Area Code 240
Average earnings in Area Code 240 are $11,611,069 for men and $8,303,011 for women, a difference of 28.5%. Men with an educational attainment of graduate degree enjoy the highest average annual earnings of $14,990,879, while those with less than high school education earn the least with $3,890,240. Women with an educational attainment of graduate degree earn the most with the average annual earnings of $11,029,167, while those with less than high school education have the smallest earnings of $1,795,690.
| Educational Attainment | Male Income | Female Income |
| Less than High School | $3,890,240 | $1,795,690 |
| High School Diploma | $6,895,218 | $4,325,282 |
| College or Associate's Degree | $8,032,291 | $6,049,643 |
| Bachelor's Degree | $11,941,647 | $8,856,678 |
| Graduate Degree | $14,990,879 | $11,029,167 |
| Total | $11,611,069 | $8,303,011 |
Family Income in Area Code 240
Family Income Brackets in Area Code 240
According to the Area Code 240 family income data, there are 27,408,833 families falling into the $200,000+ income range, which is the most common income bracket and makes up 4,073.9% of all families. Conversely, the $10,000 to $14,999 income bracket is the least frequent group with only 928,452 families (138.0%) belonging to this category.
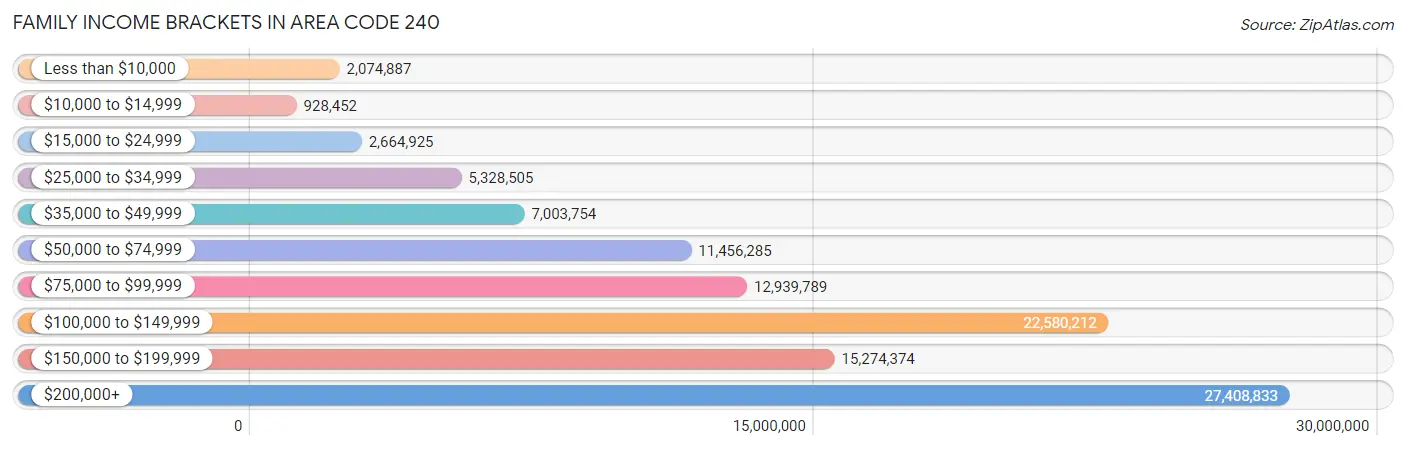
| Income Bracket | # Families | % Families |
| Less than $10,000 | 2,074,887 | 308.4% |
| $10,000 to $14,999 | 928,452 | 138.0% |
| $15,000 to $24,999 | 2,664,925 | 396.1% |
| $25,000 to $34,999 | 5,328,505 | 792.0% |
| $35,000 to $49,999 | 7,003,754 | 1,041.0% |
| $50,000 to $74,999 | 11,456,285 | 1,702.8% |
| $75,000 to $99,999 | 12,939,789 | 1,923.3% |
| $100,000 to $149,999 | 22,580,212 | 3,356.2% |
| $150,000 to $199,999 | 15,274,374 | 2,270.3% |
| $200,000+ | 27,408,833 | 4,073.9% |
Family Income by Famaliy Size in Area Code 240
7+ person families (13,969 | 2.1%) account for the highest median family income in Area Code 240 with $164,567 per family, while 2-person families (280,862 | 41.7%) have the highest median income of $59,917 per family member.
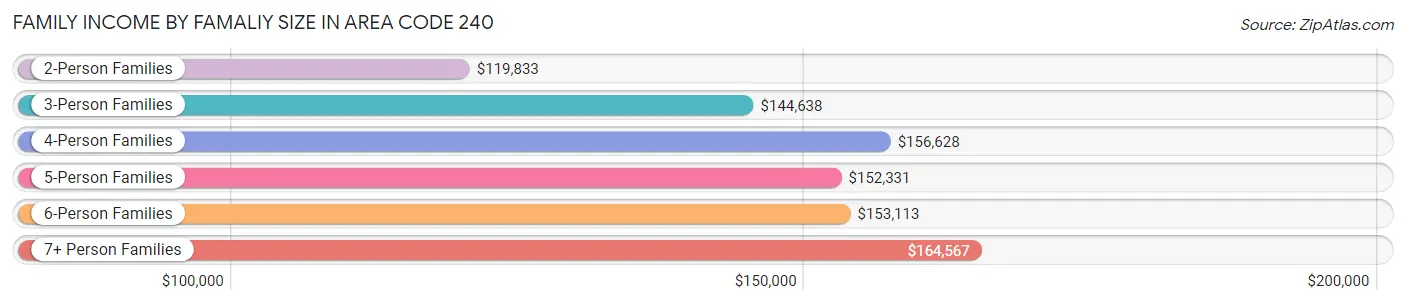
| Income Bracket | # Families | Median Income |
| 2-Person Families | 280,862 (41.7%) | $119,833 |
| 3-Person Families | 160,028 (23.8%) | $144,638 |
| 4-Person Families | 136,884 (20.3%) | $156,628 |
| 5-Person Families | 58,331 (8.7%) | $152,331 |
| 6-Person Families | 22,717 (3.4%) | $153,113 |
| 7+ Person Families | 13,969 (2.1%) | $164,567 |
| Total | 672,791 (100.0%) | $134,275 |
Family Income by Number of Earners in Area Code 240
The median family income in Area Code 240 is $134,275, with families comprising 3+ earners (105,481) having the highest median family income of $182,727, while families with no earners (65,662) have the lowest median family income of $76,475, accounting for 15.7% and 9.8% of families, respectively.
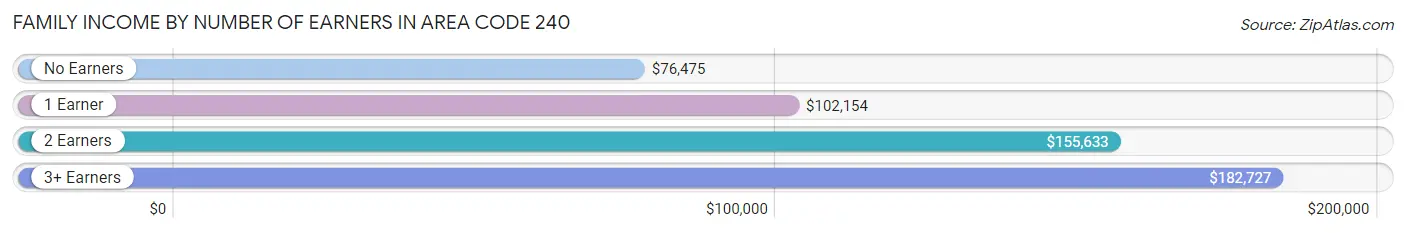
| Number of Earners | # Families | Median Income |
| No Earners | 65,662 (9.8%) | $76,475 |
| 1 Earner | 198,176 (29.5%) | $102,154 |
| 2 Earners | 303,472 (45.1%) | $155,633 |
| 3+ Earners | 105,481 (15.7%) | $182,727 |
| Total | 672,791 (100.0%) | $134,275 |
Household Income in Area Code 240
Household Income Brackets in Area Code 240
With 34,454,264 households falling in the category, the $200,000+ income range is the most frequent in Area Code 240, accounting for 3,433.3% of all households. In contrast, only 3,285,564 households (327.4%) fall into the $10,000 to $14,999 income bracket, making it the least populous group.
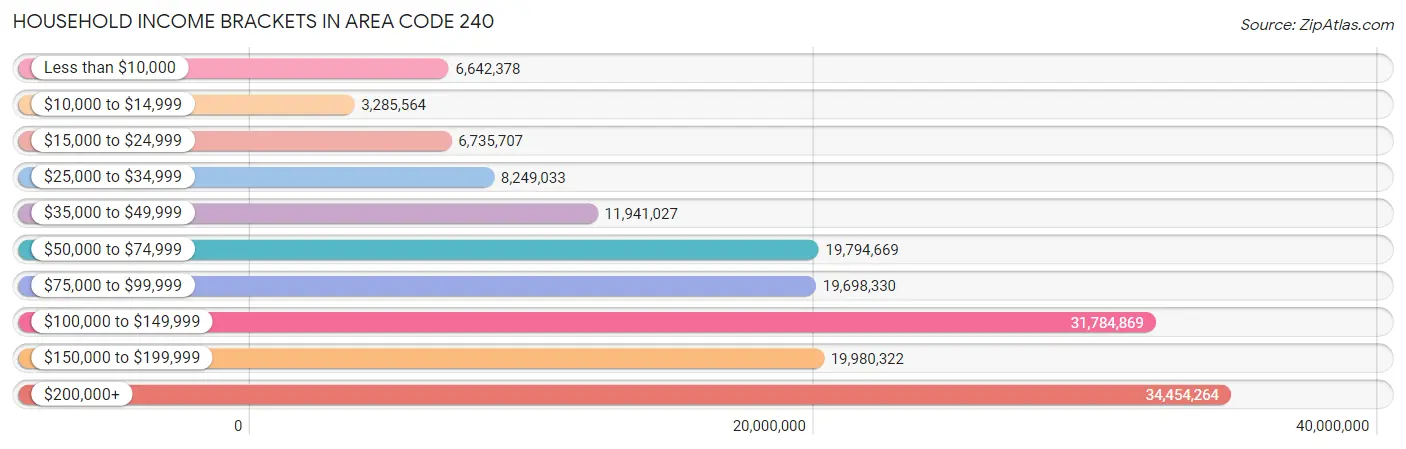
| Income Bracket | # Households | % Households |
| Less than $10,000 | 6,642,378 | 661.9% |
| $10,000 to $14,999 | 3,285,564 | 327.4% |
| $15,000 to $24,999 | 6,735,707 | 671.2% |
| $25,000 to $34,999 | 8,249,033 | 822.0% |
| $35,000 to $49,999 | 11,941,027 | 1,189.9% |
| $50,000 to $74,999 | 19,794,669 | 1,972.5% |
| $75,000 to $99,999 | 19,698,330 | 1,962.9% |
| $100,000 to $149,999 | 31,784,869 | 3,167.3% |
| $150,000 to $199,999 | 19,980,322 | 1,991.0% |
| $200,000+ | 34,454,264 | 3,433.3% |
Household Income by Householder Age in Area Code 240
The median household income in Area Code 240 is $116,360, with the highest median household income of $142,091 found in the 45 to 64 years age bracket for the primary householder. A total of 406,461 households (40.5%) fall into this category. Meanwhile, the 15 to 24 years age bracket for the primary householder has the lowest median household income of $65,532, with 25,369 households (2.5%) in this group.
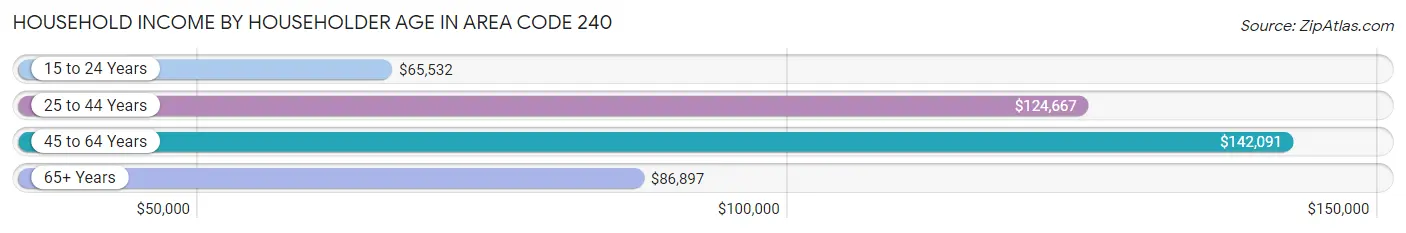
| Income Bracket | # Households | Median Income |
| 15 to 24 Years | 25,369 (2.5%) | $65,532 |
| 25 to 44 Years | 329,661 (32.9%) | $124,667 |
| 45 to 64 Years | 406,461 (40.5%) | $142,091 |
| 65+ Years | 242,041 (24.1%) | $86,897 |
| Total | 1,003,532 (100.0%) | $116,360 |
Poverty in Area Code 240
Income Below Poverty by Sex and Age in Area Code 240
With 7.3% poverty level for males and 9.1% for females among the residents of Area Code 240, under 5 year old males and 18 to 24 year old females are the most vulnerable to poverty, with 8,991 males (11.1%) and 16,835 females (15.2%) in their respective age groups living below the poverty level.
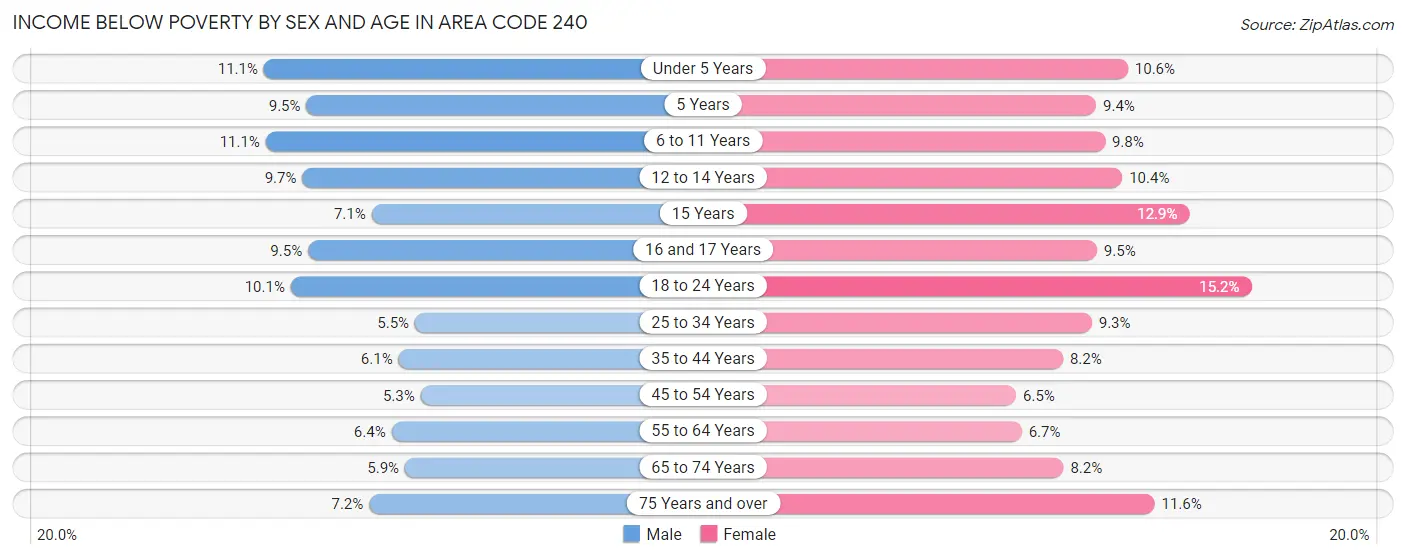
| Age Bracket | Male | Female |
| Under 5 Years | 8,991 (11.1%) | 8,305 (10.6%) |
| 5 Years | 1,529 (9.5%) | 1,441 (9.4%) |
| 6 to 11 Years | 11,691 (11.1%) | 9,597 (9.8%) |
| 12 to 14 Years | 5,150 (9.7%) | 5,234 (10.4%) |
| 15 Years | 1,280 (7.1%) | 2,260 (12.9%) |
| 16 and 17 Years | 3,209 (9.5%) | 3,093 (9.5%) |
| 18 to 24 Years | 11,367 (10.1%) | 16,835 (15.2%) |
| 25 to 34 Years | 9,837 (5.5%) | 16,717 (9.3%) |
| 35 to 44 Years | 11,150 (6.1%) | 15,551 (8.2%) |
| 45 to 54 Years | 9,300 (5.3%) | 12,179 (6.5%) |
| 55 to 64 Years | 10,934 (6.4%) | 12,445 (6.7%) |
| 65 to 74 Years | 6,487 (5.9%) | 10,773 (8.2%) |
| 75 Years and over | 4,510 (7.2%) | 11,067 (11.6%) |
| Total | 95,435 (7.3%) | 125,497 (9.1%) |
Income Above Poverty by Sex and Age in Area Code 240
According to the poverty statistics in Area Code 240, males aged 45 to 54 years and females aged 45 to 54 years are the age groups that are most secure financially, with 94.7% of males and 93.5% of females in these age groups living above the poverty line.
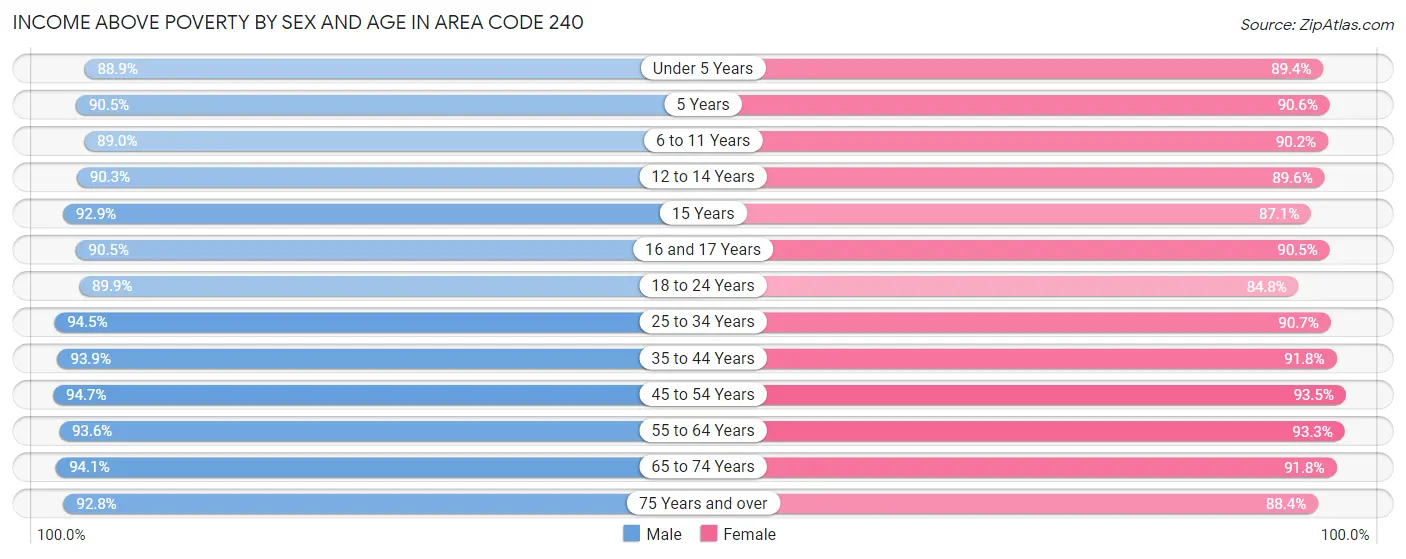
| Age Bracket | Male | Female |
| Under 5 Years | 71,872 (88.9%) | 69,921 (89.4%) |
| 5 Years | 14,503 (90.5%) | 13,824 (90.6%) |
| 6 to 11 Years | 94,155 (88.9%) | 88,639 (90.2%) |
| 12 to 14 Years | 47,986 (90.3%) | 45,057 (89.6%) |
| 15 Years | 16,700 (92.9%) | 15,257 (87.1%) |
| 16 and 17 Years | 30,630 (90.5%) | 29,584 (90.5%) |
| 18 to 24 Years | 100,937 (89.9%) | 93,937 (84.8%) |
| 25 to 34 Years | 168,557 (94.5%) | 163,367 (90.7%) |
| 35 to 44 Years | 170,992 (93.9%) | 173,794 (91.8%) |
| 45 to 54 Years | 166,315 (94.7%) | 176,065 (93.5%) |
| 55 to 64 Years | 160,359 (93.6%) | 173,834 (93.3%) |
| 65 to 74 Years | 103,862 (94.1%) | 120,102 (91.8%) |
| 75 Years and over | 58,018 (92.8%) | 84,219 (88.4%) |
| Total | 1,204,886 (92.7%) | 1,247,600 (90.9%) |
Income Below Poverty Among Married-Couple Families in Area Code 240
The poverty statistics for married-couple families in Area Code 240 show that 3.0% or 14,368 of the total 482,164 families live below the poverty line. Families with 5 or more children have the highest poverty rate of 12.2%, comprising of 314 families. On the other hand, families with no children have the lowest poverty rate of 2.4%, which includes 6,386 families.
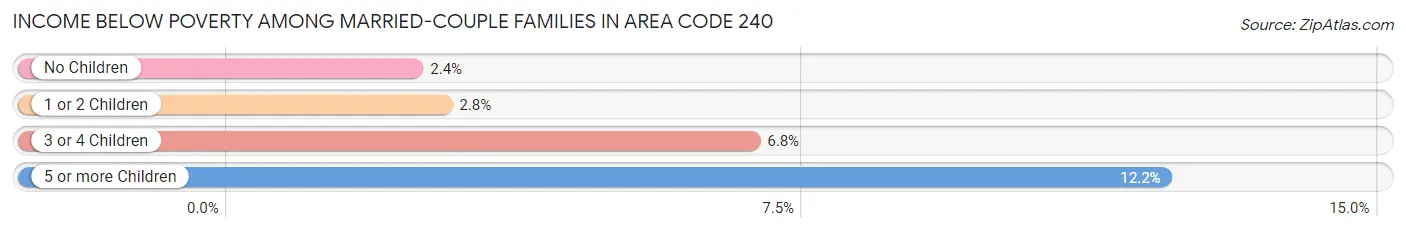
| Children | Above Poverty | Below Poverty |
| No Children | 257,221 (97.6%) | 6,386 (2.4%) |
| 1 or 2 Children | 170,728 (97.2%) | 4,915 (2.8%) |
| 3 or 4 Children | 37,587 (93.2%) | 2,753 (6.8%) |
| 5 or more Children | 2,260 (87.8%) | 314 (12.2%) |
| Total | 467,796 (97.0%) | 14,368 (3.0%) |
Income Below Poverty Among Single-Parent Households in Area Code 240
According to the poverty data in Area Code 240, 8.0% or 4,129 single-father households and 13.7% or 19,127 single-mother households are living below the poverty line. Among single-father households, those with 5 or more children have the highest poverty rate, with 68 households (26.5%) experiencing poverty. Likewise, among single-mother households, those with 5 or more children have the highest poverty rate, with 392 households (47.4%) falling below the poverty line.
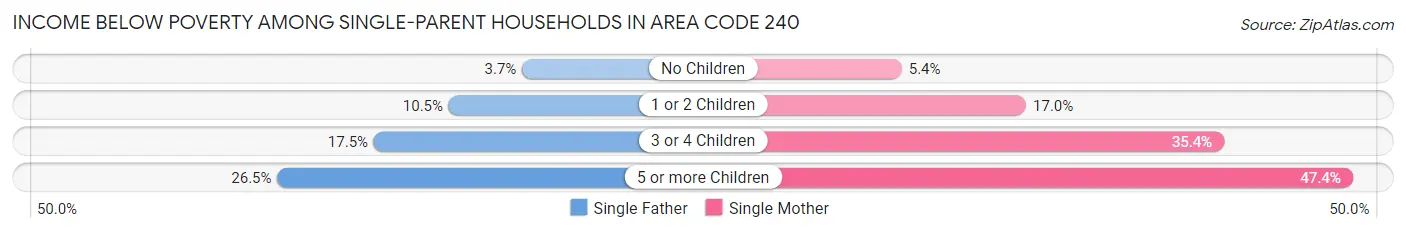
| Children | Single Father | Single Mother |
| No Children | 866 (3.7%) | 3,253 (5.4%) |
| 1 or 2 Children | 2,417 (10.5%) | 11,258 (17.0%) |
| 3 or 4 Children | 778 (17.5%) | 4,224 (35.4%) |
| 5 or more Children | 68 (26.5%) | 392 (47.4%) |
| Total | 4,129 (8.0%) | 19,127 (13.7%) |
Income Below Poverty Among Married-Couple vs Single-Parent Households in Area Code 240
The poverty data for Area Code 240 shows that 14,368 of the married-couple family households (3.0%) and 23,256 of the single-parent households (12.2%) are living below the poverty level. Within the married-couple family households, those with 5 or more children have the highest poverty rate, with 314 households (12.2%) falling below the poverty line. Among the single-parent households, those with 5 or more children have the highest poverty rate, with 460 household (42.4%) living below poverty.
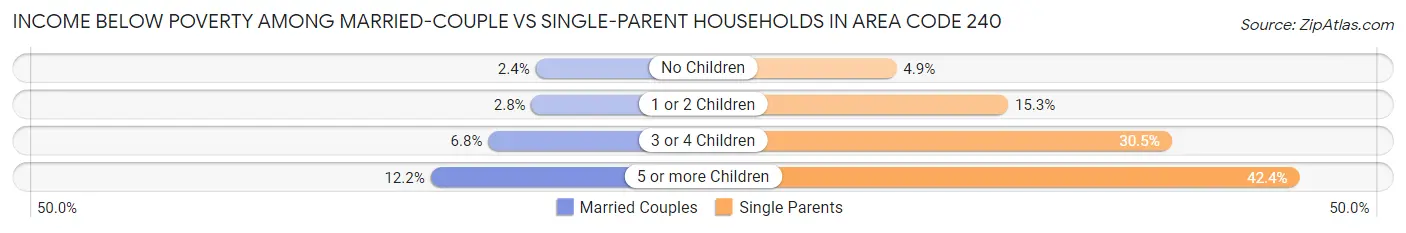
| Children | Married-Couple Families | Single-Parent Households |
| No Children | 6,386 (2.4%) | 4,119 (4.9%) |
| 1 or 2 Children | 4,915 (2.8%) | 13,675 (15.3%) |
| 3 or 4 Children | 2,753 (6.8%) | 5,002 (30.5%) |
| 5 or more Children | 314 (12.2%) | 460 (42.4%) |
| Total | 14,368 (3.0%) | 23,256 (12.2%) |
Race in Area Code 240
The most populous races in Area Code 240 are White / Caucasian (1,195,312 | 43.9%), Black / African American (865,179 | 31.7%), and Hispanic or Latino (408,710 | 15.0%).
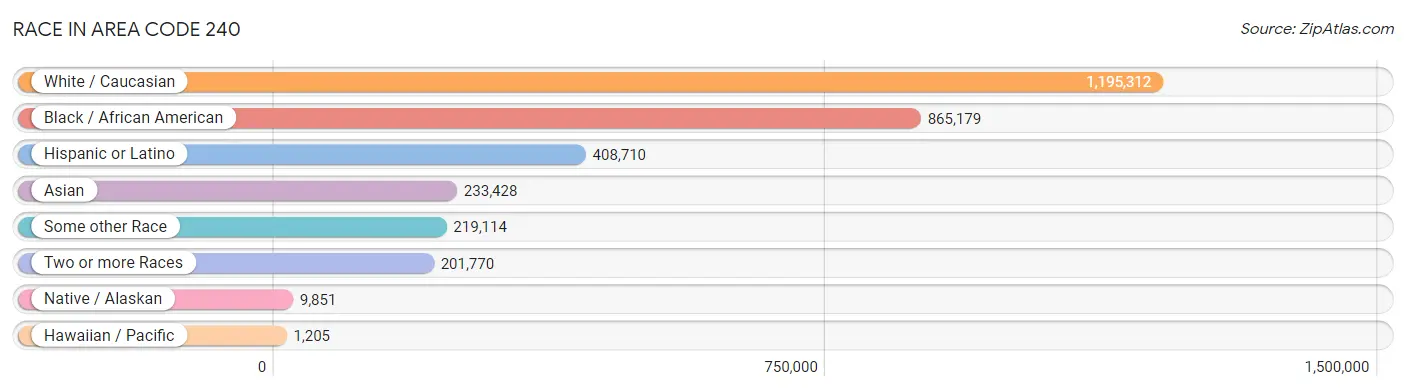
| Race | # Population | % Population |
| Asian | 233,428 | 8.6% |
| Black / African American | 865,179 | 31.7% |
| Hawaiian / Pacific | 1,205 | 0.0% |
| Hispanic or Latino | 408,710 | 15.0% |
| Native / Alaskan | 9,851 | 0.4% |
| White / Caucasian | 1,195,312 | 43.9% |
| Two or more Races | 201,770 | 7.4% |
| Some other Race | 219,114 | 8.0% |
| Total | 2,725,859 | 100.0% |
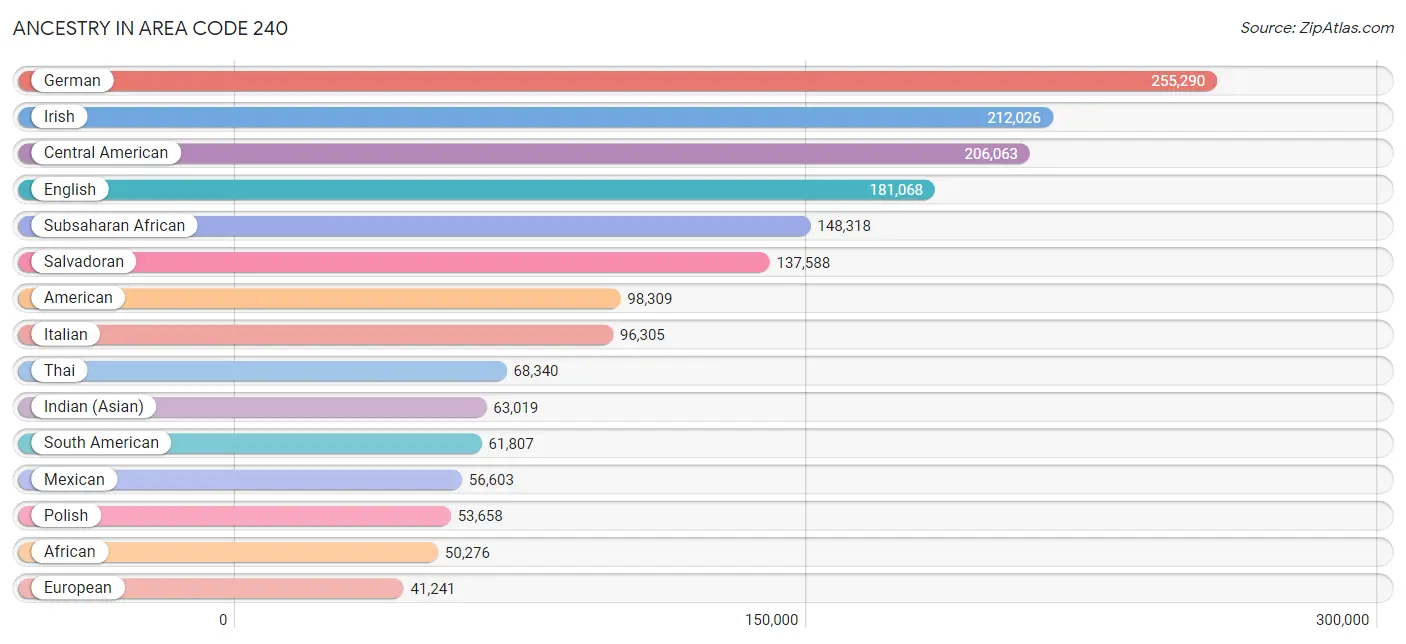
Ancestry in Area Code 240
The most populous ancestries reported in Area Code 240 are German (255,290 | 9.4%), Irish (212,026 | 7.8%), Central American (206,063 | 7.6%), English (181,068 | 6.6%), and Subsaharan African (148,318 | 5.4%), together accounting for 36.8% of all Area Code 240 residents.
| Ancestry | # Population | % Population |
| Afghan | 3,243 | 0.1% |
| African | 50,276 | 1.8% |
| Alaska Native | 50 | 0.0% |
| Albanian | 1,007 | 0.0% |
| Aleut | 156 | 0.0% |
| Alsatian | 120 | 0.0% |
| American | 98,309 | 3.6% |
| Apache | 373 | 0.0% |
| Arab | 18,745 | 0.7% |
| Arapaho | 24 | 0.0% |
| Argentinean | 4,374 | 0.2% |
| Armenian | 2,457 | 0.1% |
| Assyrian / Chaldean / Syriac | 143 | 0.0% |
| Australian | 899 | 0.0% |
| Austrian | 5,461 | 0.2% |
| Bahamian | 558 | 0.0% |
| Bangladeshi | 186 | 0.0% |
| Barbadian | 1,159 | 0.0% |
| Basque | 261 | 0.0% |
| Belgian | 1,861 | 0.1% |
| Belizean | 244 | 0.0% |
| Bermudan | 396 | 0.0% |
| Bhutanese | 11,177 | 0.4% |
| Blackfeet | 2,054 | 0.1% |
| Bolivian | 8,760 | 0.3% |
| Brazilian | 8,382 | 0.3% |
| British | 15,480 | 0.6% |
| British West Indian | 2,310 | 0.1% |
| Bulgarian | 1,575 | 0.1% |
| Burmese | 31,763 | 1.2% |
| Cajun | 252 | 0.0% |
| Cambodian | 526 | 0.0% |
| Canadian | 2,512 | 0.1% |
| Cape Verdean | 860 | 0.0% |
| Carpatho Rusyn | 205 | 0.0% |
| Celtic | 353 | 0.0% |
| Central American | 206,063 | 7.6% |
| Central American Indian | 5,269 | 0.2% |
| Cherokee | 5,503 | 0.2% |
| Cheyenne | 109 | 0.0% |
| Chickasaw | 40 | 0.0% |
| Chilean | 3,306 | 0.1% |
| Chinese | 26 | 0.0% |
| Chippewa | 232 | 0.0% |
| Choctaw | 323 | 0.0% |
| Colombian | 14,531 | 0.5% |
| Comanche | 10 | 0.0% |
| Costa Rican | 2,070 | 0.1% |
| Cree | 101 | 0.0% |
| Creek | 314 | 0.0% |
| Croatian | 2,006 | 0.1% |
| Crow | 21 | 0.0% |
| Cuban | 6,140 | 0.2% |
| Cypriot | 197 | 0.0% |
| Czech | 6,403 | 0.2% |
| Czechoslovakian | 1,402 | 0.1% |
| Danish | 4,439 | 0.2% |
| Delaware | 413 | 0.0% |
| Dominican | 15,630 | 0.6% |
| Dutch | 14,102 | 0.5% |
| Dutch West Indian | 17 | 0.0% |
| Eastern European | 16,780 | 0.6% |
| Ecuadorian | 5,647 | 0.2% |
| Egyptian | 3,158 | 0.1% |
| English | 181,068 | 6.6% |
| Estonian | 371 | 0.0% |
| Ethiopian | 24,829 | 0.9% |
| European | 41,241 | 1.5% |
| Filipino | 3,832 | 0.1% |
| Finnish | 2,688 | 0.1% |
| French | 32,696 | 1.2% |
| French American Indian | 107 | 0.0% |
| French Canadian | 6,524 | 0.2% |
| German | 255,290 | 9.4% |
| German Russian | 116 | 0.0% |
| Ghanaian | 9,513 | 0.4% |
| Greek | 11,699 | 0.4% |
| Guamanian / Chamorro | 887 | 0.0% |
| Guatemalan | 31,873 | 1.2% |
| Guyanese | 5,610 | 0.2% |
| Haitian | 8,661 | 0.3% |
| Honduran | 23,650 | 0.9% |
| Hungarian | 9,605 | 0.4% |
| Icelander | 421 | 0.0% |
| Indian (Asian) | 63,019 | 2.3% |
| Indonesian | 3,518 | 0.1% |
| Inupiat | 56 | 0.0% |
| Iranian | 9,446 | 0.4% |
| Iraqi | 749 | 0.0% |
| Irish | 212,026 | 7.8% |
| Iroquois | 561 | 0.0% |
| Israeli | 1,374 | 0.1% |
| Italian | 96,305 | 3.5% |
| Jamaican | 28,582 | 1.1% |
| Japanese | 2,293 | 0.1% |
| Jordanian | 612 | 0.0% |
| Kenyan | 2,179 | 0.1% |
| Kiowa | 8 | 0.0% |
| Korean | 40,690 | 1.5% |
| Laotian | 2,678 | 0.1% |
| Latvian | 1,108 | 0.0% |
| Lebanese | 4,268 | 0.2% |
| Liberian | 2,583 | 0.1% |
| Lithuanian | 5,717 | 0.2% |
| Lumbee | 333 | 0.0% |
| Luxembourger | 199 | 0.0% |
| Macedonian | 238 | 0.0% |
| Malaysian | 507 | 0.0% |
| Maltese | 87 | 0.0% |
| Mexican | 56,603 | 2.1% |
| Mexican American Indian | 1,663 | 0.1% |
| Mongolian | 680 | 0.0% |
| Moroccan | 1,908 | 0.1% |
| Native Hawaiian | 1,347 | 0.1% |
| Navajo | 385 | 0.0% |
| Nepalese | 56 | 0.0% |
| New Zealander | 153 | 0.0% |
| Nicaraguan | 6,282 | 0.2% |
| Nigerian | 29,881 | 1.1% |
| Northern European | 4,121 | 0.2% |
| Norwegian | 13,355 | 0.5% |
| Okinawan | 57 | 0.0% |
| Osage | 177 | 0.0% |
| Paiute | 2 | 0.0% |
| Pakistani | 4,042 | 0.2% |
| Palestinian | 1,782 | 0.1% |
| Panamanian | 4,162 | 0.2% |
| Paraguayan | 833 | 0.0% |
| Pennsylvania German | 1,330 | 0.1% |
| Peruvian | 18,281 | 0.7% |
| Polish | 53,658 | 2.0% |
| Portuguese | 6,706 | 0.3% |
| Potawatomi | 14 | 0.0% |
| Pueblo | 64 | 0.0% |
| Puerto Rican | 31,016 | 1.1% |
| Puget Sound Salish | 45 | 0.0% |
| Romanian | 3,602 | 0.1% |
| Russian | 30,105 | 1.1% |
| Salvadoran | 137,588 | 5.1% |
| Samoan | 501 | 0.0% |
| Scandinavian | 4,304 | 0.2% |
| Scotch-Irish | 15,766 | 0.6% |
| Scottish | 33,215 | 1.2% |
| Seminole | 161 | 0.0% |
| Senegalese | 1,448 | 0.1% |
| Serbian | 1,783 | 0.1% |
| Shoshone | 23 | 0.0% |
| Sierra Leonean | 4,321 | 0.2% |
| Sioux | 525 | 0.0% |
| Slavic | 1,185 | 0.0% |
| Slovak | 4,956 | 0.2% |
| Slovene | 1,299 | 0.1% |
| Somali | 409 | 0.0% |
| South African | 874 | 0.0% |
| South American | 61,807 | 2.3% |
| South American Indian | 1,231 | 0.1% |
| Soviet Union | 67 | 0.0% |
| Spaniard | 5,977 | 0.2% |
| Spanish | 4,148 | 0.2% |
| Spanish American | 52 | 0.0% |
| Spanish American Indian | 82 | 0.0% |
| Sri Lankan | 19,581 | 0.7% |
| Subsaharan African | 148,318 | 5.4% |
| Sudanese | 802 | 0.0% |
| Swedish | 13,131 | 0.5% |
| Swiss | 5,870 | 0.2% |
| Syrian | 1,293 | 0.1% |
| Taiwanese | 32 | 0.0% |
| Thai | 68,340 | 2.5% |
| Tlingit-Haida | 2 | 0.0% |
| Tongan | 164 | 0.0% |
| Trinidadian and Tobagonian | 6,373 | 0.2% |
| Turkish | 3,252 | 0.1% |
| U.S. Virgin Islander | 431 | 0.0% |
| Ugandan | 425 | 0.0% |
| Ukrainian | 8,949 | 0.3% |
| Uruguayan | 1,039 | 0.0% |
| Ute | 23 | 0.0% |
| Venezuelan | 4,538 | 0.2% |
| Vietnamese | 2,558 | 0.1% |
| Welsh | 12,333 | 0.4% |
| West Indian | 5,716 | 0.2% |
| Yugoslavian | 641 | 0.0% |
| Yuman | 78 | 0.0% |
| Yup'ik | 14 | 0.0% |
| Zimbabwean | 838 | 0.0% | View All 186 Rows |
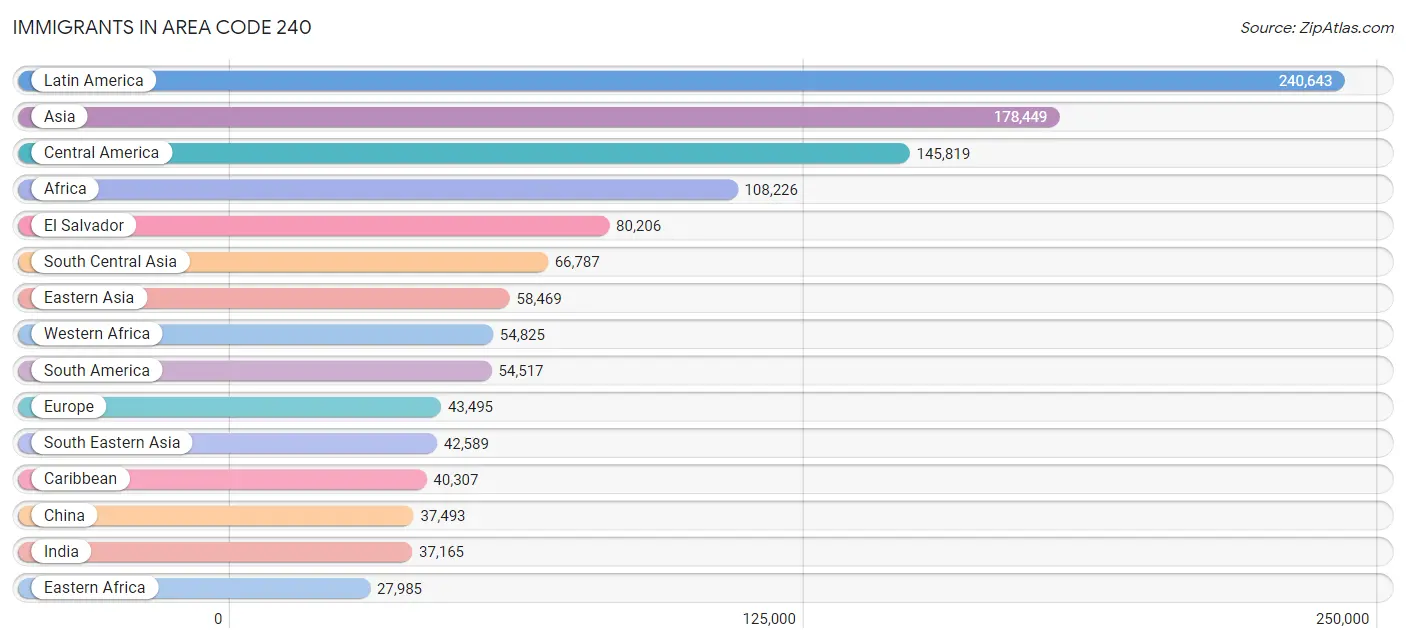
Immigrants in Area Code 240
The most numerous immigrant groups reported in Area Code 240 came from Latin America (240,643 | 8.8%), Asia (178,449 | 6.6%), Central America (145,819 | 5.3%), Africa (108,226 | 4.0%), and El Salvador (80,206 | 2.9%), together accounting for 27.6% of all Area Code 240 residents.
| Immigration Origin | # Population | % Population |
| Afghanistan | 3,010 | 0.1% |
| Africa | 108,226 | 4.0% |
| Albania | 325 | 0.0% |
| Argentina | 2,523 | 0.1% |
| Armenia | 287 | 0.0% |
| Asia | 178,449 | 6.6% |
| Australia | 1,050 | 0.0% |
| Austria | 273 | 0.0% |
| Azores | 15 | 0.0% |
| Bahamas | 341 | 0.0% |
| Bangladesh | 3,359 | 0.1% |
| Barbados | 846 | 0.0% |
| Belarus | 560 | 0.0% |
| Belgium | 655 | 0.0% |
| Belize | 297 | 0.0% |
| Bolivia | 5,828 | 0.2% |
| Bosnia and Herzegovina | 352 | 0.0% |
| Brazil | 8,716 | 0.3% |
| Bulgaria | 1,060 | 0.0% |
| Cabo Verde | 106 | 0.0% |
| Cambodia | 1,083 | 0.0% |
| Cameroon | 15,131 | 0.6% |
| Canada | 4,318 | 0.2% |
| Caribbean | 40,307 | 1.5% |
| Central America | 145,819 | 5.3% |
| Chile | 1,860 | 0.1% |
| China | 37,493 | 1.4% |
| Colombia | 9,295 | 0.3% |
| Congo | 286 | 0.0% |
| Costa Rica | 1,834 | 0.1% |
| Croatia | 104 | 0.0% |
| Cuba | 1,661 | 0.1% |
| Czechoslovakia | 810 | 0.0% |
| Denmark | 252 | 0.0% |
| Dominica | 229 | 0.0% |
| Dominican Republic | 8,001 | 0.3% |
| Eastern Africa | 27,985 | 1.0% |
| Eastern Asia | 58,469 | 2.1% |
| Eastern Europe | 18,500 | 0.7% |
| Ecuador | 3,459 | 0.1% |
| Egypt | 1,742 | 0.1% |
| El Salvador | 80,206 | 2.9% |
| England | 2,646 | 0.1% |
| Eritrea | 1,865 | 0.1% |
| Ethiopia | 19,650 | 0.7% |
| Europe | 43,495 | 1.6% |
| Fiji | 140 | 0.0% |
| France | 2,938 | 0.1% |
| Germany | 5,136 | 0.2% |
| Ghana | 11,063 | 0.4% |
| Greece | 799 | 0.0% |
| Grenada | 383 | 0.0% |
| Guatemala | 22,081 | 0.8% |
| Guyana | 5,030 | 0.2% |
| Haiti | 4,332 | 0.2% |
| Honduras | 16,023 | 0.6% |
| Hong Kong | 2,956 | 0.1% |
| Hungary | 541 | 0.0% |
| India | 37,165 | 1.4% |
| Indonesia | 1,950 | 0.1% |
| Iran | 7,023 | 0.3% |
| Iraq | 916 | 0.0% |
| Ireland | 653 | 0.0% |
| Israel | 2,024 | 0.1% |
| Italy | 2,315 | 0.1% |
| Jamaica | 17,166 | 0.6% |
| Japan | 3,449 | 0.1% |
| Jordan | 628 | 0.0% |
| Kazakhstan | 343 | 0.0% |
| Kenya | 2,527 | 0.1% |
| Korea | 17,307 | 0.6% |
| Kuwait | 554 | 0.0% |
| Laos | 723 | 0.0% |
| Latin America | 240,643 | 8.8% |
| Latvia | 609 | 0.0% |
| Lebanon | 960 | 0.0% |
| Liberia | 3,338 | 0.1% |
| Lithuania | 180 | 0.0% |
| Malaysia | 750 | 0.0% |
| Mexico | 20,226 | 0.7% |
| Micronesia | 6 | 0.0% |
| Middle Africa | 17,062 | 0.6% |
| Moldova | 504 | 0.0% |
| Morocco | 967 | 0.0% |
| Nepal | 4,074 | 0.2% |
| Netherlands | 762 | 0.0% |
| Nicaragua | 3,348 | 0.1% |
| Nigeria | 21,853 | 0.8% |
| North Macedonia | 140 | 0.0% |
| Northern Africa | 3,970 | 0.2% |
| Northern Europe | 8,636 | 0.3% |
| Norway | 397 | 0.0% |
| Oceania | 1,425 | 0.1% |
| Pakistan | 8,493 | 0.3% |
| Panama | 1,594 | 0.1% |
| Peru | 12,935 | 0.5% |
| Philippines | 21,341 | 0.8% |
| Poland | 1,189 | 0.0% |
| Portugal | 1,000 | 0.0% |
| Romania | 1,299 | 0.1% |
| Russia | 5,418 | 0.2% |
| Saudi Arabia | 354 | 0.0% |
| Scotland | 274 | 0.0% |
| Senegal | 2,032 | 0.1% |
| Serbia | 596 | 0.0% |
| Sierra Leone | 7,482 | 0.3% |
| Singapore | 327 | 0.0% |
| Somalia | 358 | 0.0% |
| South Africa | 1,461 | 0.1% |
| South America | 54,517 | 2.0% |
| South Central Asia | 66,787 | 2.5% |
| South Eastern Asia | 42,589 | 1.6% |
| Southern Europe | 6,015 | 0.2% |
| Spain | 1,872 | 0.1% |
| Sri Lanka | 2,589 | 0.1% |
| St. Vincent and the Grenadines | 324 | 0.0% |
| Sudan | 666 | 0.0% |
| Sweden | 334 | 0.0% |
| Switzerland | 445 | 0.0% |
| Syria | 762 | 0.0% |
| Taiwan | 5,340 | 0.2% |
| Thailand | 2,402 | 0.1% |
| Trinidad and Tobago | 5,509 | 0.2% |
| Turkey | 1,984 | 0.1% |
| Uganda | 812 | 0.0% |
| Ukraine | 2,974 | 0.1% |
| Uruguay | 410 | 0.0% |
| Uzbekistan | 410 | 0.0% |
| Venezuela | 3,571 | 0.1% |
| Vietnam | 11,231 | 0.4% |
| West Indies | 429 | 0.0% |
| Western Africa | 54,825 | 2.0% |
| Western Asia | 10,082 | 0.4% |
| Western Europe | 10,270 | 0.4% |
| Yemen | 177 | 0.0% |
| Zaire | 1,171 | 0.0% |
| Zimbabwe | 793 | 0.0% | View All 137 Rows |
Sex and Age in Area Code 240
Sex and Age in Area Code 240
The most populous age groups in Area Code 240 are 35 to 39 Years (96,948 | 7.3%) for men and 35 to 39 Years (98,686 | 7.1%) for women.
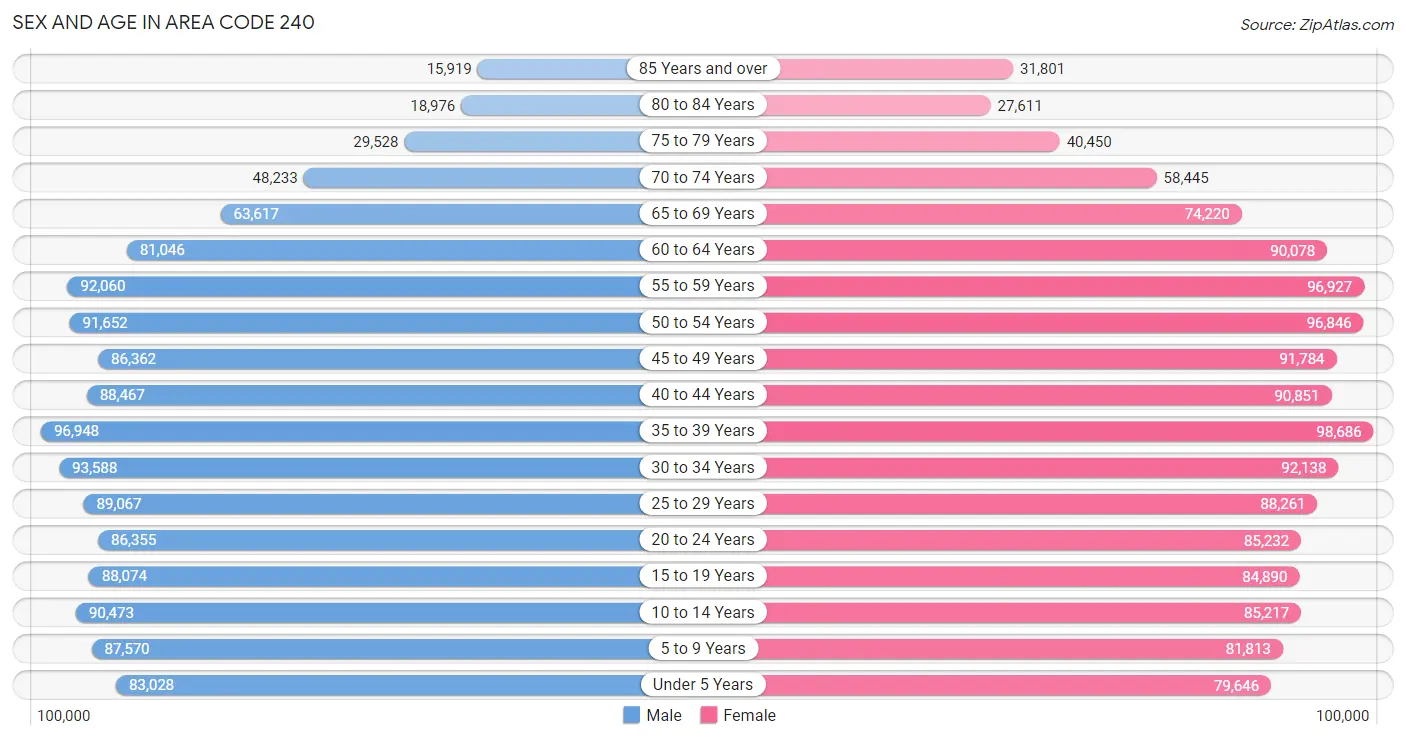
| Age Bracket | Male | Female |
| Under 5 Years | 83,028 (6.2%) | 79,646 (5.7%) |
| 5 to 9 Years | 87,570 (6.6%) | 81,813 (5.9%) |
| 10 to 14 Years | 90,473 (6.8%) | 85,217 (6.1%) |
| 15 to 19 Years | 88,074 (6.6%) | 84,890 (6.1%) |
| 20 to 24 Years | 86,355 (6.5%) | 85,232 (6.1%) |
| 25 to 29 Years | 89,067 (6.7%) | 88,261 (6.3%) |
| 30 to 34 Years | 93,588 (7.0%) | 92,138 (6.6%) |
| 35 to 39 Years | 96,948 (7.3%) | 98,686 (7.1%) |
| 40 to 44 Years | 88,467 (6.7%) | 90,851 (6.5%) |
| 45 to 49 Years | 86,362 (6.5%) | 91,784 (6.6%) |
| 50 to 54 Years | 91,652 (6.9%) | 96,846 (6.9%) |
| 55 to 59 Years | 92,060 (6.9%) | 96,927 (7.0%) |
| 60 to 64 Years | 81,046 (6.1%) | 90,078 (6.5%) |
| 65 to 69 Years | 63,617 (4.8%) | 74,220 (5.3%) |
| 70 to 74 Years | 48,233 (3.6%) | 58,445 (4.2%) |
| 75 to 79 Years | 29,528 (2.2%) | 40,450 (2.9%) |
| 80 to 84 Years | 18,976 (1.4%) | 27,611 (2.0%) |
| 85 Years and over | 15,919 (1.2%) | 31,801 (2.3%) |
| Total | 1,330,963 (100.0%) | 1,394,896 (100.0%) |
Families and Households in Area Code 240
Median Family Size in Area Code 240
The median family size in Area Code 240 is 3.15 persons per family, with married-couple families (482,164 | 71.7%) accounting for the largest median family size of 3.23704 persons per family. On the other hand, single male/father families (51,416 | 7.6%) represent the smallest median family size with 2.84 persons per family.
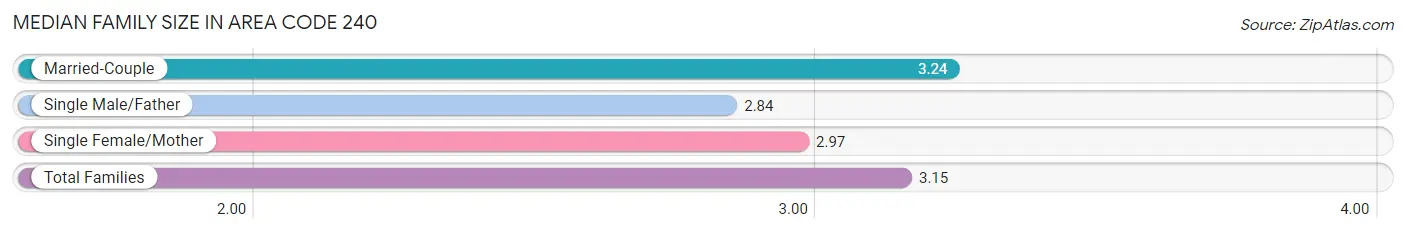
| Family Type | # Families | Family Size |
| Married-Couple | 482,164 (71.7%) | 3.24 |
| Single Male/Father | 51,416 (7.6%) | 2.84 |
| Single Female/Mother | 139,211 (20.7%) | 2.97 |
| Total Families | 672,791 (100.0%) | 3.15 |
Median Household Size in Area Code 240
The median household size in Area Code 240 is 2.66 persons per household, with married-couple households (482,164 | 48.0%) accounting for the largest median household size of 3.28559 persons per household. non-family households (330,741 | 33.0%) represent the smallest median household size with 1.28 persons per household.
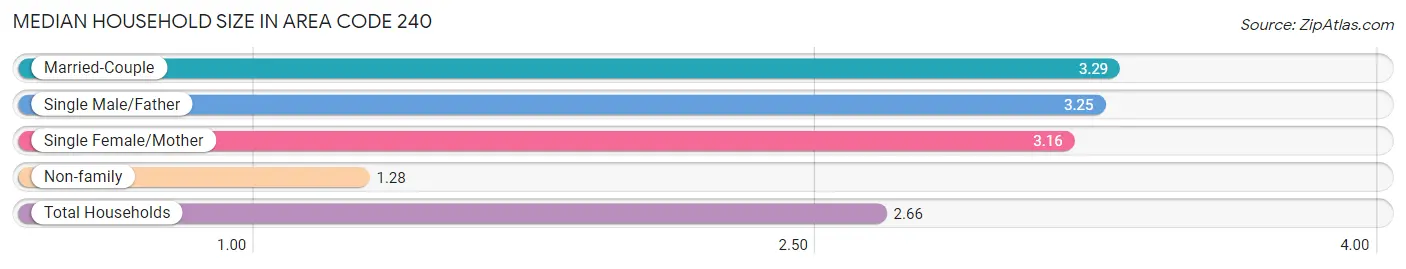
| Household Type | # Households | Household Size |
| Married-Couple | 482,164 (48.0%) | 3.29 |
| Single Male/Father | 51,416 (5.1%) | 3.25 |
| Single Female/Mother | 139,211 (13.9%) | 3.16 |
| Non-family | 330,741 (33.0%) | 1.28 |
| Total Households | 1,003,532 (100.0%) | 2.66 |
Household Size by Marriage Status in Area Code 240
Out of a total of 1,003,532 households in Area Code 240, 672,791 (67.0%) are family households, while 330,741 (33.0%) are nonfamily households. The most numerous type of family households are 2-person households, comprising 260,868, and the most common type of nonfamily households are 1-person households, comprising 270,483.
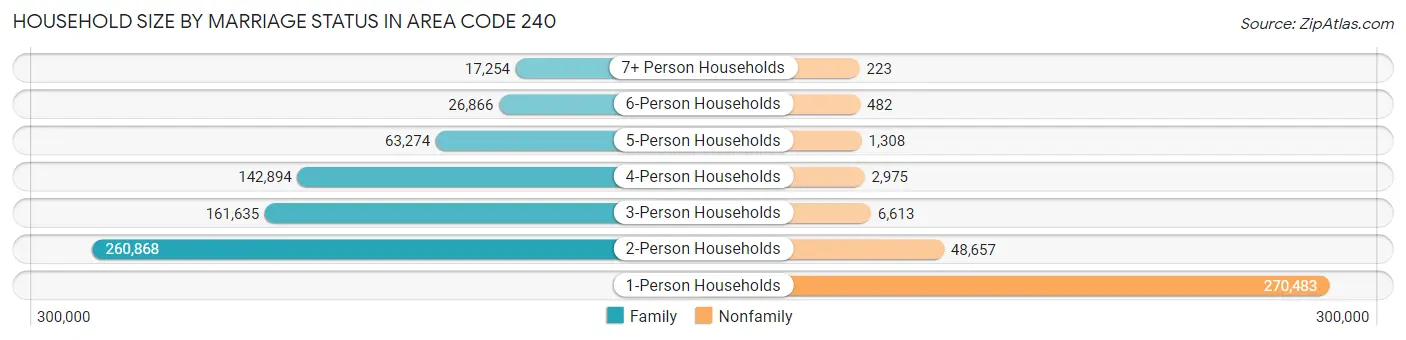
| Household Size | Family Households | Nonfamily Households |
| 1-Person Households | - | 270,483 (27.0%) |
| 2-Person Households | 260,868 (26.0%) | 48,657 (4.9%) |
| 3-Person Households | 161,635 (16.1%) | 6,613 (0.7%) |
| 4-Person Households | 142,894 (14.2%) | 2,975 (0.3%) |
| 5-Person Households | 63,274 (6.3%) | 1,308 (0.1%) |
| 6-Person Households | 26,866 (2.7%) | 482 (0.1%) |
| 7+ Person Households | 17,254 (1.7%) | 223 (0.0%) |
| Total | 672,791 (67.0%) | 330,741 (33.0%) |
Female Fertility in Area Code 240
Fertility by Age in Area Code 240
Average fertility rate in Area Code 240 is 80.7 births per 1,000 women. Women in the age bracket of 20 to 34 years have the highest fertility rate with 131.2 births per 1,000 women. Women in the age bracket of 20 to 34 years acount for 63.1% of all women with births.
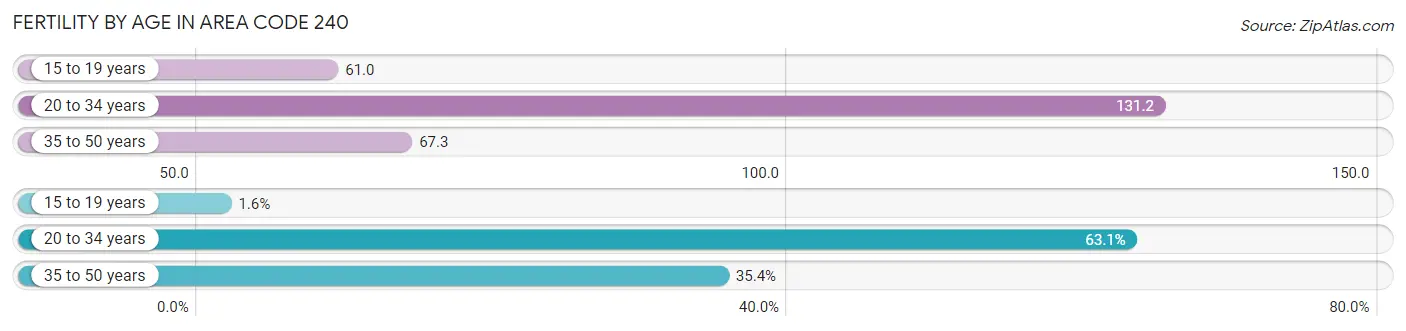
| Age Bracket | Women with Births | Births / 1,000 Women |
| 15 to 19 years | 564 (1.6%) | 61.0 |
| 20 to 34 years | 22,394 (63.1%) | 131.2 |
| 35 to 50 years | 12,551 (35.3%) | 67.3 |
| Total | 35,509 (100.0%) | 80.7 |
Fertility by Age by Marriage Status in Area Code 240
65.1% of women with births (35,509) in Area Code 240 are married. The highest percentage of unmarried women with births falls into 15 to 19 years age bracket with 100.0% of them unmarried at the time of birth, while the lowest percentage of unmarried women with births belong to 35 to 50 years age bracket with 36.3% of them unmarried.
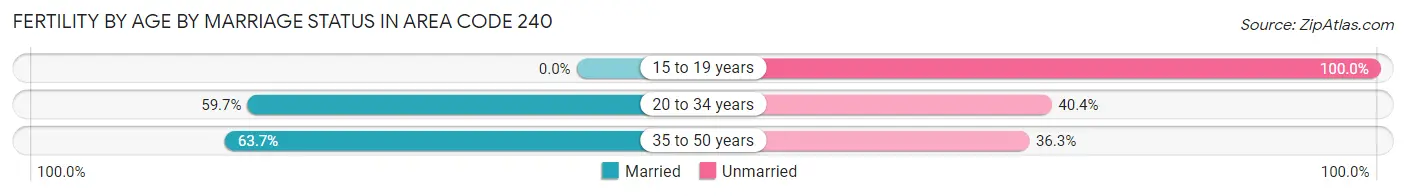
| Age Bracket | Married | Unmarried |
| 15 to 19 years | 0 (0.0%) | 564 (100.0%) |
| 20 to 34 years | 13,357 (59.7%) | 9,037 (40.4%) |
| 35 to 50 years | 7,995 (63.7%) | 4,556 (36.3%) |
| Total | 23,127 (65.1%) | 12,382 (34.9%) |
Fertility by Education in Area Code 240
Average fertility rate in Area Code 240 is 80.7 births per 1,000 women. Women with the education attainment of graduate degree have the highest fertility rate of 130.5 births per 1,000 women, while women with the education attainment of college or associate's degree have the lowest fertility at 79.7 births per 1,000 women. Women with the education attainment of graduate degree represent 26.1% of all women with births.
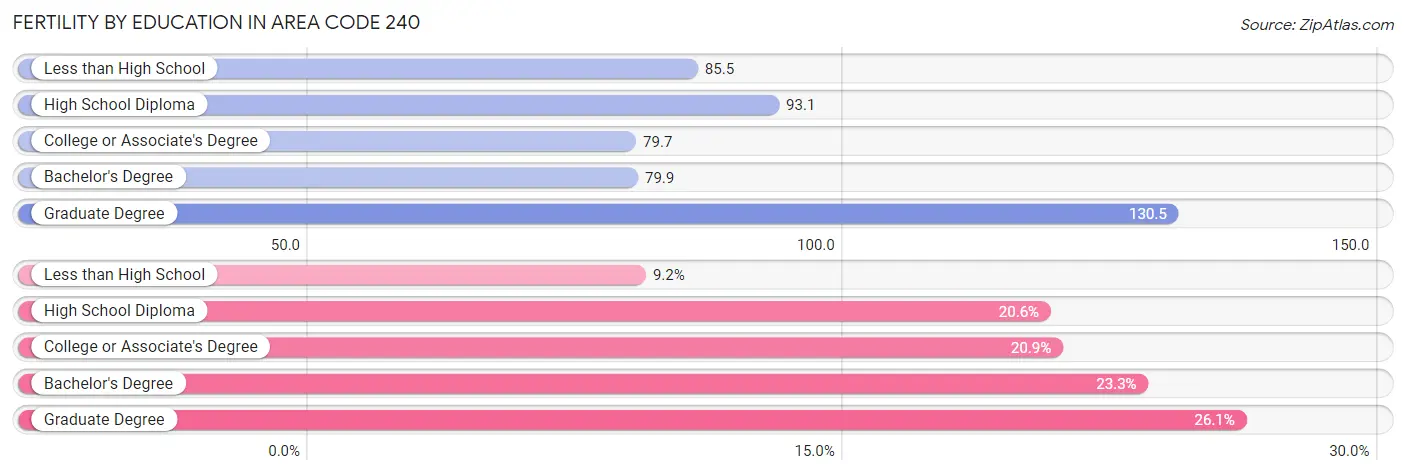
| Educational Attainment | Women with Births | Births / 1,000 Women |
| Less than High School | 3,260 (9.2%) | 85.5 |
| High School Diploma | 7,299 (20.6%) | 93.1 |
| College or Associate's Degree | 7,422 (20.9%) | 79.7 |
| Bachelor's Degree | 8,274 (23.3%) | 79.9 |
| Graduate Degree | 9,254 (26.1%) | 130.5 |
| Total | 35,509 (100.0%) | 80.7 |
Fertility by Education by Marriage Status in Area Code 240
34.9% of women with births in Area Code 240 are unmarried. Women with the educational attainment of graduate degree are most likely to be married with 74.8% of them married at childbirth, while women with the educational attainment of less than high school are least likely to be married with 68.3% of them unmarried at childbirth.
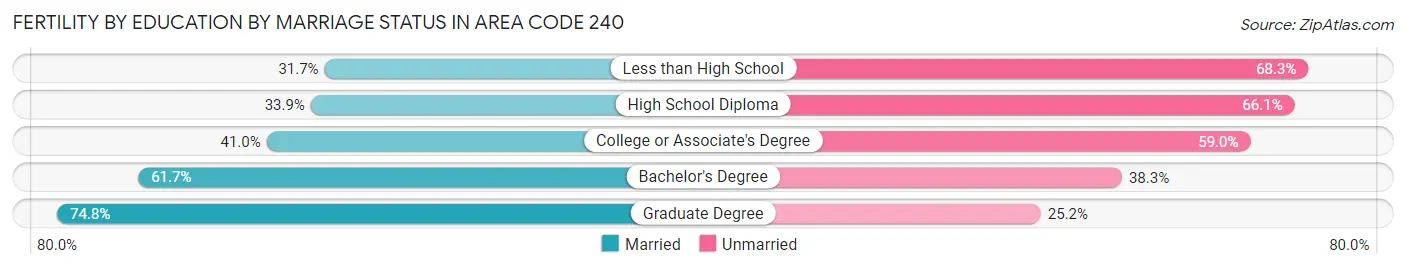
| Educational Attainment | Married | Unmarried |
| Less than High School | 1,032 (31.7%) | 2,228 (68.3%) |
| High School Diploma | 2,473 (33.9%) | 4,826 (66.1%) |
| College or Associate's Degree | 3,043 (41.0%) | 4,379 (59.0%) |
| Bachelor's Degree | 5,103 (61.7%) | 3,171 (38.3%) |
| Graduate Degree | 6,918 (74.8%) | 2,336 (25.2%) |
| Total | 23,127 (65.1%) | 12,382 (34.9%) |
Employment Characteristics in Area Code 240
Employment by Class of Employer in Area Code 240
Among the 1,402,362 employed individuals in Area Code 240, private company employees (790,823 | 56.4%), federal government employees (201,769 | 14.4%), and not-for-profit organizations (142,101 | 10.1%) make up the most common classes of employment.
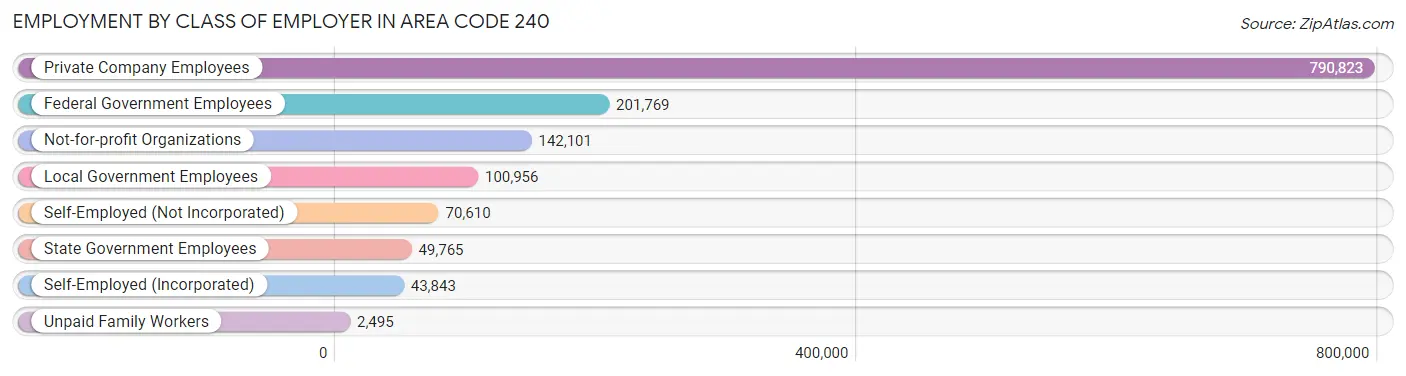
| Employer Class | # Employees | % Employees |
| Private Company Employees | 790,823 | 56.4% |
| Self-Employed (Incorporated) | 43,843 | 3.1% |
| Self-Employed (Not Incorporated) | 70,610 | 5.0% |
| Not-for-profit Organizations | 142,101 | 10.1% |
| Local Government Employees | 100,956 | 7.2% |
| State Government Employees | 49,765 | 3.5% |
| Federal Government Employees | 201,769 | 14.4% |
| Unpaid Family Workers | 2,495 | 0.2% |
| Total | 1,402,362 | 100.0% |
Employment Status by Age in Area Code 240
According to the labor force statistics for Area Code 240, out of the total population over 16 years of age (2,182,544), 65.3% or 1,425,638 individuals are in the labor force, with 6.8% or 96,231 of them unemployed. The age group with the highest labor force participation rate is 30 to 34 years, with 88.4% or 164,163 individuals in the labor force. Within the labor force, the 16 to 19 years age range has the highest percentage of unemployed individuals, with 2,238.6% or 1,266,891 of them being unemployed.
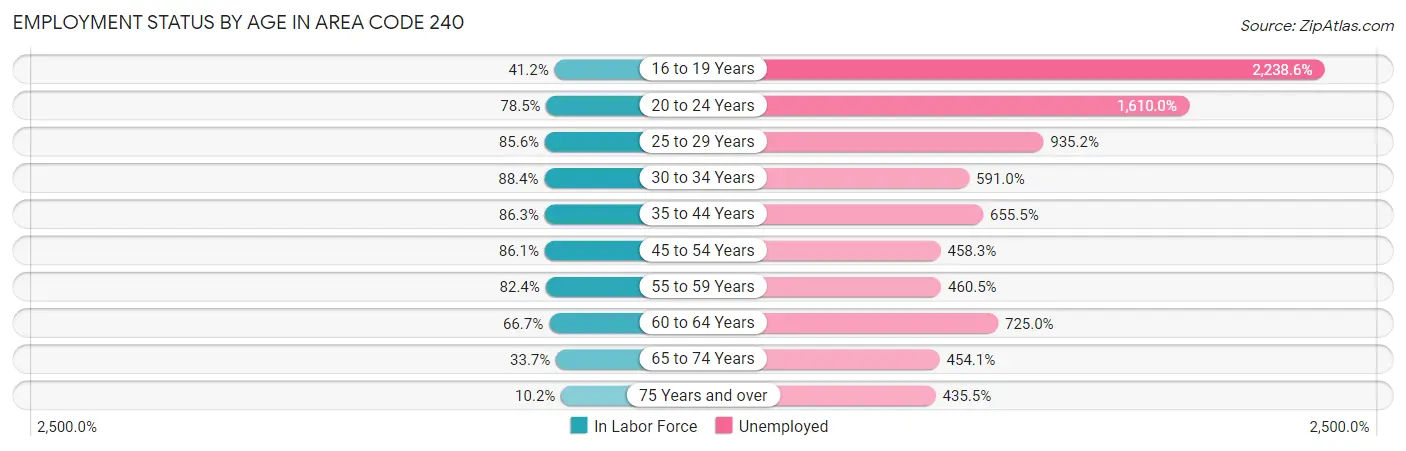
| Age Bracket | In Labor Force | Unemployed |
| 16 to 19 Years | 56,593 (41.2%) | 1,266,891 (2,238.6%) |
| 20 to 24 Years | 134,672 (78.5%) | 2,168,332 (1,610.0%) |
| 25 to 29 Years | 151,846 (85.6%) | 1,420,064 (935.2%) |
| 30 to 34 Years | 164,164 (88.4%) | 970,203 (591.0%) |
| 35 to 44 Years | 323,485 (86.3%) | 2,120,352 (655.5%) |
| 45 to 54 Years | 315,738 (86.1%) | 1,447,101 (458.3%) |
| 55 to 59 Years | 155,722 (82.4%) | 717,114 (460.5%) |
| 60 to 64 Years | 114,071 (66.7%) | 827,015 (725.0%) |
| 65 to 74 Years | 82,338 (33.7%) | 373,851 (454.1%) |
| 75 Years and over | 16,809 (10.2%) | 73,190 (435.5%) |
| Total | 1,425,680 (65.3%) | 96,210 (6.8%) |
Employment Status by Educational Attainment in Area Code 240
According to labor force statistics for Area Code 240, 81.9% of individuals (1,199,639) out of the total population between 25 and 64 years of age (1,464,761) are in the labor force, with 795.8% or 9,546,727 of them being unemployed. The group with the highest labor force participation rate are those with the educational attainment of bachelor's degree or higher, with 88.4% or 605,323 individuals in the labor force. Within the labor force, individuals with less than high school education have the highest percentage of unemployment, with 1,201.6% or 1,018,272 of them being unemployed.
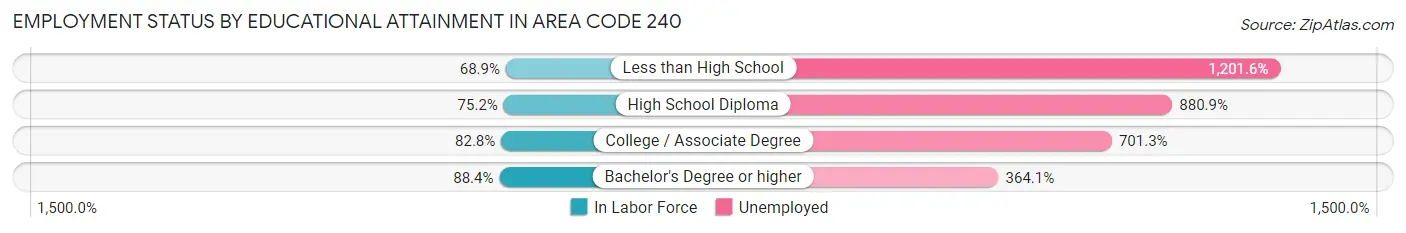
| Educational Attainment | In Labor Force | Unemployed |
| Less than High School | 84,743 (68.9%) | 1,478,965 (1,201.6%) |
| High School Diploma | 227,581 (75.2%) | 2,664,467 (880.9%) |
| College / Associate Degree | 293,414 (82.8%) | 2,484,145 (701.3%) |
| Bachelor's Degree or higher | 605,312 (88.4%) | 2,494,038 (364.1%) |
| Total | 1,199,666 (81.9%) | 11,656,568 (795.8%) |
Employment Occupations by Sex in Area Code 240
Management, Business, Science and Arts Occupations
The most common Management, Business, Science and Arts occupations in Area Code 240 are Community & Social Service (184,049 | 13.0%), Computers, Engineering & Science (175,730 | 12.4%), Management (172,326 | 12.2%), Business & Financial (111,973 | 7.9%), and Computers & Mathematics (102,663 | 7.2%).
Management, Business, Science and Arts Occupations by Sex
Within the Management, Business, Science and Arts occupations in Area Code 240, the most male-oriented occupations are Architecture & Engineering (80.8%), Computers & Mathematics (68.8%), and Computers, Engineering & Science (67.8%), while the most female-oriented occupations are Health Diagnosing & Treating (75.2%), Health Technologists (74.8%), and Education Instruction & Library (72.9%).
| Occupation | Male | Female |
| Management | 90,240 (52.4%) | 82,086 (47.6%) |
| Business & Financial | 47,515 (42.4%) | 64,458 (57.6%) |
| Computers, Engineering & Science | 119,069 (67.8%) | 56,661 (32.2%) |
| Computers & Mathematics | 70,599 (68.8%) | 32,064 (31.2%) |
| Architecture & Engineering | 27,633 (80.8%) | 6,544 (19.2%) |
| Life, Physical & Social Science | 20,837 (53.6%) | 18,053 (46.4%) |
| Community & Social Service | 66,158 (35.9%) | 117,891 (64.0%) |
| Education, Arts & Media | 9,328 (35.0%) | 17,283 (64.9%) |
| Legal Services & Support | 14,277 (48.6%) | 15,110 (51.4%) |
| Education Instruction & Library | 25,231 (27.1%) | 67,757 (72.9%) |
| Arts, Media & Entertainment | 17,322 (49.4%) | 17,741 (50.6%) |
| Health Diagnosing & Treating | 19,161 (24.8%) | 58,106 (75.2%) |
| Health Technologists | 13,887 (25.2%) | 41,179 (74.8%) |
| Total (Category) | 342,143 (47.4%) | 379,202 (52.6%) |
| Total (Overall) | 724,183 (51.1%) | 692,927 (48.9%) |
Services Occupations
The most common Services occupations in Area Code 240 are Food Preparation & Serving (61,598 | 4.3%), Cleaning & Maintenance (48,127 | 3.4%), Security & Protection (40,271 | 2.8%), Personal Care & Service (37,113 | 2.6%), and Healthcare Support (36,399 | 2.6%).
Services Occupations by Sex
Within the Services occupations in Area Code 240, the most male-oriented occupations are Law Enforcement (74.1%), Security & Protection (72.3%), and Firefighting & Prevention (71.0%), while the most female-oriented occupations are Healthcare Support (82.6%), Personal Care & Service (74.3%), and Food Preparation & Serving (54.4%).
| Occupation | Male | Female |
| Healthcare Support | 6,338 (17.4%) | 30,061 (82.6%) |
| Security & Protection | 29,095 (72.3%) | 11,176 (27.8%) |
| Firefighting & Prevention | 17,095 (71.0%) | 6,986 (29.0%) |
| Law Enforcement | 12,000 (74.1%) | 4,190 (25.9%) |
| Food Preparation & Serving | 28,081 (45.6%) | 33,517 (54.4%) |
| Cleaning & Maintenance | 26,322 (54.7%) | 21,805 (45.3%) |
| Personal Care & Service | 9,558 (25.8%) | 27,555 (74.3%) |
| Total (Category) | 99,394 (44.5%) | 124,114 (55.5%) |
| Total (Overall) | 724,183 (51.1%) | 692,927 (48.9%) |
Sales and Office Occupations
The most common Sales and Office occupations in Area Code 240 are Office & Administration (143,485 | 10.1%), and Sales & Related (106,040 | 7.5%).
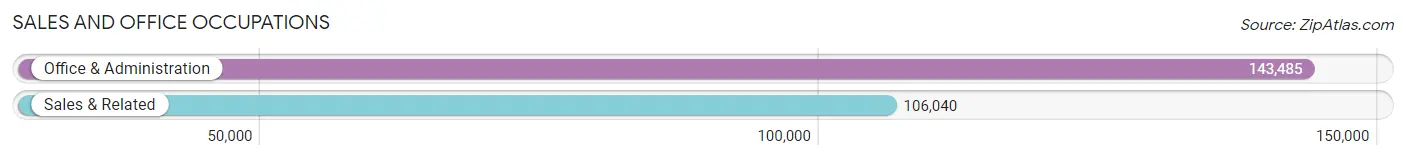
Sales and Office Occupations by Sex
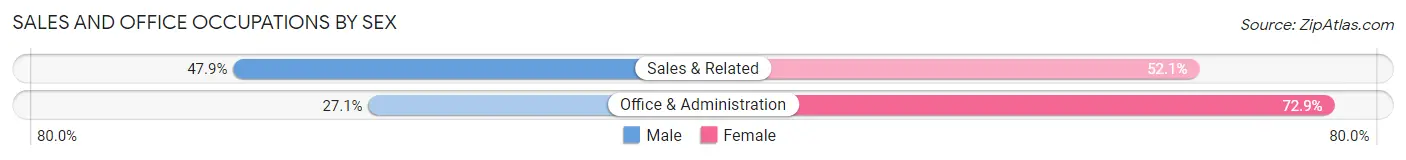
| Occupation | Male | Female |
| Sales & Related | 50,793 (47.9%) | 55,247 (52.1%) |
| Office & Administration | 38,888 (27.1%) | 104,597 (72.9%) |
| Total (Category) | 89,681 (35.9%) | 159,844 (64.1%) |
| Total (Overall) | 724,183 (51.1%) | 692,927 (48.9%) |
Natural Resources, Construction and Maintenance Occupations
The most common Natural Resources, Construction and Maintenance occupations in Area Code 240 are Construction & Extraction (70,054 | 4.9%), Installation, Maintenance & Repair (36,960 | 2.6%), and Farming, Fishing & Forestry (2,054 | 0.1%).
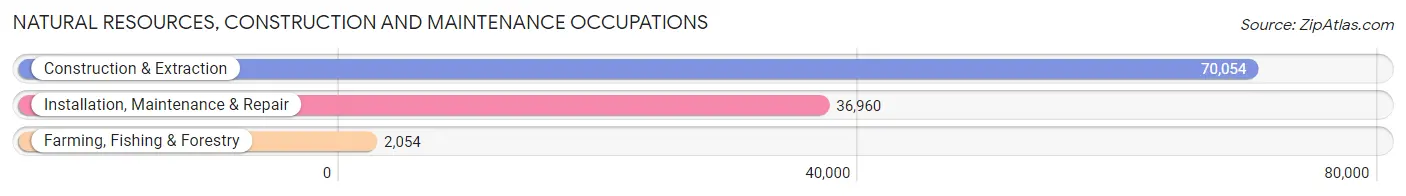
Natural Resources, Construction and Maintenance Occupations by Sex
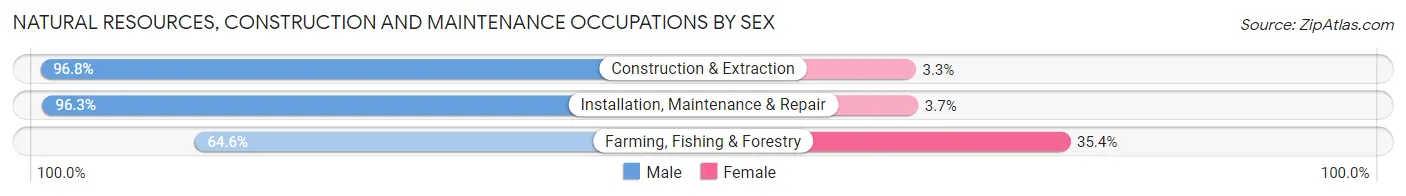
| Occupation | Male | Female |
| Farming, Fishing & Forestry | 1,327 (64.6%) | 727 (35.4%) |
| Construction & Extraction | 67,778 (96.8%) | 2,276 (3.3%) |
| Installation, Maintenance & Repair | 35,578 (96.3%) | 1,382 (3.7%) |
| Total (Category) | 104,683 (96.0%) | 4,385 (4.0%) |
| Total (Overall) | 724,183 (51.1%) | 692,927 (48.9%) |
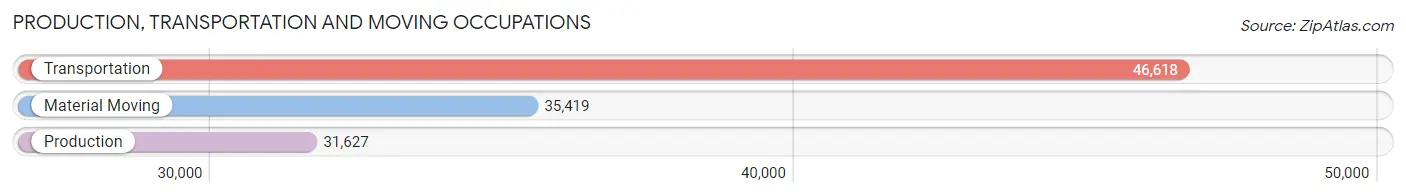
Production, Transportation and Moving Occupations
The most common Production, Transportation and Moving occupations in Area Code 240 are Transportation (46,618 | 3.3%), Material Moving (35,419 | 2.5%), and Production (31,627 | 2.2%).
Production, Transportation and Moving Occupations by Sex
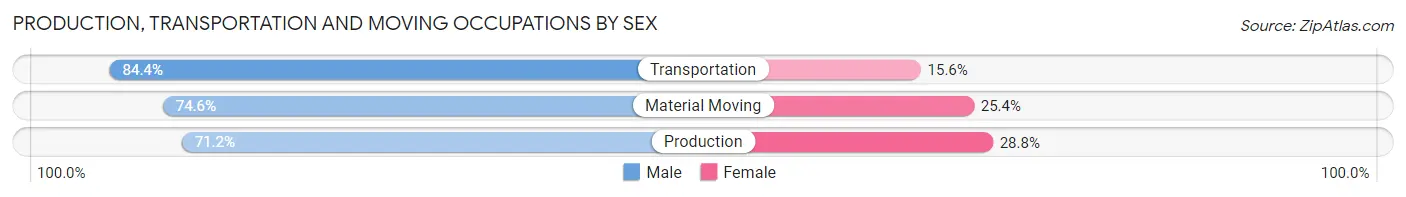
| Occupation | Male | Female |
| Production | 22,507 (71.2%) | 9,120 (28.8%) |
| Transportation | 39,339 (84.4%) | 7,279 (15.6%) |
| Material Moving | 26,436 (74.6%) | 8,983 (25.4%) |
| Total (Category) | 88,282 (77.7%) | 25,382 (22.3%) |
| Total (Overall) | 724,183 (51.1%) | 692,927 (48.9%) |
Employment Industries by Sex in Area Code 240
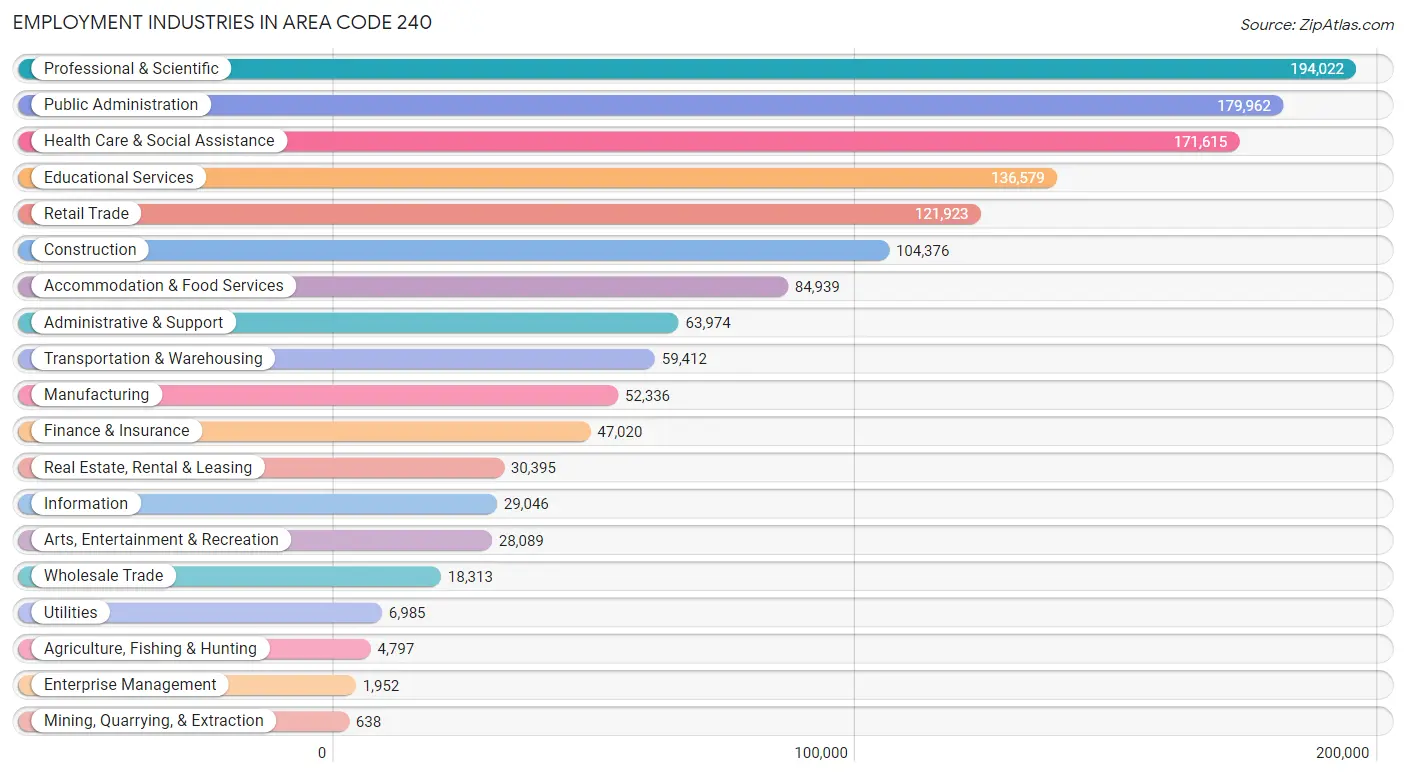
Employment Industries in Area Code 240
The major employment industries in Area Code 240 include Professional & Scientific (194,022 | 13.7%), Public Administration (179,962 | 12.7%), Health Care & Social Assistance (171,615 | 12.1%), Educational Services (136,579 | 9.6%), and Retail Trade (121,923 | 8.6%).
Employment Industries by Sex in Area Code 240
The Area Code 240 industries that see more men than women are Mining, Quarrying, & Extraction (96.1%), Construction (88.5%), and Transportation & Warehousing (75.7%), whereas the industries that tend to have a higher number of women are Health Care & Social Assistance (77.0%), Educational Services (66.9%), and Finance & Insurance (54.5%).
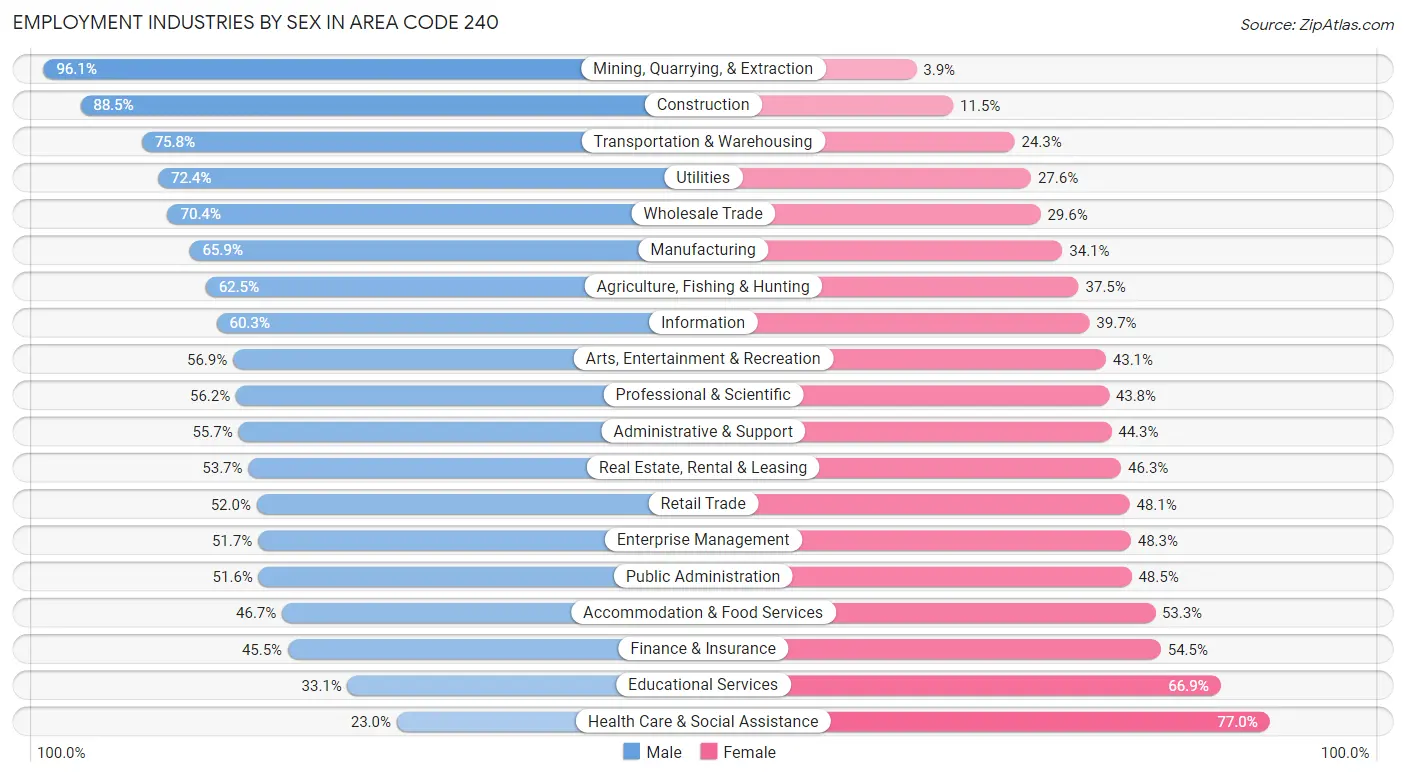
| Industry | Male | Female |
| Agriculture, Fishing & Hunting | 2,998 (62.5%) | 1,799 (37.5%) |
| Mining, Quarrying, & Extraction | 613 (96.1%) | 25 (3.9%) |
| Construction | 92,327 (88.5%) | 12,049 (11.5%) |
| Manufacturing | 34,470 (65.9%) | 17,866 (34.1%) |
| Wholesale Trade | 12,891 (70.4%) | 5,422 (29.6%) |
| Retail Trade | 63,337 (51.9%) | 58,586 (48.0%) |
| Transportation & Warehousing | 45,005 (75.7%) | 14,407 (24.2%) |
| Utilities | 5,054 (72.4%) | 1,931 (27.6%) |
| Information | 17,504 (60.3%) | 11,542 (39.7%) |
| Finance & Insurance | 21,390 (45.5%) | 25,630 (54.5%) |
| Real Estate, Rental & Leasing | 16,320 (53.7%) | 14,075 (46.3%) |
| Professional & Scientific | 109,117 (56.2%) | 84,905 (43.8%) |
| Enterprise Management | 1,009 (51.7%) | 943 (48.3%) |
| Administrative & Support | 35,651 (55.7%) | 28,323 (44.3%) |
| Educational Services | 45,266 (33.1%) | 91,313 (66.9%) |
| Health Care & Social Assistance | 39,427 (23.0%) | 132,188 (77.0%) |
| Arts, Entertainment & Recreation | 15,972 (56.9%) | 12,117 (43.1%) |
| Accommodation & Food Services | 39,666 (46.7%) | 45,273 (53.3%) |
| Public Administration | 92,777 (51.5%) | 87,185 (48.4%) |
| Total | 724,183 (51.1%) | 692,927 (48.9%) |
Education in Area Code 240
School Enrollment in Area Code 240
The most common levels of schooling among the 687,984 students in Area Code 240 are college / undergraduate (147,110 | 21.4%), high school (142,547 | 20.7%), and middle school (139,724 | 20.3%).
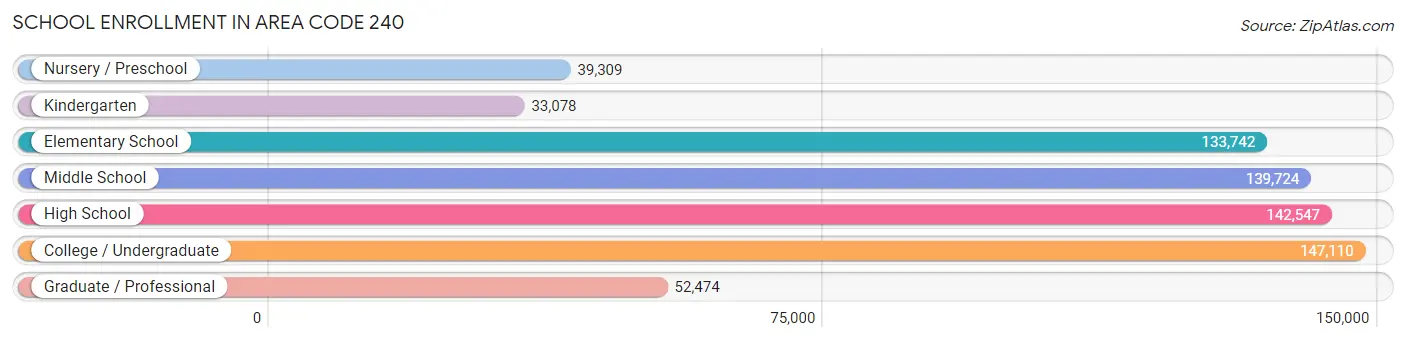
| School Level | # Students | % Students |
| Nursery / Preschool | 39,309 | 5.7% |
| Kindergarten | 33,078 | 4.8% |
| Elementary School | 133,742 | 19.4% |
| Middle School | 139,724 | 20.3% |
| High School | 142,547 | 20.7% |
| College / Undergraduate | 147,110 | 21.4% |
| Graduate / Professional | 52,474 | 7.6% |
| Total | 687,984 | 100.0% |
School Enrollment by Age by Funding Source in Area Code 240
Out of a total of 687,984 students who are enrolled in schools in Area Code 240, 129,713 (18.9%) attend a private institution, while the remaining 558,271 (81.1%) are enrolled in public schools. The age group of 3 to 4 year olds has the highest likelihood of being enrolled in private schools, with 15,350 (51.7% in the age bracket) enrolled. Conversely, the age group of 15 to 17 year olds has the lowest likelihood of being enrolled in a private school, with 86,550 (86.7% in the age bracket) attending a public institution.
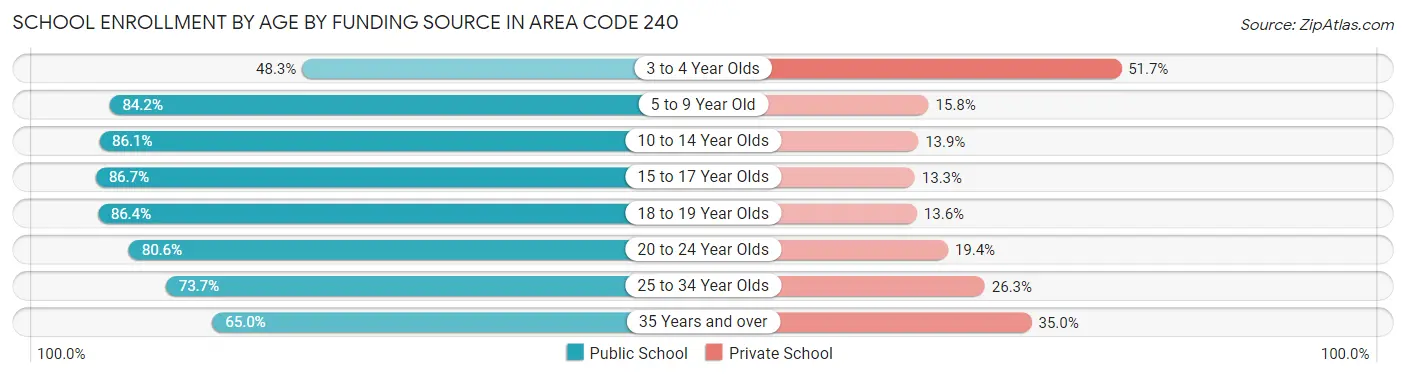
| Age Bracket | Public School | Private School |
| 3 to 4 Year Olds | 14,344 (48.3%) | 15,350 (51.7%) |
| 5 to 9 Year Old | 135,224 (84.2%) | 25,407 (15.8%) |
| 10 to 14 Year Olds | 147,600 (86.1%) | 23,789 (13.9%) |
| 15 to 17 Year Olds | 86,550 (86.7%) | 13,233 (13.3%) |
| 18 to 19 Year Olds | 48,314 (86.4%) | 7,630 (13.6%) |
| 20 to 24 Year Olds | 57,722 (80.6%) | 13,912 (19.4%) |
| 25 to 34 Year Olds | 35,438 (73.7%) | 12,643 (26.3%) |
| 35 Years and over | 33,044 (65.0%) | 17,784 (35.0%) |
| Total | 558,271 (81.1%) | 129,713 (18.9%) |
Educational Attainment by Field of Study in Area Code 240
Business (155,607 | 16.8%), social sciences (109,535 | 11.8%), science & technology (74,625 | 8.1%), engineering (72,552 | 7.8%), and computers & mathematics (70,925 | 7.7%) are the most common fields of study among 925,482 individuals in Area Code 240 who have obtained a bachelor's degree or higher.
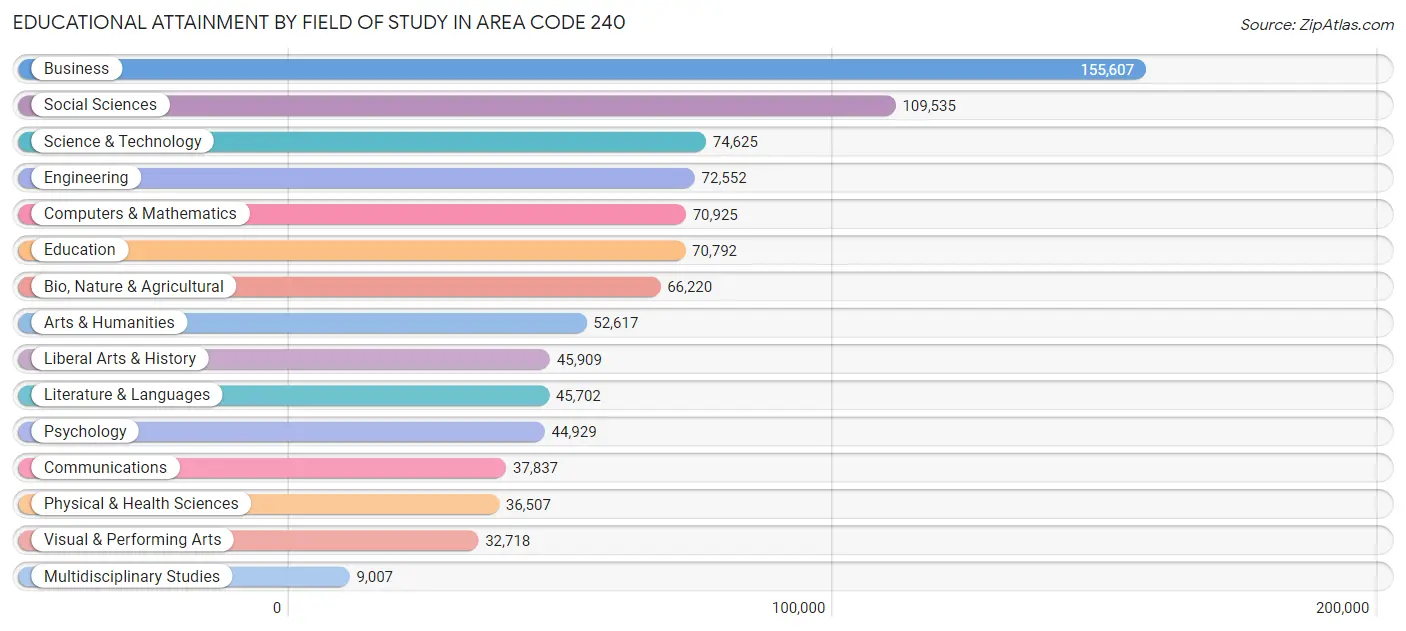
| Field of Study | # Graduates | % Graduates |
| Computers & Mathematics | 70,925 | 7.7% |
| Bio, Nature & Agricultural | 66,220 | 7.2% |
| Physical & Health Sciences | 36,507 | 3.9% |
| Psychology | 44,929 | 4.9% |
| Social Sciences | 109,535 | 11.8% |
| Engineering | 72,552 | 7.8% |
| Multidisciplinary Studies | 9,007 | 1.0% |
| Science & Technology | 74,625 | 8.1% |
| Business | 155,607 | 16.8% |
| Education | 70,792 | 7.6% |
| Literature & Languages | 45,702 | 4.9% |
| Liberal Arts & History | 45,909 | 5.0% |
| Visual & Performing Arts | 32,718 | 3.5% |
| Communications | 37,837 | 4.1% |
| Arts & Humanities | 52,617 | 5.7% |
| Total | 925,482 | 100.0% |
Transportation & Commute in Area Code 240
Vehicle Availability by Sex in Area Code 240
The most prevalent vehicle ownership categories in Area Code 240 are males with 2 vehicles (296,448, accounting for 41.2%) and females with 2 vehicles (262,286, making up 43.8%).
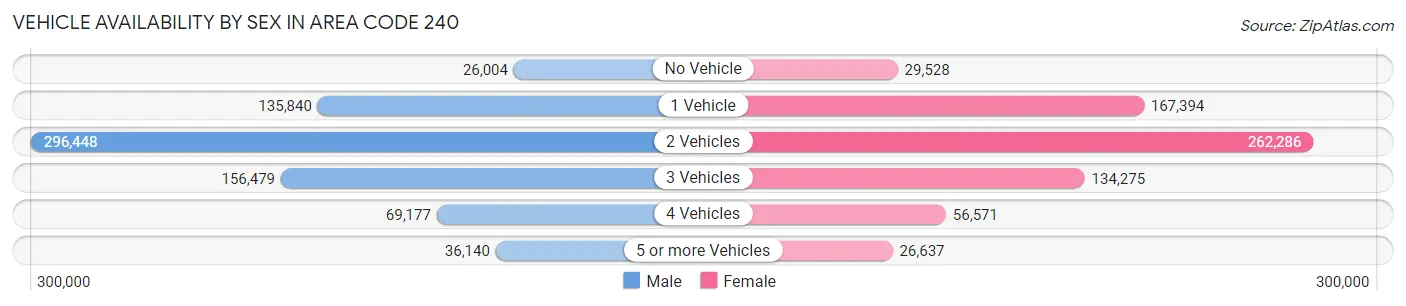
| Vehicles Available | Male | Female |
| No Vehicle | 26,004 (3.6%) | 29,528 (4.4%) |
| 1 Vehicle | 135,840 (18.9%) | 167,394 (24.7%) |
| 2 Vehicles | 296,448 (41.2%) | 262,286 (38.8%) |
| 3 Vehicles | 156,479 (21.7%) | 134,275 (19.8%) |
| 4 Vehicles | 69,177 (9.6%) | 56,571 (8.4%) |
| 5 or more Vehicles | 36,140 (5.0%) | 26,637 (3.9%) |
| Total | 720,088 (100.0%) | 676,691 (100.0%) |
Commute Time in Area Code 240
The most frequently occuring commute durations in Area Code 240 are 30 to 34 minutes (178,240 commuters, 15.2%), 45 to 59 minutes (149,021 commuters, 12.8%), and 20 to 24 minutes (141,496 commuters, 12.1%).
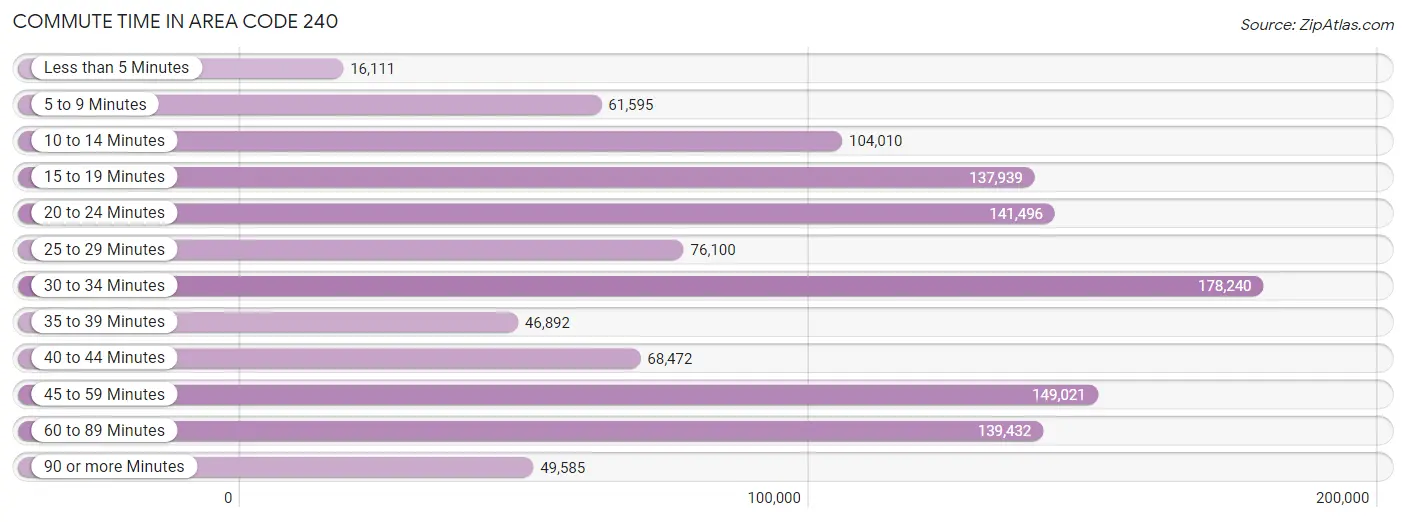
| Commute Time | # Commuters | % Commuters |
| Less than 5 Minutes | 16,111 | 1.4% |
| 5 to 9 Minutes | 61,595 | 5.3% |
| 10 to 14 Minutes | 104,010 | 8.9% |
| 15 to 19 Minutes | 137,939 | 11.8% |
| 20 to 24 Minutes | 141,496 | 12.1% |
| 25 to 29 Minutes | 76,100 | 6.5% |
| 30 to 34 Minutes | 178,240 | 15.2% |
| 35 to 39 Minutes | 46,892 | 4.0% |
| 40 to 44 Minutes | 68,472 | 5.9% |
| 45 to 59 Minutes | 149,021 | 12.8% |
| 60 to 89 Minutes | 139,432 | 11.9% |
| 90 or more Minutes | 49,585 | 4.2% |
Commute Time by Sex in Area Code 240
The most common commute times in Area Code 240 are 30 to 34 minutes (96,318 commuters, 15.7%) for males and 30 to 34 minutes (81,922 commuters, 14.8%) for females.
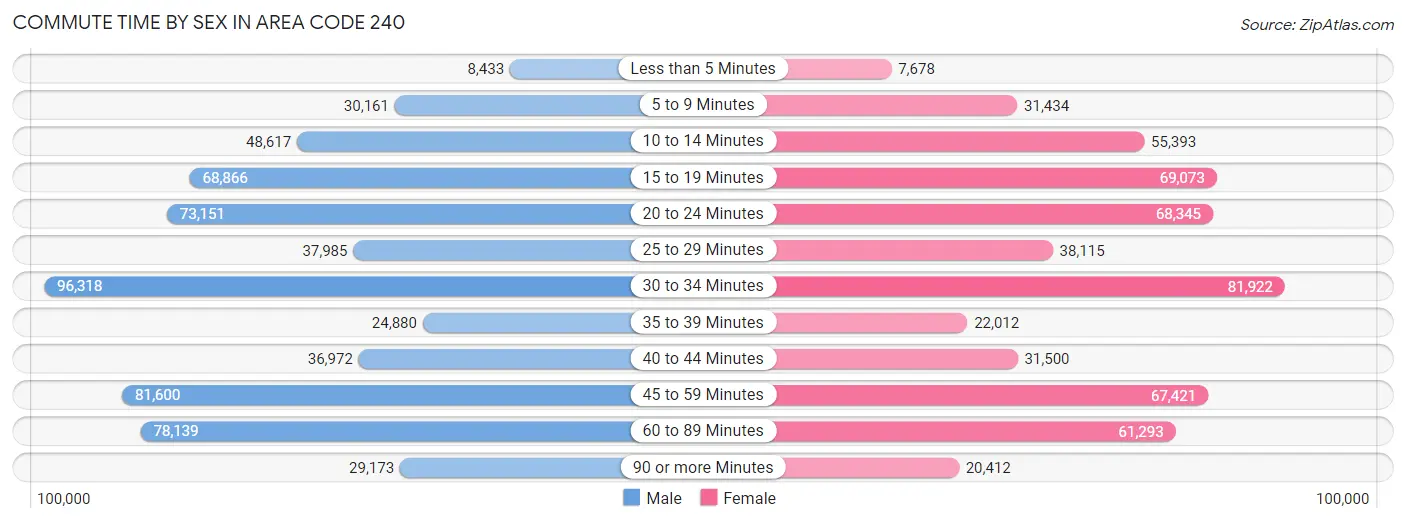
| Commute Time | Male | Female |
| Less than 5 Minutes | 8,433 (1.4%) | 7,678 (1.4%) |
| 5 to 9 Minutes | 30,161 (4.9%) | 31,434 (5.7%) |
| 10 to 14 Minutes | 48,617 (7.9%) | 55,393 (10.0%) |
| 15 to 19 Minutes | 68,866 (11.2%) | 69,073 (12.4%) |
| 20 to 24 Minutes | 73,151 (11.9%) | 68,345 (12.3%) |
| 25 to 29 Minutes | 37,985 (6.2%) | 38,115 (6.9%) |
| 30 to 34 Minutes | 96,318 (15.7%) | 81,922 (14.8%) |
| 35 to 39 Minutes | 24,880 (4.1%) | 22,012 (4.0%) |
| 40 to 44 Minutes | 36,972 (6.0%) | 31,500 (5.7%) |
| 45 to 59 Minutes | 81,600 (13.3%) | 67,421 (12.2%) |
| 60 to 89 Minutes | 78,139 (12.7%) | 61,293 (11.1%) |
| 90 or more Minutes | 29,173 (4.8%) | 20,412 (3.7%) |
Time of Departure to Work by Sex in Area Code 240
The most frequent times of departure to work in Area Code 240 are 7:00 AM to 7:29 AM (78,700, 12.8%) for males and 7:00 AM to 7:29 AM (82,315, 14.8%) for females.
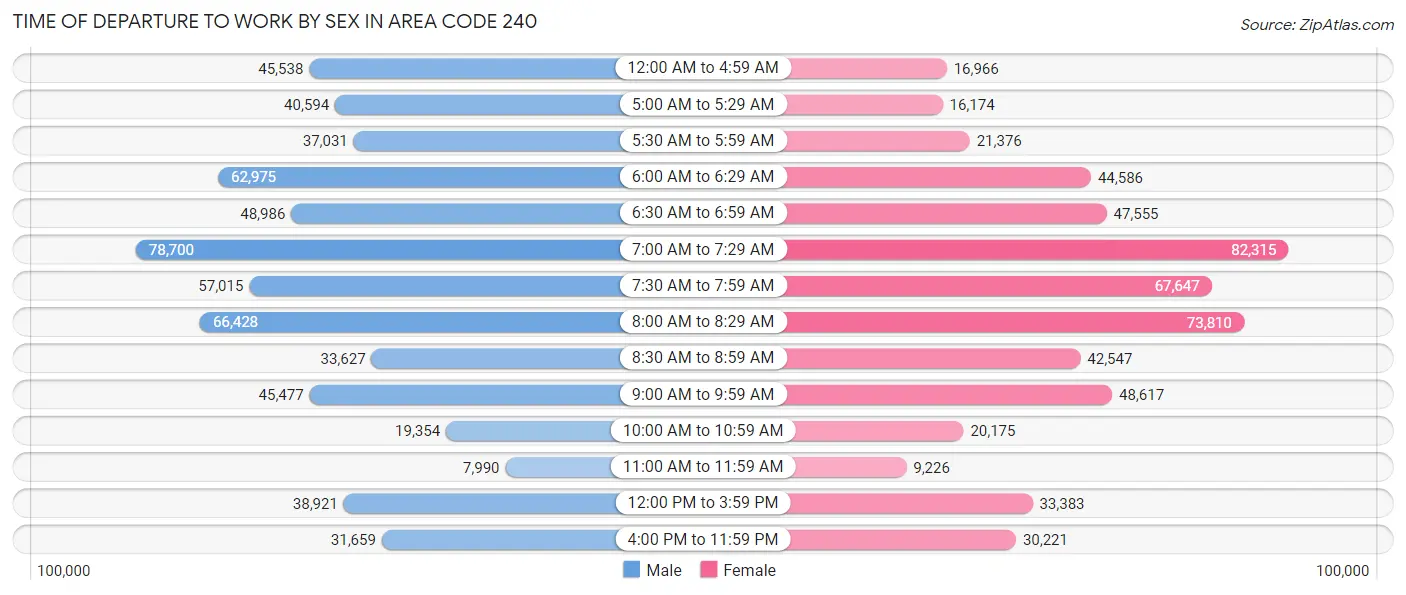
| Time of Departure | Male | Female |
| 12:00 AM to 4:59 AM | 45,538 (7.4%) | 16,966 (3.1%) |
| 5:00 AM to 5:29 AM | 40,594 (6.6%) | 16,174 (2.9%) |
| 5:30 AM to 5:59 AM | 37,031 (6.0%) | 21,376 (3.8%) |
| 6:00 AM to 6:29 AM | 62,975 (10.2%) | 44,586 (8.0%) |
| 6:30 AM to 6:59 AM | 48,986 (8.0%) | 47,555 (8.6%) |
| 7:00 AM to 7:29 AM | 78,700 (12.8%) | 82,315 (14.8%) |
| 7:30 AM to 7:59 AM | 57,015 (9.3%) | 67,647 (12.2%) |
| 8:00 AM to 8:29 AM | 66,428 (10.8%) | 73,810 (13.3%) |
| 8:30 AM to 8:59 AM | 33,627 (5.5%) | 42,547 (7.7%) |
| 9:00 AM to 9:59 AM | 45,477 (7.4%) | 48,617 (8.8%) |
| 10:00 AM to 10:59 AM | 19,354 (3.2%) | 20,175 (3.6%) |
| 11:00 AM to 11:59 AM | 7,990 (1.3%) | 9,226 (1.7%) |
| 12:00 PM to 3:59 PM | 38,921 (6.3%) | 33,383 (6.0%) |
| 4:00 PM to 11:59 PM | 31,659 (5.1%) | 30,221 (5.4%) |
| Total | 614,295 (100.0%) | 554,598 (100.0%) |
Housing Occupancy in Area Code 240
Occupancy by Ownership in Area Code 240
Of the total 1,003,532 dwellings in Area Code 240, owner-occupied units account for 667,418 (66.5%), while renter-occupied units make up 336,114 (33.5%).
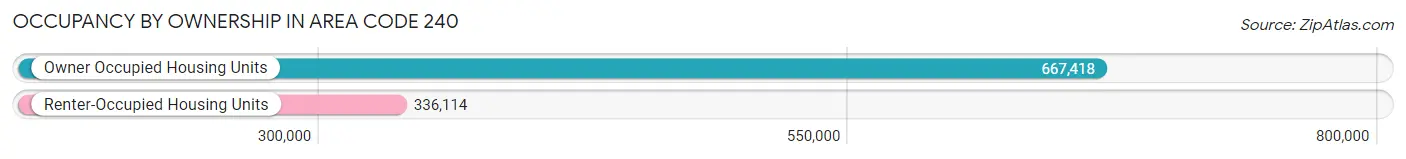
| Occupancy | # Housing Units | % Housing Units |
| Owner Occupied Housing Units | 667,418 | 66.5% |
| Renter-Occupied Housing Units | 336,114 | 33.5% |
| Total Occupied Housing Units | 1,003,532 | 100.0% |
Occupancy by Household Size in Area Code 240
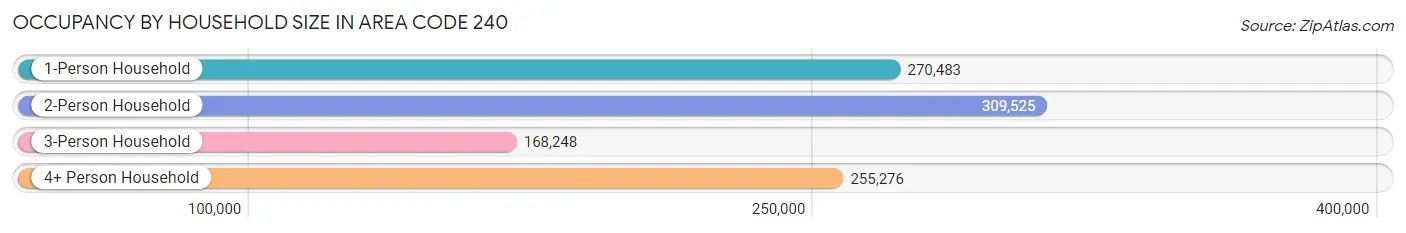
| Household Size | # Housing Units | % Housing Units |
| 1-Person Household | 270,483 | 27.0% |
| 2-Person Household | 309,525 | 30.8% |
| 3-Person Household | 168,248 | 16.8% |
| 4+ Person Household | 255,276 | 25.4% |
| Total Housing Units | 1,003,532 | 100.0% |
Occupancy by Ownership by Household Size in Area Code 240
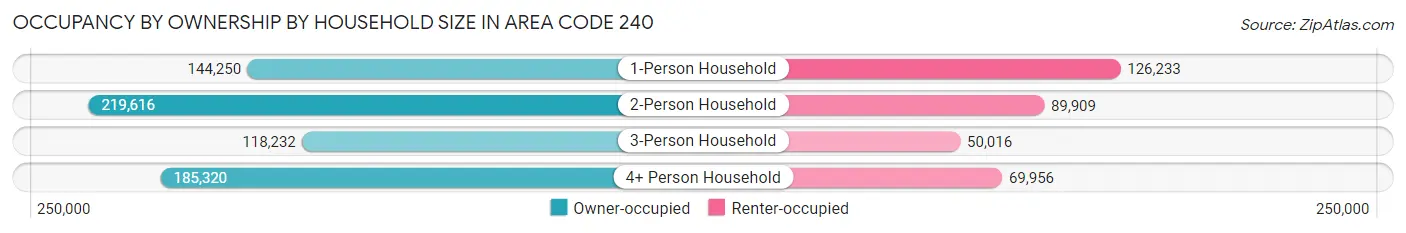
| Household Size | Owner-occupied | Renter-occupied |
| 1-Person Household | 144,250 (53.3%) | 126,233 (46.7%) |
| 2-Person Household | 219,616 (71.0%) | 89,909 (29.0%) |
| 3-Person Household | 118,232 (70.3%) | 50,016 (29.7%) |
| 4+ Person Household | 185,320 (72.6%) | 69,956 (27.4%) |
| Total Housing Units | 667,418 (66.5%) | 336,114 (33.5%) |
Occupancy by Educational Attainment in Area Code 240
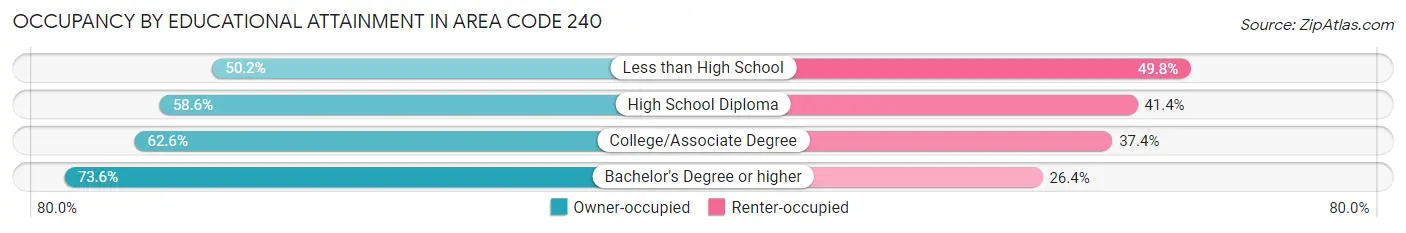
| Household Size | Owner-occupied | Renter-occupied |
| Less than High School | 34,442 (50.2%) | 34,135 (49.8%) |
| High School Diploma | 107,591 (58.6%) | 76,151 (41.4%) |
| College/Associate Degree | 156,557 (62.6%) | 93,692 (37.4%) |
| Bachelor's Degree or higher | 368,828 (73.6%) | 132,136 (26.4%) |
Occupancy by Age of Householder in Area Code 240
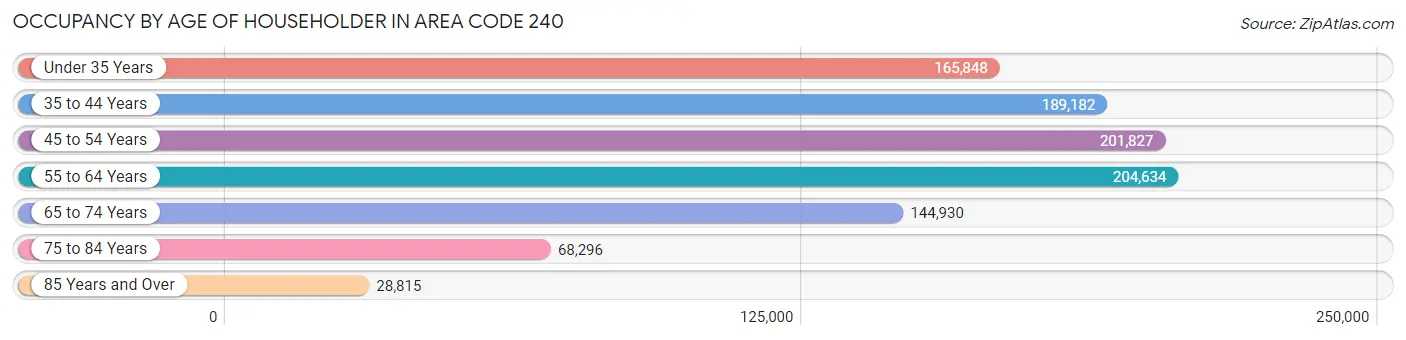
| Age Bracket | # Households | % Households |
| Under 35 Years | 165,848 | 16.5% |
| 35 to 44 Years | 189,182 | 18.9% |
| 45 to 54 Years | 201,827 | 20.1% |
| 55 to 64 Years | 204,634 | 20.4% |
| 65 to 74 Years | 144,930 | 14.4% |
| 75 to 84 Years | 68,296 | 6.8% |
| 85 Years and Over | 28,815 | 2.9% |
| Total | 1,003,532 | 100.0% |
Housing Finances in Area Code 240
Median Income by Occupancy in Area Code 240
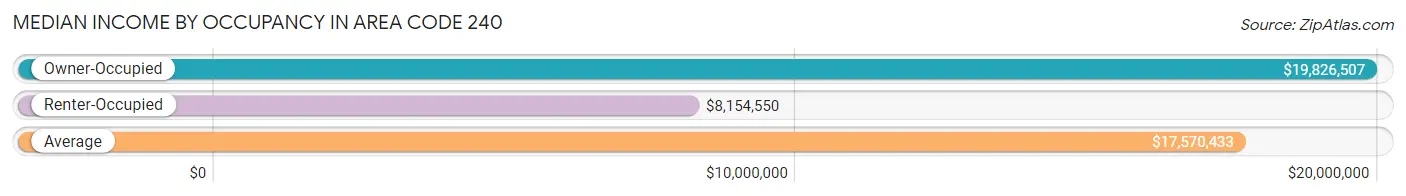
| Occupancy Type | # Households | Median Income |
| Owner-Occupied | 667,418 (66.5%) | $19,826,507 |
| Renter-Occupied | 336,114 (33.5%) | $8,154,550 |
| Average | 1,003,532 (100.0%) | $17,570,433 |
Occupancy by Householder Income Bracket in Area Code 240
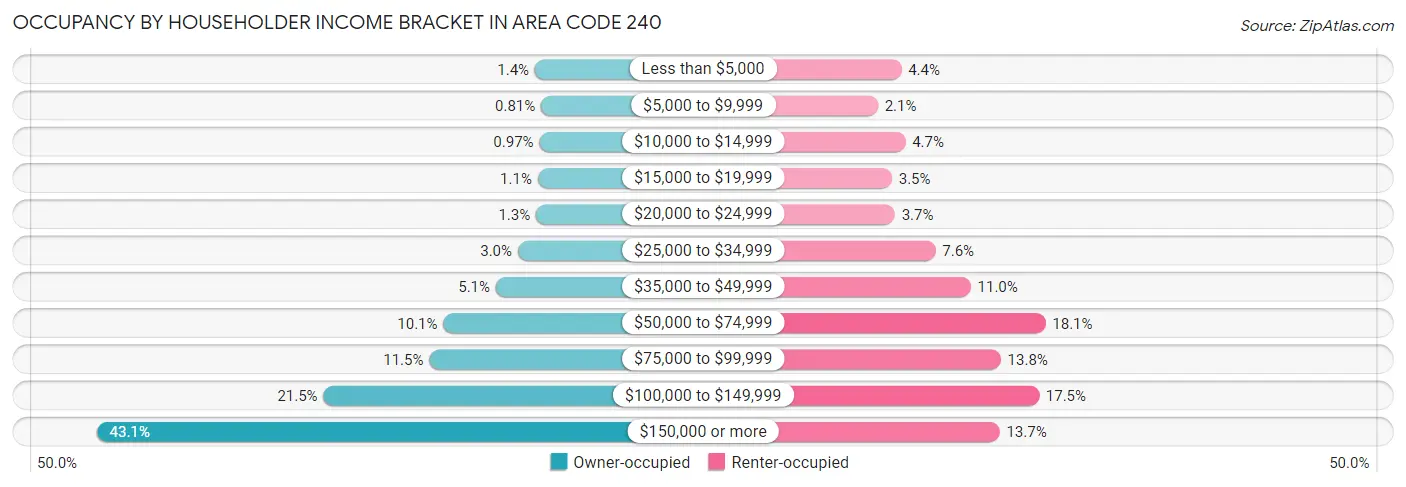
| Income Bracket | Owner-occupied | Renter-occupied |
| Less than $5,000 | 9,353 (1.4%) | 14,621 (4.3%) |
| $5,000 to $9,999 | 5,387 (0.8%) | 7,105 (2.1%) |
| $10,000 to $14,999 | 6,444 (1.0%) | 15,903 (4.7%) |
| $15,000 to $19,999 | 7,532 (1.1%) | 11,596 (3.5%) |
| $20,000 to $24,999 | 8,635 (1.3%) | 12,532 (3.7%) |
| $25,000 to $34,999 | 20,158 (3.0%) | 25,543 (7.6%) |
| $35,000 to $49,999 | 34,174 (5.1%) | 36,839 (11.0%) |
| $50,000 to $74,999 | 67,559 (10.1%) | 60,772 (18.1%) |
| $75,000 to $99,999 | 76,477 (11.5%) | 46,460 (13.8%) |
| $100,000 to $149,999 | 143,785 (21.5%) | 58,669 (17.5%) |
| $150,000 or more | 287,914 (43.1%) | 46,074 (13.7%) |
| Total | 667,418 (100.0%) | 336,114 (100.0%) |
Monthly Housing Cost Tiers in Area Code 240
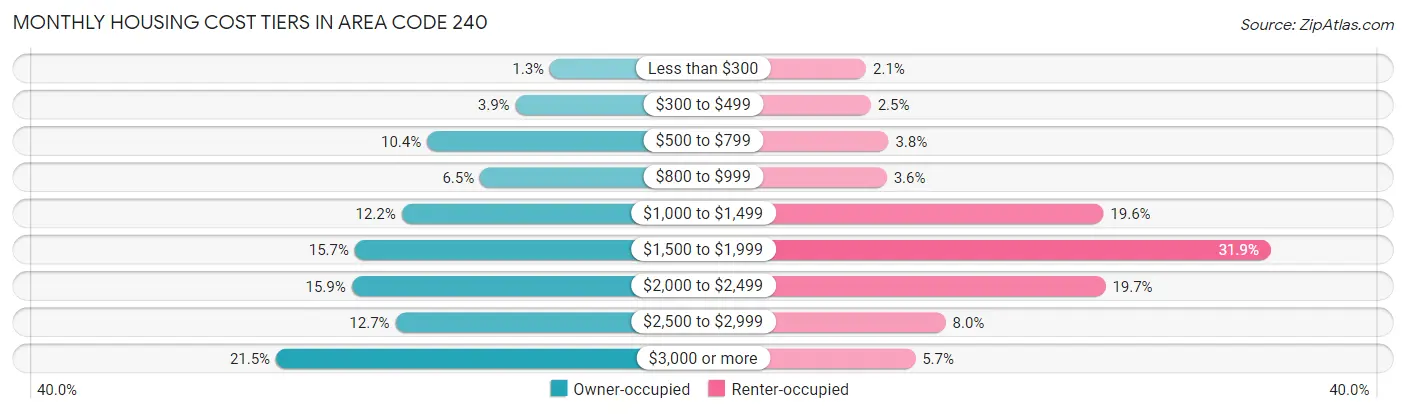
| Monthly Cost | Owner-occupied | Renter-occupied |
| Less than $300 | 8,713 (1.3%) | 7,097 (2.1%) |
| $300 to $499 | 25,711 (3.8%) | 8,225 (2.5%) |
| $500 to $799 | 69,146 (10.4%) | 12,626 (3.8%) |
| $800 to $999 | 43,110 (6.5%) | 12,198 (3.6%) |
| $1,000 to $1,499 | 81,722 (12.2%) | 65,847 (19.6%) |
| $1,500 to $1,999 | 104,680 (15.7%) | 107,247 (31.9%) |
| $2,000 to $2,499 | 106,256 (15.9%) | 66,346 (19.7%) |
| $2,500 to $2,999 | 84,671 (12.7%) | 26,773 (8.0%) |
| $3,000 or more | 143,409 (21.5%) | 19,253 (5.7%) |
| Total | 667,418 (100.0%) | 336,114 (100.0%) |
Physical Housing Characteristics in Area Code 240
Housing Structures in Area Code 240
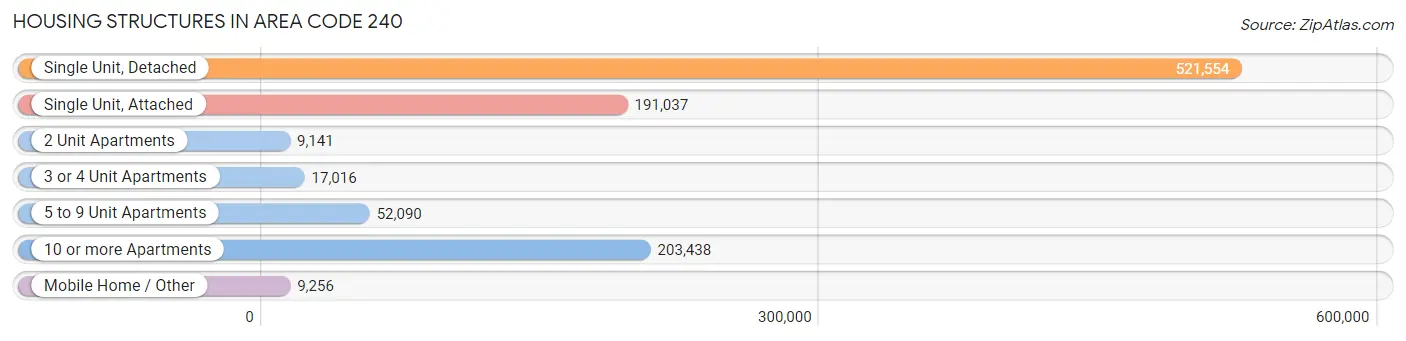
| Structure Type | # Housing Units | % Housing Units |
| Single Unit, Detached | 521,554 | 52.0% |
| Single Unit, Attached | 191,037 | 19.0% |
| 2 Unit Apartments | 9,141 | 0.9% |
| 3 or 4 Unit Apartments | 17,016 | 1.7% |
| 5 to 9 Unit Apartments | 52,090 | 5.2% |
| 10 or more Apartments | 203,438 | 20.3% |
| Mobile Home / Other | 9,256 | 0.9% |
| Total | 1,003,532 | 100.0% |
Housing Structures by Occupancy in Area Code 240
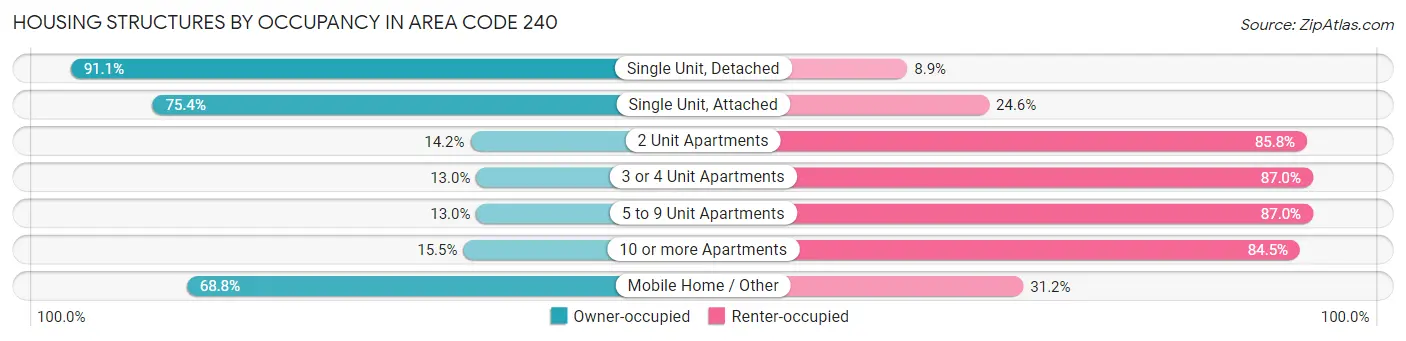
| Structure Type | Owner-occupied | Renter-occupied |
| Single Unit, Detached | 475,174 (91.1%) | 46,380 (8.9%) |
| Single Unit, Attached | 143,982 (75.4%) | 47,055 (24.6%) |
| 2 Unit Apartments | 1,296 (14.2%) | 7,845 (85.8%) |
| 3 or 4 Unit Apartments | 2,219 (13.0%) | 14,797 (87.0%) |
| 5 to 9 Unit Apartments | 6,788 (13.0%) | 45,302 (87.0%) |
| 10 or more Apartments | 31,594 (15.5%) | 171,844 (84.5%) |
| Mobile Home / Other | 6,365 (68.8%) | 2,891 (31.2%) |
| Total | 667,418 (66.5%) | 336,114 (33.5%) |
Housing Structures by Number of Rooms in Area Code 240
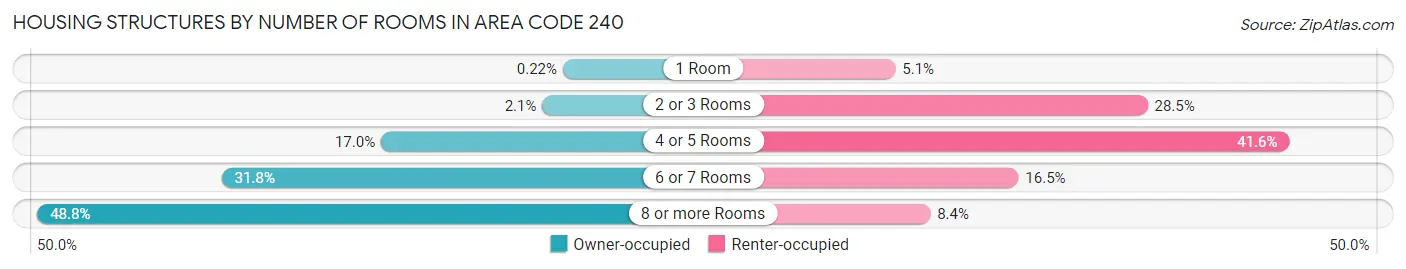
| Number of Rooms | Owner-occupied | Renter-occupied |
| 1 Room | 1,468 (0.2%) | 17,256 (5.1%) |
| 2 or 3 Rooms | 14,164 (2.1%) | 95,611 (28.4%) |
| 4 or 5 Rooms | 113,761 (17.0%) | 139,690 (41.6%) |
| 6 or 7 Rooms | 212,113 (31.8%) | 55,495 (16.5%) |
| 8 or more Rooms | 325,912 (48.8%) | 28,062 (8.4%) |
| Total | 667,418 (100.0%) | 336,114 (100.0%) |
Housing Structure by Heating Type in Area Code 240
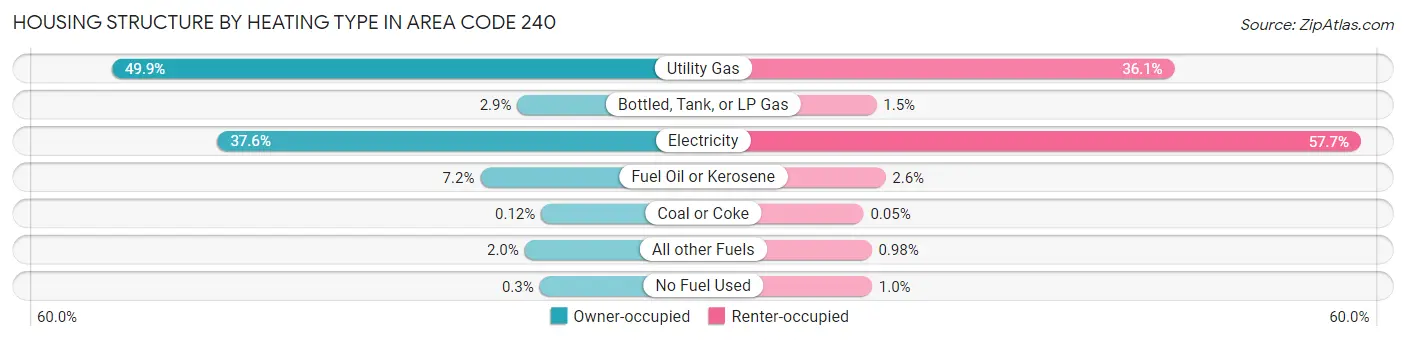
| Heating Type | Owner-occupied | Renter-occupied |
| Utility Gas | 332,845 (49.9%) | 121,345 (36.1%) |
| Bottled, Tank, or LP Gas | 19,235 (2.9%) | 5,178 (1.5%) |
| Electricity | 251,173 (37.6%) | 193,980 (57.7%) |
| Fuel Oil or Kerosene | 47,850 (7.2%) | 8,714 (2.6%) |
| Coal or Coke | 812 (0.1%) | 176 (0.1%) |
| All other Fuels | 13,526 (2.0%) | 3,283 (1.0%) |
| No Fuel Used | 1,977 (0.3%) | 3,438 (1.0%) |
| Total | 667,418 (100.0%) | 336,114 (100.0%) |
Household Vehicle Usage in Area Code 240
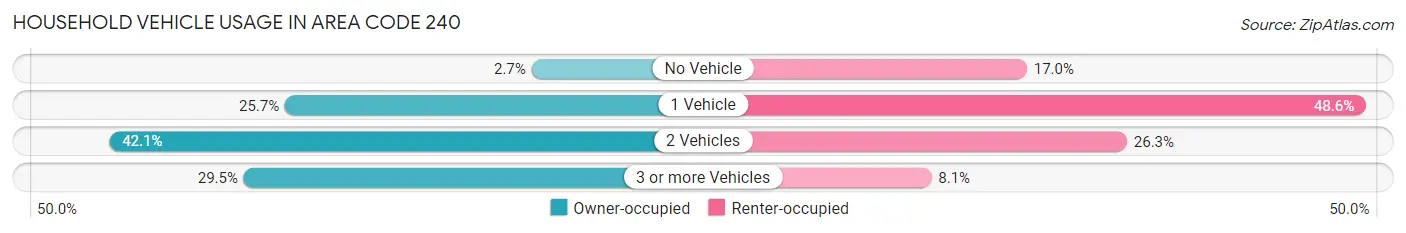
| Vehicles per Household | Owner-occupied | Renter-occupied |
| No Vehicle | 17,814 (2.7%) | 57,063 (17.0%) |
| 1 Vehicle | 171,447 (25.7%) | 163,473 (48.6%) |
| 2 Vehicles | 281,013 (42.1%) | 88,468 (26.3%) |
| 3 or more Vehicles | 197,144 (29.5%) | 27,110 (8.1%) |
| Total | 667,418 (100.0%) | 336,114 (100.0%) |
Real Estate & Mortgages in Area Code 240
Real Estate and Mortgage Overview in Area Code 240
| Characteristic | Without Mortgage | With Mortgage |
| Housing Units | 172,226 | 495,192 |
| Median Property Value | $60,228,300 | $67,474,400 |
| Median Household Income | $13,954,988 | $232,436 |
| Monthly Housing Costs | $108,205 | $142,378 |
| Real Estate Taxes | $613,269 | $10,365 |
Property Value by Mortgage Status in Area Code 240
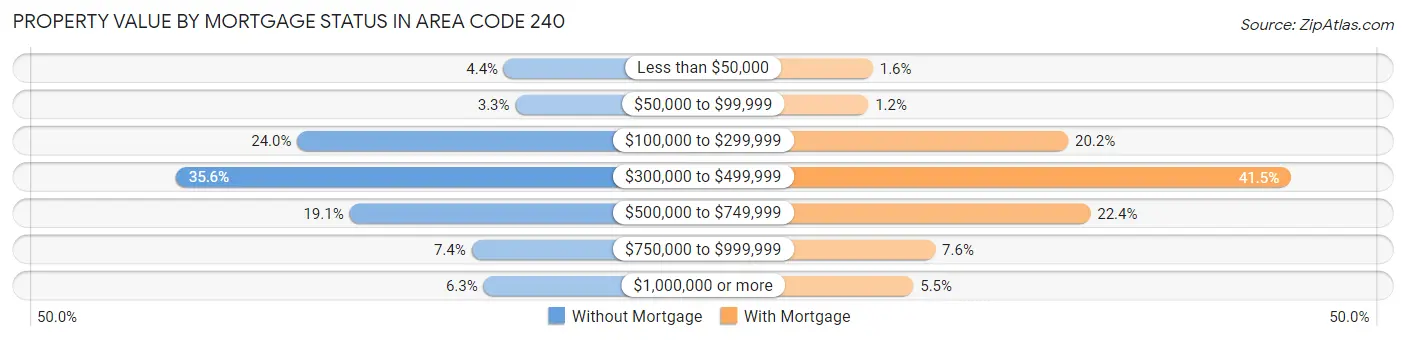
| Property Value | Without Mortgage | With Mortgage |
| Less than $50,000 | 7,493 (4.3%) | 8,130 (1.6%) |
| $50,000 to $99,999 | 5,609 (3.3%) | 6,003 (1.2%) |
| $100,000 to $299,999 | 41,389 (24.0%) | 100,210 (20.2%) |
| $300,000 to $499,999 | 61,288 (35.6%) | 205,352 (41.5%) |
| $500,000 to $749,999 | 32,821 (19.1%) | 110,718 (22.4%) |
| $750,000 to $999,999 | 12,800 (7.4%) | 37,540 (7.6%) |
| $1,000,000 or more | 10,826 (6.3%) | 27,239 (5.5%) |
| Total | 172,226 (100.0%) | 495,192 (100.0%) |
Household Income by Mortgage Status in Area Code 240
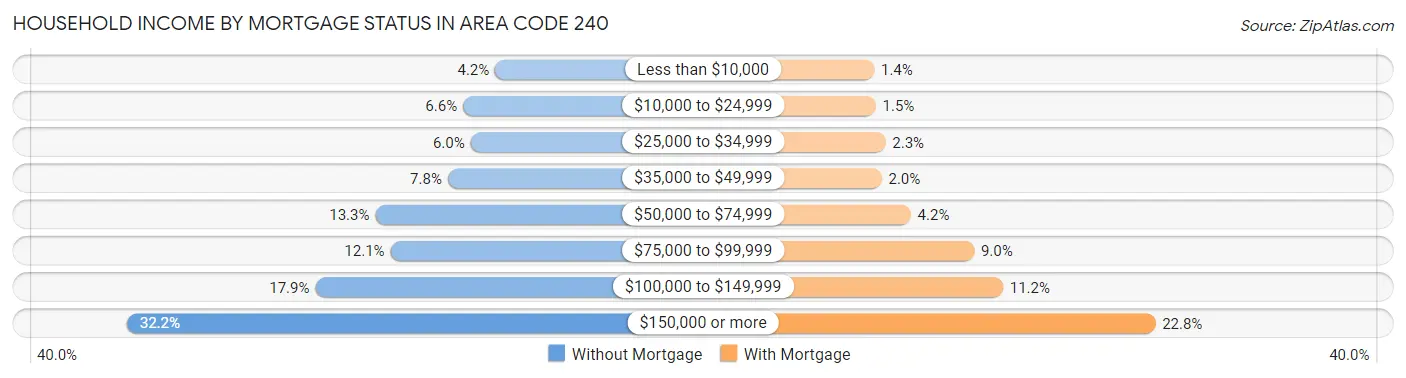
| Household Income | Without Mortgage | With Mortgage |
| Less than $10,000 | 7,139 (4.2%) | 6,982 (1.4%) |
| $10,000 to $24,999 | 11,366 (6.6%) | 7,601 (1.5%) |
| $25,000 to $34,999 | 10,373 (6.0%) | 11,245 (2.3%) |
| $35,000 to $49,999 | 13,363 (7.8%) | 9,785 (2.0%) |
| $50,000 to $74,999 | 22,874 (13.3%) | 20,811 (4.2%) |
| $75,000 to $99,999 | 20,893 (12.1%) | 44,685 (9.0%) |
| $100,000 to $149,999 | 30,740 (17.8%) | 55,584 (11.2%) |
| $150,000 or more | 55,478 (32.2%) | 113,045 (22.8%) |
| Total | 172,226 (100.0%) | 495,192 (100.0%) |
Property Value to Household Income Ratio in Area Code 240
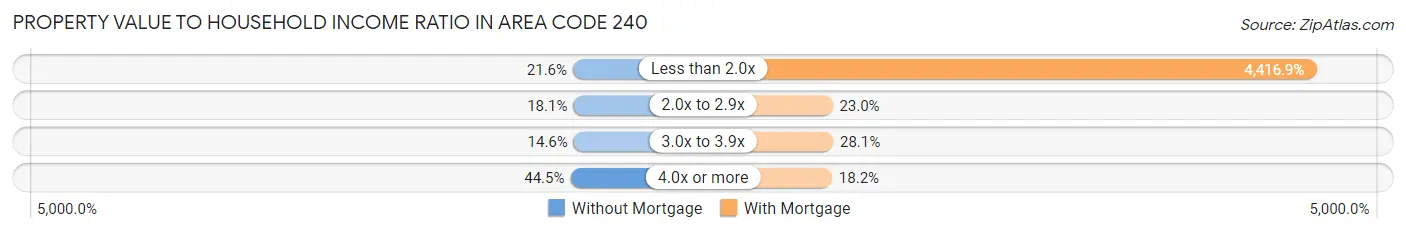
| Value-to-Income Ratio | Without Mortgage | With Mortgage |
| Less than 2.0x | 37,143 (21.6%) | 21,871,986 (4,416.9%) |
| 2.0x to 2.9x | 31,211 (18.1%) | 114,048 (23.0%) |
| 3.0x to 3.9x | 25,141 (14.6%) | 139,164 (28.1%) |
| 4.0x or more | 76,676 (44.5%) | 90,177 (18.2%) |
| Total | 172,226 (100.0%) | 495,192 (100.0%) |
Real Estate Taxes by Mortgage Status in Area Code 240
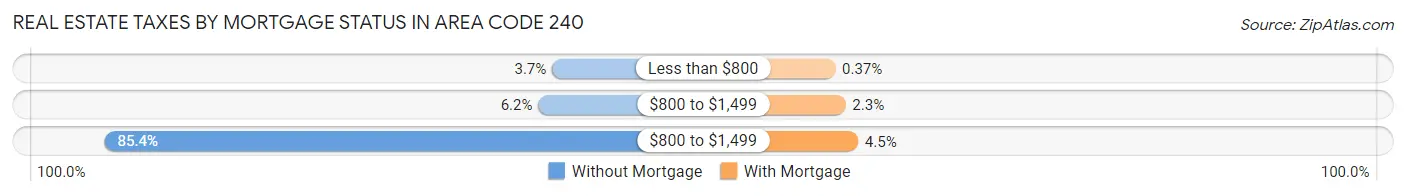
| Property Taxes | Without Mortgage | With Mortgage |
| Less than $800 | 6,292 (3.6%) | 1,808 (0.4%) |
| $800 to $1,499 | 10,624 (6.2%) | 11,172 (2.3%) |
| $800 to $1,499 | 147,031 (85.4%) | 22,464 (4.5%) |
| Total | 172,226 (100.0%) | 495,192 (100.0%) |
Health & Disability in Area Code 240
Health Insurance Coverage by Age in Area Code 240
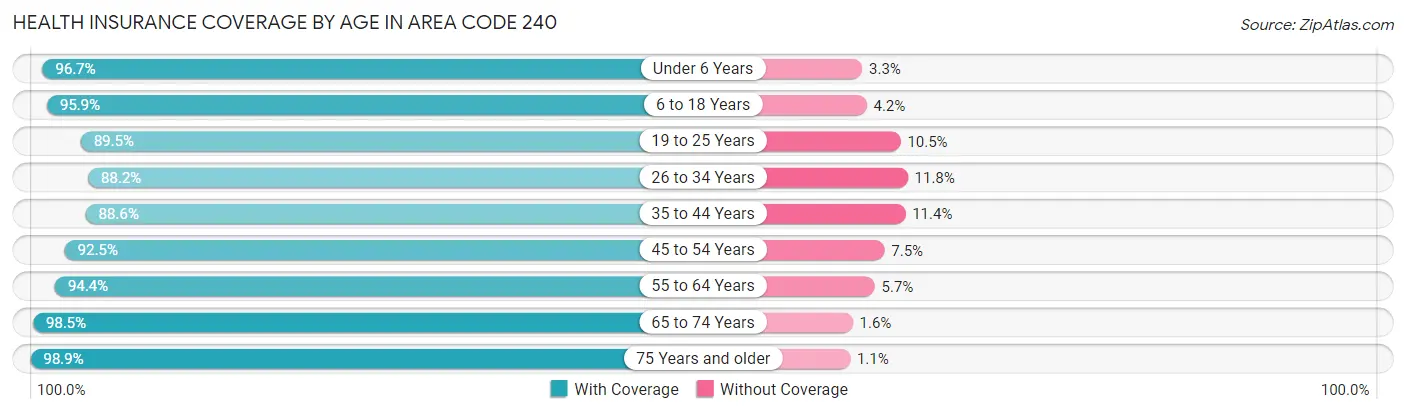
| Age Bracket | With Coverage | Without Coverage |
| Under 6 Years | 188,317 (96.7%) | 6,459 (3.3%) |
| 6 to 18 Years | 433,713 (95.9%) | 18,784 (4.2%) |
| 19 to 25 Years | 208,653 (89.5%) | 24,409 (10.5%) |
| 26 to 34 Years | 281,748 (88.2%) | 37,719 (11.8%) |
| 35 to 44 Years | 325,663 (88.6%) | 41,720 (11.4%) |
| 45 to 54 Years | 335,081 (92.5%) | 27,048 (7.5%) |
| 55 to 64 Years | 337,215 (94.4%) | 20,196 (5.7%) |
| 65 to 74 Years | 237,493 (98.5%) | 3,731 (1.5%) |
| 75 Years and older | 156,143 (98.9%) | 1,671 (1.1%) |
| Total | 2,504,026 (93.2%) | 181,737 (6.8%) |
Health Insurance Coverage by Citizenship Status in Area Code 240
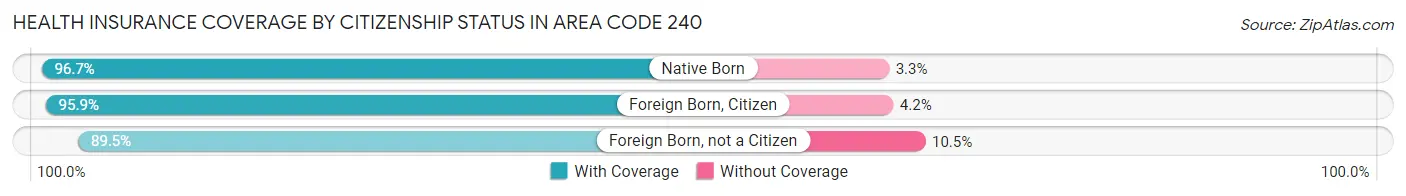
| Citizenship Status | With Coverage | Without Coverage |
| Native Born | 188,317 (96.7%) | 6,459 (3.3%) |
| Foreign Born, Citizen | 433,713 (95.9%) | 18,784 (4.2%) |
| Foreign Born, not a Citizen | 208,653 (89.5%) | 24,409 (10.5%) |
Health Insurance Coverage by Household Income in Area Code 240
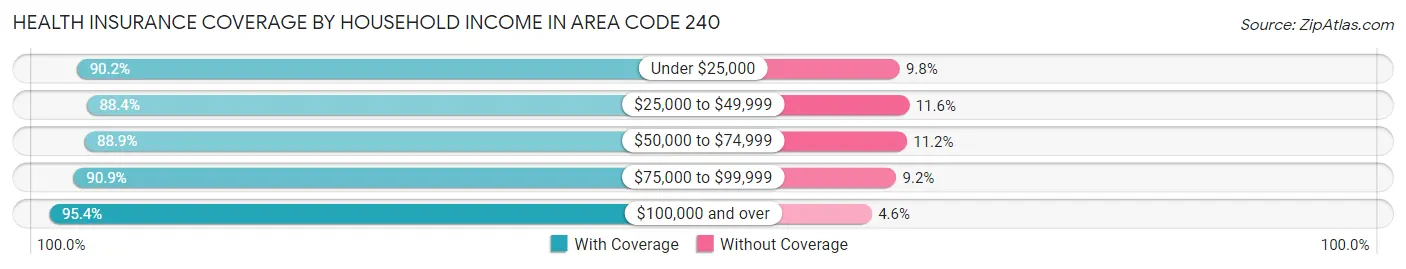
| Household Income | With Coverage | Without Coverage |
| Under $25,000 | 154,552 (90.2%) | 16,728 (9.8%) |
| $25,000 to $49,999 | 222,117 (88.4%) | 29,136 (11.6%) |
| $50,000 to $74,999 | 258,427 (88.8%) | 32,428 (11.2%) |
| $75,000 to $99,999 | 274,832 (90.8%) | 27,668 (9.1%) |
| $100,000 and over | 1,570,793 (95.4%) | 75,266 (4.6%) |
Public vs Private Health Insurance Coverage by Age in Area Code 240
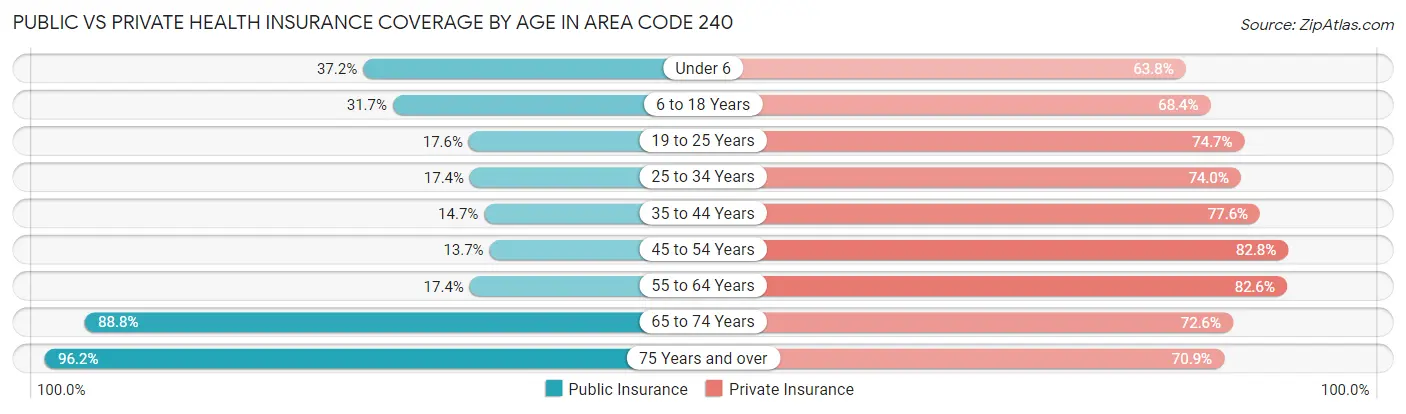
| Age Bracket | Public Insurance | Private Insurance |
| Under 6 | 72,444 (37.2%) | 124,241 (63.8%) |
| 6 to 18 Years | 143,262 (31.7%) | 309,449 (68.4%) |
| 19 to 25 Years | 40,908 (17.5%) | 174,123 (74.7%) |
| 25 to 34 Years | 55,418 (17.3%) | 236,541 (74.0%) |
| 35 to 44 Years | 54,000 (14.7%) | 285,131 (77.6%) |
| 45 to 54 Years | 49,696 (13.7%) | 299,998 (82.8%) |
| 55 to 64 Years | 62,164 (17.4%) | 295,174 (82.6%) |
| 65 to 74 Years | 214,107 (88.8%) | 175,088 (72.6%) |
| 75 Years and over | 151,824 (96.2%) | 111,921 (70.9%) |
| Total | 843,823 (31.4%) | 2,011,666 (74.9%) |
Disability Status by Sex by Age in Area Code 240
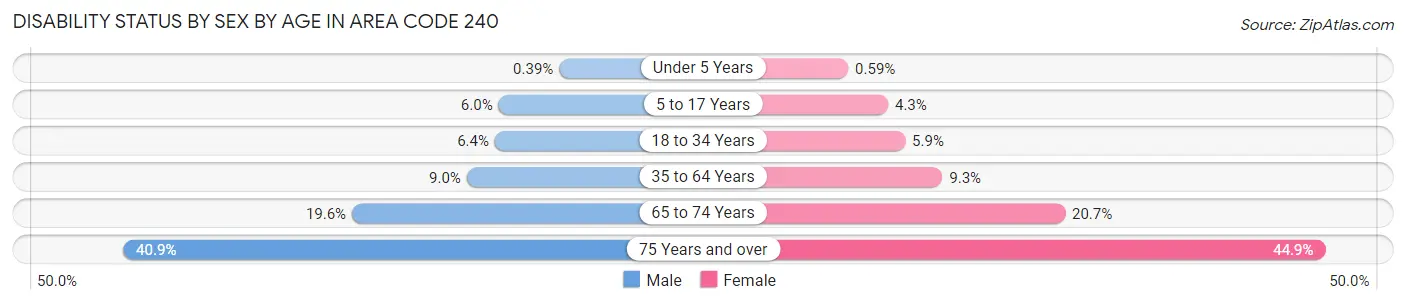
| Age Bracket | Male | Female |
| Under 5 Years | 324 (0.4%) | 466 (0.6%) |
| 5 to 17 Years | 13,833 (6.0%) | 9,315 (4.3%) |
| 18 to 34 Years | 18,615 (6.4%) | 17,466 (5.9%) |
| 35 to 64 Years | 47,023 (9.0%) | 52,463 (9.3%) |
| 65 to 74 Years | 21,648 (19.6%) | 27,123 (20.7%) |
| 75 Years and over | 25,543 (40.8%) | 42,759 (44.9%) |
Disability Class by Sex by Age in Area Code 240
Disability Class: Hearing Difficulty
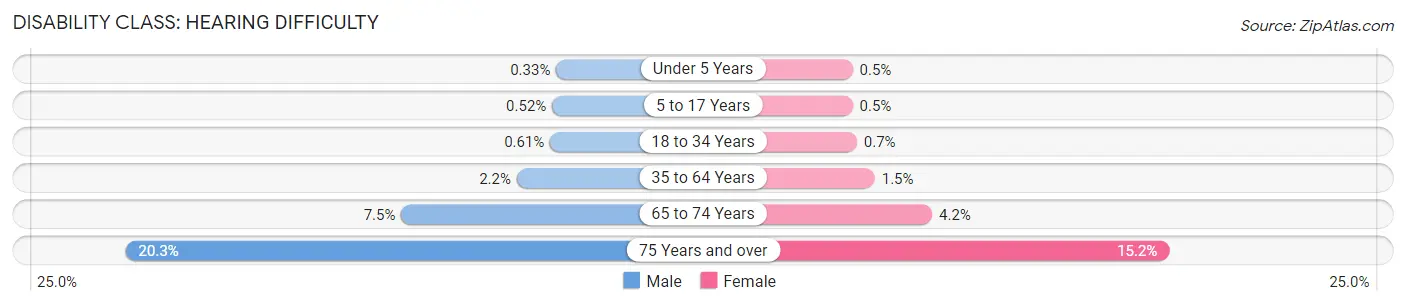
| Age Bracket | Male | Female |
| Under 5 Years | 272 (0.3%) | 395 (0.5%) |
| 5 to 17 Years | 1,196 (0.5%) | 1,078 (0.5%) |
| 18 to 34 Years | 1,778 (0.6%) | 2,071 (0.7%) |
| 35 to 64 Years | 11,332 (2.2%) | 8,596 (1.5%) |
| 65 to 74 Years | 8,302 (7.5%) | 5,480 (4.2%) |
| 75 Years and over | 12,708 (20.3%) | 14,474 (15.2%) |
Disability Class: Vision Difficulty
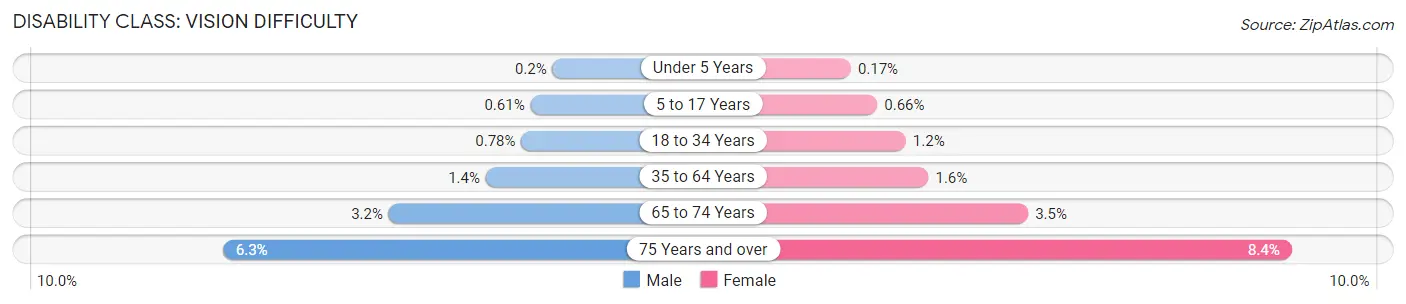
| Age Bracket | Male | Female |
| Under 5 Years | 169 (0.2%) | 132 (0.2%) |
| 5 to 17 Years | 1,398 (0.6%) | 1,426 (0.7%) |
| 18 to 34 Years | 2,297 (0.8%) | 3,524 (1.2%) |
| 35 to 64 Years | 7,562 (1.4%) | 9,049 (1.6%) |
| 65 to 74 Years | 3,576 (3.2%) | 4,524 (3.5%) |
| 75 Years and over | 3,952 (6.3%) | 7,957 (8.4%) |
Disability Class: Cognitive Difficulty
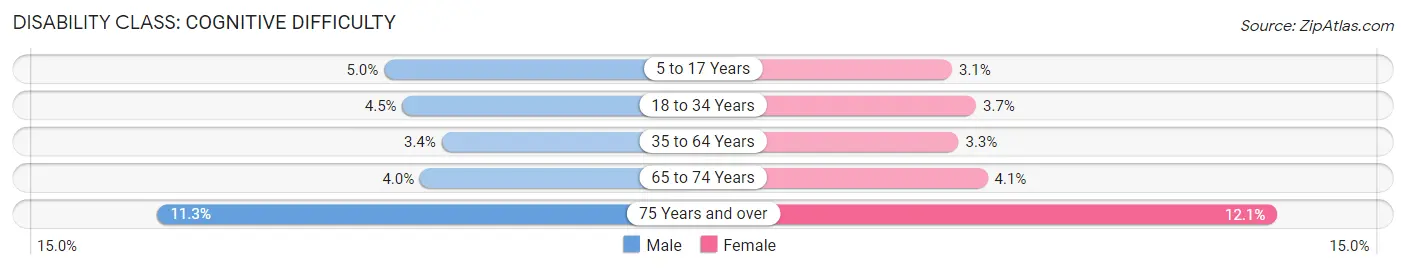
| Age Bracket | Male | Female |
| 5 to 17 Years | 11,460 (5.0%) | 6,670 (3.1%) |
| 18 to 34 Years | 13,117 (4.5%) | 11,121 (3.7%) |
| 35 to 64 Years | 17,749 (3.4%) | 18,308 (3.3%) |
| 65 to 74 Years | 4,399 (4.0%) | 5,319 (4.1%) |
| 75 Years and over | 7,066 (11.3%) | 11,545 (12.1%) |
Disability Class: Ambulatory Difficulty
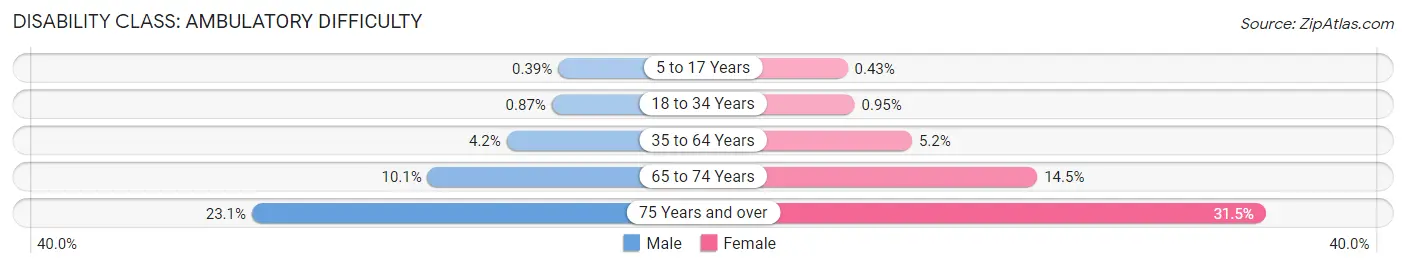
| Age Bracket | Male | Female |
| 5 to 17 Years | 891 (0.4%) | 943 (0.4%) |
| 18 to 34 Years | 2,559 (0.9%) | 2,810 (0.9%) |
| 35 to 64 Years | 22,067 (4.2%) | 29,311 (5.2%) |
| 65 to 74 Years | 11,128 (10.1%) | 18,991 (14.5%) |
| 75 Years and over | 14,464 (23.1%) | 29,982 (31.5%) |
Disability Class: Self-Care Difficulty
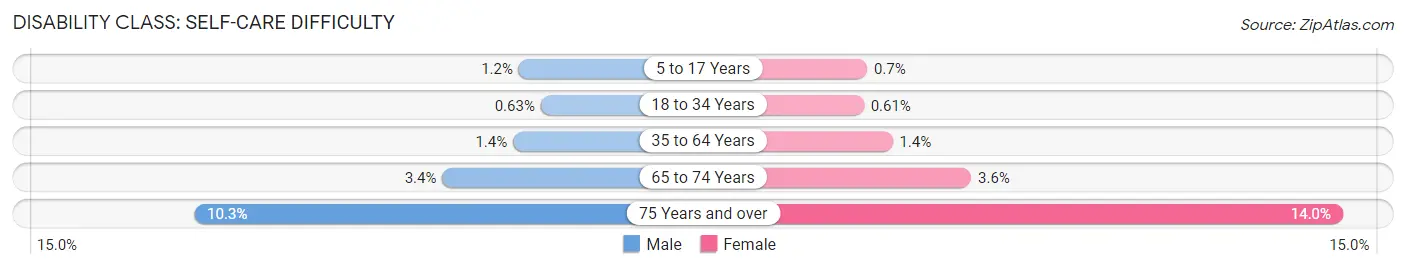
| Age Bracket | Male | Female |
| 5 to 17 Years | 2,856 (1.2%) | 1,520 (0.7%) |
| 18 to 34 Years | 1,845 (0.6%) | 1,806 (0.6%) |
| 35 to 64 Years | 7,344 (1.4%) | 7,943 (1.4%) |
| 65 to 74 Years | 3,714 (3.4%) | 4,712 (3.6%) |
| 75 Years and over | 6,428 (10.3%) | 13,289 (14.0%) |
Technology Access in Area Code 240
Computing Device Access in Area Code 240
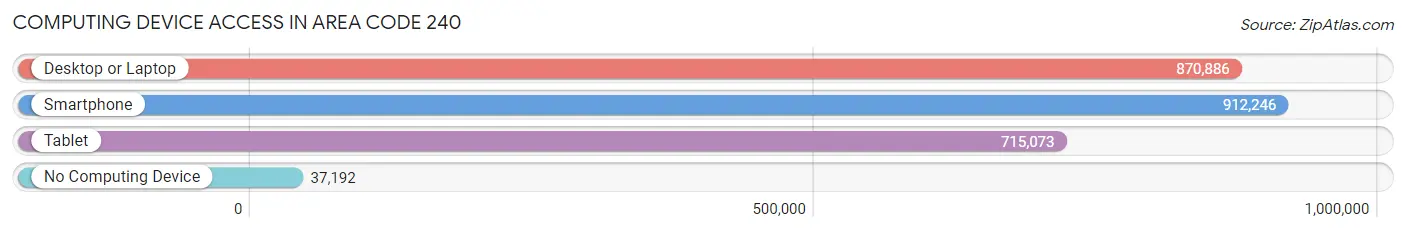
| Device Type | # Households | % Households |
| Desktop or Laptop | 870,886 | 86.8% |
| Smartphone | 912,246 | 90.9% |
| Tablet | 715,073 | 71.3% |
| No Computing Device | 37,192 | 3.7% |
| Total | 1,003,532 | 100.0% |
Internet Access in Area Code 240
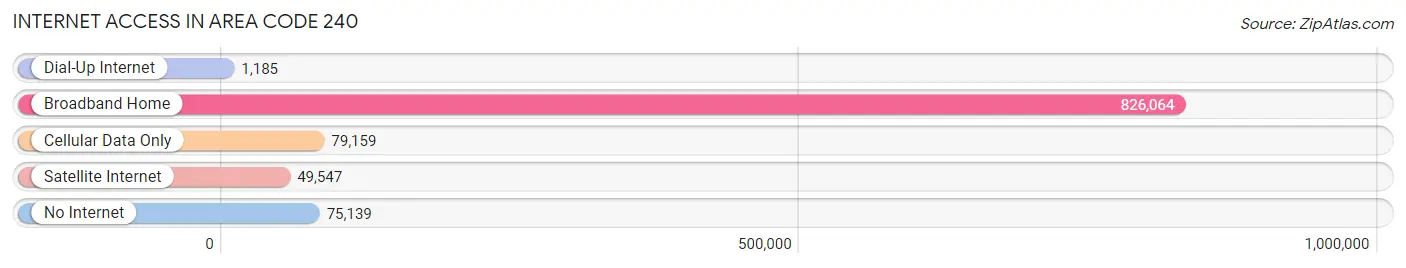
| Internet Type | # Households | % Households |
| Dial-Up Internet | 1,185 | 0.1% |
| Broadband Home | 826,064 | 82.3% |
| Cellular Data Only | 79,159 | 7.9% |
| Satellite Internet | 49,547 | 4.9% |
| No Internet | 75,139 | 7.5% |
| Total | 1,003,532 | 100.0% |
Area Code 240 Summary
Geography
Area code 240 is a telephone area code in the North American Numbering Plan (NANP) for the western and northern portions of Maryland. It serves the cities of Frederick, Gaithersburg, Rockville, and Silver Spring, as well as parts of Montgomery and Prince George's counties.
Social
The area code 240 is home to a diverse population of people from all walks of life. The area is known for its vibrant arts and culture scene, with a variety of museums, galleries, and performing arts venues. The area is also home to a number of universities and colleges, making it a great place for students and young professionals.
Economics
The area code 240 is home to a thriving economy, with a number of major employers in the area. The area is home to a number of technology companies, as well as government agencies and healthcare organizations. The area is also home to a number of small businesses, making it a great place for entrepreneurs and small business owners.
Demographics
The area code 240 is home to a diverse population, with a variety of ethnic and racial backgrounds. The area is home to a large number of immigrants, with a significant population of African Americans, Hispanics, and Asians. The area is also home to a large number of young professionals, making it a great place for young people to live and work.
Common Questions
What is Per Capita Income in Area Code 240?
Per Capita income in Area Code 240 is $50,925.
What is the Median Family Income in Area Code 240?
Median Family Income in Area Code 240 is $134,275.
What is the Median Household income in Area Code 240?
Median Household Income in Area Code 240 is $116,360.
What is Income or Wage Gap in Area Code 240?
Income or Wage Gap in Area Code 240 is 26.1%.
Women in Area Code 240 earn 73.9 cents for every dollar earned by a man.
What is Family Income Deficit in Area Code 240?
Family Income Deficit in Area Code 240 is $11,442.
Families that are below poverty line in Area Code 240 earn $11,442 less on average than the poverty threshold level.
What is Inequality or Gini Index in Area Code 240?
Inequality or Gini Index in Area Code 240 is 62.24.
What is the Total Population of Area Code 240?
Total Population of Area Code 240 is 2,725,859.
What is the Total Male Population of Area Code 240?
Total Male Population of Area Code 240 is 1,330,963.
What is the Total Female Population of Area Code 240?
Total Female Population of Area Code 240 is 1,394,896.
What is the Ratio of Males per 100 Females in Area Code 240?
There are 95.42 Males per 100 Females in Area Code 240.
What is the Ratio of Females per 100 Males in Area Code 240?
There are 104.80 Females per 100 Males in Area Code 240.
What is the Median Population Age in Area Code 240?
Median Population Age in Area Code 240 is 41.8 Years.
What is the Average Family Size in Area Code 240
Average Family Size in Area Code 240 is 3.2 People.
What is the Average Household Size in Area Code 240
Average Household Size in Area Code 240 is 2.7 People.
How Large is the Labor Force in Area Code 240?
There are 1,425,680 People in the Labor Forcein in Area Code 240.
What is the Percentage of People in the Labor Force in Area Code 240?
65.3% of People are in the Labor Force in Area Code 240.
What is the Unemployment Rate in Area Code 240?
Unemployment Rate in Area Code 240 is 6.7%.