Frederick County, MD Map & Demographics
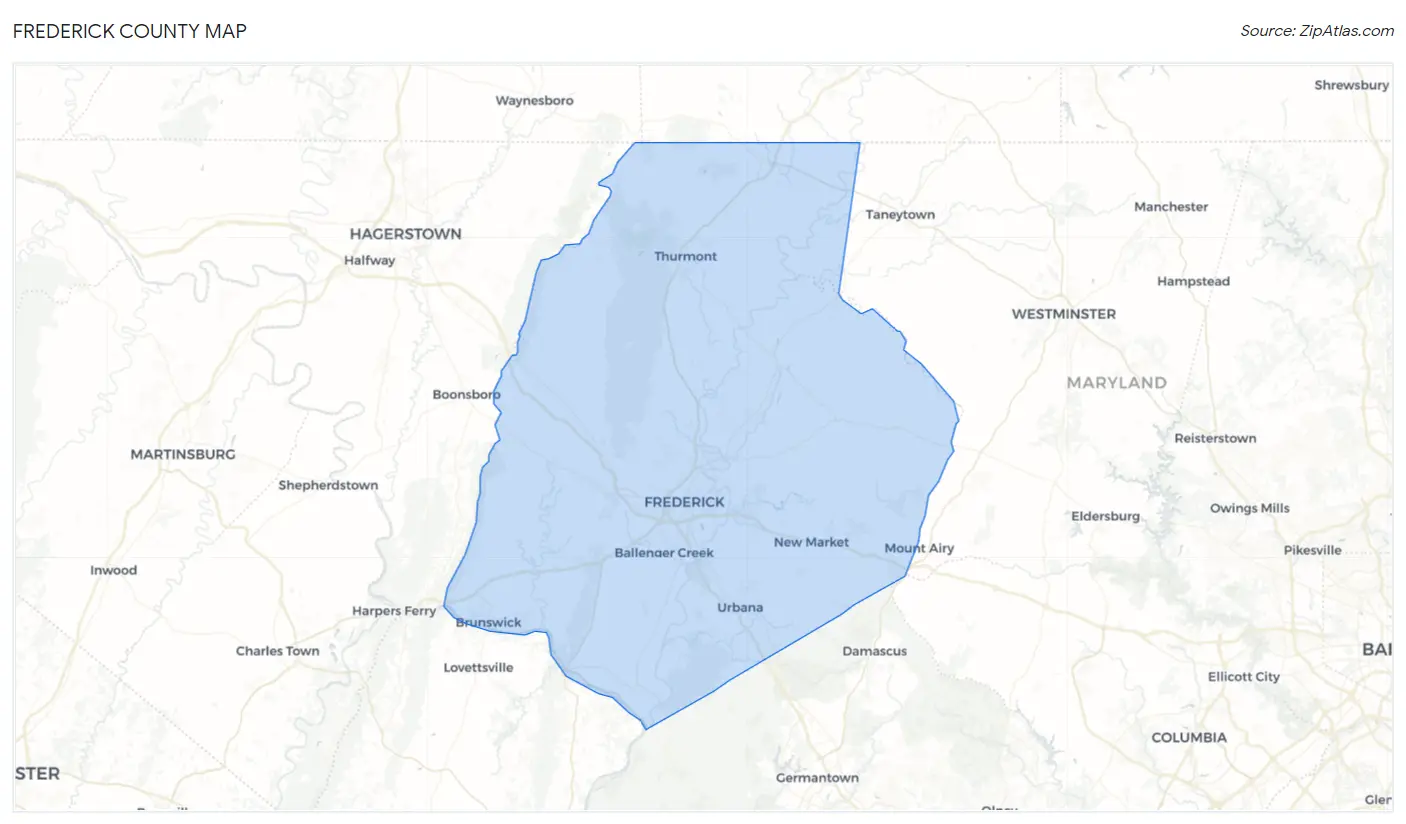
Frederick County Map
Frederick County Overview
$51,169
PER CAPITA INCOME
$135,543
AVG FAMILY INCOME
$115,724
AVG HOUSEHOLD INCOME
33.7%
WAGE / INCOME GAP [ % ]
66.3¢/ $1
WAGE / INCOME GAP [ $ ]
$12,760
FAMILY INCOME DEFICIT
0.40
INEQUALITY / GINI INDEX
273,829
TOTAL POPULATION
135,810
MALE POPULATION
138,019
FEMALE POPULATION
98.40
MALES / 100 FEMALES
101.63
FEMALES / 100 MALES
38.9
MEDIAN AGE
3.2
AVG FAMILY SIZE
2.7
AVG HOUSEHOLD SIZE
151,243
LABOR FORCE [ PEOPLE ]
69.5%
PERCENT IN LABOR FORCE
3.7%
UNEMPLOYMENT RATE
Income in Frederick County
Income Overview in Frederick County
Per Capita Income in Frederick County is $51,169, while median incomes of families and households are $135,543 and $115,724 respectively.
| Characteristic | Number | Measure |
| Per Capita Income | 273,829 | $51,169 |
| Median Family Income | 71,714 | $135,543 |
| Mean Family Income | 71,714 | $156,043 |
| Median Household Income | 99,891 | $115,724 |
| Mean Household Income | 99,891 | $138,462 |
| Income Deficit | 71,714 | $12,760 |
| Wage / Income Gap (%) | 273,829 | 33.69% |
| Wage / Income Gap ($) | 273,829 | 66.31¢ per $1 |
| Gini / Inequality Index | 273,829 | 0.40 |
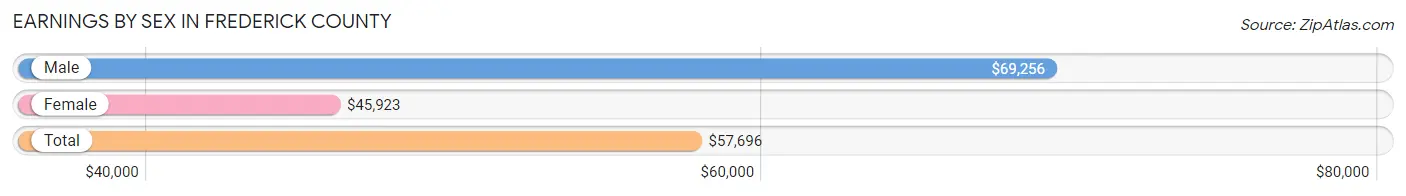
Earnings by Sex in Frederick County
Average Earnings in Frederick County are $57,696, $69,256 for men and $45,923 for women, a difference of 33.7%.
| Sex | Number | Average Earnings |
| Male | 83,908 (53.2%) | $69,256 |
| Female | 73,723 (46.8%) | $45,923 |
| Total | 157,631 (100.0%) | $57,696 |
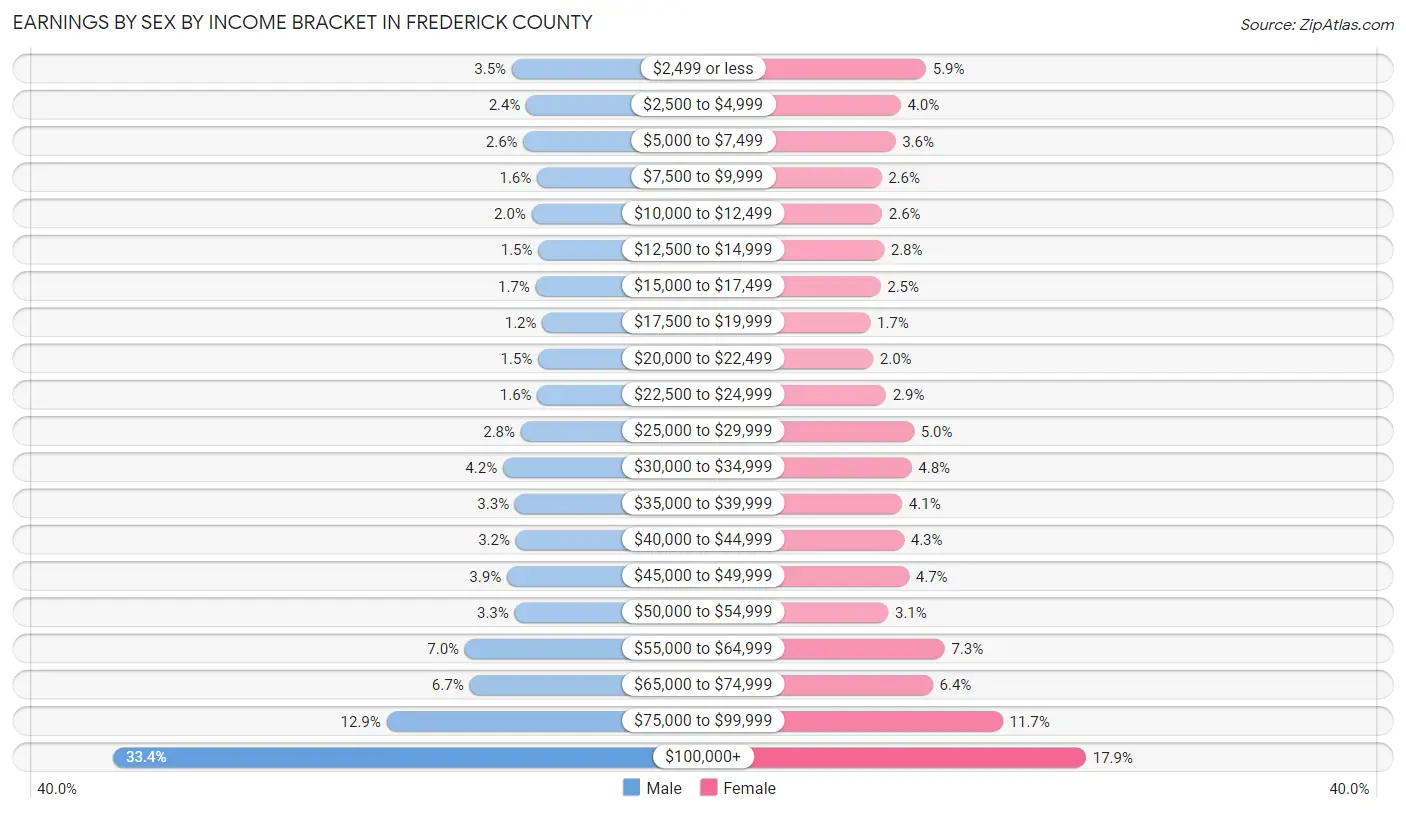
Earnings by Sex by Income Bracket in Frederick County
The most common earnings brackets in Frederick County are $100,000+ for men (28,001 | 33.4%) and $100,000+ for women (13,206 | 17.9%).
| Income | Male | Female |
| $2,499 or less | 2,922 (3.5%) | 4,362 (5.9%) |
| $2,500 to $4,999 | 2,016 (2.4%) | 2,962 (4.0%) |
| $5,000 to $7,499 | 2,202 (2.6%) | 2,677 (3.6%) |
| $7,500 to $9,999 | 1,332 (1.6%) | 1,904 (2.6%) |
| $10,000 to $12,499 | 1,676 (2.0%) | 1,941 (2.6%) |
| $12,500 to $14,999 | 1,255 (1.5%) | 2,039 (2.8%) |
| $15,000 to $17,499 | 1,425 (1.7%) | 1,850 (2.5%) |
| $17,500 to $19,999 | 1,009 (1.2%) | 1,282 (1.7%) |
| $20,000 to $22,499 | 1,263 (1.5%) | 1,441 (1.9%) |
| $22,500 to $24,999 | 1,316 (1.6%) | 2,150 (2.9%) |
| $25,000 to $29,999 | 2,359 (2.8%) | 3,703 (5.0%) |
| $30,000 to $34,999 | 3,484 (4.2%) | 3,567 (4.8%) |
| $35,000 to $39,999 | 2,726 (3.3%) | 3,046 (4.1%) |
| $40,000 to $44,999 | 2,679 (3.2%) | 3,150 (4.3%) |
| $45,000 to $49,999 | 3,233 (3.8%) | 3,429 (4.6%) |
| $50,000 to $54,999 | 2,748 (3.3%) | 2,275 (3.1%) |
| $55,000 to $64,999 | 5,874 (7.0%) | 5,398 (7.3%) |
| $65,000 to $74,999 | 5,587 (6.7%) | 4,738 (6.4%) |
| $75,000 to $99,999 | 10,801 (12.9%) | 8,603 (11.7%) |
| $100,000+ | 28,001 (33.4%) | 13,206 (17.9%) |
| Total | 83,908 (100.0%) | 73,723 (100.0%) |
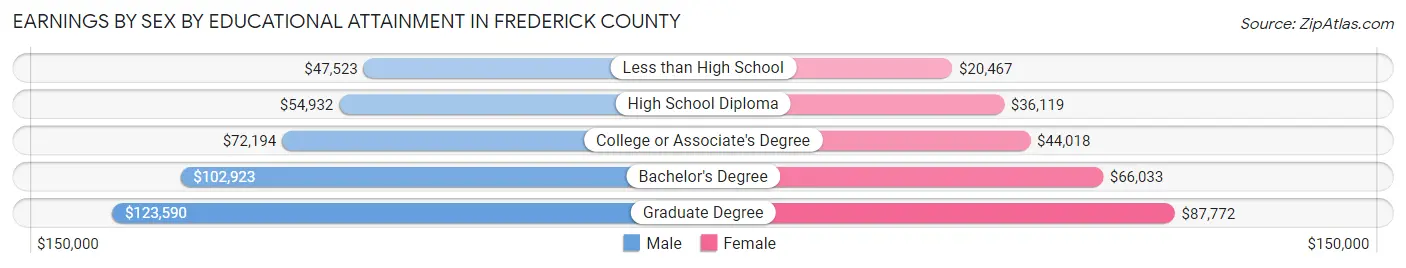
Earnings by Sex by Educational Attainment in Frederick County
Average earnings in Frederick County are $80,138 for men and $55,079 for women, a difference of 31.3%. Men with an educational attainment of graduate degree enjoy the highest average annual earnings of $123,590, while those with less than high school education earn the least with $47,523. Women with an educational attainment of graduate degree earn the most with the average annual earnings of $87,772, while those with less than high school education have the smallest earnings of $20,467.
| Educational Attainment | Male Income | Female Income |
| Less than High School | $47,523 | $20,467 |
| High School Diploma | $54,932 | $36,119 |
| College or Associate's Degree | $72,194 | $44,018 |
| Bachelor's Degree | $102,923 | $66,033 |
| Graduate Degree | $123,590 | $87,772 |
| Total | $80,138 | $55,079 |
Family Income in Frederick County
Family Income Brackets in Frederick County
According to the Frederick County family income data, there are 18,789 families falling into the $200,000+ income range, which is the most common income bracket and makes up 26.2% of all families. Conversely, the $10,000 to $14,999 income bracket is the least frequent group with only 861 families (1.2%) belonging to this category.
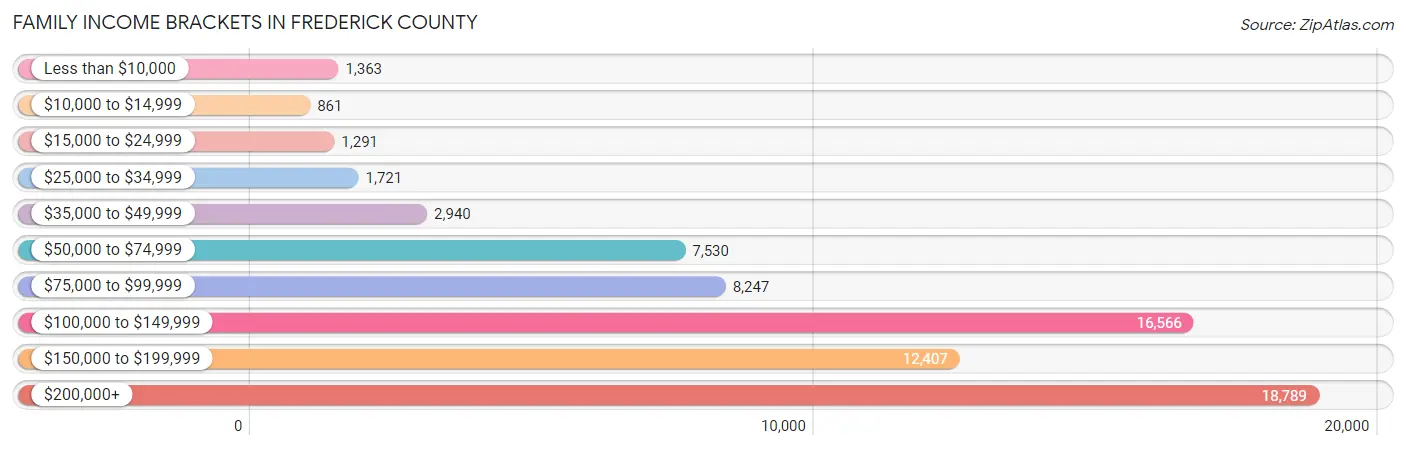
| Income Bracket | # Families | % Families |
| Less than $10,000 | 1,363 | 1.9% |
| $10,000 to $14,999 | 861 | 1.2% |
| $15,000 to $24,999 | 1,291 | 1.8% |
| $25,000 to $34,999 | 1,721 | 2.4% |
| $35,000 to $49,999 | 2,940 | 4.1% |
| $50,000 to $74,999 | 7,530 | 10.5% |
| $75,000 to $99,999 | 8,247 | 11.5% |
| $100,000 to $149,999 | 16,566 | 23.1% |
| $150,000 to $199,999 | 12,407 | 17.3% |
| $200,000+ | 18,789 | 26.2% |
Family Income by Famaliy Size in Frederick County
7+ person families (809 | 1.1%) account for the highest median family income in Frederick County with $167,440 per family, while 2-person families (29,492 | 41.1%) have the highest median income of $56,764 per family member.
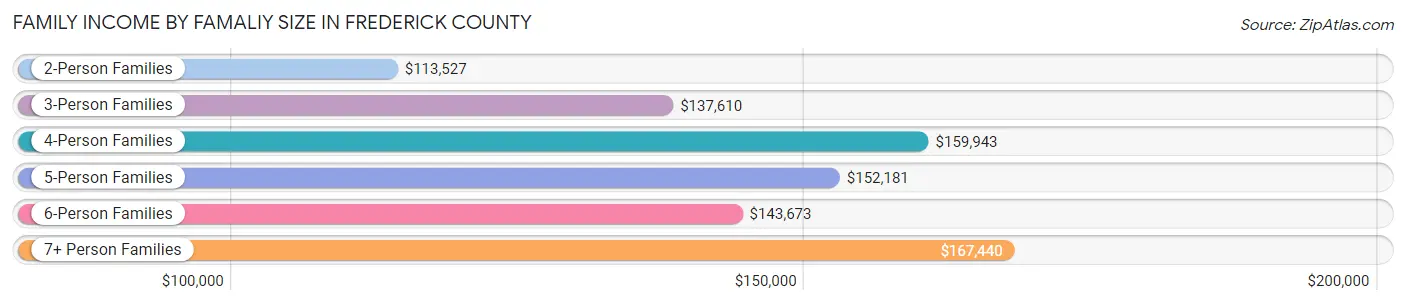
| Income Bracket | # Families | Median Income |
| 2-Person Families | 29,492 (41.1%) | $113,527 |
| 3-Person Families | 16,138 (22.5%) | $137,610 |
| 4-Person Families | 16,020 (22.3%) | $159,943 |
| 5-Person Families | 6,923 (9.7%) | $152,181 |
| 6-Person Families | 2,332 (3.3%) | $143,673 |
| 7+ Person Families | 809 (1.1%) | $167,440 |
| Total | 71,714 (100.0%) | $135,543 |
Family Income by Number of Earners in Frederick County
The median family income in Frederick County is $135,543, with families comprising 3+ earners (11,241) having the highest median family income of $194,434, while families with no earners (7,653) have the lowest median family income of $63,595, accounting for 15.7% and 10.7% of families, respectively.
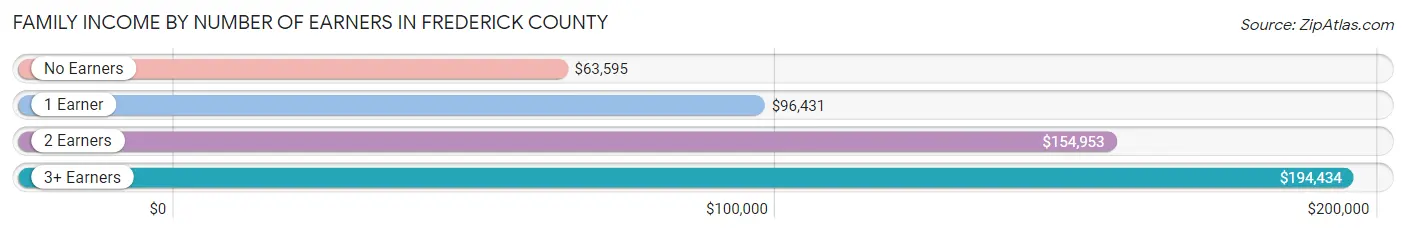
| Number of Earners | # Families | Median Income |
| No Earners | 7,653 (10.7%) | $63,595 |
| 1 Earner | 19,691 (27.5%) | $96,431 |
| 2 Earners | 33,129 (46.2%) | $154,953 |
| 3+ Earners | 11,241 (15.7%) | $194,434 |
| Total | 71,714 (100.0%) | $135,543 |
Household Income in Frederick County
Household Income Brackets in Frederick County
With 21,876 households falling in the category, the $100,000 to $149,999 income range is the most frequent in Frederick County, accounting for 21.9% of all households. In contrast, only 1,998 households (2.0%) fall into the $10,000 to $14,999 income bracket, making it the least populous group.
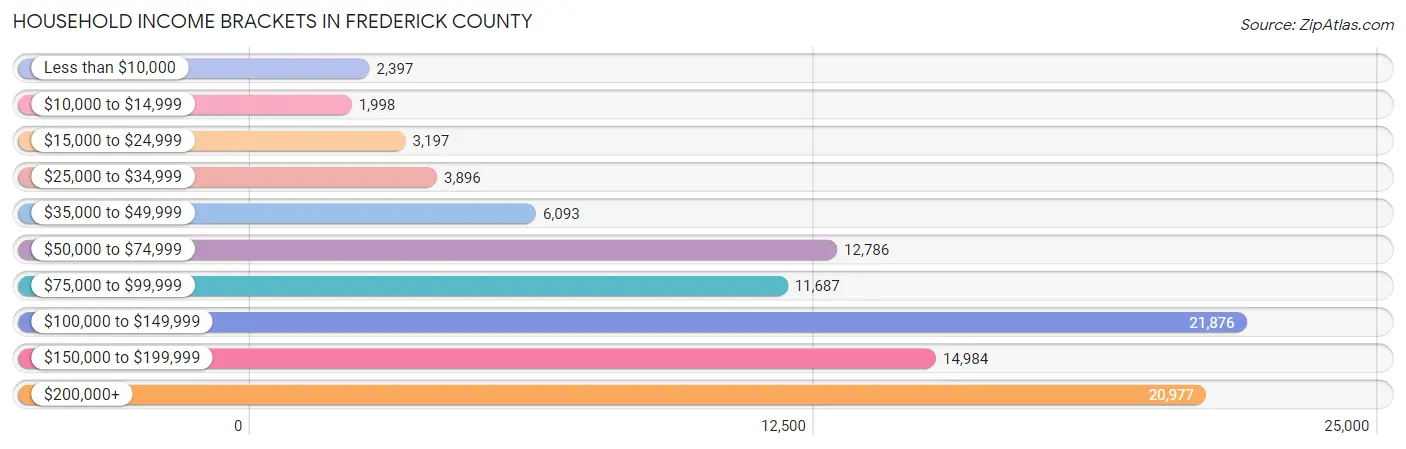
| Income Bracket | # Households | % Households |
| Less than $10,000 | 2,397 | 2.4% |
| $10,000 to $14,999 | 1,998 | 2.0% |
| $15,000 to $24,999 | 3,197 | 3.2% |
| $25,000 to $34,999 | 3,896 | 3.9% |
| $35,000 to $49,999 | 6,093 | 6.1% |
| $50,000 to $74,999 | 12,786 | 12.8% |
| $75,000 to $99,999 | 11,687 | 11.7% |
| $100,000 to $149,999 | 21,876 | 21.9% |
| $150,000 to $199,999 | 14,984 | 15.0% |
| $200,000+ | 20,977 | 21.0% |
Household Income by Householder Age in Frederick County
The median household income in Frederick County is $115,724, with the highest median household income of $144,944 found in the 45 to 64 years age bracket for the primary householder. A total of 40,979 households (41.0%) fall into this category. Meanwhile, the 15 to 24 years age bracket for the primary householder has the lowest median household income of $60,145, with 1,968 households (2.0%) in this group.
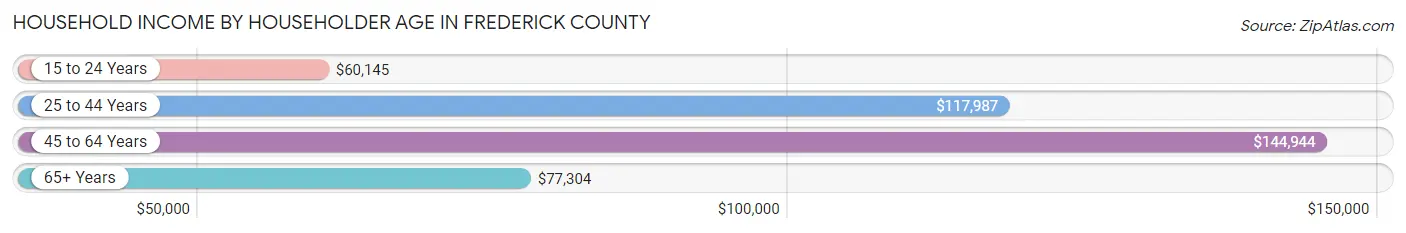
| Income Bracket | # Households | Median Income |
| 15 to 24 Years | 1,968 (2.0%) | $60,145 |
| 25 to 44 Years | 32,902 (32.9%) | $117,987 |
| 45 to 64 Years | 40,979 (41.0%) | $144,944 |
| 65+ Years | 24,042 (24.1%) | $77,304 |
| Total | 99,891 (100.0%) | $115,724 |
Poverty in Frederick County
Income Below Poverty by Sex and Age in Frederick County
With 5.0% poverty level for males and 7.3% for females among the residents of Frederick County, 6 to 11 year old males and 75 year old and over females are the most vulnerable to poverty, with 858 males (8.0%) and 962 females (10.3%) in their respective age groups living below the poverty level.
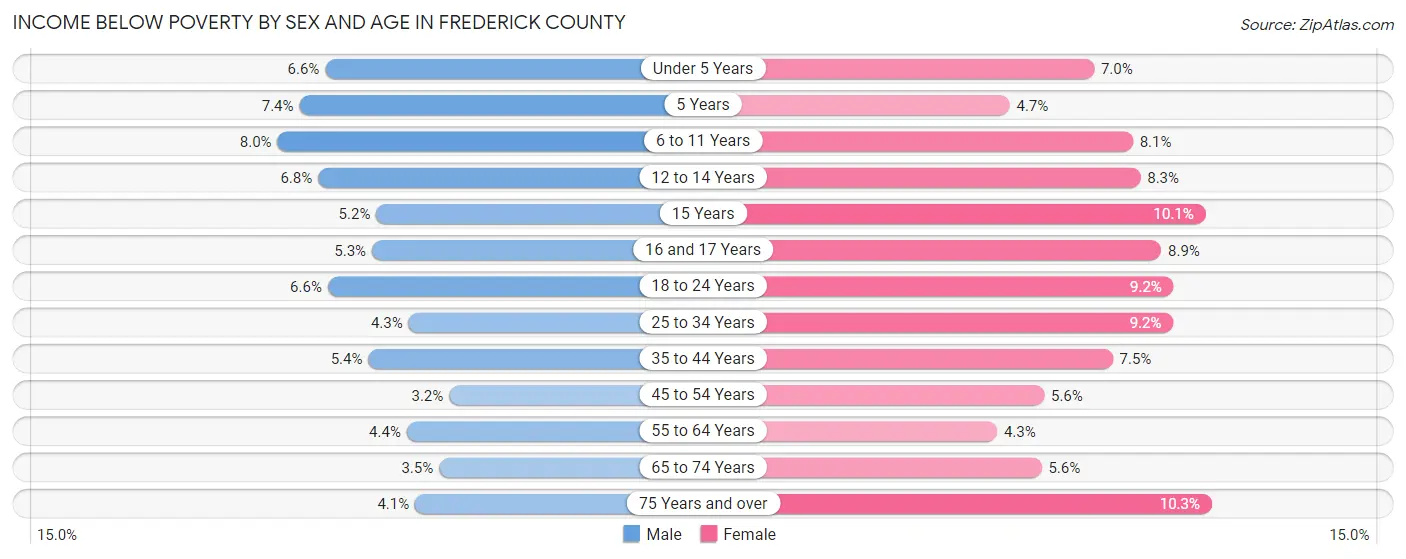
| Age Bracket | Male | Female |
| Under 5 Years | 521 (6.6%) | 550 (7.0%) |
| 5 Years | 121 (7.3%) | 89 (4.7%) |
| 6 to 11 Years | 858 (8.0%) | 836 (8.1%) |
| 12 to 14 Years | 398 (6.8%) | 426 (8.3%) |
| 15 Years | 109 (5.2%) | 224 (10.1%) |
| 16 and 17 Years | 192 (5.3%) | 297 (8.9%) |
| 18 to 24 Years | 741 (6.6%) | 967 (9.2%) |
| 25 to 34 Years | 733 (4.3%) | 1,545 (9.2%) |
| 35 to 44 Years | 1,033 (5.4%) | 1,416 (7.5%) |
| 45 to 54 Years | 596 (3.2%) | 1,042 (5.6%) |
| 55 to 64 Years | 791 (4.4%) | 796 (4.3%) |
| 65 to 74 Years | 399 (3.5%) | 695 (5.6%) |
| 75 Years and over | 262 (4.1%) | 962 (10.3%) |
| Total | 6,754 (5.0%) | 9,845 (7.3%) |
Income Above Poverty by Sex and Age in Frederick County
According to the poverty statistics in Frederick County, males aged 45 to 54 years and females aged 55 to 64 years are the age groups that are most secure financially, with 96.8% of males and 95.7% of females in these age groups living above the poverty line.
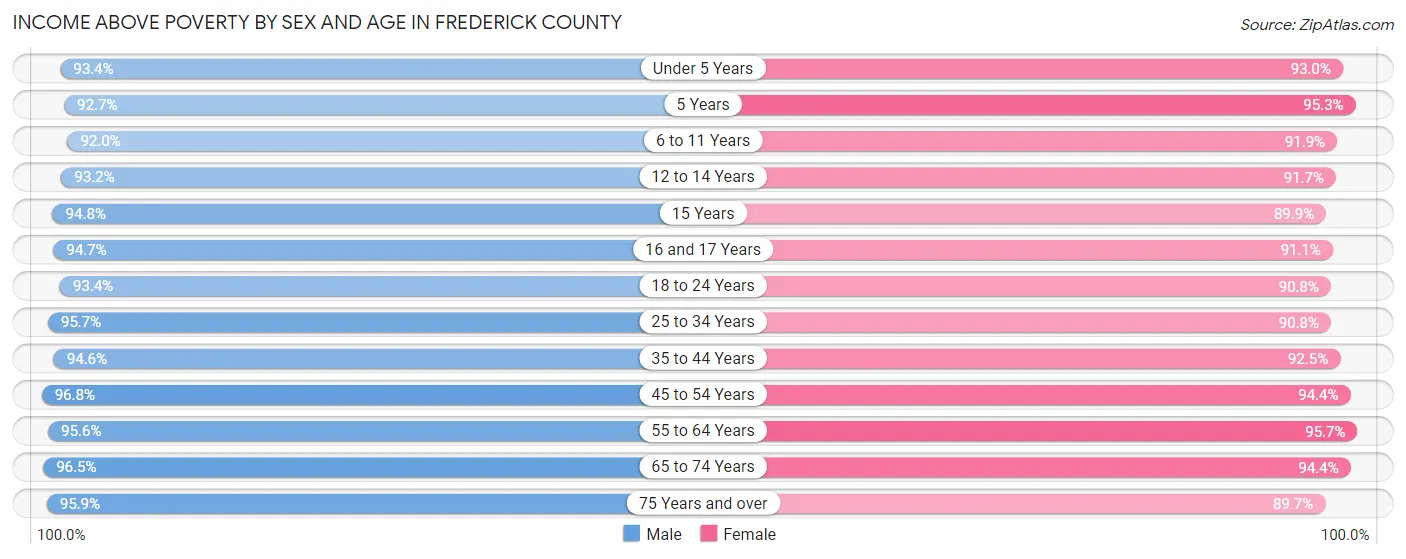
| Age Bracket | Male | Female |
| Under 5 Years | 7,332 (93.4%) | 7,285 (93.0%) |
| 5 Years | 1,525 (92.6%) | 1,817 (95.3%) |
| 6 to 11 Years | 9,926 (92.0%) | 9,491 (91.9%) |
| 12 to 14 Years | 5,430 (93.2%) | 4,700 (91.7%) |
| 15 Years | 1,982 (94.8%) | 1,987 (89.9%) |
| 16 and 17 Years | 3,411 (94.7%) | 3,044 (91.1%) |
| 18 to 24 Years | 10,550 (93.4%) | 9,495 (90.8%) |
| 25 to 34 Years | 16,281 (95.7%) | 15,199 (90.8%) |
| 35 to 44 Years | 17,974 (94.6%) | 17,362 (92.5%) |
| 45 to 54 Years | 18,154 (96.8%) | 17,457 (94.4%) |
| 55 to 64 Years | 17,366 (95.6%) | 17,614 (95.7%) |
| 65 to 74 Years | 11,120 (96.5%) | 11,794 (94.4%) |
| 75 Years and over | 6,086 (95.9%) | 8,375 (89.7%) |
| Total | 127,137 (95.0%) | 125,620 (92.7%) |
Income Below Poverty Among Married-Couple Families in Frederick County
The poverty statistics for married-couple families in Frederick County show that 1.7% or 933 of the total 56,610 families live below the poverty line. Families with 5 or more children have the highest poverty rate of 6.2%, comprising of 13 families. On the other hand, families with no children have the lowest poverty rate of 1.3%, which includes 410 families.
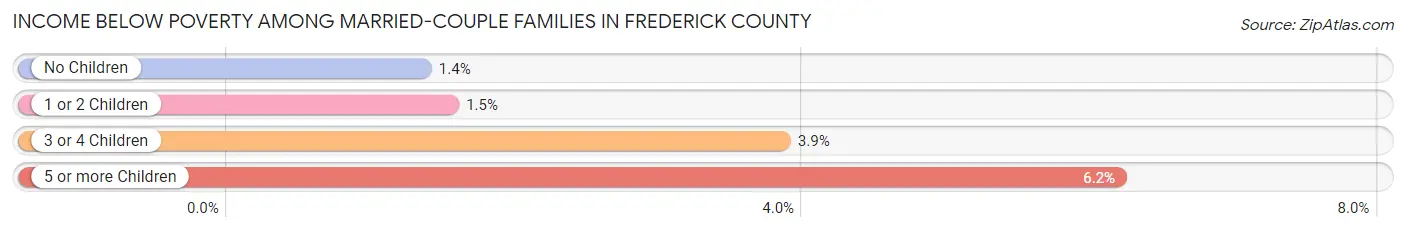
| Children | Above Poverty | Below Poverty |
| No Children | 30,017 (98.7%) | 410 (1.3%) |
| 1 or 2 Children | 20,846 (98.5%) | 325 (1.5%) |
| 3 or 4 Children | 4,617 (96.2%) | 185 (3.8%) |
| 5 or more Children | 197 (93.8%) | 13 (6.2%) |
| Total | 55,677 (98.4%) | 933 (1.7%) |
Income Below Poverty Among Single-Parent Households in Frederick County
According to the poverty data in Frederick County, 6.2% or 287 single-father households and 19.4% or 2,044 single-mother households are living below the poverty line. Among single-father households, those with 3 or 4 children have the highest poverty rate, with 100 households (21.8%) experiencing poverty. Likewise, among single-mother households, those with 5 or more children have the highest poverty rate, with 38 households (38.0%) falling below the poverty line.
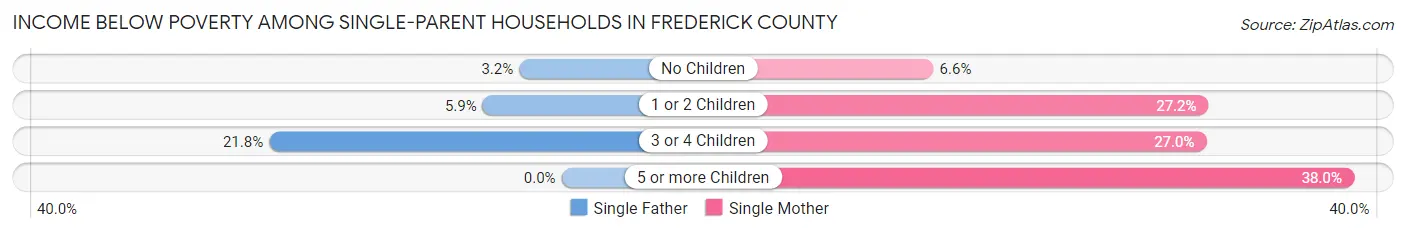
| Children | Single Father | Single Mother |
| No Children | 63 (3.2%) | 265 (6.6%) |
| 1 or 2 Children | 124 (5.9%) | 1,452 (27.2%) |
| 3 or 4 Children | 100 (21.8%) | 289 (27.0%) |
| 5 or more Children | 0 (0.0%) | 38 (38.0%) |
| Total | 287 (6.2%) | 2,044 (19.4%) |
Income Below Poverty Among Married-Couple vs Single-Parent Households in Frederick County
The poverty data for Frederick County shows that 933 of the married-couple family households (1.7%) and 2,331 of the single-parent households (15.4%) are living below the poverty level. Within the married-couple family households, those with 5 or more children have the highest poverty rate, with 13 households (6.2%) falling below the poverty line. Among the single-parent households, those with 5 or more children have the highest poverty rate, with 38 household (29.9%) living below poverty.
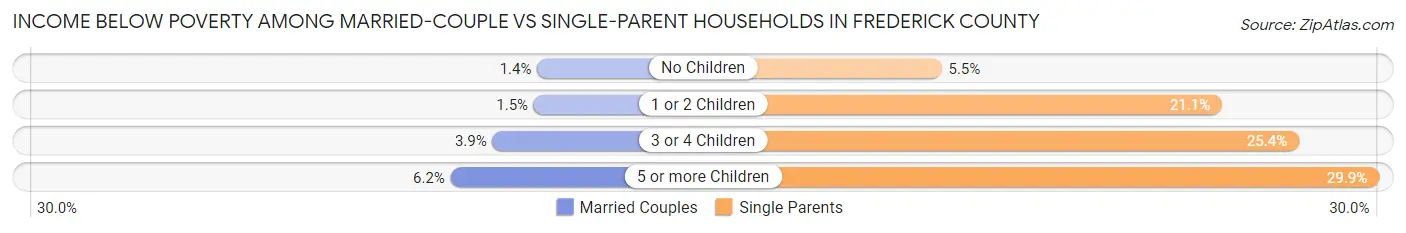
| Children | Married-Couple Families | Single-Parent Households |
| No Children | 410 (1.3%) | 328 (5.5%) |
| 1 or 2 Children | 325 (1.5%) | 1,576 (21.1%) |
| 3 or 4 Children | 185 (3.8%) | 389 (25.4%) |
| 5 or more Children | 13 (6.2%) | 38 (29.9%) |
| Total | 933 (1.7%) | 2,331 (15.4%) |
Race in Frederick County
The most populous races in Frederick County are White / Caucasian (202,183 | 73.8%), Hispanic or Latino (30,072 | 11.0%), and Black / African American (27,723 | 10.1%).
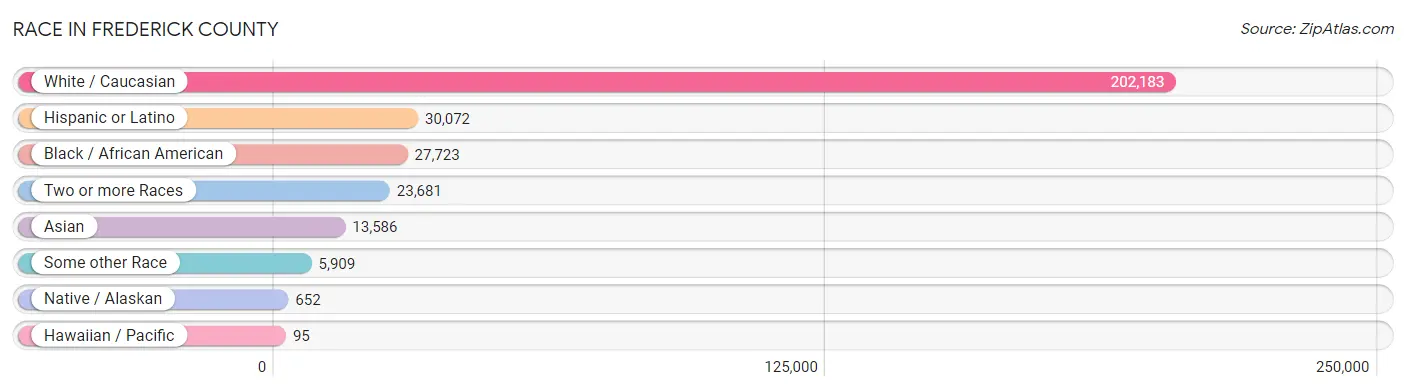
| Race | # Population | % Population |
| Asian | 13,586 | 5.0% |
| Black / African American | 27,723 | 10.1% |
| Hawaiian / Pacific | 95 | 0.0% |
| Hispanic or Latino | 30,072 | 11.0% |
| Native / Alaskan | 652 | 0.2% |
| White / Caucasian | 202,183 | 73.8% |
| Two or more Races | 23,681 | 8.6% |
| Some other Race | 5,909 | 2.2% |
| Total | 273,829 | 100.0% |
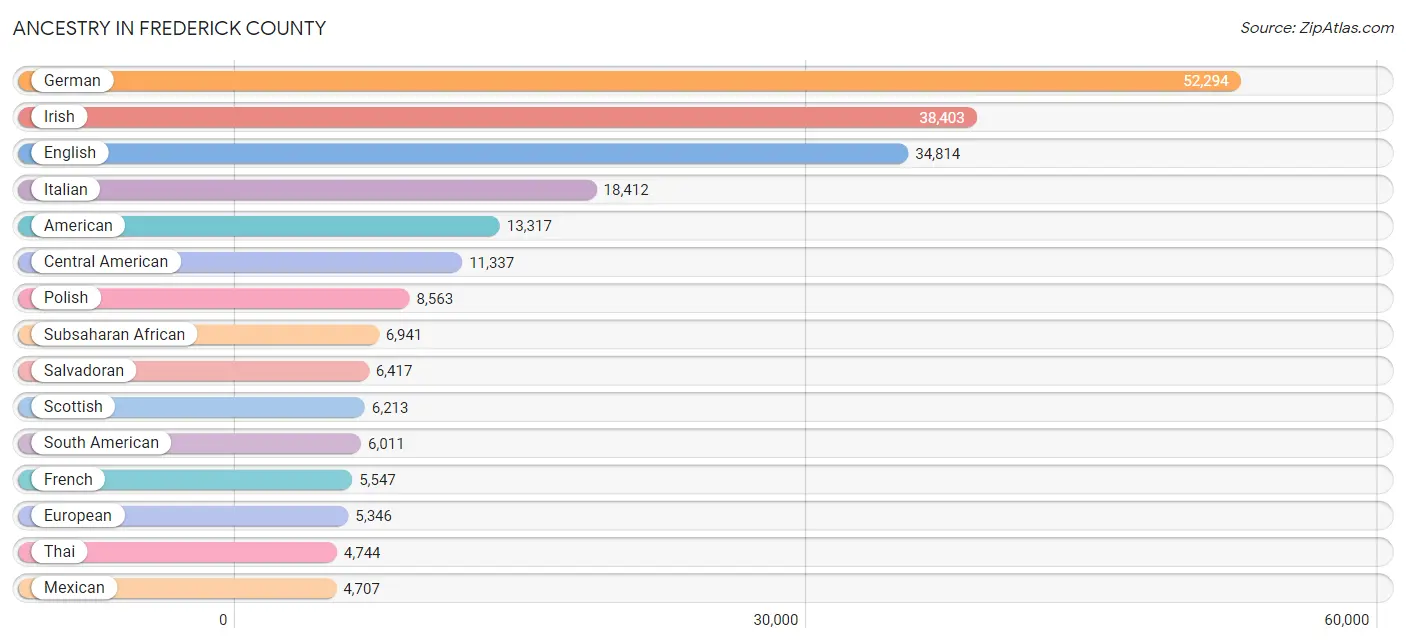
Ancestry in Frederick County
The most populous ancestries reported in Frederick County are German (52,294 | 19.1%), Irish (38,403 | 14.0%), English (34,814 | 12.7%), Italian (18,412 | 6.7%), and American (13,317 | 4.9%), together accounting for 57.4% of all Frederick County residents.
| Ancestry | # Population | % Population |
| Afghan | 42 | 0.0% |
| African | 2,276 | 0.8% |
| Albanian | 77 | 0.0% |
| American | 13,317 | 4.9% |
| Apache | 133 | 0.1% |
| Arab | 1,285 | 0.5% |
| Argentinean | 224 | 0.1% |
| Armenian | 122 | 0.0% |
| Australian | 135 | 0.1% |
| Austrian | 466 | 0.2% |
| Barbadian | 76 | 0.0% |
| Basque | 59 | 0.0% |
| Belgian | 133 | 0.1% |
| Belizean | 23 | 0.0% |
| Bhutanese | 832 | 0.3% |
| Blackfeet | 50 | 0.0% |
| Bolivian | 640 | 0.2% |
| Brazilian | 216 | 0.1% |
| British | 2,276 | 0.8% |
| British West Indian | 52 | 0.0% |
| Bulgarian | 132 | 0.1% |
| Burmese | 2,711 | 1.0% |
| Cajun | 53 | 0.0% |
| Canadian | 452 | 0.2% |
| Carpatho Rusyn | 40 | 0.0% |
| Celtic | 40 | 0.0% |
| Central American | 11,337 | 4.1% |
| Central American Indian | 371 | 0.1% |
| Cherokee | 298 | 0.1% |
| Cheyenne | 6 | 0.0% |
| Chilean | 474 | 0.2% |
| Chippewa | 40 | 0.0% |
| Choctaw | 13 | 0.0% |
| Colombian | 1,473 | 0.5% |
| Costa Rican | 627 | 0.2% |
| Croatian | 457 | 0.2% |
| Cuban | 700 | 0.3% |
| Czech | 1,088 | 0.4% |
| Czechoslovakian | 319 | 0.1% |
| Danish | 528 | 0.2% |
| Delaware | 30 | 0.0% |
| Dominican | 912 | 0.3% |
| Dutch | 2,078 | 0.8% |
| Eastern European | 1,138 | 0.4% |
| Ecuadorian | 532 | 0.2% |
| Egyptian | 236 | 0.1% |
| English | 34,814 | 12.7% |
| Estonian | 53 | 0.0% |
| Ethiopian | 498 | 0.2% |
| European | 5,346 | 1.9% |
| Filipino | 210 | 0.1% |
| Finnish | 436 | 0.2% |
| French | 5,547 | 2.0% |
| French American Indian | 9 | 0.0% |
| French Canadian | 838 | 0.3% |
| German | 52,294 | 19.1% |
| Ghanaian | 1,411 | 0.5% |
| Greek | 1,291 | 0.5% |
| Guamanian / Chamorro | 63 | 0.0% |
| Guatemalan | 2,586 | 0.9% |
| Guyanese | 72 | 0.0% |
| Haitian | 223 | 0.1% |
| Honduran | 800 | 0.3% |
| Hungarian | 1,451 | 0.5% |
| Icelander | 11 | 0.0% |
| Indian (Asian) | 3,221 | 1.2% |
| Indonesian | 673 | 0.3% |
| Inupiat | 5 | 0.0% |
| Iranian | 605 | 0.2% |
| Iraqi | 38 | 0.0% |
| Irish | 38,403 | 14.0% |
| Iroquois | 61 | 0.0% |
| Israeli | 207 | 0.1% |
| Italian | 18,412 | 6.7% |
| Jamaican | 856 | 0.3% |
| Japanese | 471 | 0.2% |
| Jordanian | 64 | 0.0% |
| Kenyan | 187 | 0.1% |
| Korean | 2,620 | 1.0% |
| Laotian | 267 | 0.1% |
| Latvian | 110 | 0.0% |
| Lebanese | 354 | 0.1% |
| Liberian | 162 | 0.1% |
| Lithuanian | 732 | 0.3% |
| Lumbee | 21 | 0.0% |
| Luxembourger | 10 | 0.0% |
| Macedonian | 10 | 0.0% |
| Malaysian | 56 | 0.0% |
| Maltese | 2 | 0.0% |
| Mexican | 4,707 | 1.7% |
| Mexican American Indian | 166 | 0.1% |
| Mongolian | 18 | 0.0% |
| Moroccan | 137 | 0.1% |
| Native Hawaiian | 165 | 0.1% |
| Navajo | 81 | 0.0% |
| New Zealander | 40 | 0.0% |
| Nicaraguan | 462 | 0.2% |
| Nigerian | 849 | 0.3% |
| Northern European | 389 | 0.1% |
| Norwegian | 1,817 | 0.7% |
| Pakistani | 423 | 0.2% |
| Palestinian | 157 | 0.1% |
| Panamanian | 411 | 0.2% |
| Paraguayan | 56 | 0.0% |
| Pennsylvania German | 141 | 0.1% |
| Peruvian | 1,489 | 0.5% |
| Polish | 8,563 | 3.1% |
| Portuguese | 798 | 0.3% |
| Potawatomi | 3 | 0.0% |
| Pueblo | 5 | 0.0% |
| Puerto Rican | 3,734 | 1.4% |
| Romanian | 391 | 0.1% |
| Russian | 2,218 | 0.8% |
| Salvadoran | 6,417 | 2.3% |
| Samoan | 3 | 0.0% |
| Scandinavian | 635 | 0.2% |
| Scotch-Irish | 2,564 | 0.9% |
| Scottish | 6,213 | 2.3% |
| Seminole | 55 | 0.0% |
| Senegalese | 70 | 0.0% |
| Serbian | 130 | 0.1% |
| Sioux | 106 | 0.0% |
| Slavic | 305 | 0.1% |
| Slovak | 891 | 0.3% |
| Slovene | 78 | 0.0% |
| Somali | 51 | 0.0% |
| South African | 179 | 0.1% |
| South American | 6,011 | 2.2% |
| South American Indian | 72 | 0.0% |
| Spaniard | 484 | 0.2% |
| Spanish | 590 | 0.2% |
| Spanish American Indian | 52 | 0.0% |
| Sri Lankan | 1,341 | 0.5% |
| Subsaharan African | 6,941 | 2.5% |
| Sudanese | 17 | 0.0% |
| Swedish | 1,909 | 0.7% |
| Swiss | 1,035 | 0.4% |
| Syrian | 56 | 0.0% |
| Thai | 4,744 | 1.7% |
| Trinidadian and Tobagonian | 585 | 0.2% |
| Turkish | 561 | 0.2% |
| U.S. Virgin Islander | 47 | 0.0% |
| Ugandan | 19 | 0.0% |
| Ukrainian | 1,157 | 0.4% |
| Uruguayan | 124 | 0.1% |
| Venezuelan | 897 | 0.3% |
| Vietnamese | 87 | 0.0% |
| Welsh | 2,297 | 0.8% |
| West Indian | 277 | 0.1% |
| Yugoslavian | 124 | 0.1% |
| Yuman | 78 | 0.0% |
| Zimbabwean | 35 | 0.0% | View All 152 Rows |
Immigrants in Frederick County
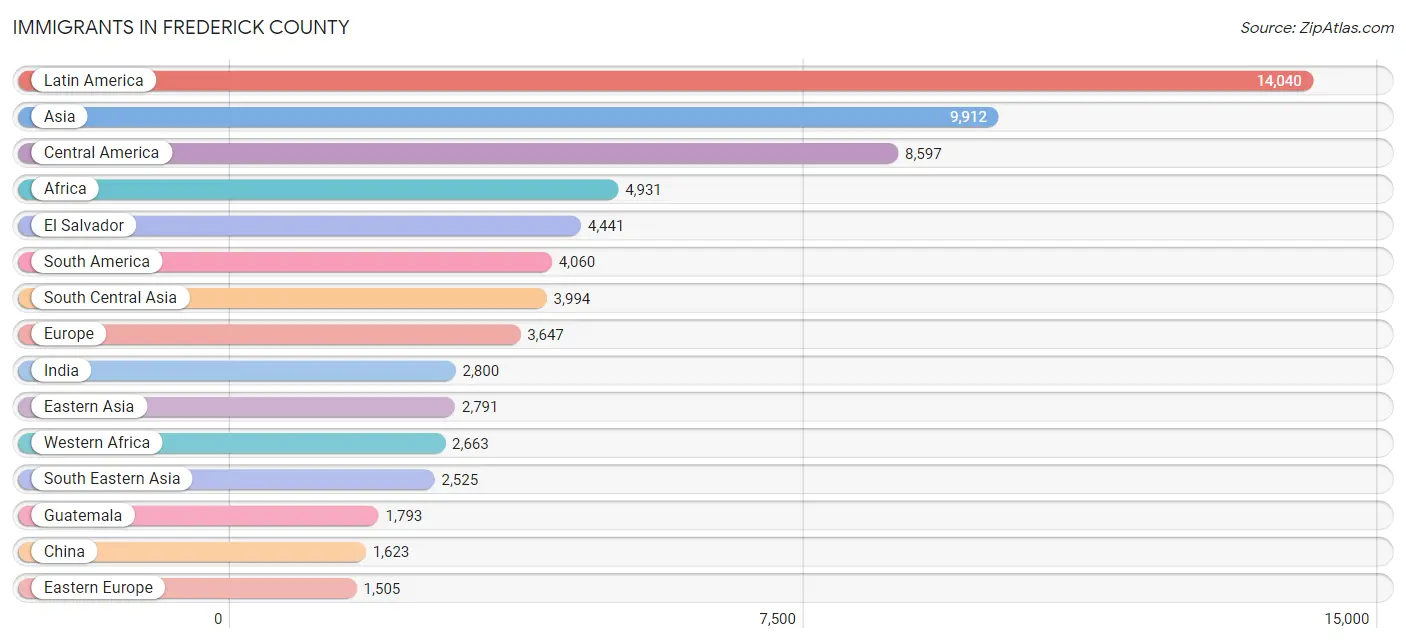
The most numerous immigrant groups reported in Frederick County came from Latin America (14,040 | 5.1%), Asia (9,912 | 3.6%), Central America (8,597 | 3.1%), Africa (4,931 | 1.8%), and El Salvador (4,441 | 1.6%), together accounting for 15.3% of all Frederick County residents.
| Immigration Origin | # Population | % Population |
| Afghanistan | 42 | 0.0% |
| Africa | 4,931 | 1.8% |
| Albania | 58 | 0.0% |
| Argentina | 156 | 0.1% |
| Asia | 9,912 | 3.6% |
| Australia | 175 | 0.1% |
| Austria | 11 | 0.0% |
| Bangladesh | 135 | 0.1% |
| Barbados | 25 | 0.0% |
| Belgium | 62 | 0.0% |
| Bolivia | 388 | 0.1% |
| Bosnia and Herzegovina | 54 | 0.0% |
| Brazil | 235 | 0.1% |
| Bulgaria | 83 | 0.0% |
| Cambodia | 96 | 0.0% |
| Cameroon | 767 | 0.3% |
| Canada | 374 | 0.1% |
| Caribbean | 1,383 | 0.5% |
| Central America | 8,597 | 3.1% |
| Chile | 382 | 0.1% |
| China | 1,623 | 0.6% |
| Colombia | 754 | 0.3% |
| Congo | 35 | 0.0% |
| Costa Rica | 487 | 0.2% |
| Croatia | 20 | 0.0% |
| Cuba | 141 | 0.1% |
| Czechoslovakia | 34 | 0.0% |
| Dominican Republic | 173 | 0.1% |
| Eastern Africa | 698 | 0.3% |
| Eastern Asia | 2,791 | 1.0% |
| Eastern Europe | 1,505 | 0.5% |
| Ecuador | 148 | 0.1% |
| Egypt | 180 | 0.1% |
| El Salvador | 4,441 | 1.6% |
| England | 284 | 0.1% |
| Eritrea | 192 | 0.1% |
| Ethiopia | 117 | 0.0% |
| Europe | 3,647 | 1.3% |
| France | 133 | 0.1% |
| Germany | 696 | 0.3% |
| Ghana | 1,122 | 0.4% |
| Greece | 44 | 0.0% |
| Guatemala | 1,793 | 0.6% |
| Guyana | 99 | 0.0% |
| Haiti | 88 | 0.0% |
| Honduras | 346 | 0.1% |
| Hong Kong | 39 | 0.0% |
| Hungary | 18 | 0.0% |
| India | 2,800 | 1.0% |
| Indonesia | 116 | 0.0% |
| Iran | 238 | 0.1% |
| Iraq | 18 | 0.0% |
| Ireland | 59 | 0.0% |
| Israel | 87 | 0.0% |
| Italy | 203 | 0.1% |
| Jamaica | 493 | 0.2% |
| Japan | 66 | 0.0% |
| Jordan | 49 | 0.0% |
| Kazakhstan | 15 | 0.0% |
| Kenya | 144 | 0.1% |
| Korea | 1,102 | 0.4% |
| Laos | 45 | 0.0% |
| Latin America | 14,040 | 5.1% |
| Lebanon | 13 | 0.0% |
| Liberia | 70 | 0.0% |
| Malaysia | 42 | 0.0% |
| Mexico | 1,294 | 0.5% |
| Micronesia | 6 | 0.0% |
| Middle Africa | 877 | 0.3% |
| Moldova | 17 | 0.0% |
| Morocco | 76 | 0.0% |
| Nepal | 113 | 0.0% |
| Netherlands | 65 | 0.0% |
| Nicaragua | 116 | 0.0% |
| Nigeria | 588 | 0.2% |
| Northern Africa | 273 | 0.1% |
| Northern Europe | 832 | 0.3% |
| Norway | 32 | 0.0% |
| Oceania | 188 | 0.1% |
| Pakistan | 444 | 0.2% |
| Panama | 120 | 0.0% |
| Peru | 1,149 | 0.4% |
| Philippines | 1,134 | 0.4% |
| Poland | 264 | 0.1% |
| Romania | 142 | 0.1% |
| Russia | 283 | 0.1% |
| Scotland | 33 | 0.0% |
| Senegal | 190 | 0.1% |
| Sierra Leone | 50 | 0.0% |
| Singapore | 25 | 0.0% |
| Somalia | 31 | 0.0% |
| South Africa | 318 | 0.1% |
| South America | 4,060 | 1.5% |
| South Central Asia | 3,994 | 1.5% |
| South Eastern Asia | 2,525 | 0.9% |
| Southern Europe | 314 | 0.1% |
| Spain | 67 | 0.0% |
| Sri Lanka | 106 | 0.0% |
| Sudan | 17 | 0.0% |
| Sweden | 23 | 0.0% |
| Switzerland | 17 | 0.0% |
| Syria | 22 | 0.0% |
| Taiwan | 217 | 0.1% |
| Thailand | 158 | 0.1% |
| Trinidad and Tobago | 446 | 0.2% |
| Turkey | 384 | 0.1% |
| Ukraine | 372 | 0.1% |
| Uruguay | 30 | 0.0% |
| Uzbekistan | 97 | 0.0% |
| Venezuela | 526 | 0.2% |
| Vietnam | 606 | 0.2% |
| Western Africa | 2,663 | 1.0% |
| Western Asia | 602 | 0.2% |
| Western Europe | 984 | 0.4% |
| Zaire | 63 | 0.0% |
| Zimbabwe | 35 | 0.0% | View All 116 Rows |
Sex and Age in Frederick County
Sex and Age in Frederick County
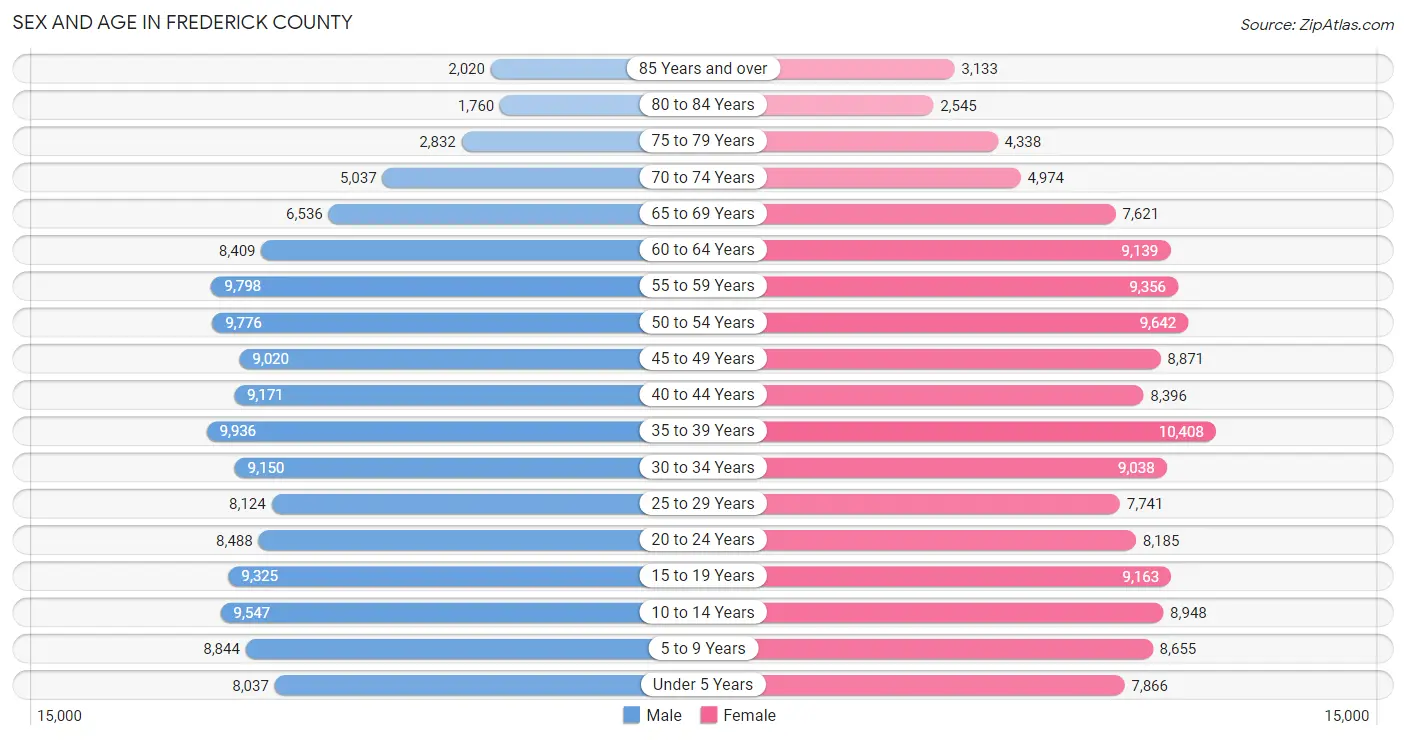
The most populous age groups in Frederick County are 35 to 39 Years (9,936 | 7.3%) for men and 35 to 39 Years (10,408 | 7.5%) for women.
| Age Bracket | Male | Female |
| Under 5 Years | 8,037 (5.9%) | 7,866 (5.7%) |
| 5 to 9 Years | 8,844 (6.5%) | 8,655 (6.3%) |
| 10 to 14 Years | 9,547 (7.0%) | 8,948 (6.5%) |
| 15 to 19 Years | 9,325 (6.9%) | 9,163 (6.6%) |
| 20 to 24 Years | 8,488 (6.2%) | 8,185 (5.9%) |
| 25 to 29 Years | 8,124 (6.0%) | 7,741 (5.6%) |
| 30 to 34 Years | 9,150 (6.7%) | 9,038 (6.6%) |
| 35 to 39 Years | 9,936 (7.3%) | 10,408 (7.5%) |
| 40 to 44 Years | 9,171 (6.8%) | 8,396 (6.1%) |
| 45 to 49 Years | 9,020 (6.6%) | 8,871 (6.4%) |
| 50 to 54 Years | 9,776 (7.2%) | 9,642 (7.0%) |
| 55 to 59 Years | 9,798 (7.2%) | 9,356 (6.8%) |
| 60 to 64 Years | 8,409 (6.2%) | 9,139 (6.6%) |
| 65 to 69 Years | 6,536 (4.8%) | 7,621 (5.5%) |
| 70 to 74 Years | 5,037 (3.7%) | 4,974 (3.6%) |
| 75 to 79 Years | 2,832 (2.1%) | 4,338 (3.1%) |
| 80 to 84 Years | 1,760 (1.3%) | 2,545 (1.8%) |
| 85 Years and over | 2,020 (1.5%) | 3,133 (2.3%) |
| Total | 135,810 (100.0%) | 138,019 (100.0%) |
Families and Households in Frederick County
Median Family Size in Frederick County
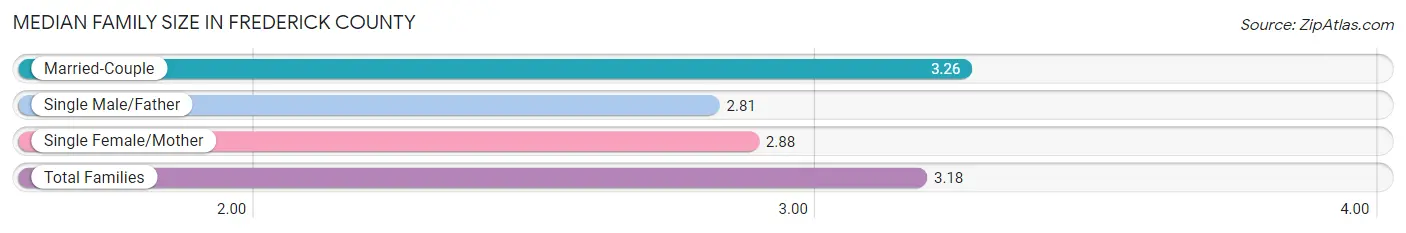
The median family size in Frederick County is 3.18 persons per family, with married-couple families (56,610 | 78.9%) accounting for the largest median family size of 3.26 persons per family. On the other hand, single male/father families (4,591 | 6.4%) represent the smallest median family size with 2.81 persons per family.
| Family Type | # Families | Family Size |
| Married-Couple | 56,610 (78.9%) | 3.26 |
| Single Male/Father | 4,591 (6.4%) | 2.81 |
| Single Female/Mother | 10,513 (14.7%) | 2.88 |
| Total Families | 71,714 (100.0%) | 3.18 |
Median Household Size in Frederick County
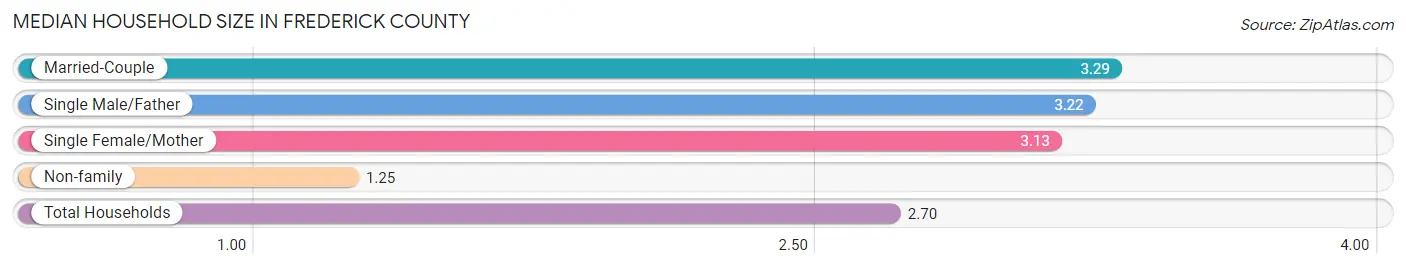
The median household size in Frederick County is 2.70 persons per household, with married-couple households (56,610 | 56.7%) accounting for the largest median household size of 3.29 persons per household. non-family households (28,177 | 28.2%) represent the smallest median household size with 1.25 persons per household.
| Household Type | # Households | Household Size |
| Married-Couple | 56,610 (56.7%) | 3.29 |
| Single Male/Father | 4,591 (4.6%) | 3.22 |
| Single Female/Mother | 10,513 (10.5%) | 3.13 |
| Non-family | 28,177 (28.2%) | 1.25 |
| Total Households | 99,891 (100.0%) | 2.70 |
Household Size by Marriage Status in Frederick County
Out of a total of 99,891 households in Frederick County, 71,714 (71.8%) are family households, while 28,177 (28.2%) are nonfamily households. The most numerous type of family households are 2-person households, comprising 27,382, and the most common type of nonfamily households are 1-person households, comprising 22,275.
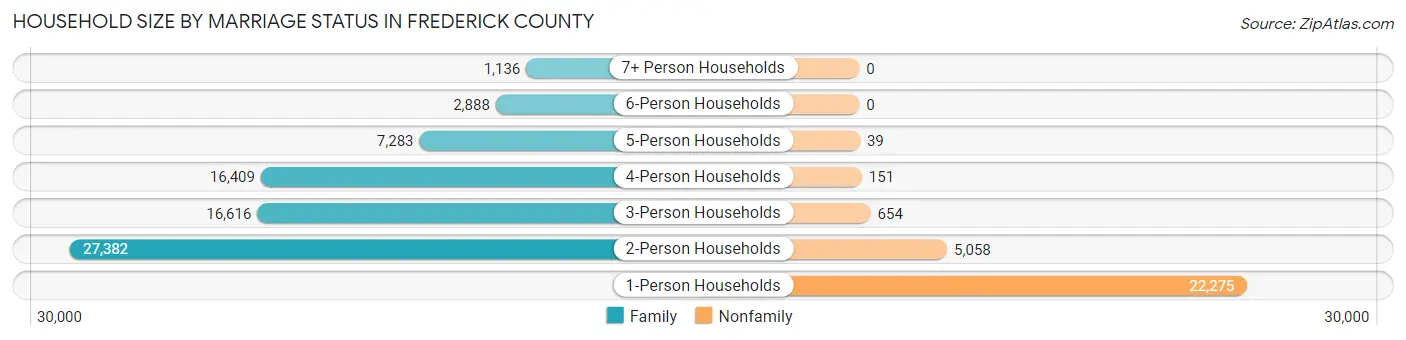
| Household Size | Family Households | Nonfamily Households |
| 1-Person Households | - | 22,275 (22.3%) |
| 2-Person Households | 27,382 (27.4%) | 5,058 (5.1%) |
| 3-Person Households | 16,616 (16.6%) | 654 (0.6%) |
| 4-Person Households | 16,409 (16.4%) | 151 (0.2%) |
| 5-Person Households | 7,283 (7.3%) | 39 (0.0%) |
| 6-Person Households | 2,888 (2.9%) | 0 (0.0%) |
| 7+ Person Households | 1,136 (1.1%) | 0 (0.0%) |
| Total | 71,714 (71.8%) | 28,177 (28.2%) |
Female Fertility in Frederick County
Fertility by Age in Frederick County
Average fertility rate in Frederick County is 54.0 births per 1,000 women. Women in the age bracket of 20 to 34 years have the highest fertility rate with 100.0 births per 1,000 women. Women in the age bracket of 20 to 34 years acount for 71.7% of all women with births.
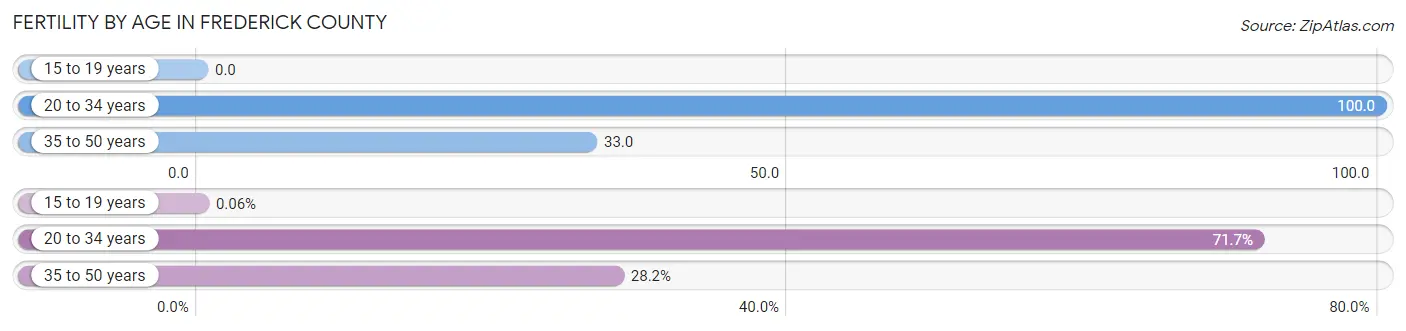
| Age Bracket | Women with Births | Births / 1,000 Women |
| 15 to 19 years | 2 (0.1%) | 0.0 |
| 20 to 34 years | 2,488 (71.7%) | 100.0 |
| 35 to 50 years | 979 (28.2%) | 33.0 |
| Total | 3,469 (100.0%) | 54.0 |
Fertility by Age by Marriage Status in Frederick County
78.3% of women with births (3,469) in Frederick County are married. The highest percentage of unmarried women with births falls into 15 to 19 years age bracket with 100.0% of them unmarried at the time of birth, while the lowest percentage of unmarried women with births belong to 35 to 50 years age bracket with 19.6% of them unmarried.
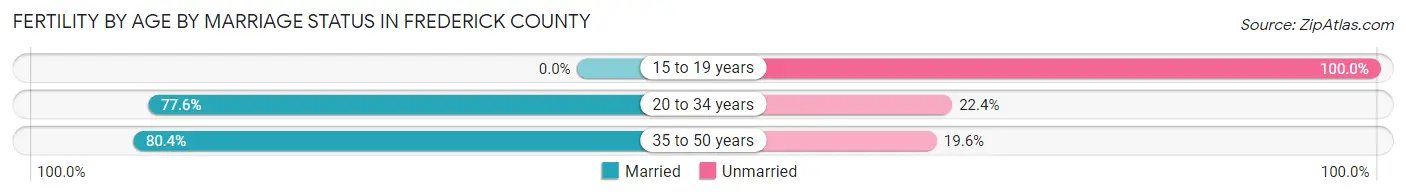
| Age Bracket | Married | Unmarried |
| 15 to 19 years | 0 (0.0%) | 2 (100.0%) |
| 20 to 34 years | 1,931 (77.6%) | 557 (22.4%) |
| 35 to 50 years | 787 (80.4%) | 192 (19.6%) |
| Total | 2,716 (78.3%) | 753 (21.7%) |
Fertility by Education in Frederick County
Average fertility rate in Frederick County is 54.0 births per 1,000 women. Women with the education attainment of graduate degree have the highest fertility rate of 102.0 births per 1,000 women, while women with the education attainment of less than high school have the lowest fertility at 19.0 births per 1,000 women. Women with the education attainment of graduate degree represent 31.0% of all women with births.
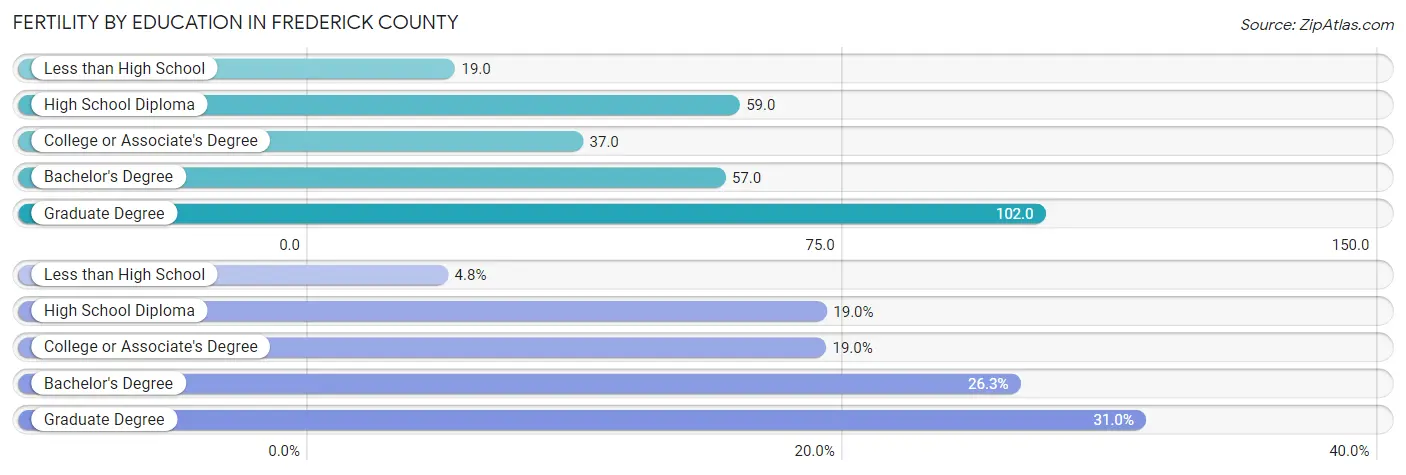
| Educational Attainment | Women with Births | Births / 1,000 Women |
| Less than High School | 167 (4.8%) | 19.0 |
| High School Diploma | 659 (19.0%) | 59.0 |
| College or Associate's Degree | 658 (19.0%) | 37.0 |
| Bachelor's Degree | 911 (26.3%) | 57.0 |
| Graduate Degree | 1,074 (31.0%) | 102.0 |
| Total | 3,469 (100.0%) | 54.0 |
Fertility by Education by Marriage Status in Frederick County
21.7% of women with births in Frederick County are unmarried. Women with the educational attainment of graduate degree are most likely to be married with 90.9% of them married at childbirth, while women with the educational attainment of less than high school are least likely to be married with 52.7% of them unmarried at childbirth.
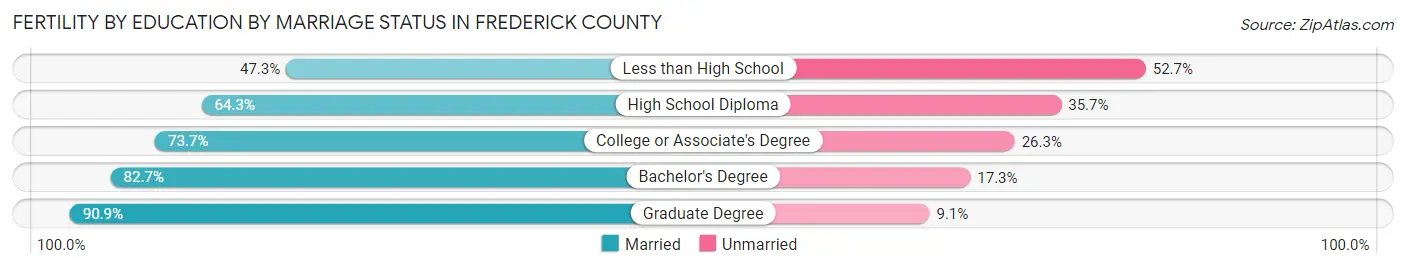
| Educational Attainment | Married | Unmarried |
| Less than High School | 79 (47.3%) | 88 (52.7%) |
| High School Diploma | 424 (64.3%) | 235 (35.7%) |
| College or Associate's Degree | 485 (73.7%) | 173 (26.3%) |
| Bachelor's Degree | 753 (82.7%) | 158 (17.3%) |
| Graduate Degree | 976 (90.9%) | 98 (9.1%) |
| Total | 2,716 (78.3%) | 753 (21.7%) |
Employment Characteristics in Frederick County
Employment by Class of Employer in Frederick County
Among the 143,078 employed individuals in Frederick County, private company employees (88,875 | 62.1%), local government employees (13,785 | 9.6%), and federal government employees (12,934 | 9.0%) make up the most common classes of employment.
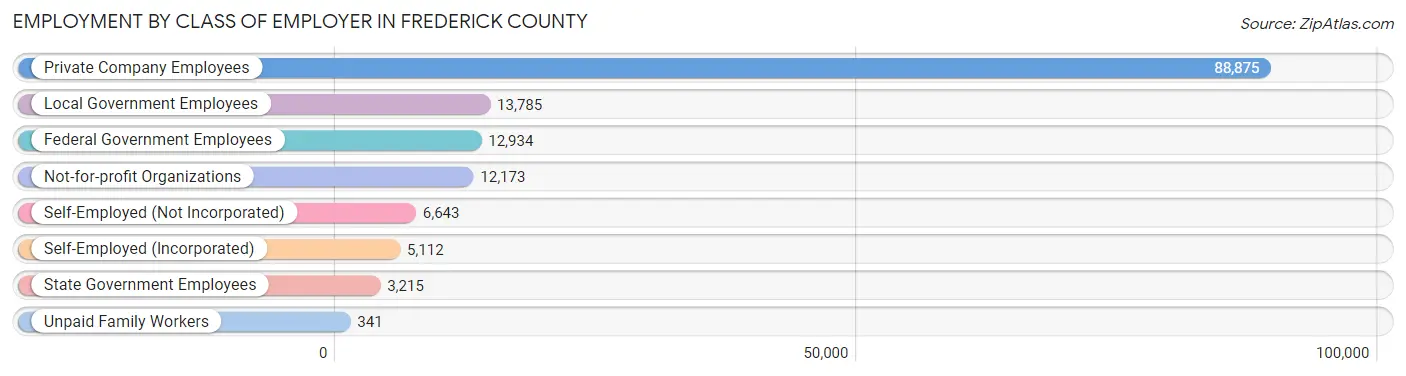
| Employer Class | # Employees | % Employees |
| Private Company Employees | 88,875 | 62.1% |
| Self-Employed (Incorporated) | 5,112 | 3.6% |
| Self-Employed (Not Incorporated) | 6,643 | 4.6% |
| Not-for-profit Organizations | 12,173 | 8.5% |
| Local Government Employees | 13,785 | 9.6% |
| State Government Employees | 3,215 | 2.2% |
| Federal Government Employees | 12,934 | 9.0% |
| Unpaid Family Workers | 341 | 0.2% |
| Total | 143,078 | 100.0% |
Employment Status by Age in Frederick County
According to the labor force statistics for Frederick County, out of the total population over 16 years of age (217,616), 69.5% or 151,243 individuals are in the labor force, with 3.7% or 5,596 of them unemployed. The age group with the highest labor force participation rate is 25 to 29 years, with 88.4% or 14,025 individuals in the labor force. Within the labor force, the 16 to 19 years age range has the highest percentage of unemployed individuals, with 10.9% or 636 of them being unemployed.
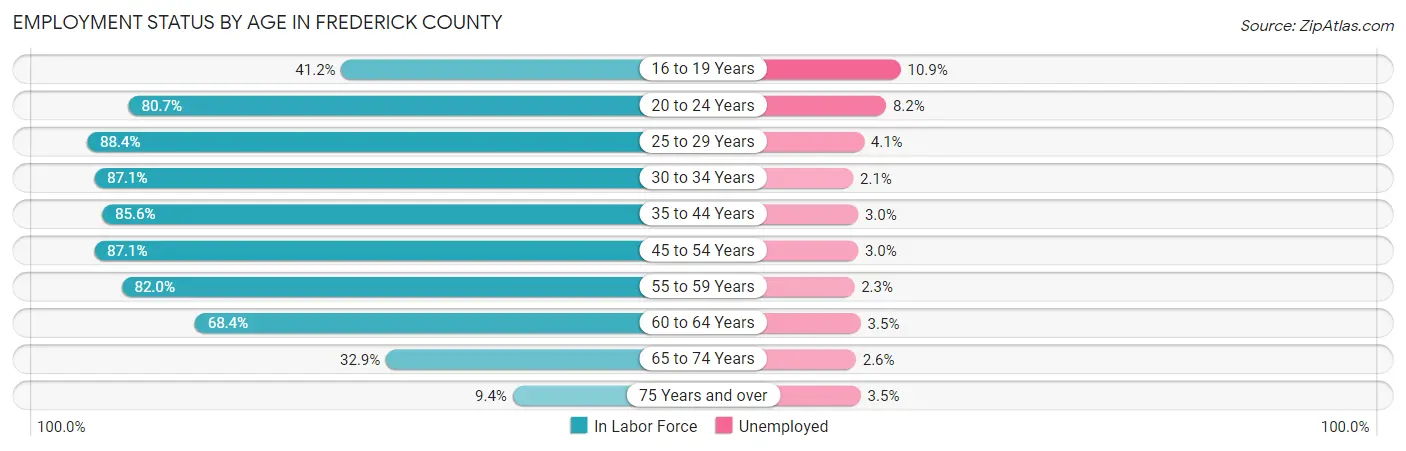
| Age Bracket | In Labor Force | Unemployed |
| 16 to 19 Years | 5,839 (41.2%) | 636 (10.9%) |
| 20 to 24 Years | 13,455 (80.7%) | 1,103 (8.2%) |
| 25 to 29 Years | 14,025 (88.4%) | 575 (4.1%) |
| 30 to 34 Years | 15,842 (87.1%) | 333 (2.1%) |
| 35 to 44 Years | 32,452 (85.6%) | 974 (3.0%) |
| 45 to 54 Years | 32,496 (87.1%) | 975 (3.0%) |
| 55 to 59 Years | 15,706 (82.0%) | 361 (2.3%) |
| 60 to 64 Years | 12,003 (68.4%) | 420 (3.5%) |
| 65 to 74 Years | 7,951 (32.9%) | 207 (2.6%) |
| 75 Years and over | 1,563 (9.4%) | 55 (3.5%) |
| Total | 151,243 (69.5%) | 5,596 (3.7%) |
Employment Status by Educational Attainment in Frederick County
According to labor force statistics for Frederick County, 83.9% of individuals (122,473) out of the total population between 25 and 64 years of age (145,975) are in the labor force, with 3.0% or 3,674 of them being unemployed. The group with the highest labor force participation rate are those with the educational attainment of bachelor's degree or higher, with 88.4% or 59,033 individuals in the labor force. Within the labor force, individuals with less than high school education have the highest percentage of unemployment, with 4.9% or 297 of them being unemployed.
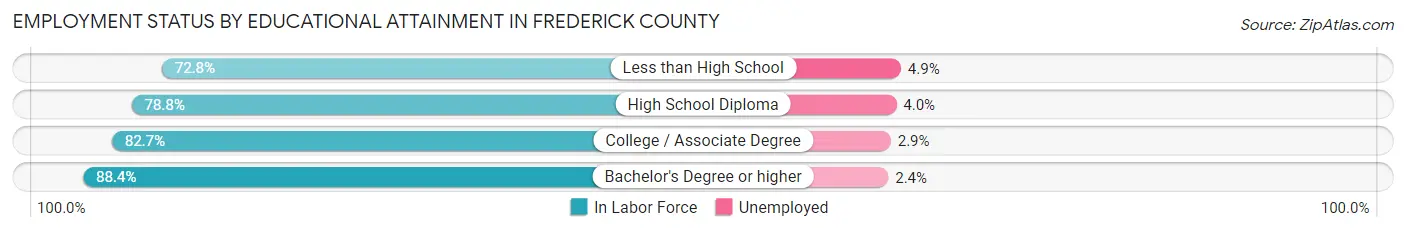
| Educational Attainment | In Labor Force | Unemployed |
| Less than High School | 6,067 (72.8%) | 408 (4.9%) |
| High School Diploma | 24,438 (78.8%) | 1,241 (4.0%) |
| College / Associate Degree | 32,955 (82.7%) | 1,156 (2.9%) |
| Bachelor's Degree or higher | 59,033 (88.4%) | 1,603 (2.4%) |
| Total | 122,473 (83.9%) | 4,379 (3.0%) |
Employment Occupations by Sex in Frederick County
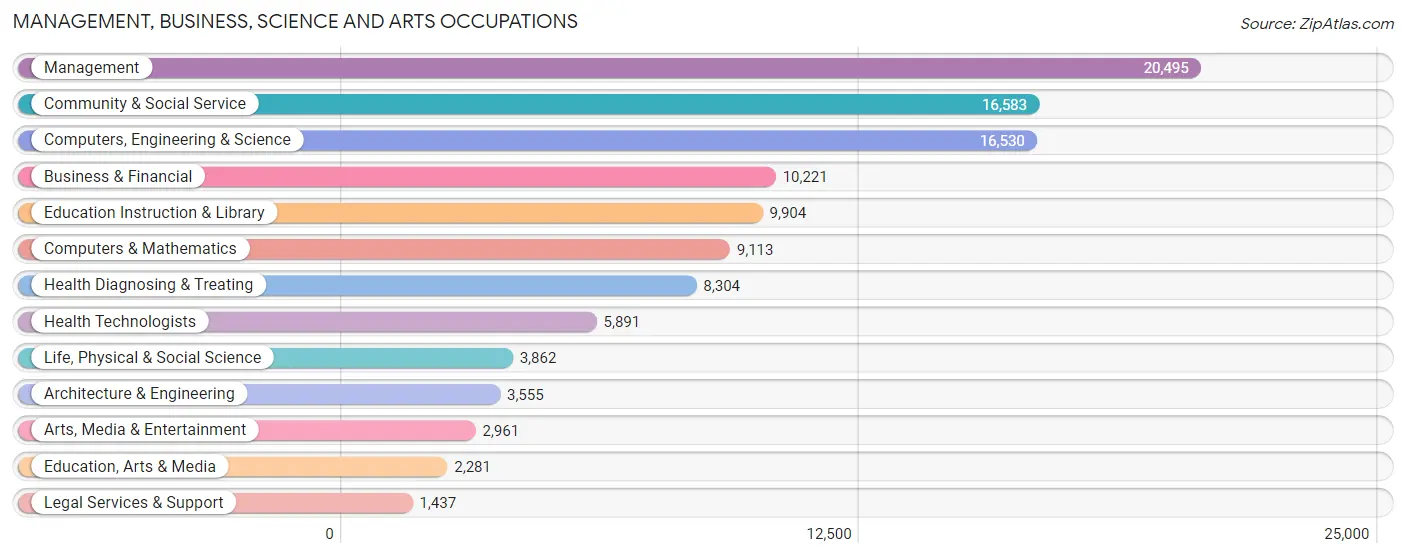
Management, Business, Science and Arts Occupations
The most common Management, Business, Science and Arts occupations in Frederick County are Management (20,495 | 14.2%), Community & Social Service (16,583 | 11.5%), Computers, Engineering & Science (16,530 | 11.4%), Business & Financial (10,221 | 7.1%), and Education Instruction & Library (9,904 | 6.9%).
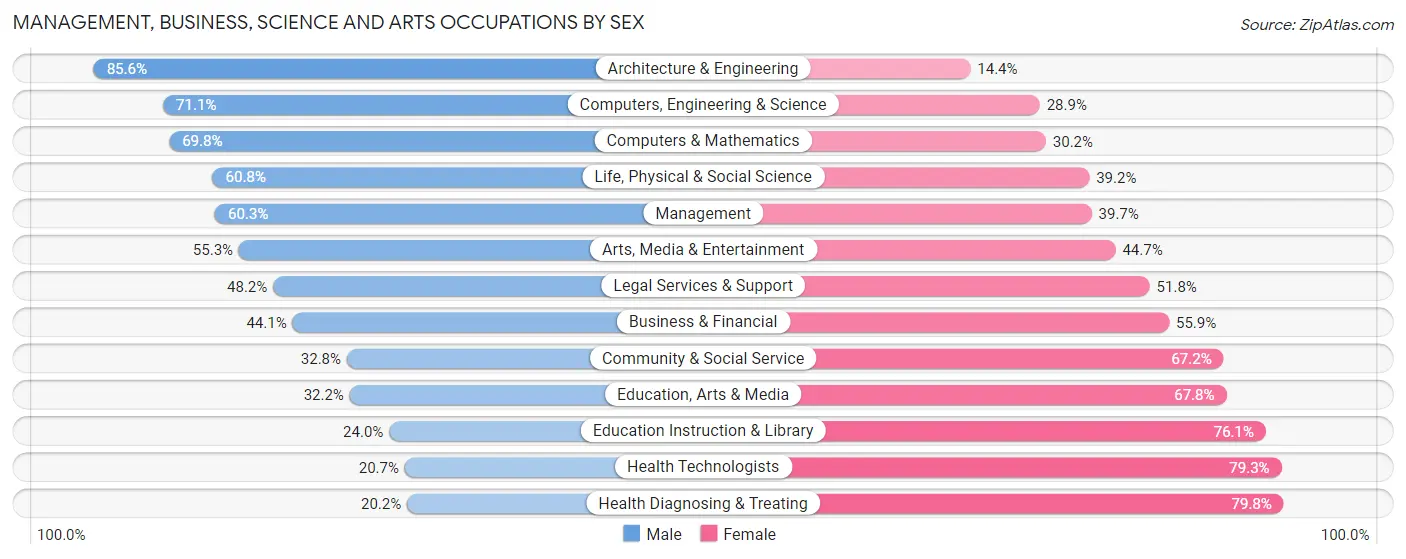
Management, Business, Science and Arts Occupations by Sex
Within the Management, Business, Science and Arts occupations in Frederick County, the most male-oriented occupations are Architecture & Engineering (85.6%), Computers, Engineering & Science (71.1%), and Computers & Mathematics (69.8%), while the most female-oriented occupations are Health Diagnosing & Treating (79.8%), Health Technologists (79.3%), and Education Instruction & Library (76.0%).
| Occupation | Male | Female |
| Management | 12,353 (60.3%) | 8,142 (39.7%) |
| Business & Financial | 4,509 (44.1%) | 5,712 (55.9%) |
| Computers, Engineering & Science | 11,752 (71.1%) | 4,778 (28.9%) |
| Computers & Mathematics | 6,363 (69.8%) | 2,750 (30.2%) |
| Architecture & Engineering | 3,042 (85.6%) | 513 (14.4%) |
| Life, Physical & Social Science | 2,347 (60.8%) | 1,515 (39.2%) |
| Community & Social Service | 5,435 (32.8%) | 11,148 (67.2%) |
| Education, Arts & Media | 734 (32.2%) | 1,547 (67.8%) |
| Legal Services & Support | 692 (48.2%) | 745 (51.8%) |
| Education Instruction & Library | 2,372 (23.9%) | 7,532 (76.0%) |
| Arts, Media & Entertainment | 1,637 (55.3%) | 1,324 (44.7%) |
| Health Diagnosing & Treating | 1,679 (20.2%) | 6,625 (79.8%) |
| Health Technologists | 1,219 (20.7%) | 4,672 (79.3%) |
| Total (Category) | 35,728 (49.5%) | 36,405 (50.5%) |
| Total (Overall) | 77,763 (53.7%) | 66,910 (46.3%) |
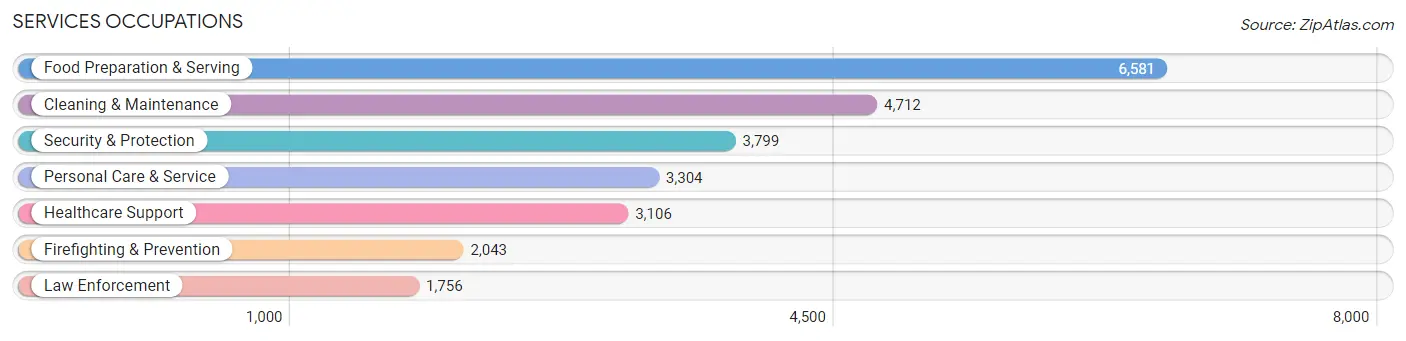
Services Occupations
The most common Services occupations in Frederick County are Food Preparation & Serving (6,581 | 4.5%), Cleaning & Maintenance (4,712 | 3.3%), Security & Protection (3,799 | 2.6%), Personal Care & Service (3,304 | 2.3%), and Healthcare Support (3,106 | 2.1%).
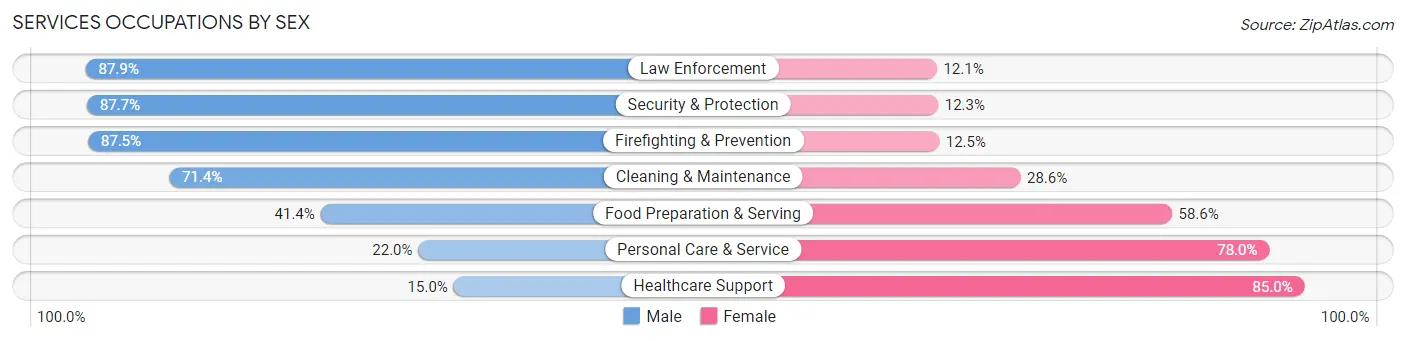
Services Occupations by Sex
Within the Services occupations in Frederick County, the most male-oriented occupations are Law Enforcement (87.9%), Security & Protection (87.7%), and Firefighting & Prevention (87.5%), while the most female-oriented occupations are Healthcare Support (85.0%), Personal Care & Service (78.0%), and Food Preparation & Serving (58.6%).
| Occupation | Male | Female |
| Healthcare Support | 467 (15.0%) | 2,639 (85.0%) |
| Security & Protection | 3,331 (87.7%) | 468 (12.3%) |
| Firefighting & Prevention | 1,787 (87.5%) | 256 (12.5%) |
| Law Enforcement | 1,544 (87.9%) | 212 (12.1%) |
| Food Preparation & Serving | 2,723 (41.4%) | 3,858 (58.6%) |
| Cleaning & Maintenance | 3,364 (71.4%) | 1,348 (28.6%) |
| Personal Care & Service | 728 (22.0%) | 2,576 (78.0%) |
| Total (Category) | 10,613 (49.4%) | 10,889 (50.6%) |
| Total (Overall) | 77,763 (53.7%) | 66,910 (46.3%) |
Sales and Office Occupations
The most common Sales and Office occupations in Frederick County are Office & Administration (13,869 | 9.6%), and Sales & Related (12,828 | 8.9%).

Sales and Office Occupations by Sex
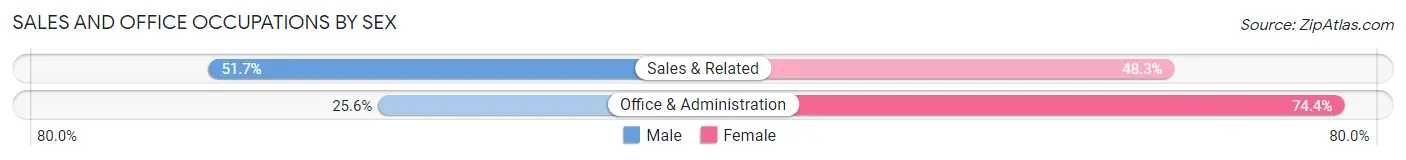
| Occupation | Male | Female |
| Sales & Related | 6,634 (51.7%) | 6,194 (48.3%) |
| Office & Administration | 3,551 (25.6%) | 10,318 (74.4%) |
| Total (Category) | 10,185 (38.2%) | 16,512 (61.9%) |
| Total (Overall) | 77,763 (53.7%) | 66,910 (46.3%) |
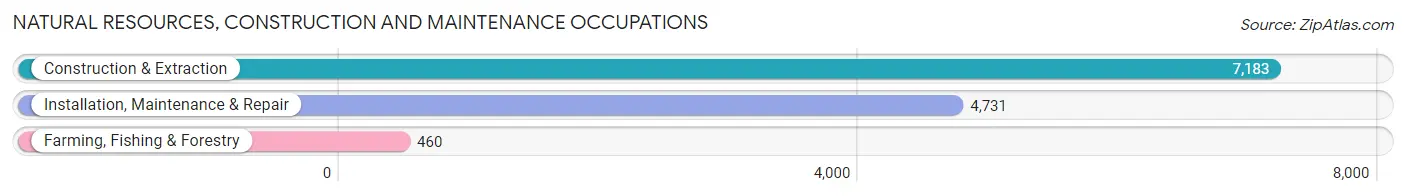
Natural Resources, Construction and Maintenance Occupations
The most common Natural Resources, Construction and Maintenance occupations in Frederick County are Construction & Extraction (7,183 | 5.0%), Installation, Maintenance & Repair (4,731 | 3.3%), and Farming, Fishing & Forestry (460 | 0.3%).
Natural Resources, Construction and Maintenance Occupations by Sex
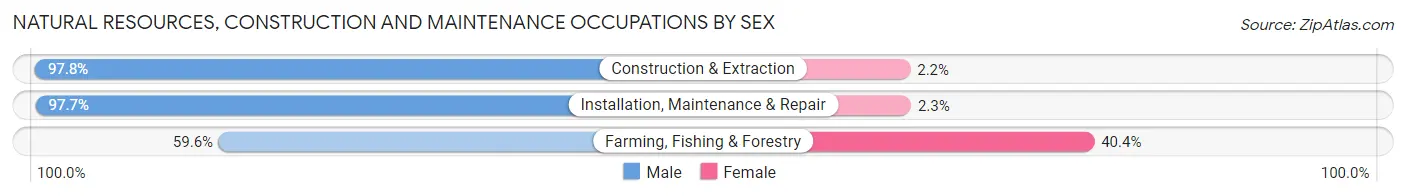
| Occupation | Male | Female |
| Farming, Fishing & Forestry | 274 (59.6%) | 186 (40.4%) |
| Construction & Extraction | 7,028 (97.8%) | 155 (2.2%) |
| Installation, Maintenance & Repair | 4,622 (97.7%) | 109 (2.3%) |
| Total (Category) | 11,924 (96.4%) | 450 (3.6%) |
| Total (Overall) | 77,763 (53.7%) | 66,910 (46.3%) |
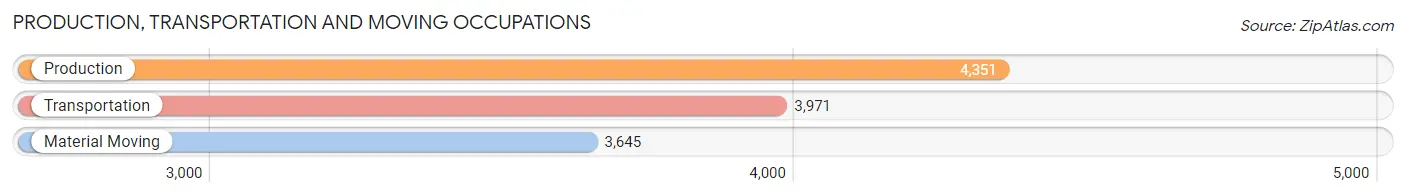
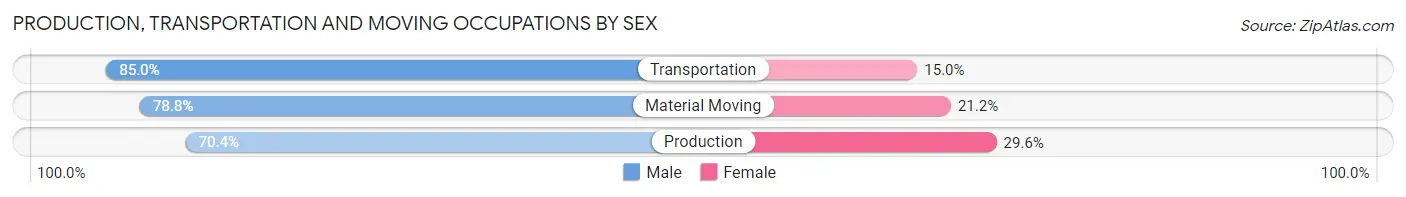
Production, Transportation and Moving Occupations
The most common Production, Transportation and Moving occupations in Frederick County are Production (4,351 | 3.0%), Transportation (3,971 | 2.7%), and Material Moving (3,645 | 2.5%).
Production, Transportation and Moving Occupations by Sex
| Occupation | Male | Female |
| Production | 3,065 (70.4%) | 1,286 (29.6%) |
| Transportation | 3,375 (85.0%) | 596 (15.0%) |
| Material Moving | 2,873 (78.8%) | 772 (21.2%) |
| Total (Category) | 9,313 (77.8%) | 2,654 (22.2%) |
| Total (Overall) | 77,763 (53.7%) | 66,910 (46.3%) |
Employment Industries by Sex in Frederick County
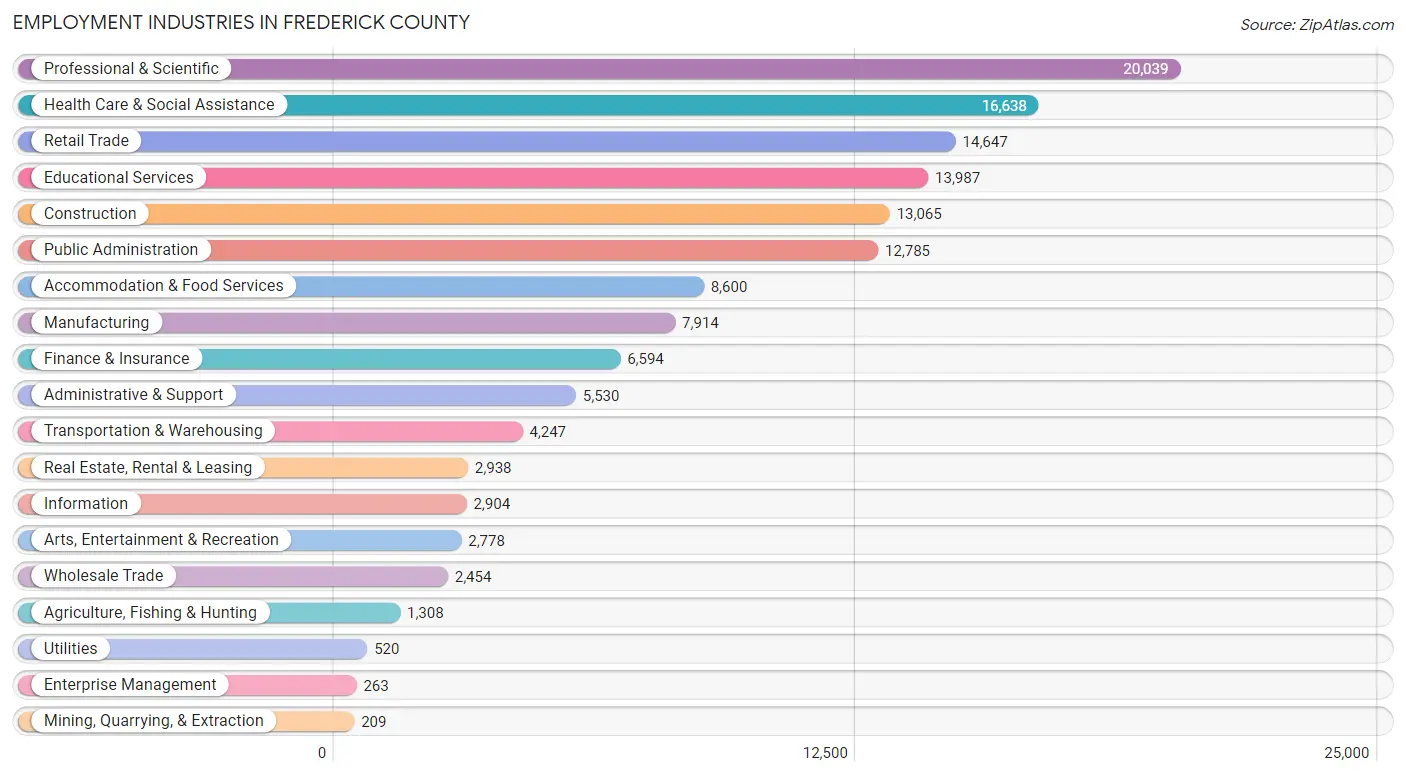
Employment Industries in Frederick County
The major employment industries in Frederick County include Professional & Scientific (20,039 | 13.9%), Health Care & Social Assistance (16,638 | 11.5%), Retail Trade (14,647 | 10.1%), Educational Services (13,987 | 9.7%), and Construction (13,065 | 9.0%).
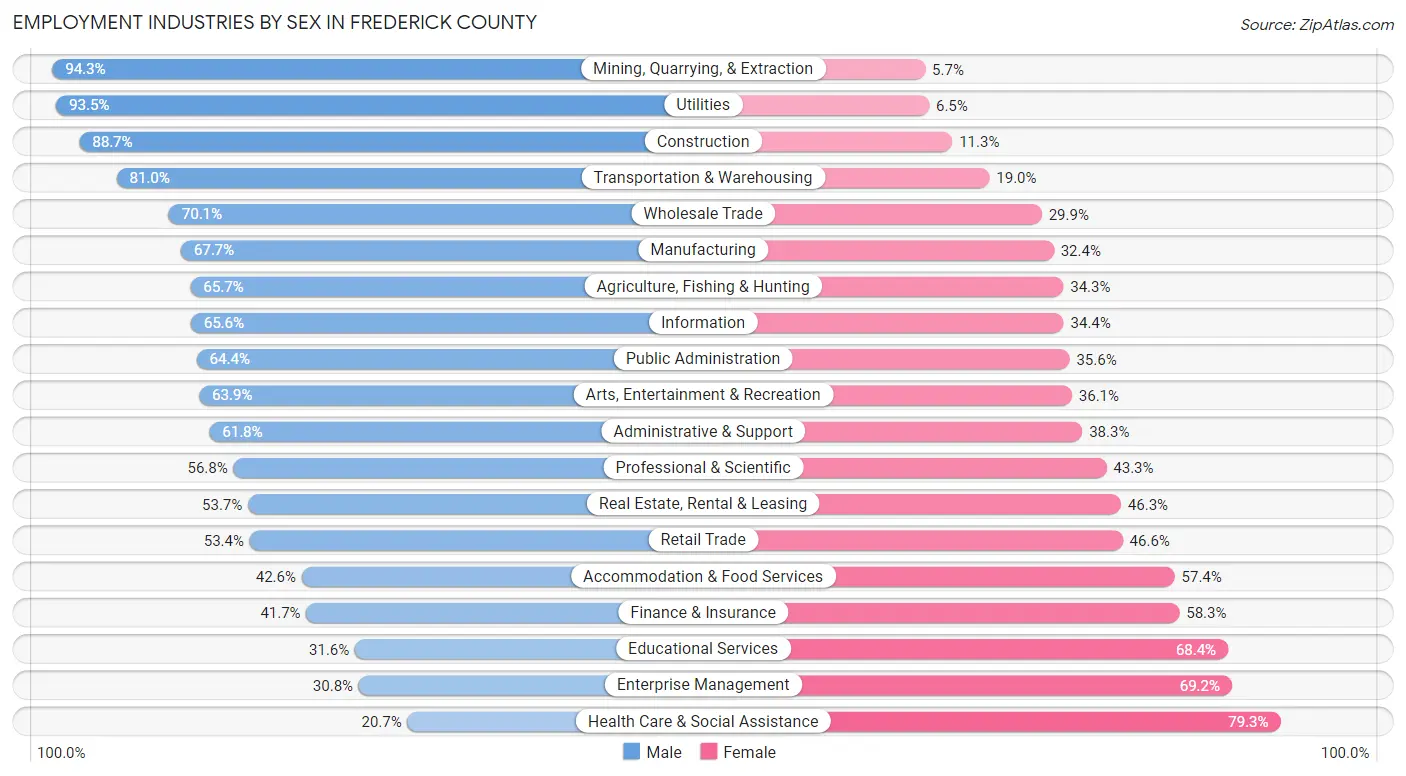
Employment Industries by Sex in Frederick County
The Frederick County industries that see more men than women are Mining, Quarrying, & Extraction (94.3%), Utilities (93.5%), and Construction (88.7%), whereas the industries that tend to have a higher number of women are Health Care & Social Assistance (79.3%), Enterprise Management (69.2%), and Educational Services (68.4%).
| Industry | Male | Female |
| Agriculture, Fishing & Hunting | 859 (65.7%) | 449 (34.3%) |
| Mining, Quarrying, & Extraction | 197 (94.3%) | 12 (5.7%) |
| Construction | 11,583 (88.7%) | 1,482 (11.3%) |
| Manufacturing | 5,354 (67.6%) | 2,560 (32.4%) |
| Wholesale Trade | 1,721 (70.1%) | 733 (29.9%) |
| Retail Trade | 7,819 (53.4%) | 6,828 (46.6%) |
| Transportation & Warehousing | 3,439 (81.0%) | 808 (19.0%) |
| Utilities | 486 (93.5%) | 34 (6.5%) |
| Information | 1,905 (65.6%) | 999 (34.4%) |
| Finance & Insurance | 2,747 (41.7%) | 3,847 (58.3%) |
| Real Estate, Rental & Leasing | 1,579 (53.7%) | 1,359 (46.3%) |
| Professional & Scientific | 11,373 (56.8%) | 8,666 (43.2%) |
| Enterprise Management | 81 (30.8%) | 182 (69.2%) |
| Administrative & Support | 3,415 (61.8%) | 2,115 (38.3%) |
| Educational Services | 4,418 (31.6%) | 9,569 (68.4%) |
| Health Care & Social Assistance | 3,451 (20.7%) | 13,187 (79.3%) |
| Arts, Entertainment & Recreation | 1,775 (63.9%) | 1,003 (36.1%) |
| Accommodation & Food Services | 3,666 (42.6%) | 4,934 (57.4%) |
| Public Administration | 8,231 (64.4%) | 4,554 (35.6%) |
| Total | 77,763 (53.7%) | 66,910 (46.3%) |
Education in Frederick County
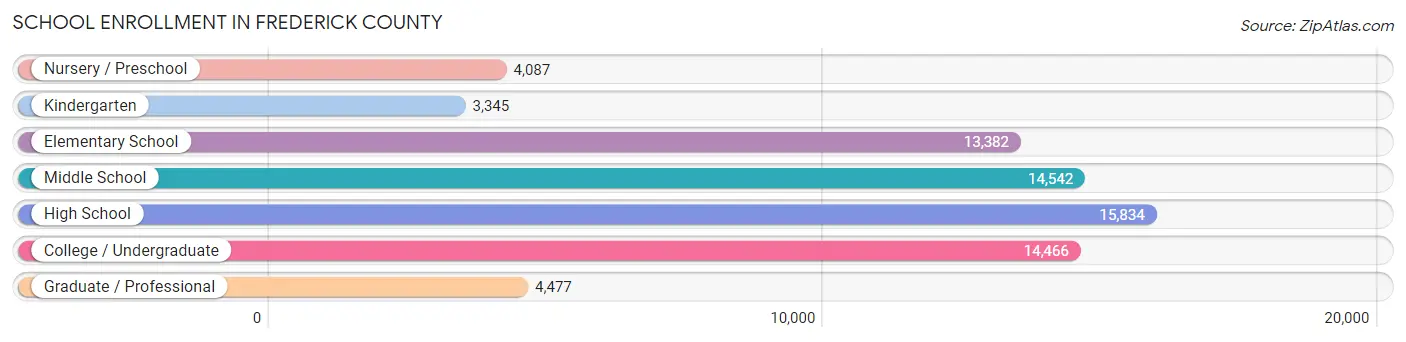
School Enrollment in Frederick County
The most common levels of schooling among the 70,133 students in Frederick County are high school (15,834 | 22.6%), middle school (14,542 | 20.7%), and college / undergraduate (14,466 | 20.6%).
| School Level | # Students | % Students |
| Nursery / Preschool | 4,087 | 5.8% |
| Kindergarten | 3,345 | 4.8% |
| Elementary School | 13,382 | 19.1% |
| Middle School | 14,542 | 20.7% |
| High School | 15,834 | 22.6% |
| College / Undergraduate | 14,466 | 20.6% |
| Graduate / Professional | 4,477 | 6.4% |
| Total | 70,133 | 100.0% |
School Enrollment by Age by Funding Source in Frederick County
Out of a total of 70,133 students who are enrolled in schools in Frederick County, 12,694 (18.1%) attend a private institution, while the remaining 57,439 (81.9%) are enrolled in public schools. The age group of 3 to 4 year olds has the highest likelihood of being enrolled in private schools, with 1,359 (47.7% in the age bracket) enrolled. Conversely, the age group of 15 to 17 year olds has the lowest likelihood of being enrolled in a private school, with 10,231 (92.4% in the age bracket) attending a public institution.
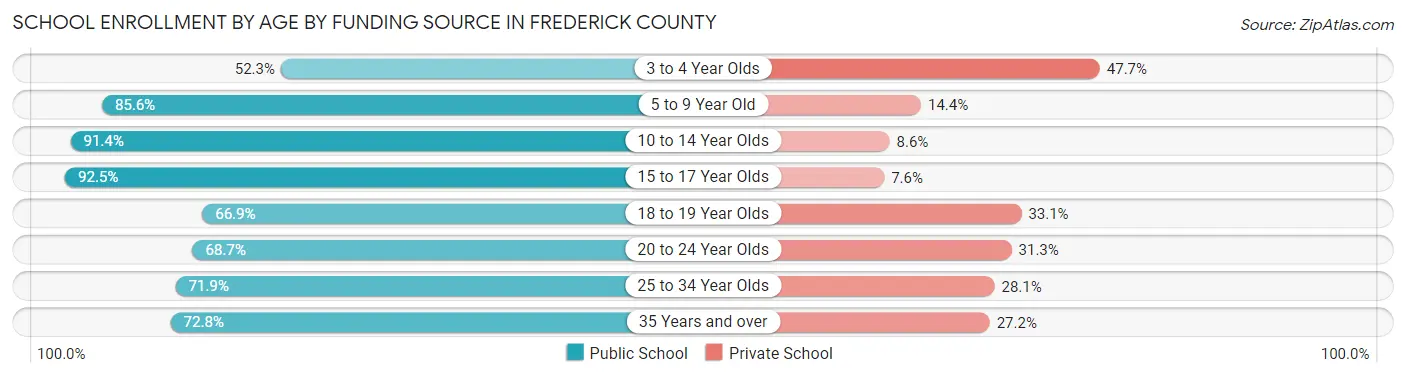
| Age Bracket | Public School | Private School |
| 3 to 4 Year Olds | 1,489 (52.3%) | 1,359 (47.7%) |
| 5 to 9 Year Old | 13,985 (85.6%) | 2,354 (14.4%) |
| 10 to 14 Year Olds | 16,623 (91.4%) | 1,556 (8.6%) |
| 15 to 17 Year Olds | 10,231 (92.4%) | 835 (7.5%) |
| 18 to 19 Year Olds | 3,918 (66.9%) | 1,939 (33.1%) |
| 20 to 24 Year Olds | 5,074 (68.7%) | 2,310 (31.3%) |
| 25 to 34 Year Olds | 2,975 (71.9%) | 1,163 (28.1%) |
| 35 Years and over | 3,146 (72.8%) | 1,176 (27.2%) |
| Total | 57,439 (81.9%) | 12,694 (18.1%) |
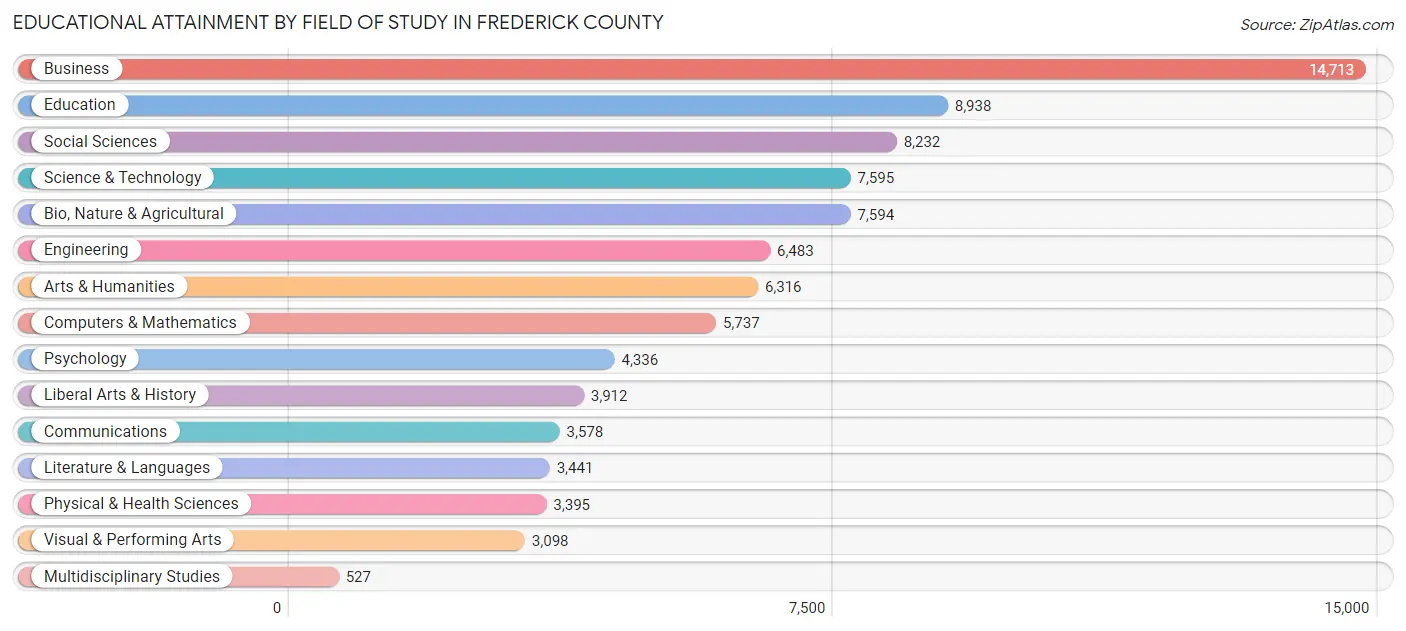
Educational Attainment by Field of Study in Frederick County
Business (14,713 | 16.7%), education (8,938 | 10.2%), social sciences (8,232 | 9.4%), science & technology (7,595 | 8.6%), and bio, nature & agricultural (7,594 | 8.6%) are the most common fields of study among 87,895 individuals in Frederick County who have obtained a bachelor's degree or higher.
| Field of Study | # Graduates | % Graduates |
| Computers & Mathematics | 5,737 | 6.5% |
| Bio, Nature & Agricultural | 7,594 | 8.6% |
| Physical & Health Sciences | 3,395 | 3.9% |
| Psychology | 4,336 | 4.9% |
| Social Sciences | 8,232 | 9.4% |
| Engineering | 6,483 | 7.4% |
| Multidisciplinary Studies | 527 | 0.6% |
| Science & Technology | 7,595 | 8.6% |
| Business | 14,713 | 16.7% |
| Education | 8,938 | 10.2% |
| Literature & Languages | 3,441 | 3.9% |
| Liberal Arts & History | 3,912 | 4.4% |
| Visual & Performing Arts | 3,098 | 3.5% |
| Communications | 3,578 | 4.1% |
| Arts & Humanities | 6,316 | 7.2% |
| Total | 87,895 | 100.0% |
Transportation & Commute in Frederick County
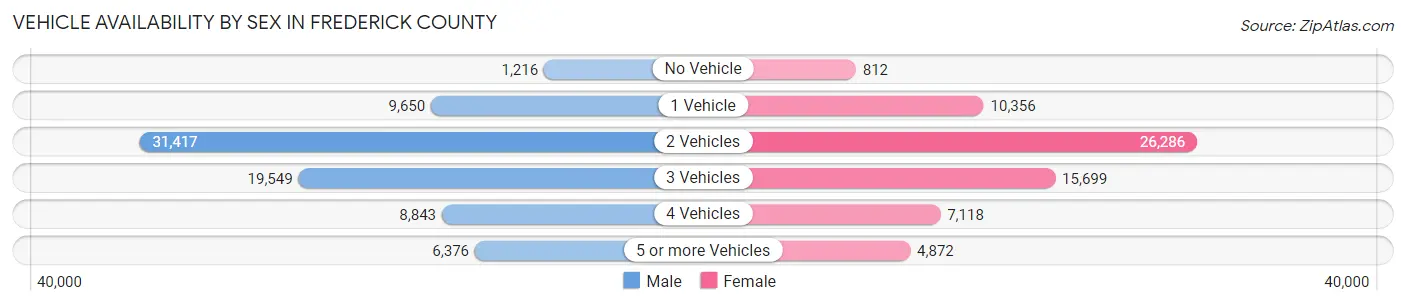
Vehicle Availability by Sex in Frederick County
The most prevalent vehicle ownership categories in Frederick County are males with 2 vehicles (31,417, accounting for 40.8%) and females with 2 vehicles (26,286, making up 48.2%).
| Vehicles Available | Male | Female |
| No Vehicle | 1,216 (1.6%) | 812 (1.3%) |
| 1 Vehicle | 9,650 (12.5%) | 10,356 (15.9%) |
| 2 Vehicles | 31,417 (40.8%) | 26,286 (40.4%) |
| 3 Vehicles | 19,549 (25.4%) | 15,699 (24.1%) |
| 4 Vehicles | 8,843 (11.5%) | 7,118 (10.9%) |
| 5 or more Vehicles | 6,376 (8.3%) | 4,872 (7.5%) |
| Total | 77,051 (100.0%) | 65,143 (100.0%) |
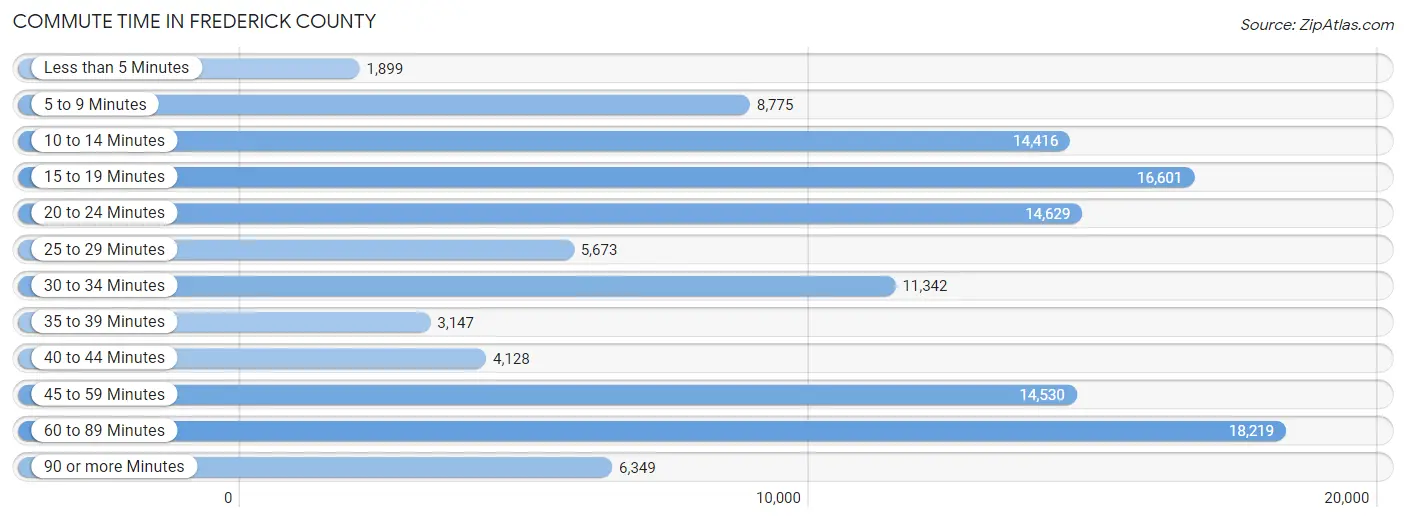
Commute Time in Frederick County
The most frequently occuring commute durations in Frederick County are 60 to 89 minutes (18,219 commuters, 15.2%), 15 to 19 minutes (16,601 commuters, 13.9%), and 20 to 24 minutes (14,629 commuters, 12.2%).
| Commute Time | # Commuters | % Commuters |
| Less than 5 Minutes | 1,899 | 1.6% |
| 5 to 9 Minutes | 8,775 | 7.3% |
| 10 to 14 Minutes | 14,416 | 12.0% |
| 15 to 19 Minutes | 16,601 | 13.9% |
| 20 to 24 Minutes | 14,629 | 12.2% |
| 25 to 29 Minutes | 5,673 | 4.7% |
| 30 to 34 Minutes | 11,342 | 9.5% |
| 35 to 39 Minutes | 3,147 | 2.6% |
| 40 to 44 Minutes | 4,128 | 3.5% |
| 45 to 59 Minutes | 14,530 | 12.1% |
| 60 to 89 Minutes | 18,219 | 15.2% |
| 90 or more Minutes | 6,349 | 5.3% |
Commute Time by Sex in Frederick County
The most common commute times in Frederick County are 60 to 89 minutes (12,040 commuters, 18.3%) for males and 15 to 19 minutes (7,854 commuters, 14.6%) for females.
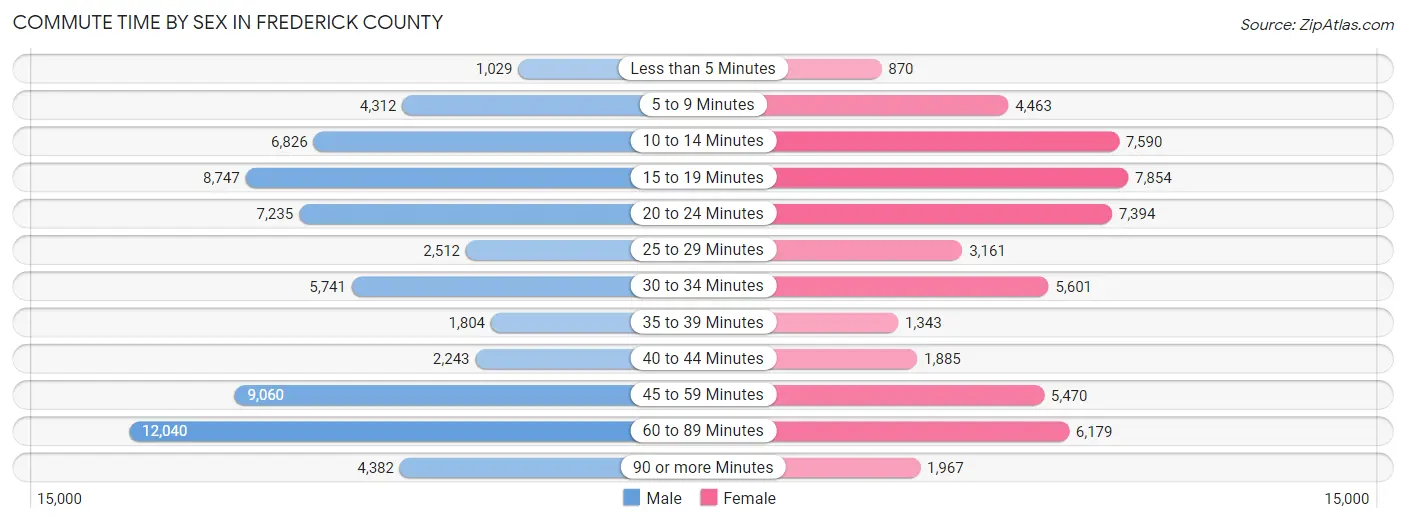
| Commute Time | Male | Female |
| Less than 5 Minutes | 1,029 (1.6%) | 870 (1.6%) |
| 5 to 9 Minutes | 4,312 (6.5%) | 4,463 (8.3%) |
| 10 to 14 Minutes | 6,826 (10.3%) | 7,590 (14.1%) |
| 15 to 19 Minutes | 8,747 (13.3%) | 7,854 (14.6%) |
| 20 to 24 Minutes | 7,235 (11.0%) | 7,394 (13.8%) |
| 25 to 29 Minutes | 2,512 (3.8%) | 3,161 (5.9%) |
| 30 to 34 Minutes | 5,741 (8.7%) | 5,601 (10.4%) |
| 35 to 39 Minutes | 1,804 (2.7%) | 1,343 (2.5%) |
| 40 to 44 Minutes | 2,243 (3.4%) | 1,885 (3.5%) |
| 45 to 59 Minutes | 9,060 (13.7%) | 5,470 (10.2%) |
| 60 to 89 Minutes | 12,040 (18.3%) | 6,179 (11.5%) |
| 90 or more Minutes | 4,382 (6.7%) | 1,967 (3.7%) |
Time of Departure to Work by Sex in Frederick County
The most frequent times of departure to work in Frederick County are 6:00 AM to 6:29 AM (7,895, 12.0%) for males and 7:30 AM to 7:59 AM (7,852, 14.6%) for females.
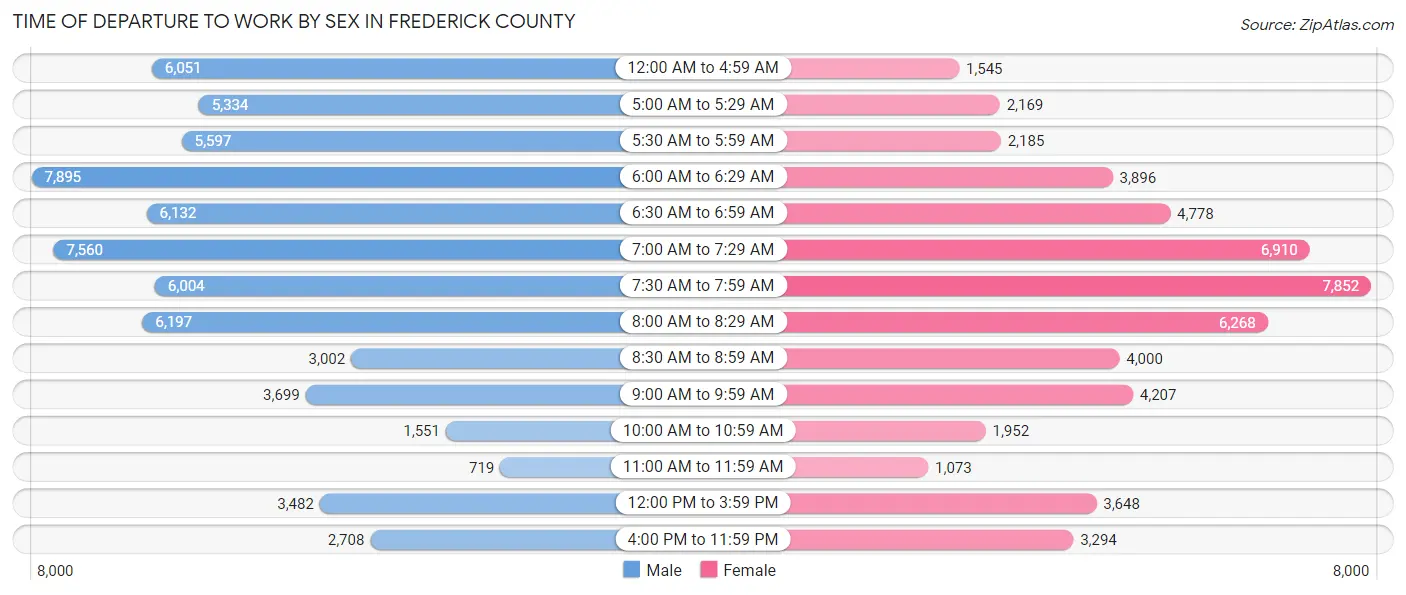
| Time of Departure | Male | Female |
| 12:00 AM to 4:59 AM | 6,051 (9.2%) | 1,545 (2.9%) |
| 5:00 AM to 5:29 AM | 5,334 (8.1%) | 2,169 (4.0%) |
| 5:30 AM to 5:59 AM | 5,597 (8.5%) | 2,185 (4.1%) |
| 6:00 AM to 6:29 AM | 7,895 (12.0%) | 3,896 (7.2%) |
| 6:30 AM to 6:59 AM | 6,132 (9.3%) | 4,778 (8.9%) |
| 7:00 AM to 7:29 AM | 7,560 (11.5%) | 6,910 (12.9%) |
| 7:30 AM to 7:59 AM | 6,004 (9.1%) | 7,852 (14.6%) |
| 8:00 AM to 8:29 AM | 6,197 (9.4%) | 6,268 (11.7%) |
| 8:30 AM to 8:59 AM | 3,002 (4.5%) | 4,000 (7.4%) |
| 9:00 AM to 9:59 AM | 3,699 (5.6%) | 4,207 (7.8%) |
| 10:00 AM to 10:59 AM | 1,551 (2.4%) | 1,952 (3.6%) |
| 11:00 AM to 11:59 AM | 719 (1.1%) | 1,073 (2.0%) |
| 12:00 PM to 3:59 PM | 3,482 (5.3%) | 3,648 (6.8%) |
| 4:00 PM to 11:59 PM | 2,708 (4.1%) | 3,294 (6.1%) |
| Total | 65,931 (100.0%) | 53,777 (100.0%) |
Housing Occupancy in Frederick County
Occupancy by Ownership in Frederick County
Of the total 99,891 dwellings in Frederick County, owner-occupied units account for 76,338 (76.4%), while renter-occupied units make up 23,553 (23.6%).
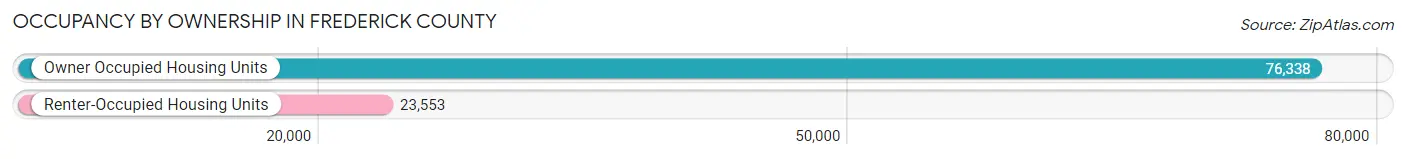
| Occupancy | # Housing Units | % Housing Units |
| Owner Occupied Housing Units | 76,338 | 76.4% |
| Renter-Occupied Housing Units | 23,553 | 23.6% |
| Total Occupied Housing Units | 99,891 | 100.0% |
Occupancy by Household Size in Frederick County
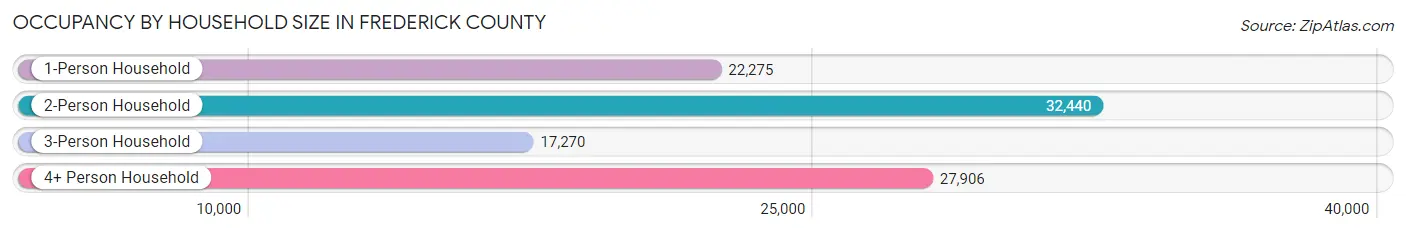
| Household Size | # Housing Units | % Housing Units |
| 1-Person Household | 22,275 | 22.3% |
| 2-Person Household | 32,440 | 32.5% |
| 3-Person Household | 17,270 | 17.3% |
| 4+ Person Household | 27,906 | 27.9% |
| Total Housing Units | 99,891 | 100.0% |
Occupancy by Ownership by Household Size in Frederick County
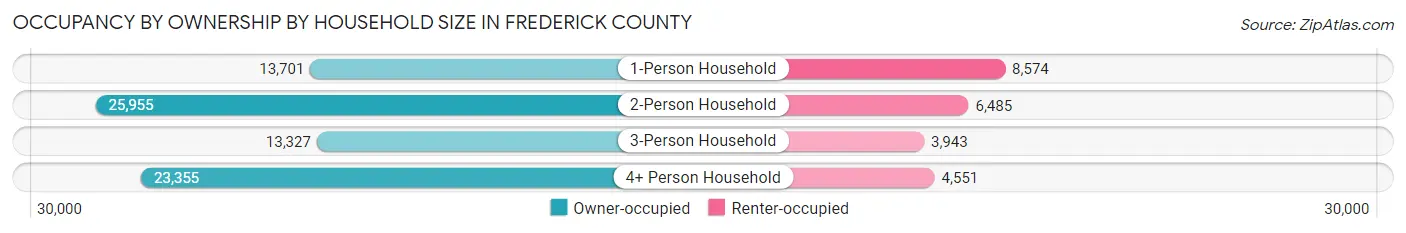
| Household Size | Owner-occupied | Renter-occupied |
| 1-Person Household | 13,701 (61.5%) | 8,574 (38.5%) |
| 2-Person Household | 25,955 (80.0%) | 6,485 (20.0%) |
| 3-Person Household | 13,327 (77.2%) | 3,943 (22.8%) |
| 4+ Person Household | 23,355 (83.7%) | 4,551 (16.3%) |
| Total Housing Units | 76,338 (76.4%) | 23,553 (23.6%) |
Occupancy by Educational Attainment in Frederick County
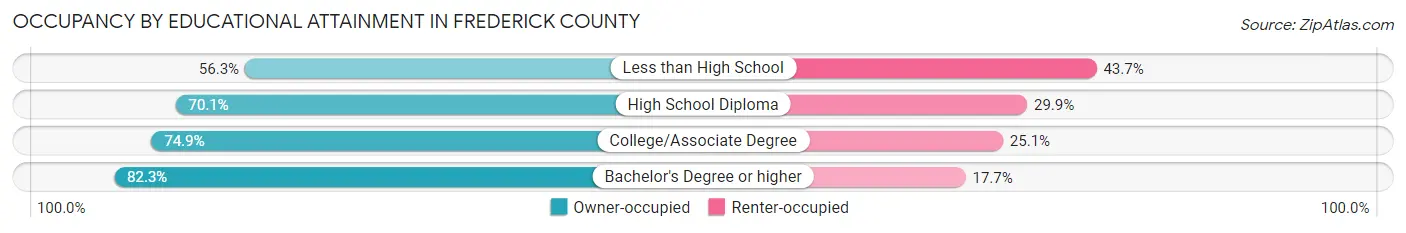
| Household Size | Owner-occupied | Renter-occupied |
| Less than High School | 3,255 (56.3%) | 2,524 (43.7%) |
| High School Diploma | 13,949 (70.1%) | 5,952 (29.9%) |
| College/Associate Degree | 19,450 (74.9%) | 6,529 (25.1%) |
| Bachelor's Degree or higher | 39,684 (82.3%) | 8,548 (17.7%) |
Occupancy by Age of Householder in Frederick County
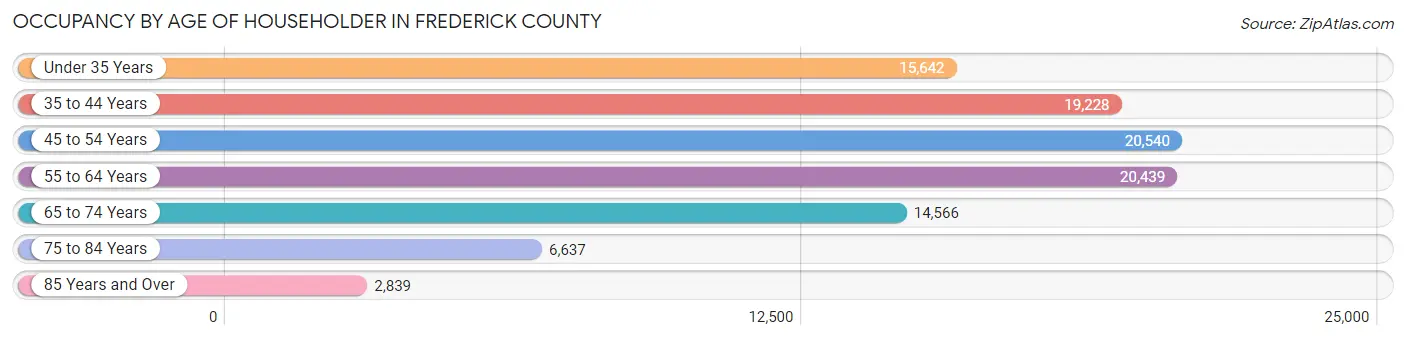
| Age Bracket | # Households | % Households |
| Under 35 Years | 15,642 | 15.7% |
| 35 to 44 Years | 19,228 | 19.3% |
| 45 to 54 Years | 20,540 | 20.6% |
| 55 to 64 Years | 20,439 | 20.5% |
| 65 to 74 Years | 14,566 | 14.6% |
| 75 to 84 Years | 6,637 | 6.6% |
| 85 Years and Over | 2,839 | 2.8% |
| Total | 99,891 | 100.0% |
Housing Finances in Frederick County
Median Income by Occupancy in Frederick County
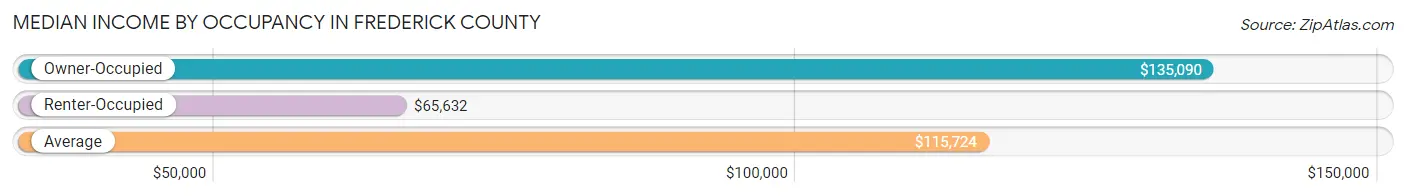
| Occupancy Type | # Households | Median Income |
| Owner-Occupied | 76,338 (76.4%) | $135,090 |
| Renter-Occupied | 23,553 (23.6%) | $65,632 |
| Average | 99,891 (100.0%) | $115,724 |
Occupancy by Householder Income Bracket in Frederick County
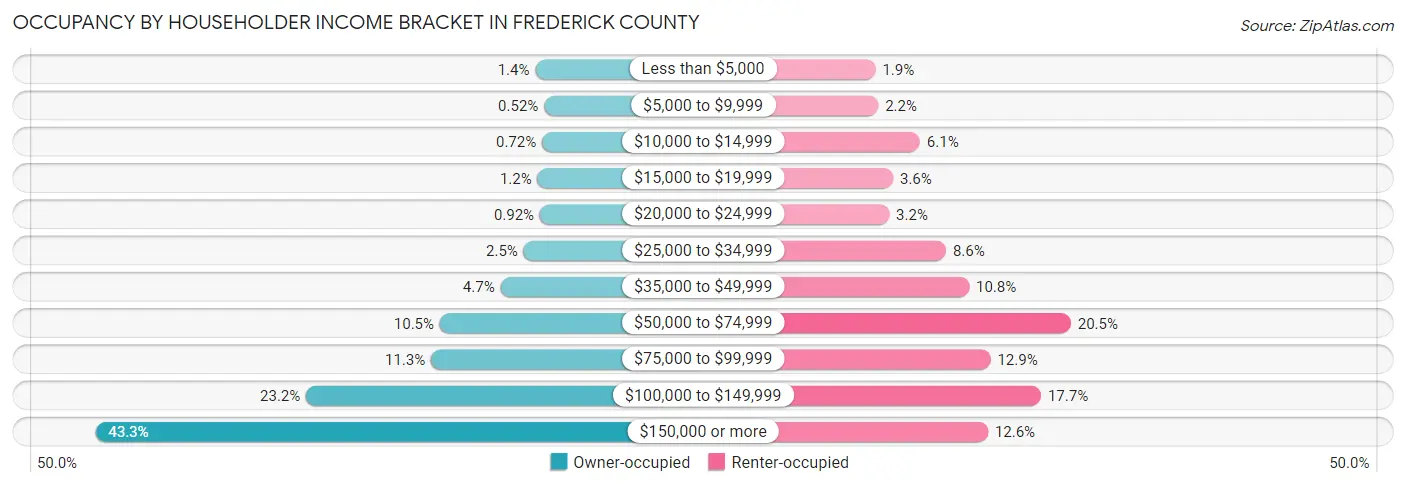
| Income Bracket | Owner-occupied | Renter-occupied |
| Less than $5,000 | 1,036 (1.4%) | 448 (1.9%) |
| $5,000 to $9,999 | 398 (0.5%) | 509 (2.2%) |
| $10,000 to $14,999 | 551 (0.7%) | 1,444 (6.1%) |
| $15,000 to $19,999 | 876 (1.1%) | 842 (3.6%) |
| $20,000 to $24,999 | 706 (0.9%) | 753 (3.2%) |
| $25,000 to $34,999 | 1,882 (2.5%) | 2,028 (8.6%) |
| $35,000 to $49,999 | 3,575 (4.7%) | 2,545 (10.8%) |
| $50,000 to $74,999 | 7,975 (10.4%) | 4,828 (20.5%) |
| $75,000 to $99,999 | 8,615 (11.3%) | 3,026 (12.9%) |
| $100,000 to $149,999 | 17,701 (23.2%) | 4,159 (17.7%) |
| $150,000 or more | 33,023 (43.3%) | 2,971 (12.6%) |
| Total | 76,338 (100.0%) | 23,553 (100.0%) |
Monthly Housing Cost Tiers in Frederick County
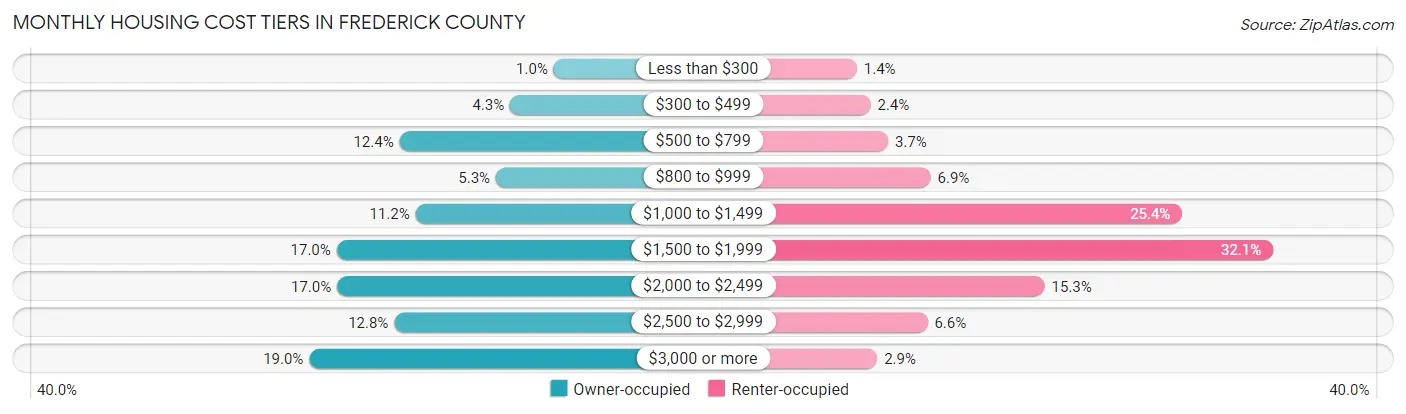
| Monthly Cost | Owner-occupied | Renter-occupied |
| Less than $300 | 784 (1.0%) | 336 (1.4%) |
| $300 to $499 | 3,245 (4.3%) | 575 (2.4%) |
| $500 to $799 | 9,462 (12.4%) | 877 (3.7%) |
| $800 to $999 | 4,038 (5.3%) | 1,615 (6.9%) |
| $1,000 to $1,499 | 8,557 (11.2%) | 5,979 (25.4%) |
| $1,500 to $1,999 | 12,990 (17.0%) | 7,555 (32.1%) |
| $2,000 to $2,499 | 12,972 (17.0%) | 3,594 (15.3%) |
| $2,500 to $2,999 | 9,759 (12.8%) | 1,561 (6.6%) |
| $3,000 or more | 14,531 (19.0%) | 691 (2.9%) |
| Total | 76,338 (100.0%) | 23,553 (100.0%) |
Physical Housing Characteristics in Frederick County
Housing Structures in Frederick County
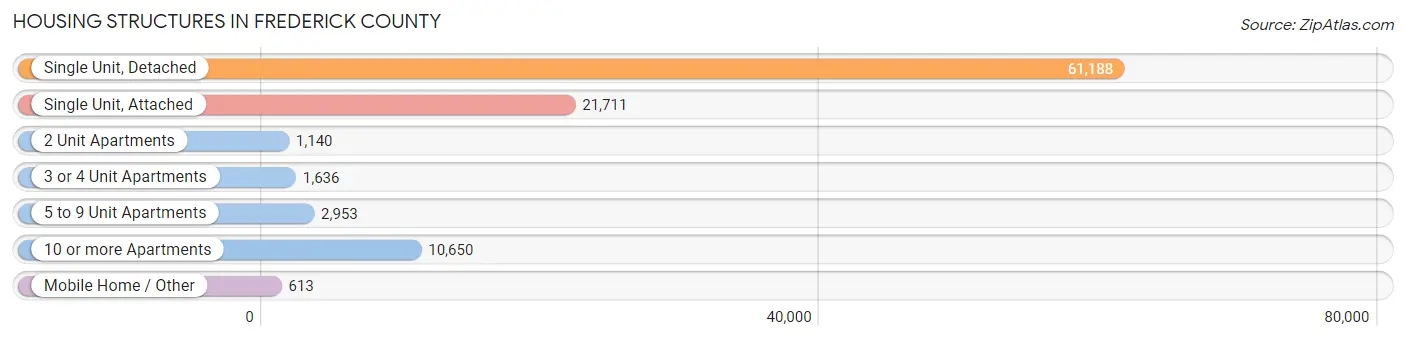
| Structure Type | # Housing Units | % Housing Units |
| Single Unit, Detached | 61,188 | 61.3% |
| Single Unit, Attached | 21,711 | 21.7% |
| 2 Unit Apartments | 1,140 | 1.1% |
| 3 or 4 Unit Apartments | 1,636 | 1.6% |
| 5 to 9 Unit Apartments | 2,953 | 3.0% |
| 10 or more Apartments | 10,650 | 10.7% |
| Mobile Home / Other | 613 | 0.6% |
| Total | 99,891 | 100.0% |
Housing Structures by Occupancy in Frederick County
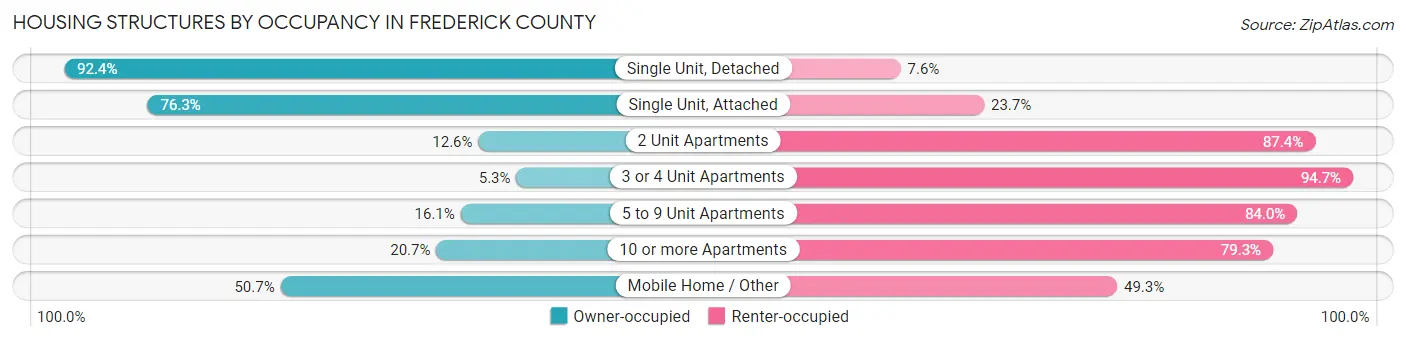
| Structure Type | Owner-occupied | Renter-occupied |
| Single Unit, Detached | 56,540 (92.4%) | 4,648 (7.6%) |
| Single Unit, Attached | 16,574 (76.3%) | 5,137 (23.7%) |
| 2 Unit Apartments | 144 (12.6%) | 996 (87.4%) |
| 3 or 4 Unit Apartments | 87 (5.3%) | 1,549 (94.7%) |
| 5 to 9 Unit Apartments | 474 (16.1%) | 2,479 (84.0%) |
| 10 or more Apartments | 2,208 (20.7%) | 8,442 (79.3%) |
| Mobile Home / Other | 311 (50.7%) | 302 (49.3%) |
| Total | 76,338 (76.4%) | 23,553 (23.6%) |
Housing Structures by Number of Rooms in Frederick County
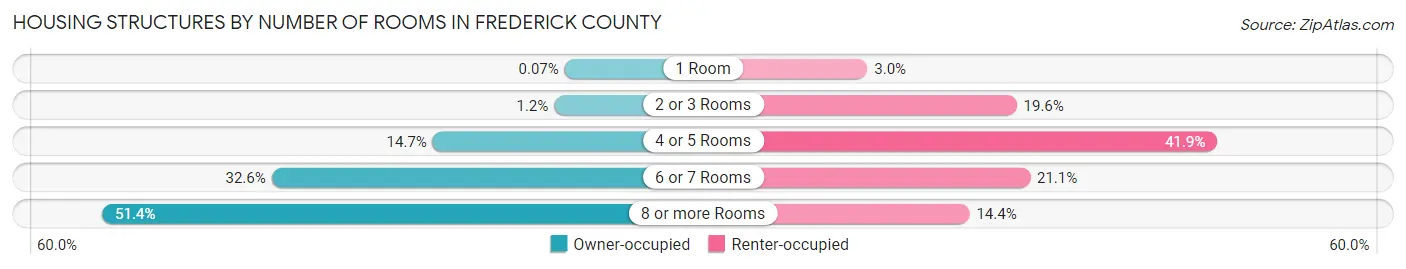
| Number of Rooms | Owner-occupied | Renter-occupied |
| 1 Room | 52 (0.1%) | 716 (3.0%) |
| 2 or 3 Rooms | 938 (1.2%) | 4,619 (19.6%) |
| 4 or 5 Rooms | 11,230 (14.7%) | 9,862 (41.9%) |
| 6 or 7 Rooms | 24,881 (32.6%) | 4,970 (21.1%) |
| 8 or more Rooms | 39,237 (51.4%) | 3,386 (14.4%) |
| Total | 76,338 (100.0%) | 23,553 (100.0%) |
Housing Structure by Heating Type in Frederick County
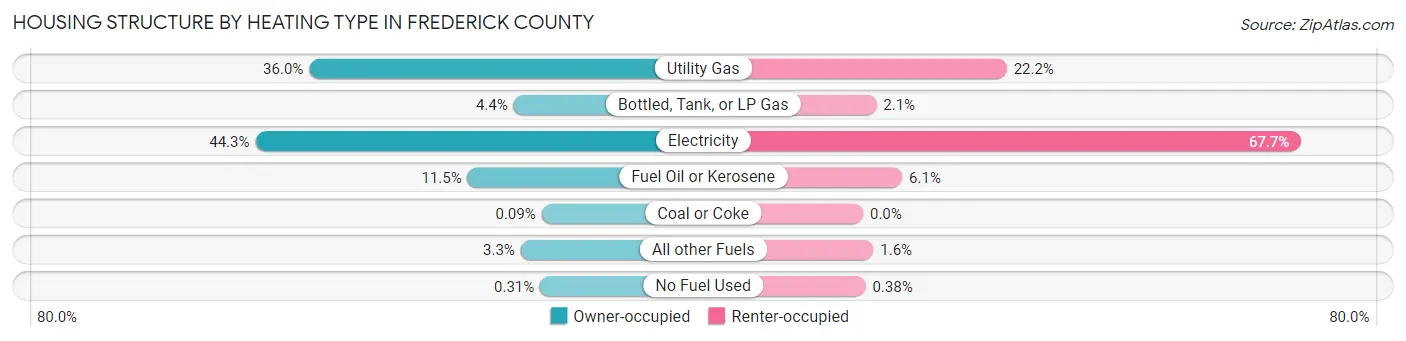
| Heating Type | Owner-occupied | Renter-occupied |
| Utility Gas | 27,489 (36.0%) | 5,231 (22.2%) |
| Bottled, Tank, or LP Gas | 3,363 (4.4%) | 485 (2.1%) |
| Electricity | 33,846 (44.3%) | 15,949 (67.7%) |
| Fuel Oil or Kerosene | 8,804 (11.5%) | 1,425 (6.0%) |
| Coal or Coke | 70 (0.1%) | 0 (0.0%) |
| All other Fuels | 2,526 (3.3%) | 374 (1.6%) |
| No Fuel Used | 240 (0.3%) | 89 (0.4%) |
| Total | 76,338 (100.0%) | 23,553 (100.0%) |
Household Vehicle Usage in Frederick County
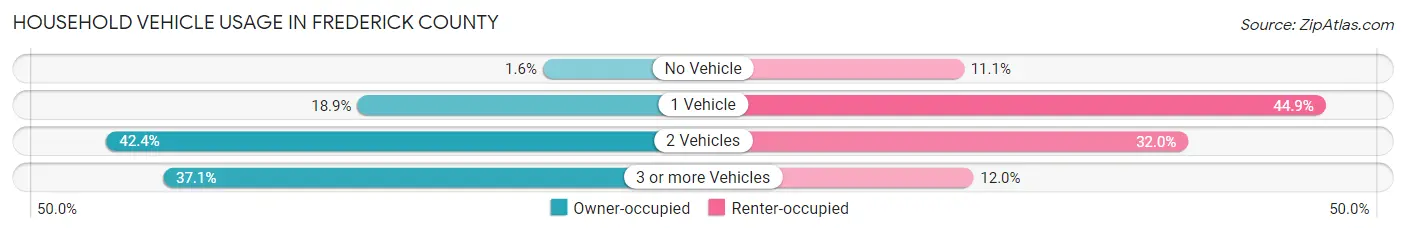
| Vehicles per Household | Owner-occupied | Renter-occupied |
| No Vehicle | 1,248 (1.6%) | 2,613 (11.1%) |
| 1 Vehicle | 14,460 (18.9%) | 10,569 (44.9%) |
| 2 Vehicles | 32,335 (42.4%) | 7,547 (32.0%) |
| 3 or more Vehicles | 28,295 (37.1%) | 2,824 (12.0%) |
| Total | 76,338 (100.0%) | 23,553 (100.0%) |
Real Estate & Mortgages in Frederick County
Real Estate and Mortgage Overview in Frederick County
| Characteristic | Without Mortgage | With Mortgage |
| Housing Units | 18,019 | 58,319 |
| Median Property Value | $385,900 | $420,600 |
| Median Household Income | $95,793 | $27,539 |
| Monthly Housing Costs | $662 | $14,526 |
| Real Estate Taxes | $3,911 | $1,101 |
Property Value by Mortgage Status in Frederick County
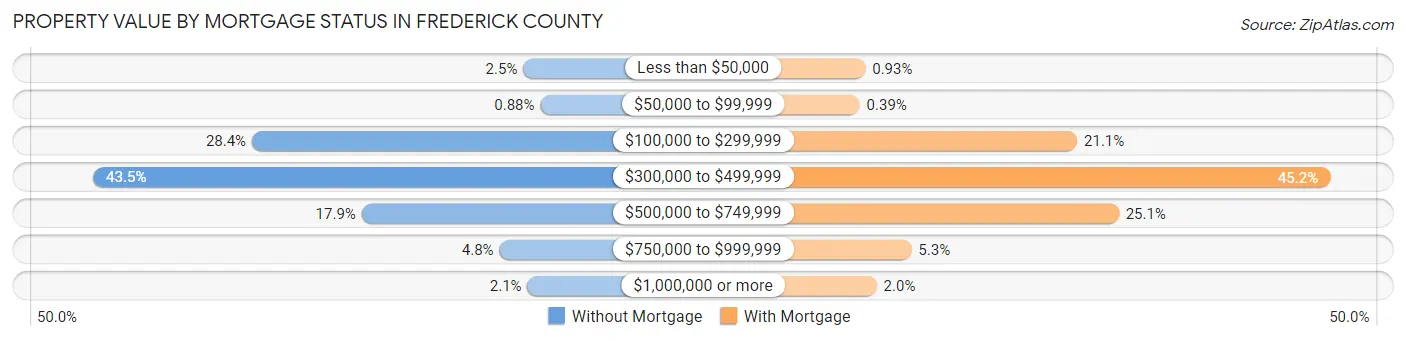
| Property Value | Without Mortgage | With Mortgage |
| Less than $50,000 | 452 (2.5%) | 545 (0.9%) |
| $50,000 to $99,999 | 158 (0.9%) | 225 (0.4%) |
| $100,000 to $299,999 | 5,108 (28.3%) | 12,304 (21.1%) |
| $300,000 to $499,999 | 7,833 (43.5%) | 26,348 (45.2%) |
| $500,000 to $749,999 | 3,226 (17.9%) | 14,617 (25.1%) |
| $750,000 to $999,999 | 861 (4.8%) | 3,105 (5.3%) |
| $1,000,000 or more | 381 (2.1%) | 1,175 (2.0%) |
| Total | 18,019 (100.0%) | 58,319 (100.0%) |
Household Income by Mortgage Status in Frederick County
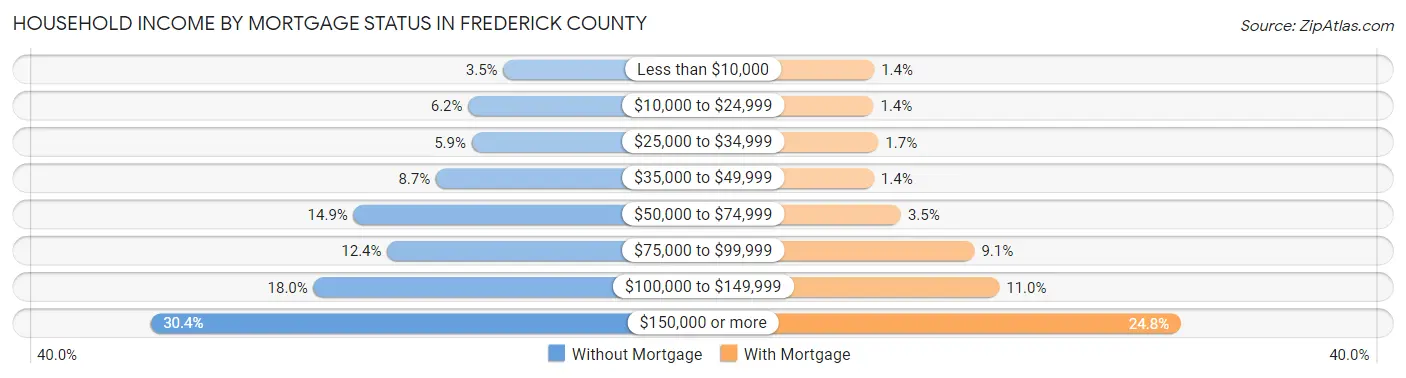
| Household Income | Without Mortgage | With Mortgage |
| Less than $10,000 | 634 (3.5%) | 826 (1.4%) |
| $10,000 to $24,999 | 1,116 (6.2%) | 800 (1.4%) |
| $25,000 to $34,999 | 1,068 (5.9%) | 1,017 (1.7%) |
| $35,000 to $49,999 | 1,559 (8.6%) | 814 (1.4%) |
| $50,000 to $74,999 | 2,691 (14.9%) | 2,016 (3.5%) |
| $75,000 to $99,999 | 2,228 (12.4%) | 5,284 (9.1%) |
| $100,000 to $149,999 | 3,239 (18.0%) | 6,387 (11.0%) |
| $150,000 or more | 5,484 (30.4%) | 14,462 (24.8%) |
| Total | 18,019 (100.0%) | 58,319 (100.0%) |
Property Value to Household Income Ratio in Frederick County
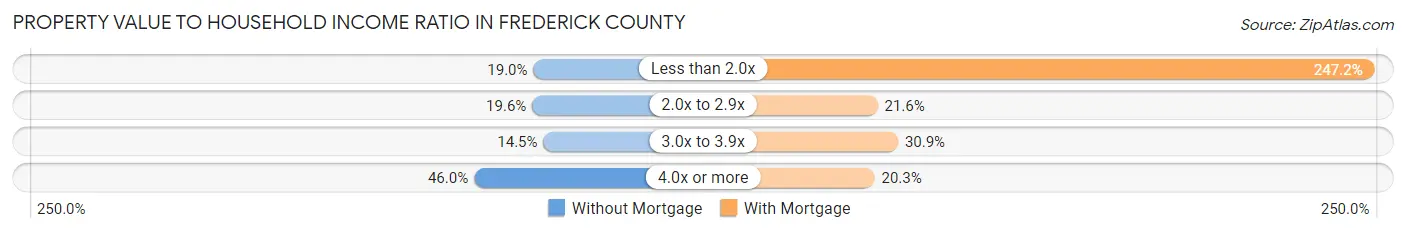
| Value-to-Income Ratio | Without Mortgage | With Mortgage |
| Less than 2.0x | 3,424 (19.0%) | 144,187 (247.2%) |
| 2.0x to 2.9x | 3,524 (19.6%) | 12,616 (21.6%) |
| 3.0x to 3.9x | 2,605 (14.5%) | 18,006 (30.9%) |
| 4.0x or more | 8,284 (46.0%) | 11,830 (20.3%) |
| Total | 18,019 (100.0%) | 58,319 (100.0%) |
Real Estate Taxes by Mortgage Status in Frederick County
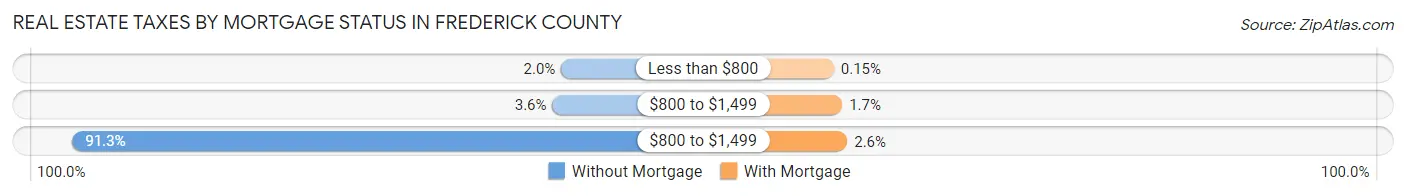
| Property Taxes | Without Mortgage | With Mortgage |
| Less than $800 | 358 (2.0%) | 88 (0.2%) |
| $800 to $1,499 | 649 (3.6%) | 972 (1.7%) |
| $800 to $1,499 | 16,447 (91.3%) | 1,515 (2.6%) |
| Total | 18,019 (100.0%) | 58,319 (100.0%) |
Health & Disability in Frederick County
Health Insurance Coverage by Age in Frederick County
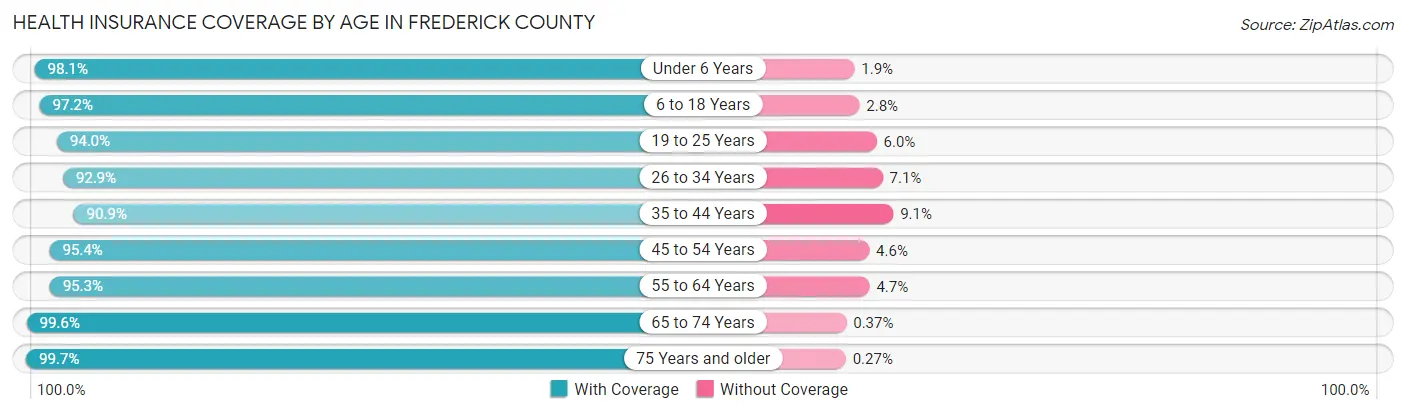
| Age Bracket | With Coverage | Without Coverage |
| Under 6 Years | 19,094 (98.1%) | 363 (1.9%) |
| 6 to 18 Years | 46,063 (97.2%) | 1,331 (2.8%) |
| 19 to 25 Years | 21,230 (94.0%) | 1,360 (6.0%) |
| 26 to 34 Years | 28,680 (92.9%) | 2,205 (7.1%) |
| 35 to 44 Years | 34,113 (90.9%) | 3,429 (9.1%) |
| 45 to 54 Years | 35,268 (95.4%) | 1,715 (4.6%) |
| 55 to 64 Years | 34,836 (95.3%) | 1,716 (4.7%) |
| 65 to 74 Years | 23,919 (99.6%) | 89 (0.4%) |
| 75 Years and older | 15,643 (99.7%) | 42 (0.3%) |
| Total | 258,846 (95.5%) | 12,250 (4.5%) |
Health Insurance Coverage by Citizenship Status in Frederick County
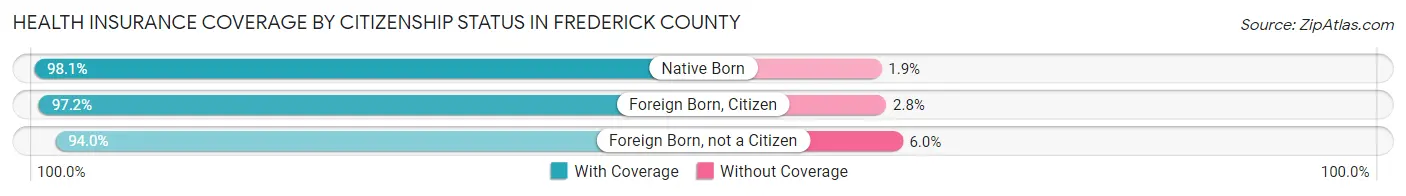
| Citizenship Status | With Coverage | Without Coverage |
| Native Born | 19,094 (98.1%) | 363 (1.9%) |
| Foreign Born, Citizen | 46,063 (97.2%) | 1,331 (2.8%) |
| Foreign Born, not a Citizen | 21,230 (94.0%) | 1,360 (6.0%) |
Health Insurance Coverage by Household Income in Frederick County
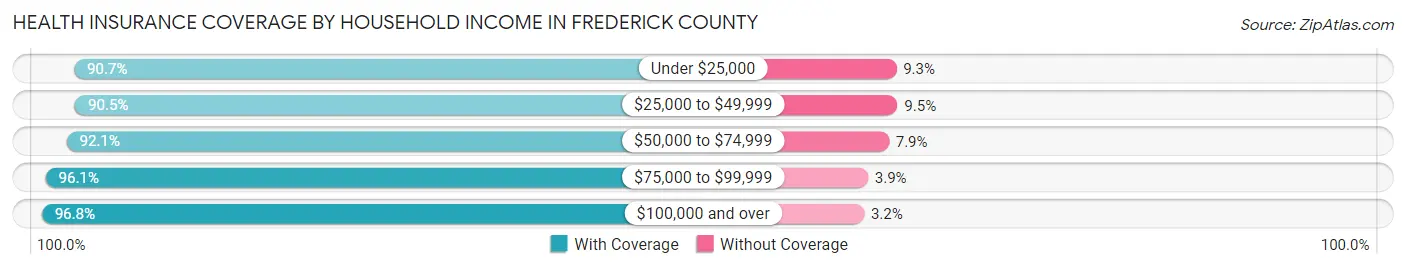
| Household Income | With Coverage | Without Coverage |
| Under $25,000 | 11,932 (90.7%) | 1,217 (9.3%) |
| $25,000 to $49,999 | 17,617 (90.5%) | 1,845 (9.5%) |
| $50,000 to $74,999 | 25,369 (92.1%) | 2,168 (7.9%) |
| $75,000 to $99,999 | 27,161 (96.1%) | 1,115 (3.9%) |
| $100,000 and over | 174,134 (96.8%) | 5,798 (3.2%) |
Public vs Private Health Insurance Coverage by Age in Frederick County
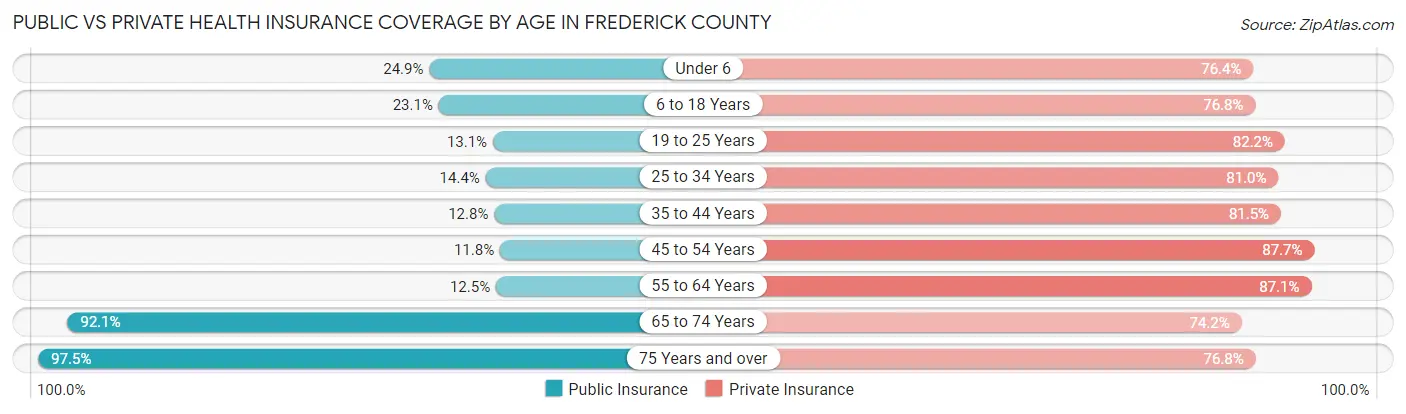
| Age Bracket | Public Insurance | Private Insurance |
| Under 6 | 4,841 (24.9%) | 14,860 (76.4%) |
| 6 to 18 Years | 10,963 (23.1%) | 36,376 (76.7%) |
| 19 to 25 Years | 2,952 (13.1%) | 18,575 (82.2%) |
| 25 to 34 Years | 4,453 (14.4%) | 25,026 (81.0%) |
| 35 to 44 Years | 4,818 (12.8%) | 30,601 (81.5%) |
| 45 to 54 Years | 4,349 (11.8%) | 32,439 (87.7%) |
| 55 to 64 Years | 4,569 (12.5%) | 31,851 (87.1%) |
| 65 to 74 Years | 22,103 (92.1%) | 17,813 (74.2%) |
| 75 Years and over | 15,292 (97.5%) | 12,046 (76.8%) |
| Total | 74,340 (27.4%) | 219,587 (81.0%) |
Disability Status by Sex by Age in Frederick County
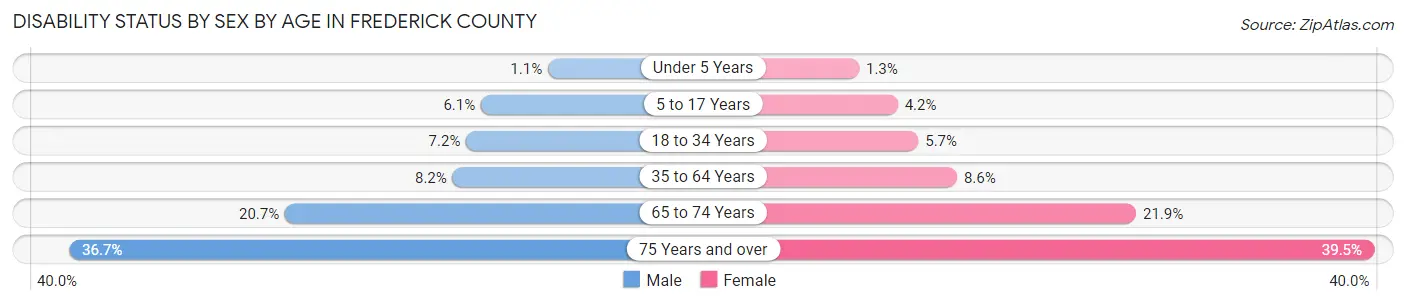
| Age Bracket | Male | Female |
| Under 5 Years | 92 (1.1%) | 101 (1.3%) |
| 5 to 17 Years | 1,470 (6.1%) | 960 (4.2%) |
| 18 to 34 Years | 2,070 (7.2%) | 1,620 (5.7%) |
| 35 to 64 Years | 4,557 (8.2%) | 4,753 (8.6%) |
| 65 to 74 Years | 2,380 (20.7%) | 2,729 (21.8%) |
| 75 Years and over | 2,330 (36.7%) | 3,688 (39.5%) |
Disability Class by Sex by Age in Frederick County
Disability Class: Hearing Difficulty
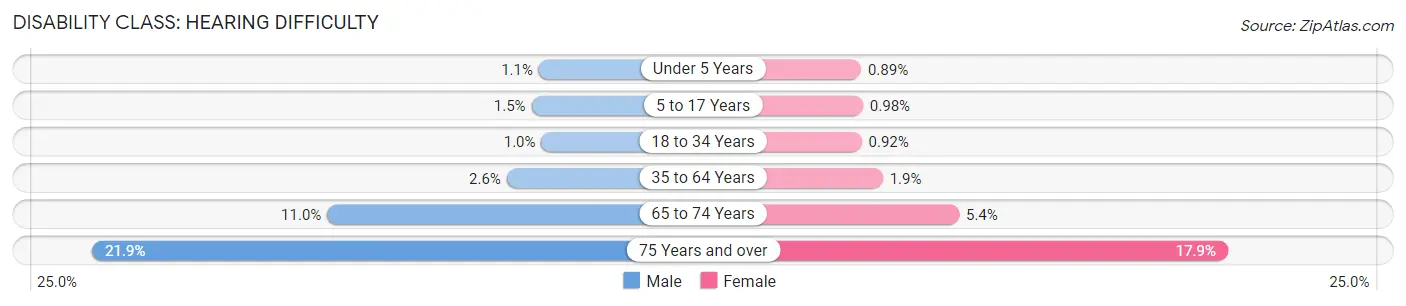
| Age Bracket | Male | Female |
| Under 5 Years | 92 (1.1%) | 70 (0.9%) |
| 5 to 17 Years | 357 (1.5%) | 226 (1.0%) |
| 18 to 34 Years | 292 (1.0%) | 263 (0.9%) |
| 35 to 64 Years | 1,456 (2.6%) | 1,055 (1.9%) |
| 65 to 74 Years | 1,263 (11.0%) | 679 (5.4%) |
| 75 Years and over | 1,388 (21.9%) | 1,672 (17.9%) |
Disability Class: Vision Difficulty
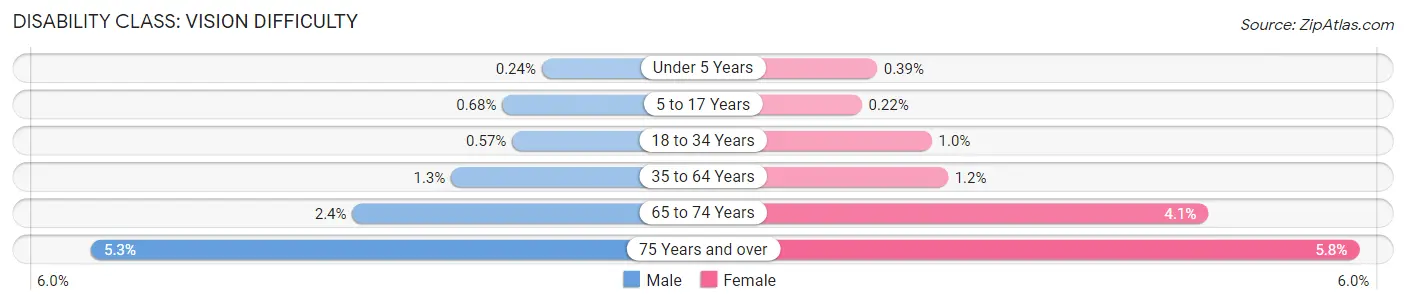
| Age Bracket | Male | Female |
| Under 5 Years | 19 (0.2%) | 31 (0.4%) |
| 5 to 17 Years | 164 (0.7%) | 50 (0.2%) |
| 18 to 34 Years | 163 (0.6%) | 285 (1.0%) |
| 35 to 64 Years | 695 (1.3%) | 658 (1.2%) |
| 65 to 74 Years | 271 (2.4%) | 510 (4.1%) |
| 75 Years and over | 334 (5.3%) | 538 (5.8%) |
Disability Class: Cognitive Difficulty
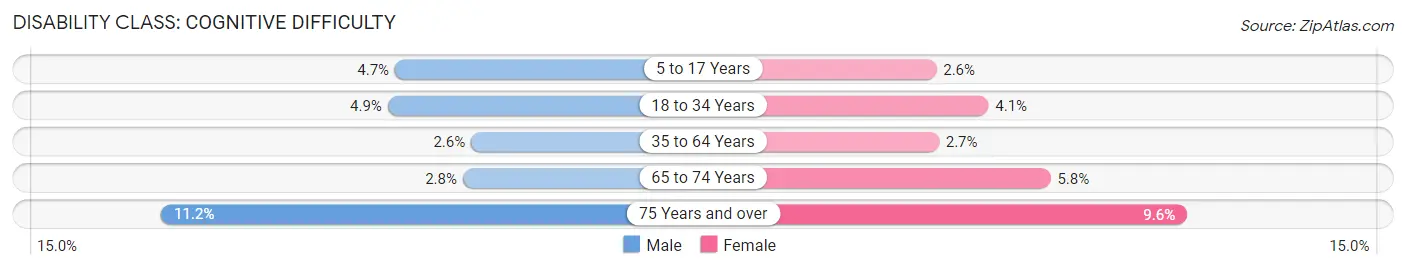
| Age Bracket | Male | Female |
| 5 to 17 Years | 1,128 (4.7%) | 608 (2.6%) |
| 18 to 34 Years | 1,404 (4.9%) | 1,162 (4.1%) |
| 35 to 64 Years | 1,424 (2.6%) | 1,500 (2.7%) |
| 65 to 74 Years | 322 (2.8%) | 726 (5.8%) |
| 75 Years and over | 711 (11.2%) | 897 (9.6%) |
Disability Class: Ambulatory Difficulty
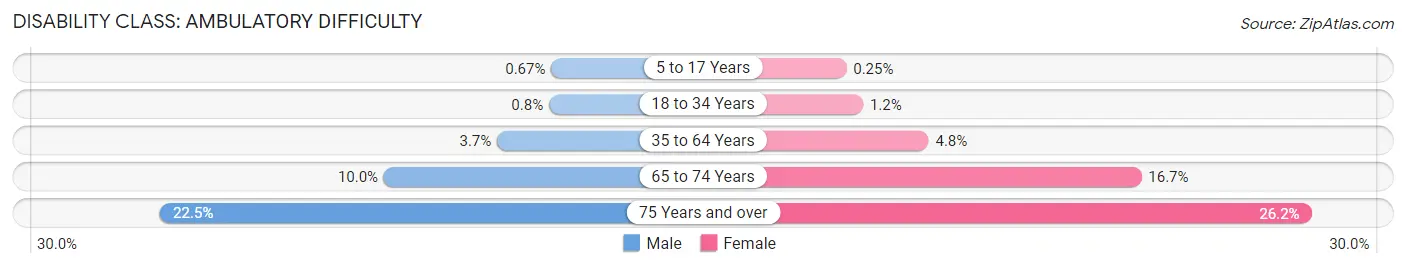
| Age Bracket | Male | Female |
| 5 to 17 Years | 161 (0.7%) | 57 (0.3%) |
| 18 to 34 Years | 230 (0.8%) | 335 (1.2%) |
| 35 to 64 Years | 2,047 (3.7%) | 2,684 (4.8%) |
| 65 to 74 Years | 1,151 (10.0%) | 2,083 (16.7%) |
| 75 Years and over | 1,426 (22.5%) | 2,442 (26.2%) |
Disability Class: Self-Care Difficulty
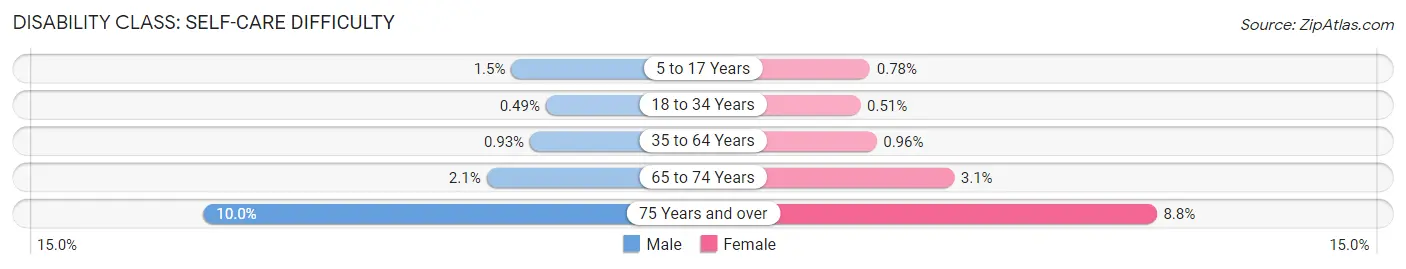
| Age Bracket | Male | Female |
| 5 to 17 Years | 350 (1.5%) | 181 (0.8%) |
| 18 to 34 Years | 142 (0.5%) | 145 (0.5%) |
| 35 to 64 Years | 514 (0.9%) | 532 (1.0%) |
| 65 to 74 Years | 246 (2.1%) | 390 (3.1%) |
| 75 Years and over | 636 (10.0%) | 818 (8.8%) |
Technology Access in Frederick County
Computing Device Access in Frederick County
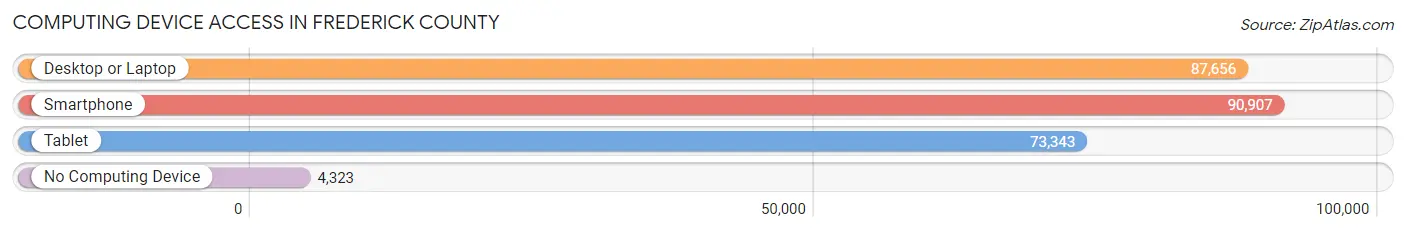
| Device Type | # Households | % Households |
| Desktop or Laptop | 87,656 | 87.7% |
| Smartphone | 90,907 | 91.0% |
| Tablet | 73,343 | 73.4% |
| No Computing Device | 4,323 | 4.3% |
| Total | 99,891 | 100.0% |
Internet Access in Frederick County
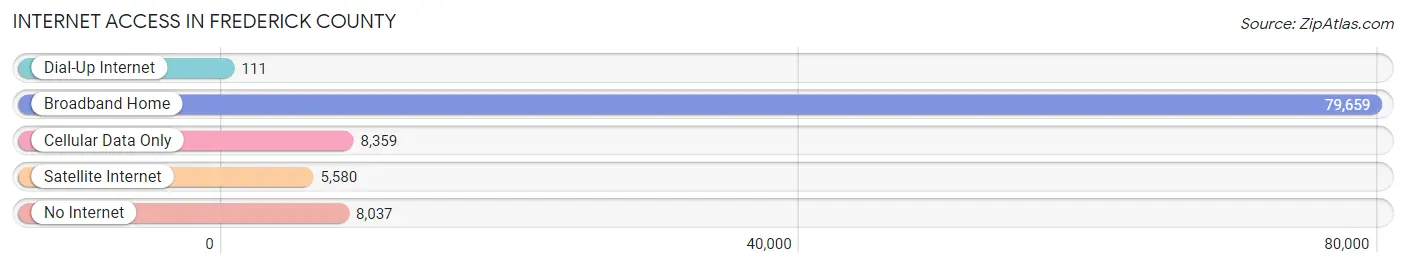
| Internet Type | # Households | % Households |
| Dial-Up Internet | 111 | 0.1% |
| Broadband Home | 79,659 | 79.7% |
| Cellular Data Only | 8,359 | 8.4% |
| Satellite Internet | 5,580 | 5.6% |
| No Internet | 8,037 | 8.1% |
| Total | 99,891 | 100.0% |
Frederick County Summary
Frederick County, Maryland is located in the northern part of the state, and is part of the Washington-Arlington-Alexandria metropolitan area. It is bordered by Washington County to the north, Carroll County to the west, Montgomery County to the south, and Howard County to the east. The county seat is Frederick, and the county is home to a population of approximately 250,000 people.
Geography
Frederick County is located in the northern part of Maryland, and is part of the Washington-Arlington-Alexandria metropolitan area. It is bordered by Washington County to the north, Carroll County to the west, Montgomery County to the south, and Howard County to the east. The county is located in the Appalachian Mountains, and is home to a variety of terrain, including rolling hills, valleys, and mountains. The highest point in the county is Catoctin Mountain, which has an elevation of 1,890 feet. The county is also home to several rivers, including the Monocacy River, the Potomac River, and the Shenandoah River.
History
Frederick County was established in 1748, and was named after Frederick Calvert, the sixth Lord Baltimore. The county was originally part of Prince George's County, and was later divided into Frederick and Montgomery Counties. During the American Revolution, the county was the site of several battles, including the Battle of Monocacy and the Battle of South Mountain.
In the 19th century, the county was home to a variety of industries, including iron and steel production, textiles, and agriculture. The county was also home to a number of prominent figures, including Francis Scott Key, who wrote the lyrics to the Star-Spangled Banner, and John Brown, who led a raid on Harpers Ferry in 1859.
Economy
Frederick County is home to a variety of industries, including manufacturing, technology, healthcare, and education. The county is home to several major employers, including Fort Detrick, the National Institutes of Health, and the U.S. Army Medical Research Institute of Infectious Diseases. The county is also home to a number of smaller businesses, including wineries, breweries, and distilleries.
The county is home to a number of shopping centers, including the Francis Scott Key Mall, the Westview Promenade, and the Frederick Towne Mall. The county is also home to a variety of restaurants, including local favorites such as the Flying Dog Brewery and the Brewer's Alley.
Demographics
As of the 2010 census, Frederick County had a population of 250,000 people. The population is predominantly white (83.3%), with African Americans making up 8.3% of the population, Hispanics making up 6.2%, and Asians making up 2.2%. The median household income in the county is $76,000, and the median home value is $310,000.
The county is home to a variety of religious denominations, including Christianity, Judaism, and Islam. The county is also home to a number of higher education institutions, including Hood College, Frederick Community College, and Mount St. Mary's University.
Conclusion
Frederick County, Maryland is a vibrant and diverse county located in the northern part of the state. The county is home to a variety of industries, including manufacturing, technology, healthcare, and education. The county is also home to a variety of religious denominations, and is home to a number of higher education institutions. The county is home to a population of approximately 250,000 people, and has a median household income of $76,000.
Common Questions
What is Per Capita Income in Frederick County?
Per Capita income in Frederick County is $51,169.
What is the Median Family Income in Frederick County?
Median Family Income in Frederick County is $135,543.
What is the Median Household income in Frederick County?
Median Household Income in Frederick County is $115,724.
What is Income or Wage Gap in Frederick County?
Income or Wage Gap in Frederick County is 33.7%.
Women in Frederick County earn 66.3 cents for every dollar earned by a man.
What is Family Income Deficit in Frederick County?
Family Income Deficit in Frederick County is $12,760.
Families that are below poverty line in Frederick County earn $12,760 less on average than the poverty threshold level.
What is Inequality or Gini Index in Frederick County?
Inequality or Gini Index in Frederick County is 0.40.
What is the Total Population of Frederick County?
Total Population of Frederick County is 273,829.
What is the Total Male Population of Frederick County?
Total Male Population of Frederick County is 135,810.
What is the Total Female Population of Frederick County?
Total Female Population of Frederick County is 138,019.
What is the Ratio of Males per 100 Females in Frederick County?
There are 98.40 Males per 100 Females in Frederick County.
What is the Ratio of Females per 100 Males in Frederick County?
There are 101.63 Females per 100 Males in Frederick County.
What is the Median Population Age in Frederick County?
Median Population Age in Frederick County is 38.9 Years.
What is the Average Family Size in Frederick County
Average Family Size in Frederick County is 3.2 People.
What is the Average Household Size in Frederick County
Average Household Size in Frederick County is 2.7 People.
How Large is the Labor Force in Frederick County?
There are 151,243 People in the Labor Forcein in Frederick County.
What is the Percentage of People in the Labor Force in Frederick County?
69.5% of People are in the Labor Force in Frederick County.
What is the Unemployment Rate in Frederick County?
Unemployment Rate in Frederick County is 3.7%.