Area Code 667 Map & Demographics
Area Code 667 Map
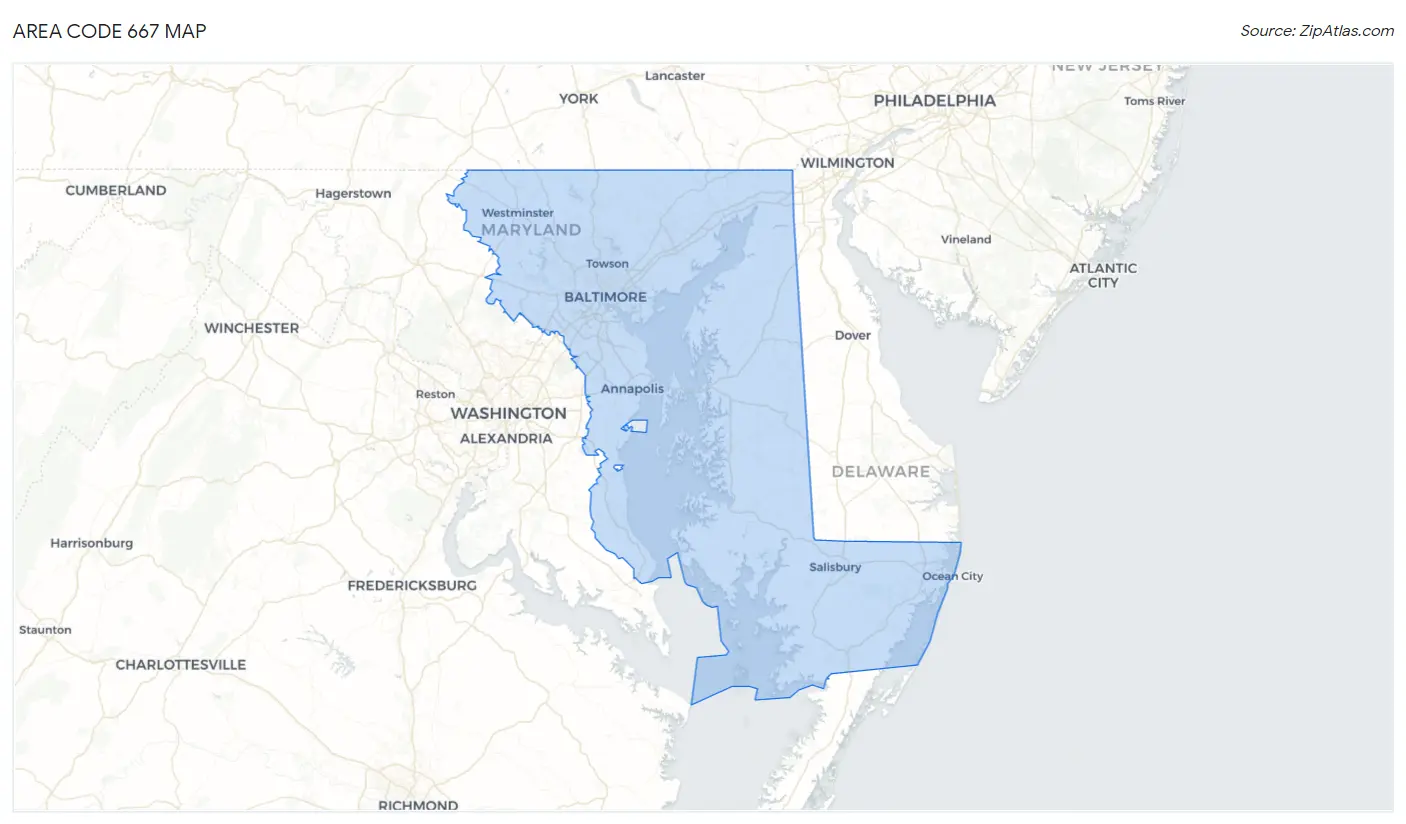
Area Code 667 Overview
$47,679
PER CAPITA INCOME
$106,528
AVG FAMILY INCOME
$82,221
AVG HOUSEHOLD INCOME
24.7%
WAGE / INCOME GAP [ % ]
75.3¢/ $1
WAGE / INCOME GAP [ $ ]
$12,209
FAMILY INCOME DEFICIT
7.85
INEQUALITY / GINI INDEX
415,301
TOTAL POPULATION
198,913
MALE POPULATION
216,388
FEMALE POPULATION
91.92
MALES / 100 FEMALES
108.79
FEMALES / 100 MALES
38.8
MEDIAN AGE
3.1
AVG FAMILY SIZE
2.3
AVG HOUSEHOLD SIZE
214,405
LABOR FORCE [ PEOPLE ]
63.2%
PERCENT IN LABOR FORCE
5.5%
UNEMPLOYMENT RATE
Nearby Area Codes
Income in Area Code 667
Income Overview in Area Code 667
Per Capita Income in Area Code 667 is $47,679, while median incomes of families and households are $106,528 and $82,221 respectively.
| Characteristic | Number | Measure |
| Per Capita Income | 415,301 | $47,679 |
| Median Family Income | 92,267 | $106,528 |
| Mean Family Income | 92,267 | $2,325,970 |
| Median Household Income | 173,733 | $82,221 |
| Mean Household Income | 173,733 | $1,866,636 |
| Income Deficit | 92,267 | $12,209 |
| Wage / Income Gap (%) | 415,301 | 24.75% |
| Wage / Income Gap ($) | 415,301 | 75.25¢ per $1 |
| Gini / Inequality Index | 415,301 | 7.85 |
Earnings by Sex in Area Code 667
Average Earnings in Area Code 667 are $51,323, $63,217 for men and $44,165 for women, a difference of 30.1%.
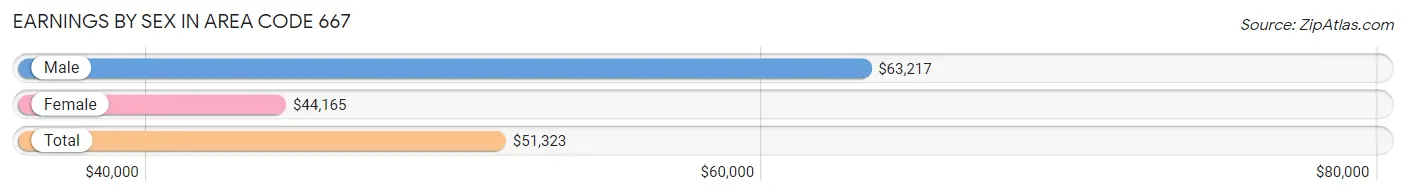
| Sex | Number | Average Earnings |
| Male | 114,642 (50.0%) | $63,217 |
| Female | 114,806 (50.0%) | $44,165 |
| Total | 229,448 (100.0%) | $51,323 |
Earnings by Sex by Income Bracket in Area Code 667
The most common earnings brackets in Area Code 667 are $100,000+ for men (28,084 | 24.5%) and $100,000+ for women (16,280 | 14.2%).
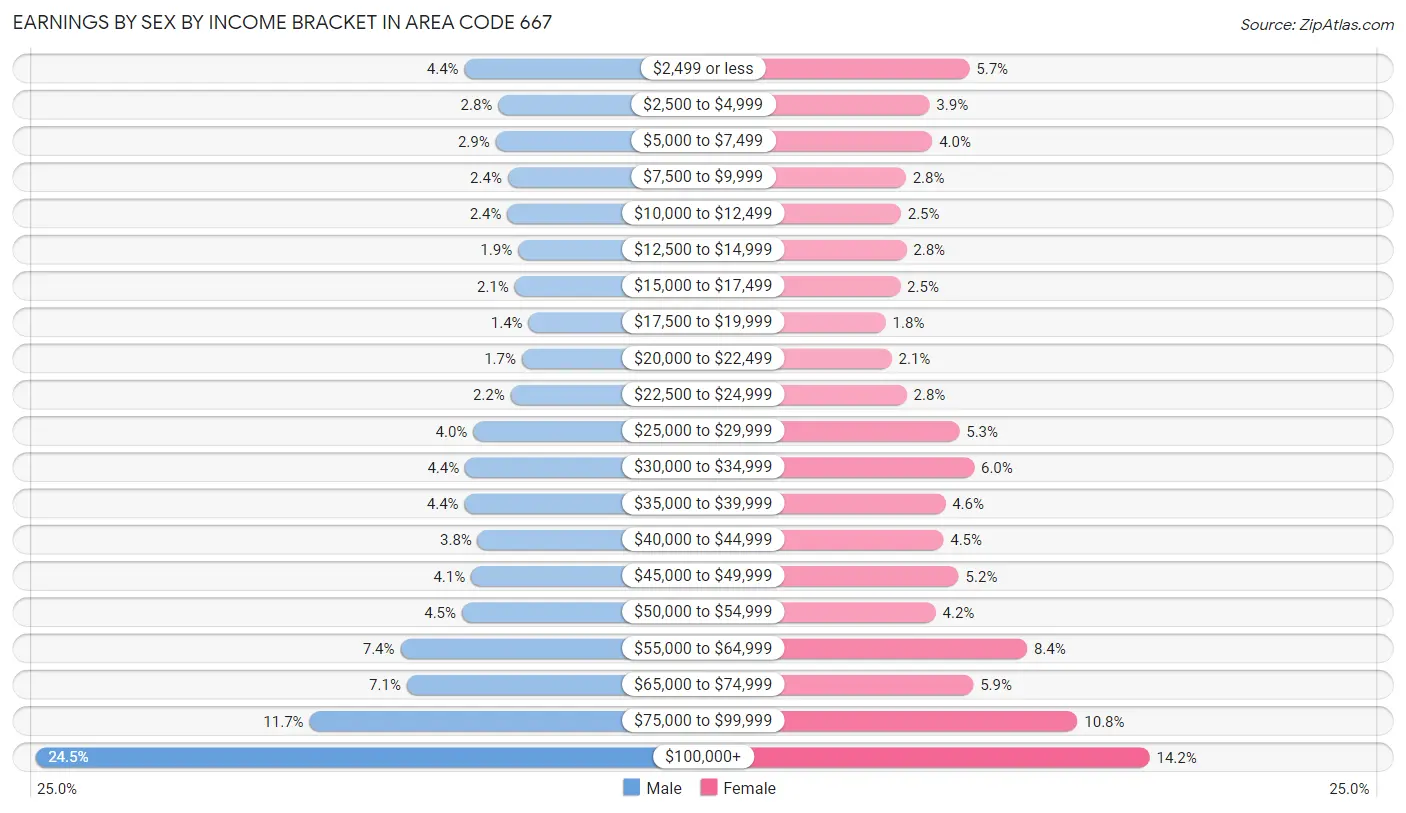
| Income | Male | Female |
| $2,499 or less | 5,041 (4.4%) | 6,594 (5.7%) |
| $2,500 to $4,999 | 3,230 (2.8%) | 4,439 (3.9%) |
| $5,000 to $7,499 | 3,365 (2.9%) | 4,596 (4.0%) |
| $7,500 to $9,999 | 2,714 (2.4%) | 3,163 (2.8%) |
| $10,000 to $12,499 | 2,744 (2.4%) | 2,910 (2.5%) |
| $12,500 to $14,999 | 2,166 (1.9%) | 3,200 (2.8%) |
| $15,000 to $17,499 | 2,352 (2.1%) | 2,867 (2.5%) |
| $17,500 to $19,999 | 1,602 (1.4%) | 2,094 (1.8%) |
| $20,000 to $22,499 | 1,959 (1.7%) | 2,411 (2.1%) |
| $22,500 to $24,999 | 2,564 (2.2%) | 3,211 (2.8%) |
| $25,000 to $29,999 | 4,574 (4.0%) | 6,049 (5.3%) |
| $30,000 to $34,999 | 5,008 (4.4%) | 6,839 (6.0%) |
| $35,000 to $39,999 | 5,043 (4.4%) | 5,291 (4.6%) |
| $40,000 to $44,999 | 4,328 (3.8%) | 5,186 (4.5%) |
| $45,000 to $49,999 | 4,694 (4.1%) | 6,011 (5.2%) |
| $50,000 to $54,999 | 5,180 (4.5%) | 4,775 (4.2%) |
| $55,000 to $64,999 | 8,488 (7.4%) | 9,688 (8.4%) |
| $65,000 to $74,999 | 8,140 (7.1%) | 6,798 (5.9%) |
| $75,000 to $99,999 | 13,366 (11.7%) | 12,404 (10.8%) |
| $100,000+ | 28,084 (24.5%) | 16,280 (14.2%) |
| Total | 114,642 (100.0%) | 114,806 (100.0%) |
Earnings by Sex by Educational Attainment in Area Code 667
Average earnings in Area Code 667 are $1,213,185 for men and $808,401 for women, a difference of 33.4%. Men with an educational attainment of graduate degree enjoy the highest average annual earnings of $1,606,013, while those with less than high school education earn the least with $421,399. Women with an educational attainment of graduate degree earn the most with the average annual earnings of $1,265,786, while those with less than high school education have the smallest earnings of $290,148.
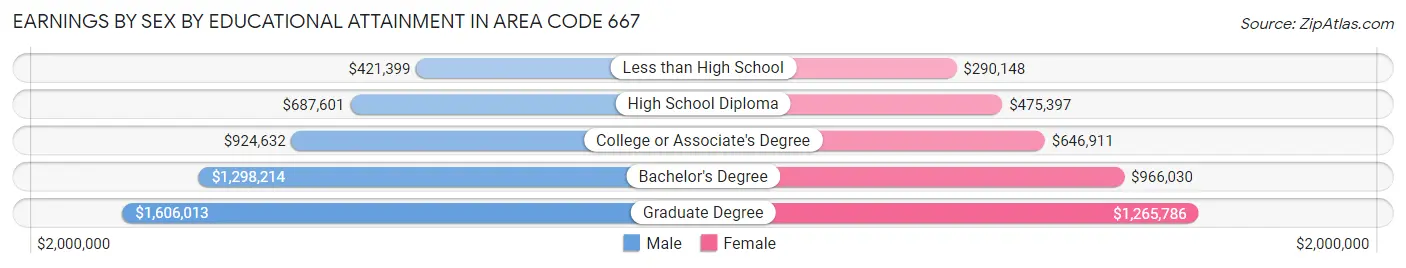
| Educational Attainment | Male Income | Female Income |
| Less than High School | $421,399 | $290,148 |
| High School Diploma | $687,601 | $475,397 |
| College or Associate's Degree | $924,632 | $646,911 |
| Bachelor's Degree | $1,298,214 | $966,030 |
| Graduate Degree | $1,606,013 | $1,265,786 |
| Total | $1,213,185 | $808,401 |
Family Income in Area Code 667
Family Income Brackets in Area Code 667
According to the Area Code 667 family income data, there are 338,159 families falling into the $100,000 to $149,999 income range, which is the most common income bracket and makes up 366.5% of all families. Conversely, the $10,000 to $14,999 income bracket is the least frequent group with only 30,909 families (33.5%) belonging to this category.
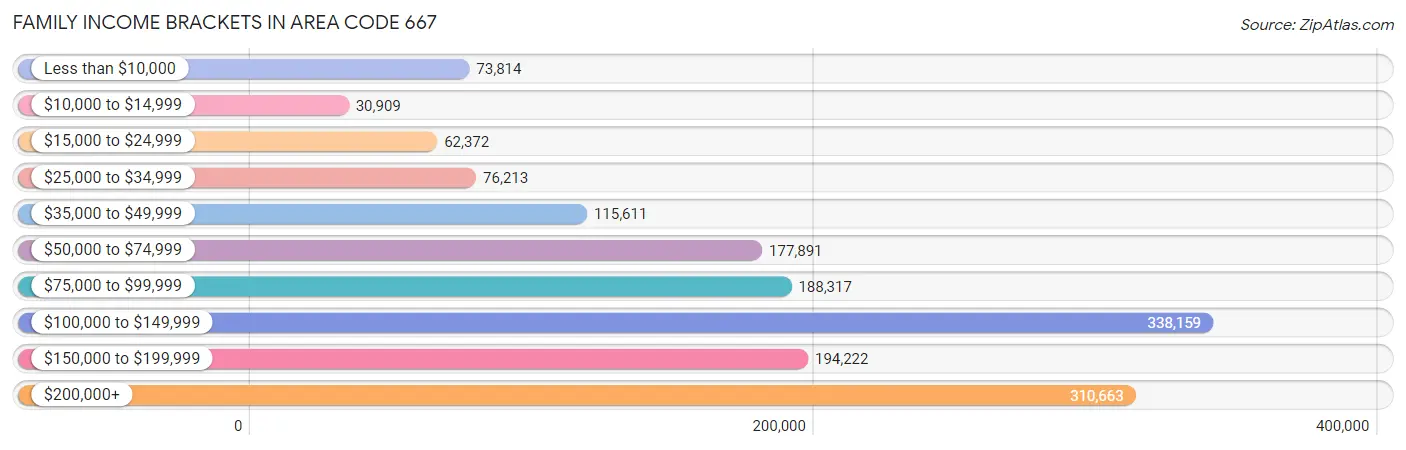
| Income Bracket | # Families | % Families |
| Less than $10,000 | 73,814 | 80.0% |
| $10,000 to $14,999 | 30,909 | 33.5% |
| $15,000 to $24,999 | 62,372 | 67.6% |
| $25,000 to $34,999 | 76,213 | 82.6% |
| $35,000 to $49,999 | 115,611 | 125.3% |
| $50,000 to $74,999 | 177,891 | 192.8% |
| $75,000 to $99,999 | 188,317 | 204.1% |
| $100,000 to $149,999 | 338,159 | 366.5% |
| $150,000 to $199,999 | 194,222 | 210.5% |
| $200,000+ | 310,663 | 336.7% |
Family Income by Famaliy Size in Area Code 667
6-person families (2,386 | 2.6%) account for the highest median family income in Area Code 667 with $150,947 per family, while 2-person families (45,232 | 49.0%) have the highest median income of $48,805 per family member.
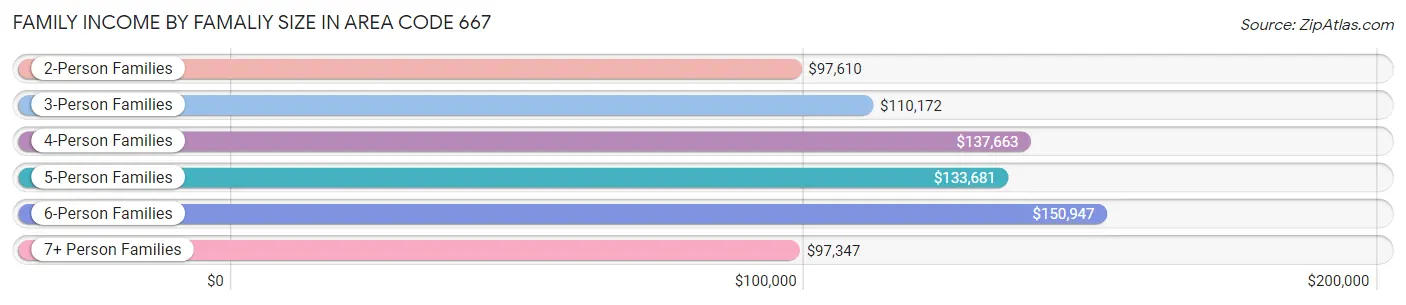
| Income Bracket | # Families | Median Income |
| 2-Person Families | 45,232 (49.0%) | $97,610 |
| 3-Person Families | 21,000 (22.8%) | $110,172 |
| 4-Person Families | 14,984 (16.2%) | $137,663 |
| 5-Person Families | 7,070 (7.7%) | $133,681 |
| 6-Person Families | 2,386 (2.6%) | $150,947 |
| 7+ Person Families | 1,595 (1.7%) | $97,347 |
| Total | 92,267 (100.0%) | $106,528 |
Family Income by Number of Earners in Area Code 667
The median family income in Area Code 667 is $106,528, with families comprising 3+ earners (9,579) having the highest median family income of $164,662, while families with no earners (11,580) have the lowest median family income of $58,474, accounting for 10.4% and 12.6% of families, respectively.
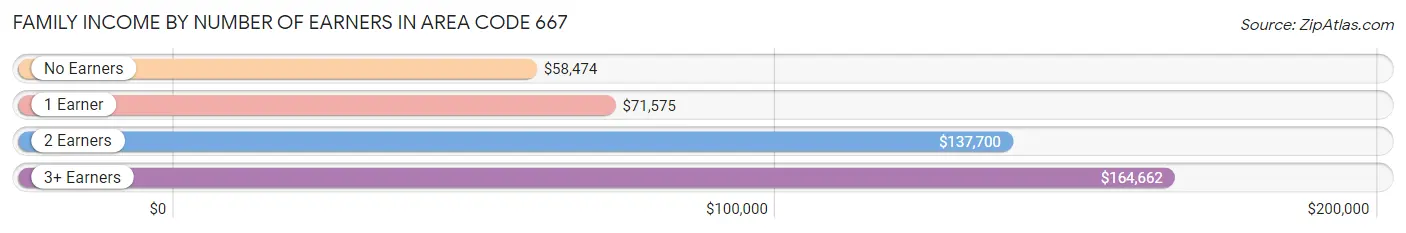
| Number of Earners | # Families | Median Income |
| No Earners | 11,580 (12.6%) | $58,474 |
| 1 Earner | 31,346 (34.0%) | $71,575 |
| 2 Earners | 39,762 (43.1%) | $137,700 |
| 3+ Earners | 9,579 (10.4%) | $164,662 |
| Total | 92,267 (100.0%) | $106,528 |
Household Income in Area Code 667
Household Income Brackets in Area Code 667
With 514,771 households falling in the category, the $100,000 to $149,999 income range is the most frequent in Area Code 667, accounting for 296.3% of all households. In contrast, only 118,312 households (68.1%) fall into the $10,000 to $14,999 income bracket, making it the least populous group.
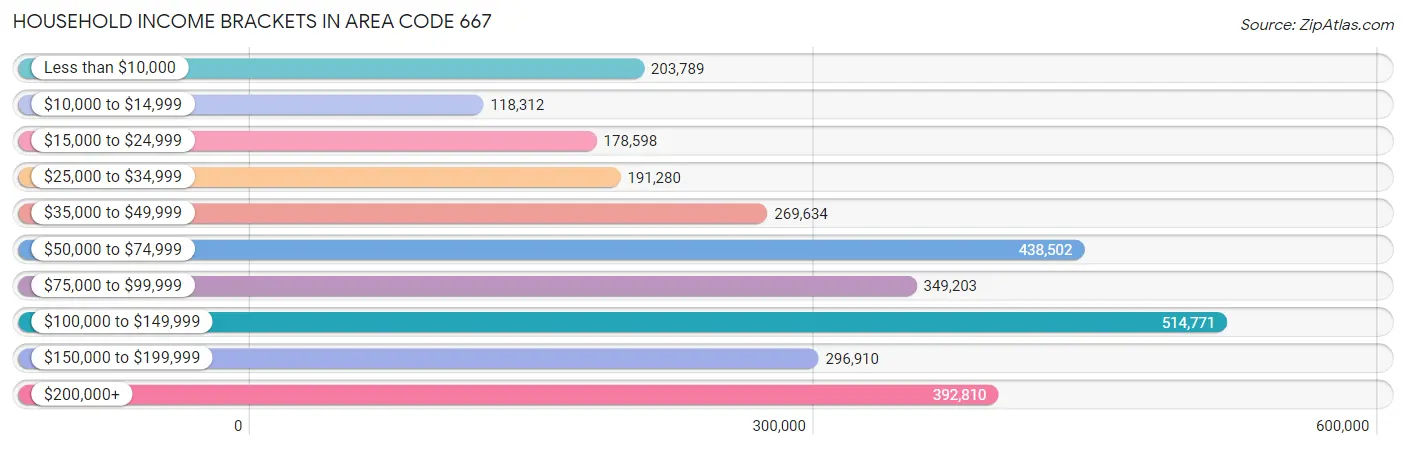
| Income Bracket | # Households | % Households |
| Less than $10,000 | 203,789 | 117.3% |
| $10,000 to $14,999 | 118,312 | 68.1% |
| $15,000 to $24,999 | 178,598 | 102.8% |
| $25,000 to $34,999 | 191,280 | 110.1% |
| $35,000 to $49,999 | 269,634 | 155.2% |
| $50,000 to $74,999 | 438,502 | 252.4% |
| $75,000 to $99,999 | 349,203 | 201.0% |
| $100,000 to $149,999 | 514,771 | 296.3% |
| $150,000 to $199,999 | 296,910 | 170.9% |
| $200,000+ | 392,810 | 226.1% |
Household Income by Householder Age in Area Code 667
The median household income in Area Code 667 is $82,221, with the highest median household income of $99,089 found in the 45 to 64 years age bracket for the primary householder. A total of 58,303 households (33.6%) fall into this category. Meanwhile, the 15 to 24 years age bracket for the primary householder has the lowest median household income of $38,892, with 8,677 households (5.0%) in this group.
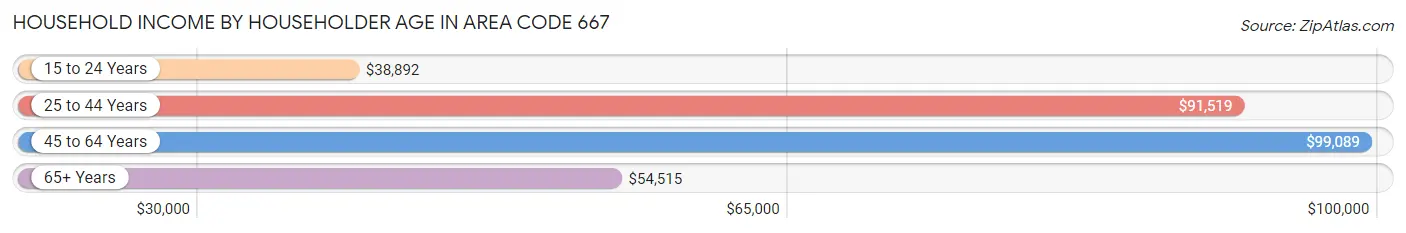
| Income Bracket | # Households | Median Income |
| 15 to 24 Years | 8,677 (5.0%) | $38,892 |
| 25 to 44 Years | 62,343 (35.9%) | $91,519 |
| 45 to 64 Years | 58,303 (33.6%) | $99,089 |
| 65+ Years | 44,410 (25.6%) | $54,514 |
| Total | 173,733 (100.0%) | $82,221 |
Poverty in Area Code 667
Income Below Poverty by Sex and Age in Area Code 667
With 13.6% poverty level for males and 16.2% for females among the residents of Area Code 667, 5 year old males and 18 to 24 year old females are the most vulnerable to poverty, with 668 males (28.0%) and 6,460 females (33.1%) in their respective age groups living below the poverty level.
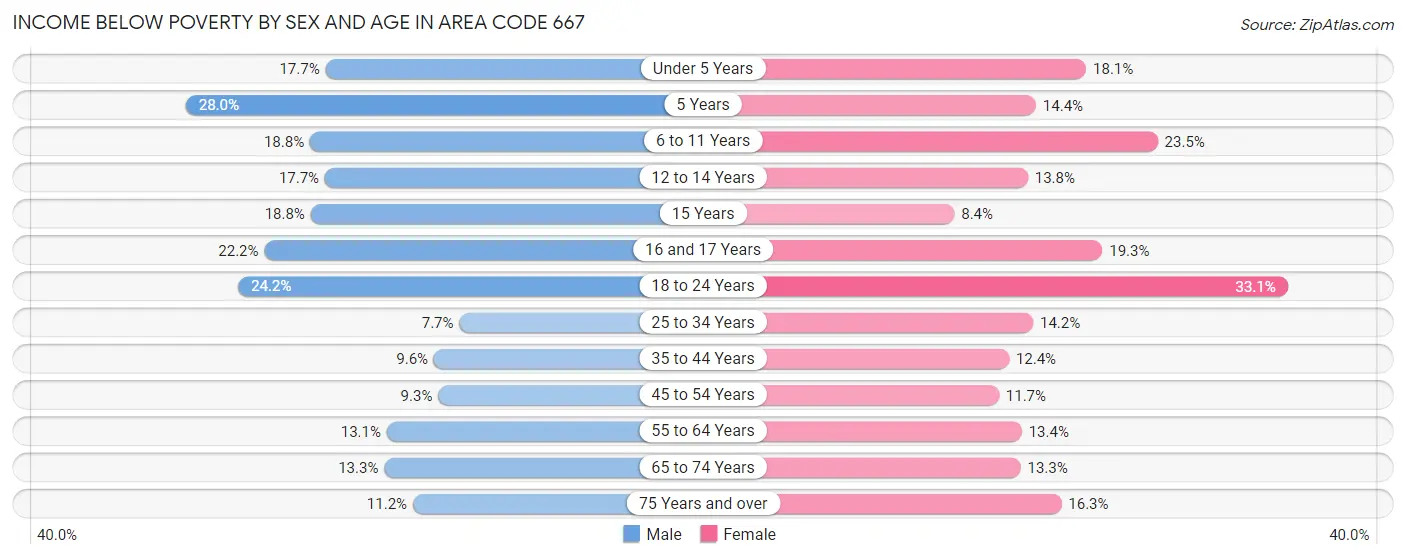
| Age Bracket | Male | Female |
| Under 5 Years | 2,085 (17.7%) | 2,006 (18.1%) |
| 5 Years | 668 (28.0%) | 267 (14.4%) |
| 6 to 11 Years | 2,841 (18.8%) | 3,071 (23.4%) |
| 12 to 14 Years | 1,321 (17.7%) | 967 (13.8%) |
| 15 Years | 398 (18.8%) | 220 (8.4%) |
| 16 and 17 Years | 971 (22.2%) | 935 (19.3%) |
| 18 to 24 Years | 4,225 (24.1%) | 6,460 (33.1%) |
| 25 to 34 Years | 2,582 (7.7%) | 4,949 (14.2%) |
| 35 to 44 Years | 2,292 (9.6%) | 3,263 (12.4%) |
| 45 to 54 Years | 2,170 (9.3%) | 2,823 (11.7%) |
| 55 to 64 Years | 3,078 (13.1%) | 3,650 (13.4%) |
| 65 to 74 Years | 2,218 (13.3%) | 2,805 (13.3%) |
| 75 Years and over | 1,069 (11.2%) | 2,788 (16.3%) |
| Total | 25,918 (13.6%) | 34,204 (16.2%) |
Income Above Poverty by Sex and Age in Area Code 667
According to the poverty statistics in Area Code 667, males aged 25 to 34 years and females aged 15 years are the age groups that are most secure financially, with 92.3% of males and 91.6% of females in these age groups living above the poverty line.
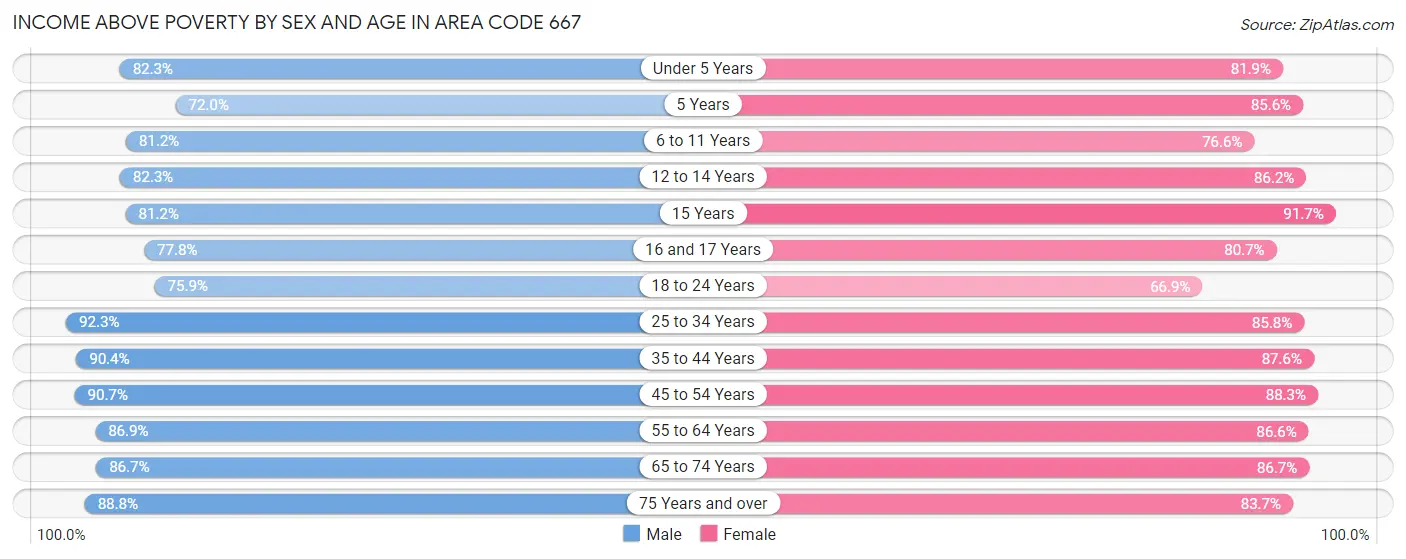
| Age Bracket | Male | Female |
| Under 5 Years | 9,723 (82.3%) | 9,055 (81.9%) |
| 5 Years | 1,715 (72.0%) | 1,586 (85.6%) |
| 6 to 11 Years | 12,260 (81.2%) | 10,025 (76.5%) |
| 12 to 14 Years | 6,144 (82.3%) | 6,035 (86.2%) |
| 15 Years | 1,724 (81.2%) | 2,416 (91.6%) |
| 16 and 17 Years | 3,402 (77.8%) | 3,900 (80.7%) |
| 18 to 24 Years | 13,269 (75.8%) | 13,056 (66.9%) |
| 25 to 34 Years | 30,863 (92.3%) | 29,907 (85.8%) |
| 35 to 44 Years | 21,554 (90.4%) | 23,028 (87.6%) |
| 45 to 54 Years | 21,183 (90.7%) | 21,396 (88.3%) |
| 55 to 64 Years | 20,392 (86.9%) | 23,661 (86.6%) |
| 65 to 74 Years | 14,453 (86.7%) | 18,325 (86.7%) |
| 75 Years and over | 8,504 (88.8%) | 14,321 (83.7%) |
| Total | 165,186 (86.4%) | 176,711 (83.8%) |
Income Below Poverty Among Married-Couple Families in Area Code 667
The poverty statistics for married-couple families in Area Code 667 show that 3.8% or 2,254 of the total 59,962 families live below the poverty line. Families with 5 or more children have the highest poverty rate of 32.4%, comprising of 147 families. On the other hand, families with no children have the lowest poverty rate of 2.7%, which includes 954 families.
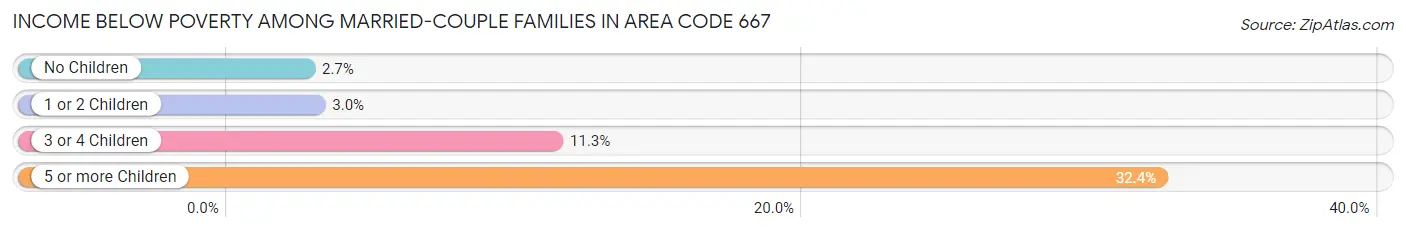
| Children | Above Poverty | Below Poverty |
| No Children | 34,706 (97.3%) | 954 (2.7%) |
| 1 or 2 Children | 18,112 (97.0%) | 568 (3.0%) |
| 3 or 4 Children | 4,583 (88.7%) | 585 (11.3%) |
| 5 or more Children | 307 (67.6%) | 147 (32.4%) |
| Total | 57,708 (96.2%) | 2,254 (3.8%) |
Income Below Poverty Among Single-Parent Households in Area Code 667
According to the poverty data in Area Code 667, 10.3% or 803 single-father households and 22.1% or 5,412 single-mother households are living below the poverty line. Among single-father households, those with 3 or 4 children have the highest poverty rate, with 152 households (27.7%) experiencing poverty. Likewise, among single-mother households, those with 3 or 4 children have the highest poverty rate, with 1,094 households (52.8%) falling below the poverty line.
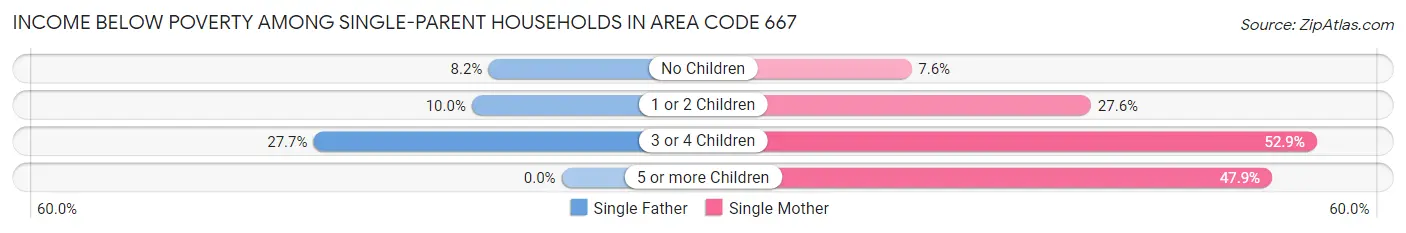
| Children | Single Father | Single Mother |
| No Children | 291 (8.2%) | 731 (7.6%) |
| 1 or 2 Children | 360 (10.0%) | 3,464 (27.6%) |
| 3 or 4 Children | 152 (27.7%) | 1,094 (52.8%) |
| 5 or more Children | 0 (0.0%) | 123 (47.9%) |
| Total | 803 (10.3%) | 5,412 (22.1%) |
Income Below Poverty Among Married-Couple vs Single-Parent Households in Area Code 667
The poverty data for Area Code 667 shows that 2,254 of the married-couple family households (3.8%) and 6,215 of the single-parent households (19.2%) are living below the poverty level. Within the married-couple family households, those with 5 or more children have the highest poverty rate, with 147 households (32.4%) falling below the poverty line. Among the single-parent households, those with 3 or 4 children have the highest poverty rate, with 1,246 household (47.6%) living below poverty.
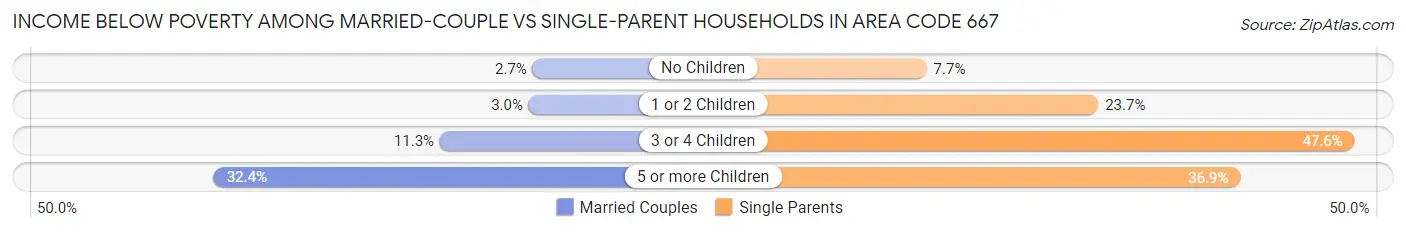
| Children | Married-Couple Families | Single-Parent Households |
| No Children | 954 (2.7%) | 1,022 (7.7%) |
| 1 or 2 Children | 568 (3.0%) | 3,824 (23.7%) |
| 3 or 4 Children | 585 (11.3%) | 1,246 (47.6%) |
| 5 or more Children | 147 (32.4%) | 123 (36.9%) |
| Total | 2,254 (3.8%) | 6,215 (19.2%) |
Race in Area Code 667
The most populous races in Area Code 667 are White / Caucasian (204,488 | 49.2%), Black / African American (161,097 | 38.8%), and Hispanic or Latino (25,169 | 6.1%).
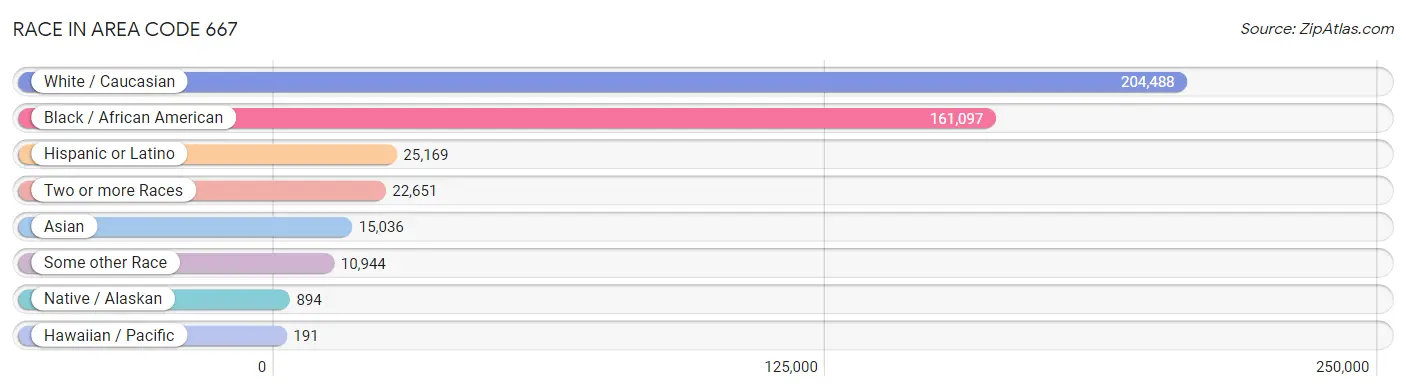
| Race | # Population | % Population |
| Asian | 15,036 | 3.6% |
| Black / African American | 161,097 | 38.8% |
| Hawaiian / Pacific | 191 | 0.1% |
| Hispanic or Latino | 25,169 | 6.1% |
| Native / Alaskan | 894 | 0.2% |
| White / Caucasian | 204,488 | 49.2% |
| Two or more Races | 22,651 | 5.4% |
| Some other Race | 10,944 | 2.6% |
| Total | 415,301 | 100.0% |
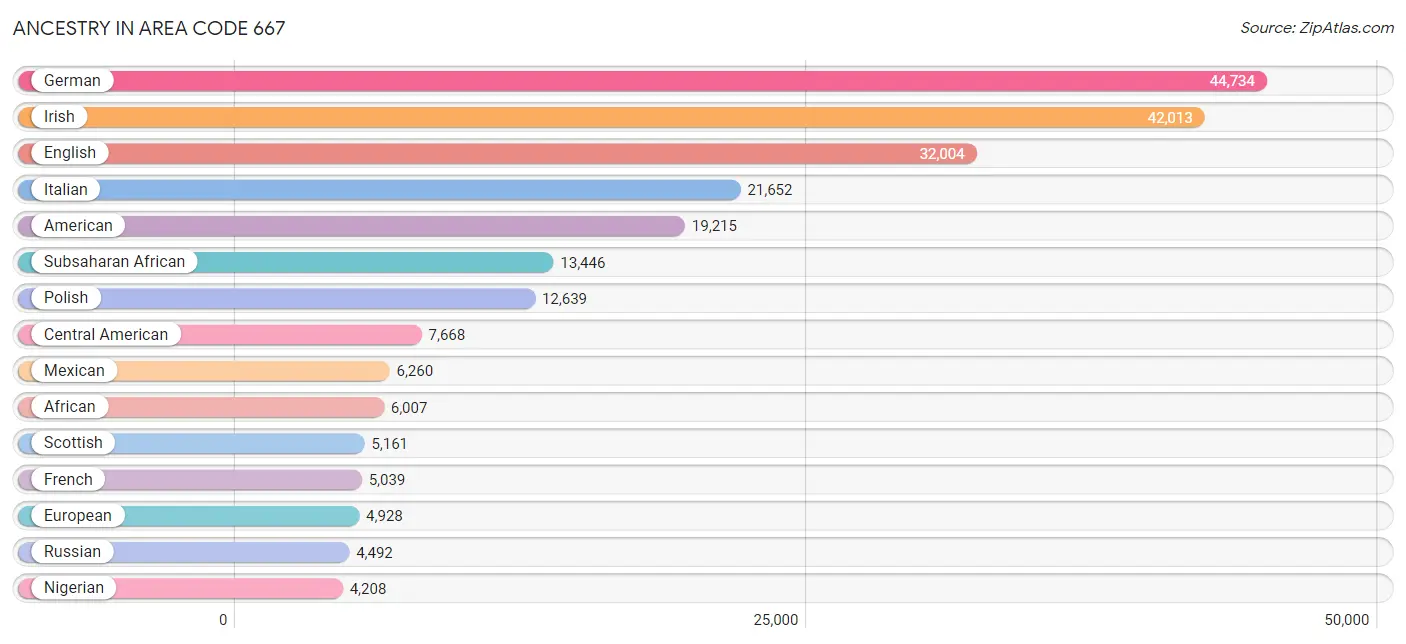
Ancestry in Area Code 667
The most populous ancestries reported in Area Code 667 are German (44,734 | 10.8%), Irish (42,013 | 10.1%), English (32,004 | 7.7%), Italian (21,652 | 5.2%), and American (19,215 | 4.6%), together accounting for 38.4% of all Area Code 667 residents.
| Ancestry | # Population | % Population |
| Afghan | 142 | 0.0% |
| African | 6,007 | 1.5% |
| Alaska Native | 34 | 0.0% |
| Albanian | 22 | 0.0% |
| Alsatian | 15 | 0.0% |
| American | 19,215 | 4.6% |
| Apache | 49 | 0.0% |
| Arab | 2,124 | 0.5% |
| Argentinean | 308 | 0.1% |
| Armenian | 179 | 0.0% |
| Australian | 83 | 0.0% |
| Austrian | 718 | 0.2% |
| Bahamian | 38 | 0.0% |
| Barbadian | 112 | 0.0% |
| Basque | 7 | 0.0% |
| Belgian | 242 | 0.1% |
| Belizean | 18 | 0.0% |
| Bermudan | 48 | 0.0% |
| Bhutanese | 839 | 0.2% |
| Blackfeet | 254 | 0.1% |
| Bolivian | 187 | 0.1% |
| Brazilian | 1,085 | 0.3% |
| British | 2,781 | 0.7% |
| British West Indian | 211 | 0.1% |
| Bulgarian | 185 | 0.0% |
| Burmese | 2,175 | 0.5% |
| Cajun | 11 | 0.0% |
| Cambodian | 178 | 0.0% |
| Canadian | 499 | 0.1% |
| Cape Verdean | 71 | 0.0% |
| Carpatho Rusyn | 14 | 0.0% |
| Celtic | 29 | 0.0% |
| Central American | 7,668 | 1.8% |
| Central American Indian | 477 | 0.1% |
| Cherokee | 950 | 0.2% |
| Chilean | 128 | 0.0% |
| Chinese | 6 | 0.0% |
| Chippewa | 16 | 0.0% |
| Choctaw | 80 | 0.0% |
| Colombian | 424 | 0.1% |
| Comanche | 47 | 0.0% |
| Costa Rican | 256 | 0.1% |
| Cree | 31 | 0.0% |
| Creek | 60 | 0.0% |
| Croatian | 294 | 0.1% |
| Cuban | 1,369 | 0.3% |
| Czech | 1,456 | 0.4% |
| Czechoslovakian | 286 | 0.1% |
| Danish | 903 | 0.2% |
| Delaware | 10 | 0.0% |
| Dominican | 1,314 | 0.3% |
| Dutch | 2,090 | 0.5% |
| Dutch West Indian | 6 | 0.0% |
| Eastern European | 2,516 | 0.6% |
| Ecuadorian | 586 | 0.1% |
| Egyptian | 478 | 0.1% |
| English | 32,004 | 7.7% |
| Estonian | 102 | 0.0% |
| Ethiopian | 986 | 0.2% |
| European | 4,928 | 1.2% |
| Filipino | 305 | 0.1% |
| Finnish | 452 | 0.1% |
| French | 5,039 | 1.2% |
| French Canadian | 955 | 0.2% |
| German | 44,734 | 10.8% |
| German Russian | 53 | 0.0% |
| Ghanaian | 412 | 0.1% |
| Greek | 1,696 | 0.4% |
| Guamanian / Chamorro | 104 | 0.0% |
| Guatemalan | 1,920 | 0.5% |
| Guyanese | 334 | 0.1% |
| Haitian | 3,392 | 0.8% |
| Hmong | 51 | 0.0% |
| Honduran | 930 | 0.2% |
| Hungarian | 1,890 | 0.5% |
| Icelander | 51 | 0.0% |
| Indian (Asian) | 2,770 | 0.7% |
| Indonesian | 678 | 0.2% |
| Inupiat | 13 | 0.0% |
| Iranian | 1,081 | 0.3% |
| Iraqi | 48 | 0.0% |
| Irish | 42,013 | 10.1% |
| Iroquois | 225 | 0.1% |
| Israeli | 317 | 0.1% |
| Italian | 21,652 | 5.2% |
| Jamaican | 2,888 | 0.7% |
| Japanese | 32 | 0.0% |
| Jordanian | 56 | 0.0% |
| Kenyan | 652 | 0.2% |
| Kiowa | 23 | 0.0% |
| Korean | 3,763 | 0.9% |
| Laotian | 219 | 0.1% |
| Latvian | 316 | 0.1% |
| Lebanese | 542 | 0.1% |
| Liberian | 219 | 0.1% |
| Lithuanian | 1,193 | 0.3% |
| Lumbee | 170 | 0.0% |
| Luxembourger | 9 | 0.0% |
| Macedonian | 8 | 0.0% |
| Malaysian | 51 | 0.0% |
| Maltese | 19 | 0.0% |
| Mexican | 6,260 | 1.5% |
| Mexican American Indian | 138 | 0.0% |
| Mongolian | 8 | 0.0% |
| Moroccan | 72 | 0.0% |
| Native Hawaiian | 257 | 0.1% |
| Navajo | 98 | 0.0% |
| New Zealander | 3 | 0.0% |
| Nicaraguan | 105 | 0.0% |
| Nigerian | 4,208 | 1.0% |
| Northern European | 439 | 0.1% |
| Norwegian | 1,789 | 0.4% |
| Okinawan | 4 | 0.0% |
| Pakistani | 318 | 0.1% |
| Palestinian | 38 | 0.0% |
| Panamanian | 425 | 0.1% |
| Paraguayan | 50 | 0.0% |
| Pennsylvania German | 125 | 0.0% |
| Peruvian | 1,013 | 0.2% |
| Pima | 10 | 0.0% |
| Polish | 12,639 | 3.0% |
| Portuguese | 708 | 0.2% |
| Pueblo | 4 | 0.0% |
| Puerto Rican | 3,047 | 0.7% |
| Romanian | 463 | 0.1% |
| Russian | 4,492 | 1.1% |
| Salvadoran | 4,032 | 1.0% |
| Samoan | 55 | 0.0% |
| Scandinavian | 1,002 | 0.2% |
| Scotch-Irish | 2,270 | 0.5% |
| Scottish | 5,161 | 1.2% |
| Seminole | 51 | 0.0% |
| Serbian | 179 | 0.0% |
| Sierra Leonean | 106 | 0.0% |
| Sioux | 60 | 0.0% |
| Slavic | 102 | 0.0% |
| Slovak | 633 | 0.2% |
| Slovene | 84 | 0.0% |
| South African | 87 | 0.0% |
| South American | 2,833 | 0.7% |
| South American Indian | 62 | 0.0% |
| Spaniard | 731 | 0.2% |
| Spanish | 677 | 0.2% |
| Sri Lankan | 1,426 | 0.3% |
| Subsaharan African | 13,446 | 3.2% |
| Sudanese | 122 | 0.0% |
| Swedish | 2,243 | 0.5% |
| Swiss | 741 | 0.2% |
| Syrian | 225 | 0.1% |
| Thai | 4,195 | 1.0% |
| Tongan | 13 | 0.0% |
| Trinidadian and Tobagonian | 1,385 | 0.3% |
| Turkish | 247 | 0.1% |
| U.S. Virgin Islander | 7 | 0.0% |
| Ugandan | 129 | 0.0% |
| Ukrainian | 1,703 | 0.4% |
| Venezuelan | 137 | 0.0% |
| Vietnamese | 104 | 0.0% |
| Welsh | 1,959 | 0.5% |
| West Indian | 940 | 0.2% |
| Yaqui | 9 | 0.0% |
| Yugoslavian | 57 | 0.0% |
| Zimbabwean | 27 | 0.0% | View All 163 Rows |
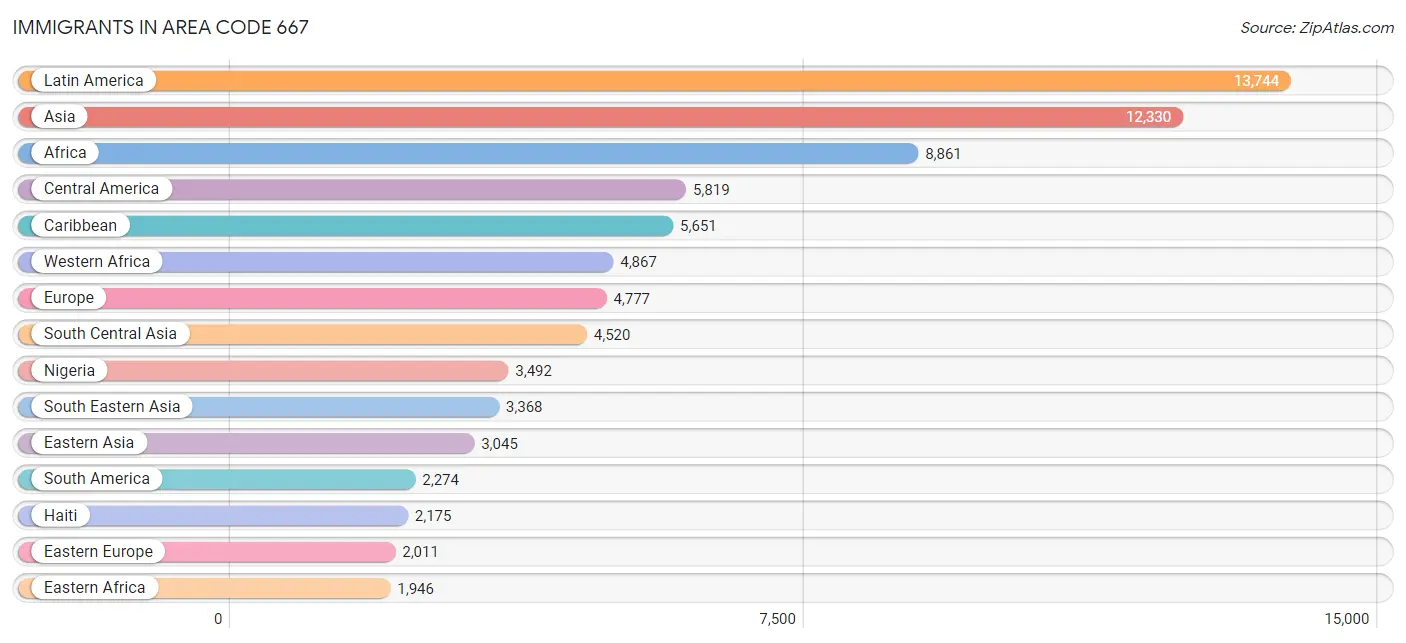
Immigrants in Area Code 667
The most numerous immigrant groups reported in Area Code 667 came from Latin America (13,744 | 3.3%), Asia (12,330 | 3.0%), Africa (8,861 | 2.1%), Central America (5,819 | 1.4%), and Caribbean (5,651 | 1.4%), together accounting for 11.2% of all Area Code 667 residents.
| Immigration Origin | # Population | % Population |
| Afghanistan | 181 | 0.0% |
| Africa | 8,861 | 2.1% |
| Argentina | 173 | 0.0% |
| Armenia | 24 | 0.0% |
| Asia | 12,330 | 3.0% |
| Australia | 169 | 0.0% |
| Austria | 113 | 0.0% |
| Azores | 10 | 0.0% |
| Bahamas | 98 | 0.0% |
| Bangladesh | 125 | 0.0% |
| Barbados | 65 | 0.0% |
| Belarus | 132 | 0.0% |
| Belgium | 41 | 0.0% |
| Belize | 9 | 0.0% |
| Bolivia | 61 | 0.0% |
| Bosnia and Herzegovina | 7 | 0.0% |
| Brazil | 751 | 0.2% |
| Bulgaria | 187 | 0.1% |
| Cambodia | 8 | 0.0% |
| Cameroon | 434 | 0.1% |
| Canada | 622 | 0.2% |
| Caribbean | 5,651 | 1.4% |
| Central America | 5,819 | 1.4% |
| Chile | 130 | 0.0% |
| China | 1,483 | 0.4% |
| Colombia | 249 | 0.1% |
| Congo | 12 | 0.0% |
| Costa Rica | 83 | 0.0% |
| Cuba | 188 | 0.1% |
| Czechoslovakia | 68 | 0.0% |
| Denmark | 35 | 0.0% |
| Dominica | 34 | 0.0% |
| Dominican Republic | 519 | 0.1% |
| Eastern Africa | 1,946 | 0.5% |
| Eastern Asia | 3,045 | 0.7% |
| Eastern Europe | 2,011 | 0.5% |
| Ecuador | 134 | 0.0% |
| Egypt | 355 | 0.1% |
| El Salvador | 1,916 | 0.5% |
| England | 472 | 0.1% |
| Eritrea | 107 | 0.0% |
| Ethiopia | 875 | 0.2% |
| Europe | 4,777 | 1.1% |
| France | 119 | 0.0% |
| Germany | 622 | 0.2% |
| Ghana | 466 | 0.1% |
| Greece | 177 | 0.0% |
| Grenada | 26 | 0.0% |
| Guatemala | 1,450 | 0.4% |
| Guyana | 444 | 0.1% |
| Haiti | 2,175 | 0.5% |
| Honduras | 599 | 0.1% |
| Hong Kong | 114 | 0.0% |
| Hungary | 220 | 0.1% |
| India | 1,773 | 0.4% |
| Indonesia | 104 | 0.0% |
| Iran | 659 | 0.2% |
| Iraq | 106 | 0.0% |
| Ireland | 99 | 0.0% |
| Israel | 249 | 0.1% |
| Italy | 231 | 0.1% |
| Jamaica | 1,353 | 0.3% |
| Japan | 157 | 0.0% |
| Jordan | 18 | 0.0% |
| Kazakhstan | 60 | 0.0% |
| Kenya | 664 | 0.2% |
| Korea | 1,405 | 0.3% |
| Laos | 46 | 0.0% |
| Latin America | 13,744 | 3.3% |
| Latvia | 22 | 0.0% |
| Lebanon | 166 | 0.0% |
| Liberia | 228 | 0.1% |
| Lithuania | 18 | 0.0% |
| Malaysia | 48 | 0.0% |
| Mexico | 1,680 | 0.4% |
| Middle Africa | 587 | 0.1% |
| Moldova | 55 | 0.0% |
| Morocco | 50 | 0.0% |
| Nepal | 460 | 0.1% |
| Netherlands | 62 | 0.0% |
| Nicaragua | 13 | 0.0% |
| Nigeria | 3,492 | 0.8% |
| Northern Africa | 464 | 0.1% |
| Northern Europe | 1,104 | 0.3% |
| Norway | 64 | 0.0% |
| Oceania | 193 | 0.1% |
| Pakistan | 1,096 | 0.3% |
| Panama | 69 | 0.0% |
| Peru | 289 | 0.1% |
| Philippines | 1,465 | 0.4% |
| Poland | 339 | 0.1% |
| Portugal | 95 | 0.0% |
| Romania | 116 | 0.0% |
| Russia | 433 | 0.1% |
| Saudi Arabia | 163 | 0.0% |
| Scotland | 72 | 0.0% |
| Senegal | 59 | 0.0% |
| Serbia | 21 | 0.0% |
| Sierra Leone | 134 | 0.0% |
| Singapore | 3 | 0.0% |
| South Africa | 363 | 0.1% |
| South America | 2,274 | 0.5% |
| South Central Asia | 4,520 | 1.1% |
| South Eastern Asia | 3,368 | 0.8% |
| Southern Europe | 697 | 0.2% |
| Spain | 182 | 0.0% |
| Sri Lanka | 130 | 0.0% |
| St. Vincent and the Grenadines | 13 | 0.0% |
| Sudan | 40 | 0.0% |
| Sweden | 31 | 0.0% |
| Switzerland | 8 | 0.0% |
| Syria | 80 | 0.0% |
| Taiwan | 245 | 0.1% |
| Thailand | 226 | 0.1% |
| Trinidad and Tobago | 1,036 | 0.3% |
| Turkey | 191 | 0.1% |
| Uganda | 155 | 0.0% |
| Ukraine | 361 | 0.1% |
| Uzbekistan | 11 | 0.0% |
| Venezuela | 33 | 0.0% |
| Vietnam | 957 | 0.2% |
| West Indies | 22 | 0.0% |
| Western Africa | 4,867 | 1.2% |
| Western Asia | 1,279 | 0.3% |
| Western Europe | 965 | 0.2% |
| Yemen | 14 | 0.0% |
| Zaire | 141 | 0.0% |
| Zimbabwe | 15 | 0.0% | View All 128 Rows |
Sex and Age in Area Code 667
Sex and Age in Area Code 667
The most populous age groups in Area Code 667 are 25 to 29 Years (18,281 | 9.2%) for men and 25 to 29 Years (17,683 | 8.2%) for women.
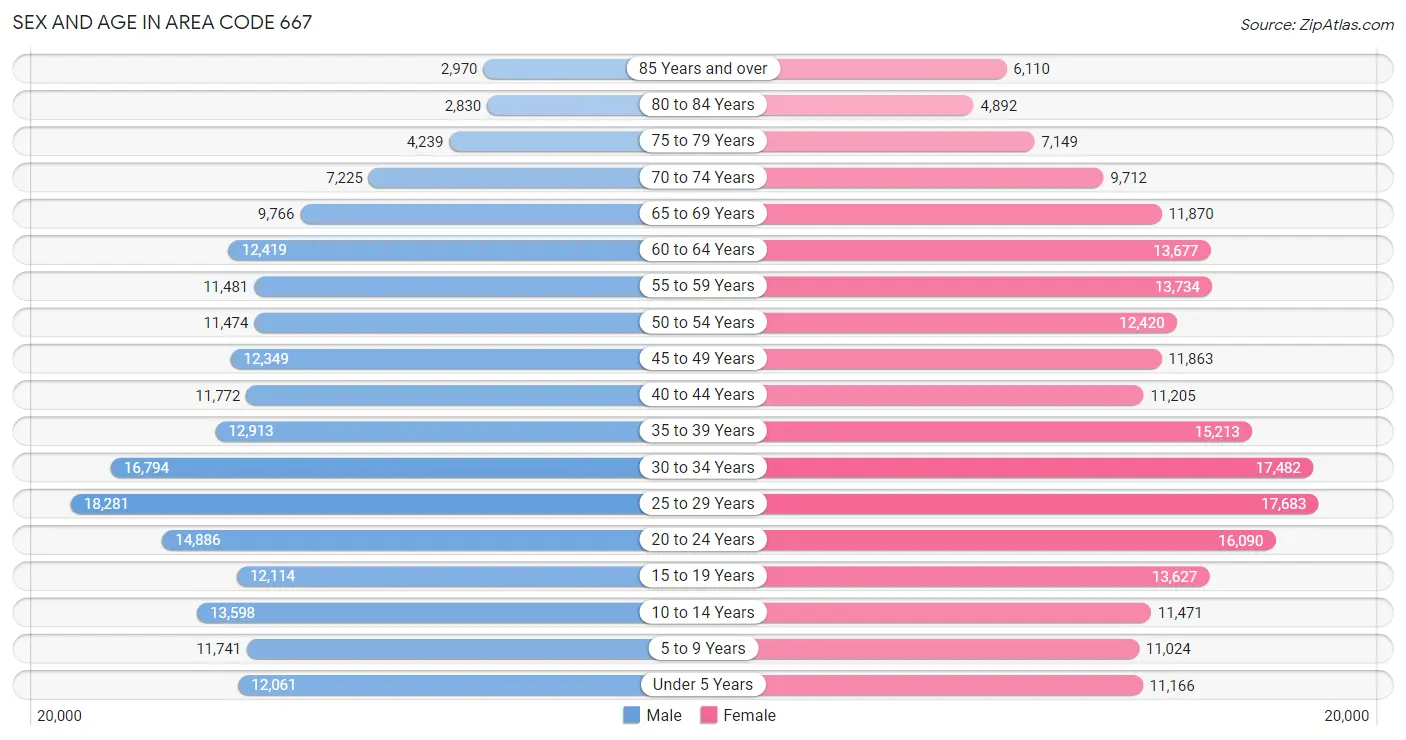
| Age Bracket | Male | Female |
| Under 5 Years | 12,061 (6.1%) | 11,166 (5.2%) |
| 5 to 9 Years | 11,741 (5.9%) | 11,024 (5.1%) |
| 10 to 14 Years | 13,598 (6.8%) | 11,471 (5.3%) |
| 15 to 19 Years | 12,114 (6.1%) | 13,627 (6.3%) |
| 20 to 24 Years | 14,886 (7.5%) | 16,090 (7.4%) |
| 25 to 29 Years | 18,281 (9.2%) | 17,683 (8.2%) |
| 30 to 34 Years | 16,794 (8.4%) | 17,482 (8.1%) |
| 35 to 39 Years | 12,913 (6.5%) | 15,213 (7.0%) |
| 40 to 44 Years | 11,772 (5.9%) | 11,205 (5.2%) |
| 45 to 49 Years | 12,349 (6.2%) | 11,863 (5.5%) |
| 50 to 54 Years | 11,474 (5.8%) | 12,420 (5.7%) |
| 55 to 59 Years | 11,481 (5.8%) | 13,734 (6.4%) |
| 60 to 64 Years | 12,419 (6.2%) | 13,677 (6.3%) |
| 65 to 69 Years | 9,766 (4.9%) | 11,870 (5.5%) |
| 70 to 74 Years | 7,225 (3.6%) | 9,712 (4.5%) |
| 75 to 79 Years | 4,239 (2.1%) | 7,149 (3.3%) |
| 80 to 84 Years | 2,830 (1.4%) | 4,892 (2.3%) |
| 85 Years and over | 2,970 (1.5%) | 6,110 (2.8%) |
| Total | 198,913 (100.0%) | 216,388 (100.0%) |
Families and Households in Area Code 667
Median Family Size in Area Code 667
The median family size in Area Code 667 is 3.09 persons per family, with married-couple families (59,962 | 65.0%) accounting for the largest median family size of 3.13941 persons per family. On the other hand, single male/father families (7,767 | 8.4%) represent the smallest median family size with 2.79 persons per family.
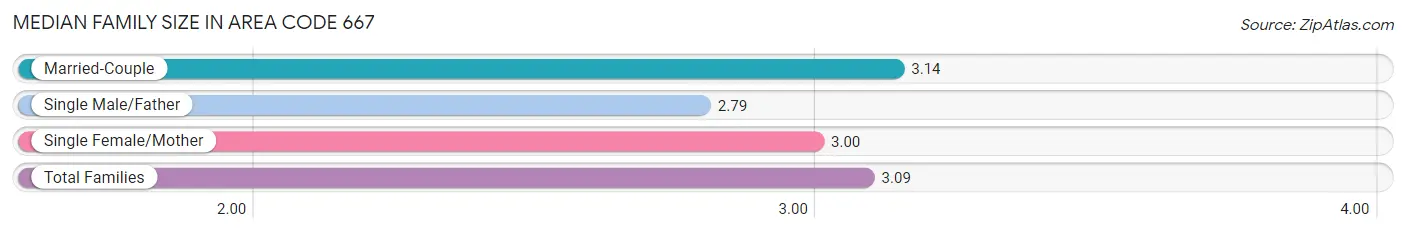
| Family Type | # Families | Family Size |
| Married-Couple | 59,962 (65.0%) | 3.14 |
| Single Male/Father | 7,767 (8.4%) | 2.79 |
| Single Female/Mother | 24,538 (26.6%) | 3.00 |
| Total Families | 92,267 (100.0%) | 3.09 |
Median Household Size in Area Code 667
The median household size in Area Code 667 is 2.29 persons per household, with single female/mother households (24,538 | 14.1%) accounting for the largest median household size of 3.17375 persons per household. non-family households (81,466 | 46.9%) represent the smallest median household size with 1.26 persons per household.
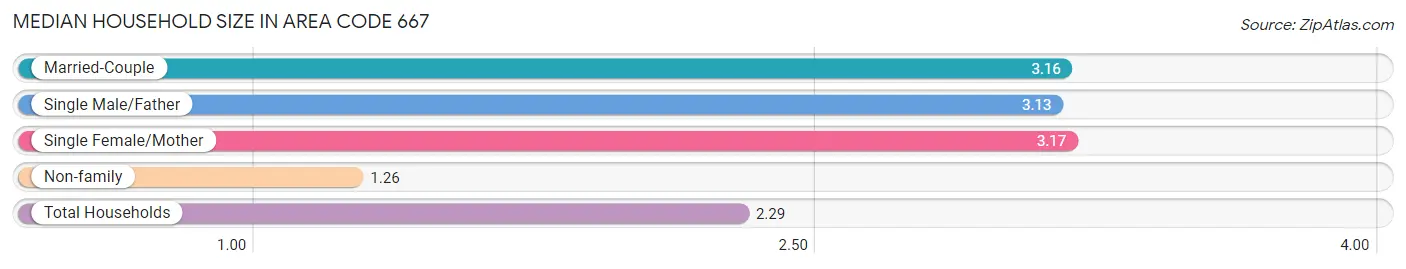
| Household Type | # Households | Household Size |
| Married-Couple | 59,962 (34.5%) | 3.16 |
| Single Male/Father | 7,767 (4.5%) | 3.13 |
| Single Female/Mother | 24,538 (14.1%) | 3.17 |
| Non-family | 81,466 (46.9%) | 1.26 |
| Total Households | 173,733 (100.0%) | 2.29 |
Household Size by Marriage Status in Area Code 667
Out of a total of 173,733 households in Area Code 667, 92,267 (53.1%) are family households, while 81,466 (46.9%) are nonfamily households. The most numerous type of family households are 2-person households, comprising 42,101, and the most common type of nonfamily households are 1-person households, comprising 64,281.
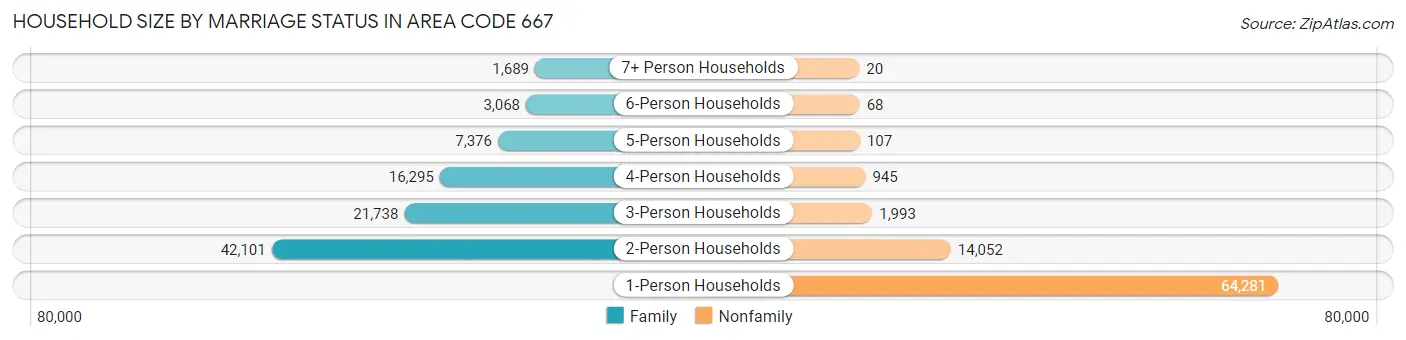
| Household Size | Family Households | Nonfamily Households |
| 1-Person Households | - | 64,281 (37.0%) |
| 2-Person Households | 42,101 (24.2%) | 14,052 (8.1%) |
| 3-Person Households | 21,738 (12.5%) | 1,993 (1.1%) |
| 4-Person Households | 16,295 (9.4%) | 945 (0.5%) |
| 5-Person Households | 7,376 (4.3%) | 107 (0.1%) |
| 6-Person Households | 3,068 (1.8%) | 68 (0.0%) |
| 7+ Person Households | 1,689 (1.0%) | 20 (0.0%) |
| Total | 92,267 (53.1%) | 81,466 (46.9%) |
Female Fertility in Area Code 667
Fertility by Age in Area Code 667
Average fertility rate in Area Code 667 is 38.9 births per 1,000 women. Women in the age bracket of 20 to 34 years have the highest fertility rate with 58.4 births per 1,000 women. Women in the age bracket of 20 to 34 years acount for 65.1% of all women with births.
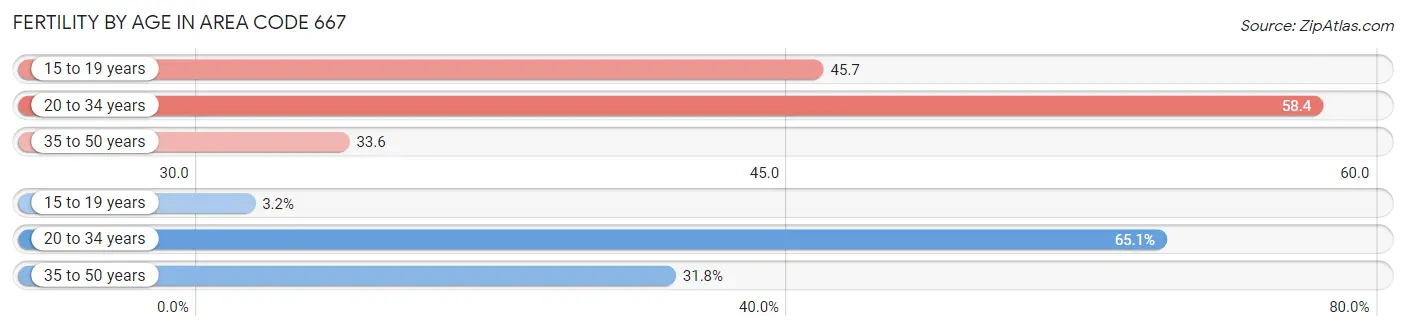
| Age Bracket | Women with Births | Births / 1,000 Women |
| 15 to 19 years | 141 (3.2%) | 45.7 |
| 20 to 34 years | 2,869 (65.1%) | 58.4 |
| 35 to 50 years | 1,400 (31.8%) | 33.6 |
| Total | 4,410 (100.0%) | 38.9 |
Fertility by Age by Marriage Status in Area Code 667
59.2% of women with births (4,410) in Area Code 667 are married. The highest percentage of unmarried women with births falls into 15 to 19 years age bracket with 100.0% of them unmarried at the time of birth, while the lowest percentage of unmarried women with births belong to 35 to 50 years age bracket with 36.8% of them unmarried.
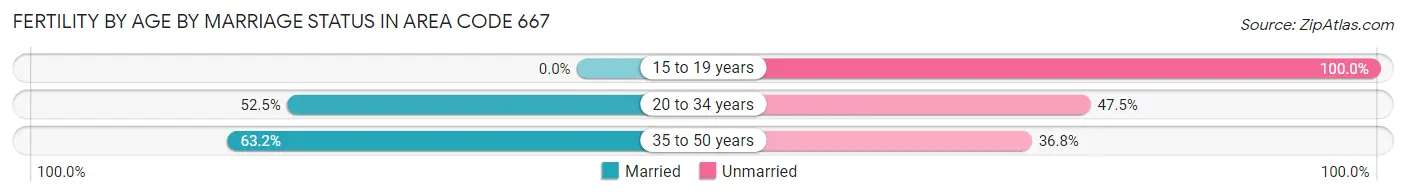
| Age Bracket | Married | Unmarried |
| 15 to 19 years | 0 (0.0%) | 141 (100.0%) |
| 20 to 34 years | 1,507 (52.5%) | 1,362 (47.5%) |
| 35 to 50 years | 885 (63.2%) | 515 (36.8%) |
| Total | 2,609 (59.2%) | 1,801 (40.8%) |
Fertility by Education in Area Code 667
Average fertility rate in Area Code 667 is 38.9 births per 1,000 women. Women with the education attainment of graduate degree have the highest fertility rate of 65.8 births per 1,000 women, while women with the education attainment of bachelor's degree have the lowest fertility at 33.6 births per 1,000 women. Women with the education attainment of college or associate's degree represent 29.5% of all women with births.
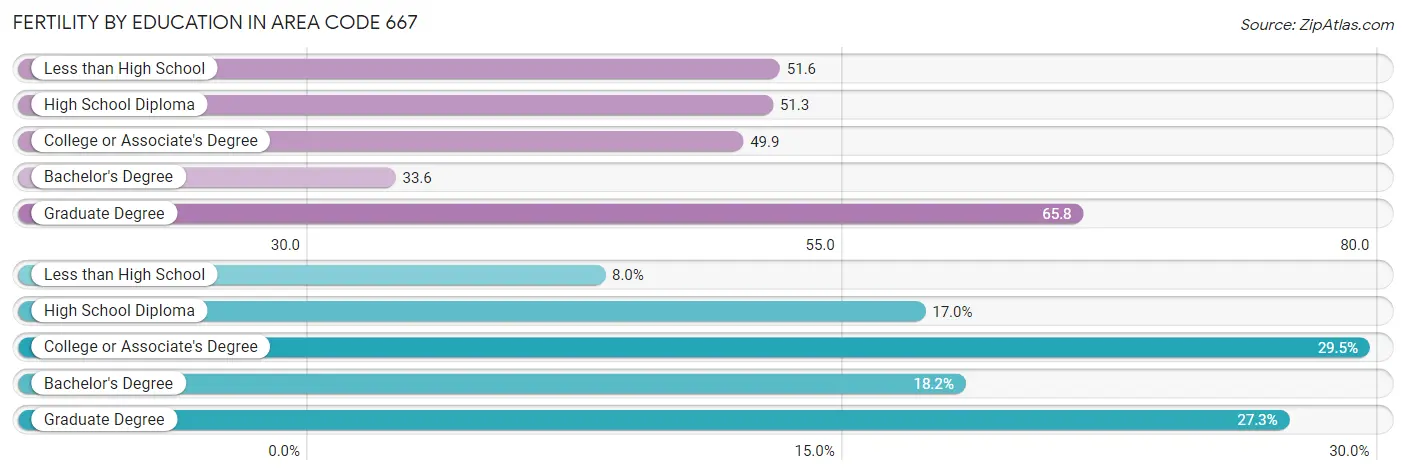
| Educational Attainment | Women with Births | Births / 1,000 Women |
| Less than High School | 354 (8.0%) | 51.6 |
| High School Diploma | 751 (17.0%) | 51.2 |
| College or Associate's Degree | 1,302 (29.5%) | 49.9 |
| Bachelor's Degree | 801 (18.2%) | 33.6 |
| Graduate Degree | 1,202 (27.3%) | 65.8 |
| Total | 4,410 (100.0%) | 38.9 |
Fertility by Education by Marriage Status in Area Code 667
40.8% of women with births in Area Code 667 are unmarried. Women with the educational attainment of graduate degree are most likely to be married with 81.3% of them married at childbirth, while women with the educational attainment of less than high school are least likely to be married with 85.6% of them unmarried at childbirth.
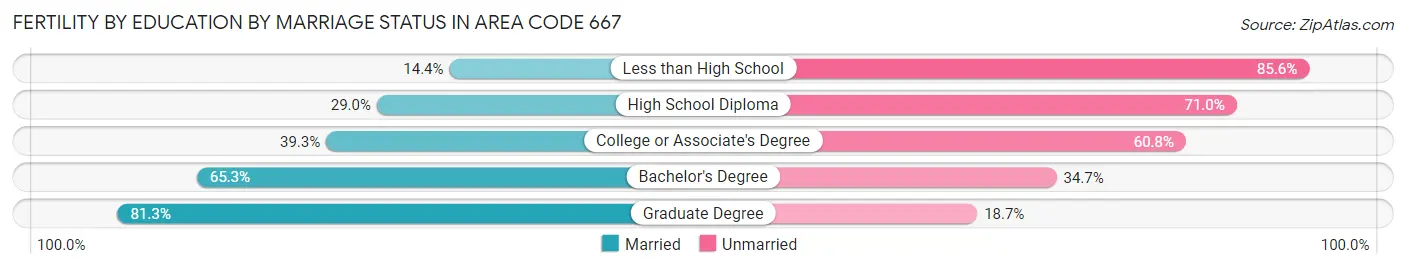
| Educational Attainment | Married | Unmarried |
| Less than High School | 51 (14.4%) | 303 (85.6%) |
| High School Diploma | 218 (29.0%) | 533 (71.0%) |
| College or Associate's Degree | 511 (39.3%) | 791 (60.8%) |
| Bachelor's Degree | 523 (65.3%) | 278 (34.7%) |
| Graduate Degree | 977 (81.3%) | 225 (18.7%) |
| Total | 2,609 (59.2%) | 1,801 (40.8%) |
Employment Characteristics in Area Code 667
Employment by Class of Employer in Area Code 667
Among the 205,146 employed individuals in Area Code 667, private company employees (120,450 | 58.7%), not-for-profit organizations (25,384 | 12.4%), and federal government employees (15,443 | 7.5%) make up the most common classes of employment.
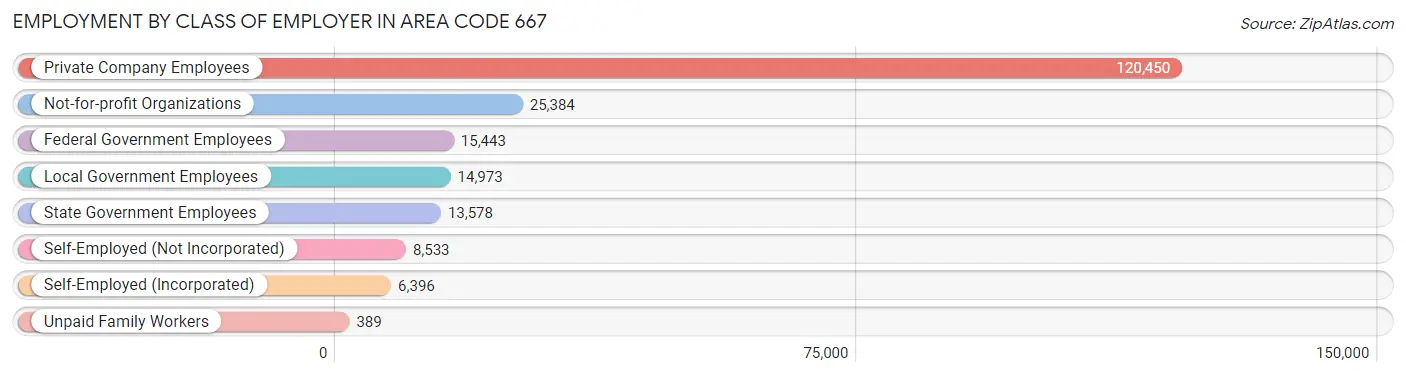
| Employer Class | # Employees | % Employees |
| Private Company Employees | 120,450 | 58.7% |
| Self-Employed (Incorporated) | 6,396 | 3.1% |
| Self-Employed (Not Incorporated) | 8,533 | 4.2% |
| Not-for-profit Organizations | 25,384 | 12.4% |
| Local Government Employees | 14,973 | 7.3% |
| State Government Employees | 13,578 | 6.6% |
| Federal Government Employees | 15,443 | 7.5% |
| Unpaid Family Workers | 389 | 0.2% |
| Total | 205,146 | 100.0% |
Employment Status by Age in Area Code 667
According to the labor force statistics for Area Code 667, out of the total population over 16 years of age (339,470), 63.2% or 214,409 individuals are in the labor force, with 5.5% or 11,814 of them unemployed. The age group with the highest labor force participation rate is 30 to 34 years, with 86.3% or 29,584 individuals in the labor force. Within the labor force, the 16 to 19 years age range has the highest percentage of unemployed individuals, with 363.6% or 27,092 of them being unemployed.
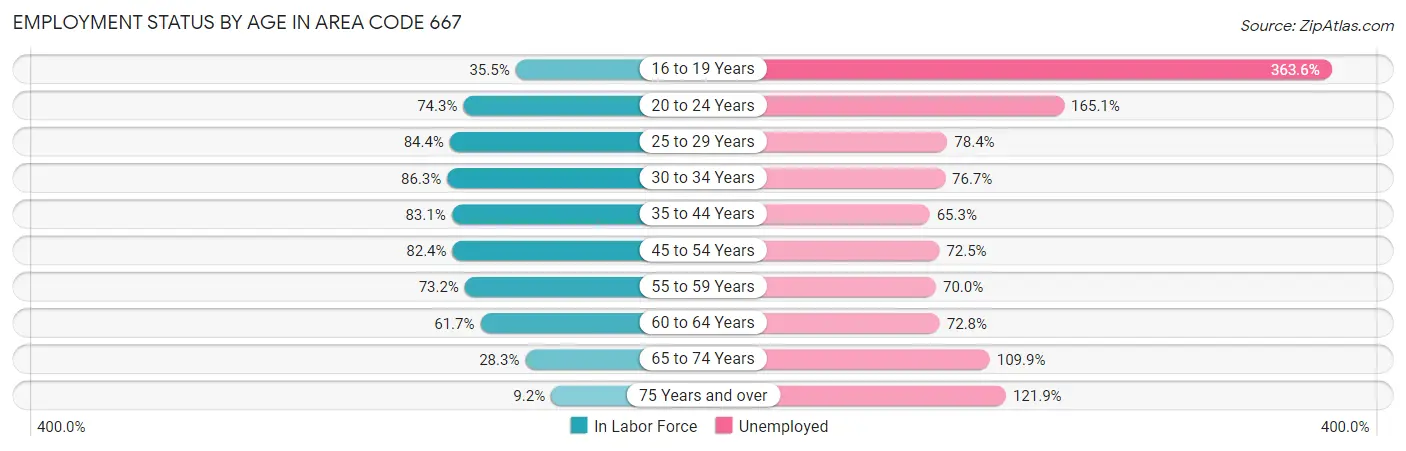
| Age Bracket | In Labor Force | Unemployed |
| 16 to 19 Years | 7,451 (35.5%) | 27,092 (363.6%) |
| 20 to 24 Years | 23,025 (74.3%) | 38,013 (165.1%) |
| 25 to 29 Years | 30,347 (84.4%) | 23,791 (78.4%) |
| 30 to 34 Years | 29,584 (86.3%) | 22,691 (76.7%) |
| 35 to 44 Years | 42,451 (83.1%) | 27,721 (65.3%) |
| 45 to 54 Years | 39,637 (82.4%) | 28,735 (72.5%) |
| 55 to 59 Years | 18,468 (73.2%) | 12,927 (70.0%) |
| 60 to 64 Years | 16,089 (61.7%) | 11,712 (72.8%) |
| 65 to 74 Years | 10,914 (28.3%) | 11,992 (109.9%) |
| 75 Years and over | 2,592 (9.2%) | 3,158 (121.9%) |
| Total | 214,405 (63.2%) | 11,806 (5.5%) |
Employment Status by Educational Attainment in Area Code 667
According to labor force statistics for Area Code 667, 78.1% of individuals (172,502) out of the total population between 25 and 64 years of age (220,760) are in the labor force, with 68.0% or 117,301 of them being unemployed. The group with the highest labor force participation rate are those with the educational attainment of bachelor's degree or higher, with 86.9% or 87,883 individuals in the labor force. Within the labor force, individuals with less than high school education have the highest percentage of unemployment, with 223.0% or 22,084 of them being unemployed.
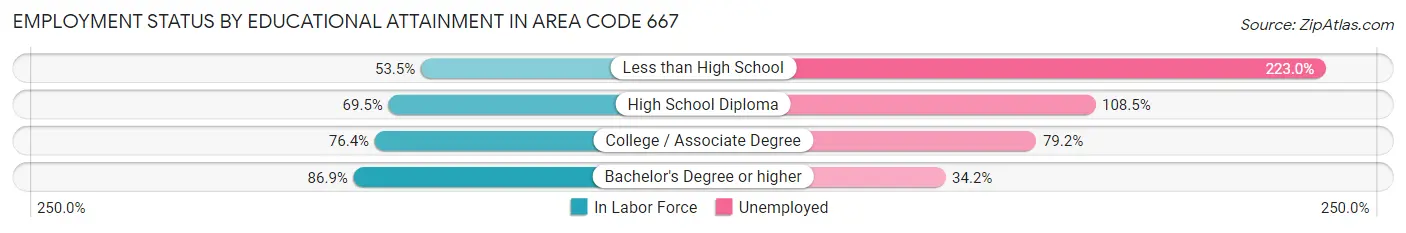
| Educational Attainment | In Labor Force | Unemployed |
| Less than High School | 9,902 (53.5%) | 41,284 (223.0%) |
| High School Diploma | 32,229 (69.5%) | 50,284 (108.5%) |
| College / Associate Degree | 41,820 (76.4%) | 43,369 (79.2%) |
| Bachelor's Degree or higher | 87,887 (86.9%) | 34,591 (34.2%) |
| Total | 172,504 (78.1%) | 150,117 (68.0%) |
Employment Occupations by Sex in Area Code 667
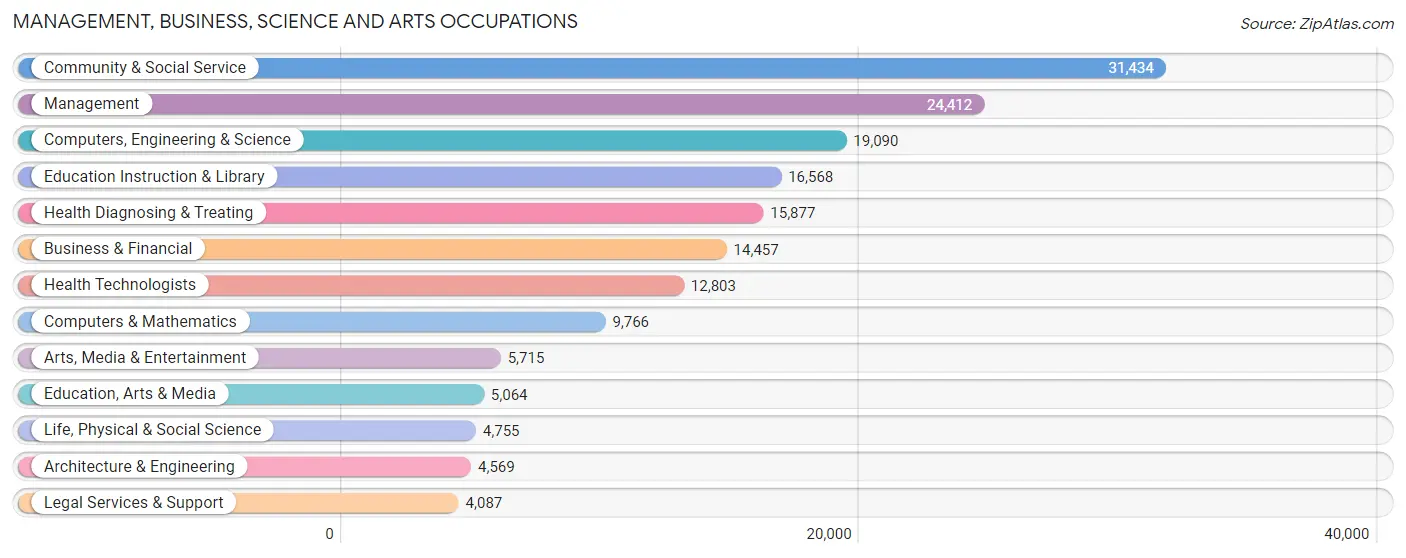
Management, Business, Science and Arts Occupations
The most common Management, Business, Science and Arts occupations in Area Code 667 are Community & Social Service (31,434 | 15.2%), Management (24,412 | 11.8%), Computers, Engineering & Science (19,090 | 9.2%), Education Instruction & Library (16,568 | 8.0%), and Health Diagnosing & Treating (15,877 | 7.7%).
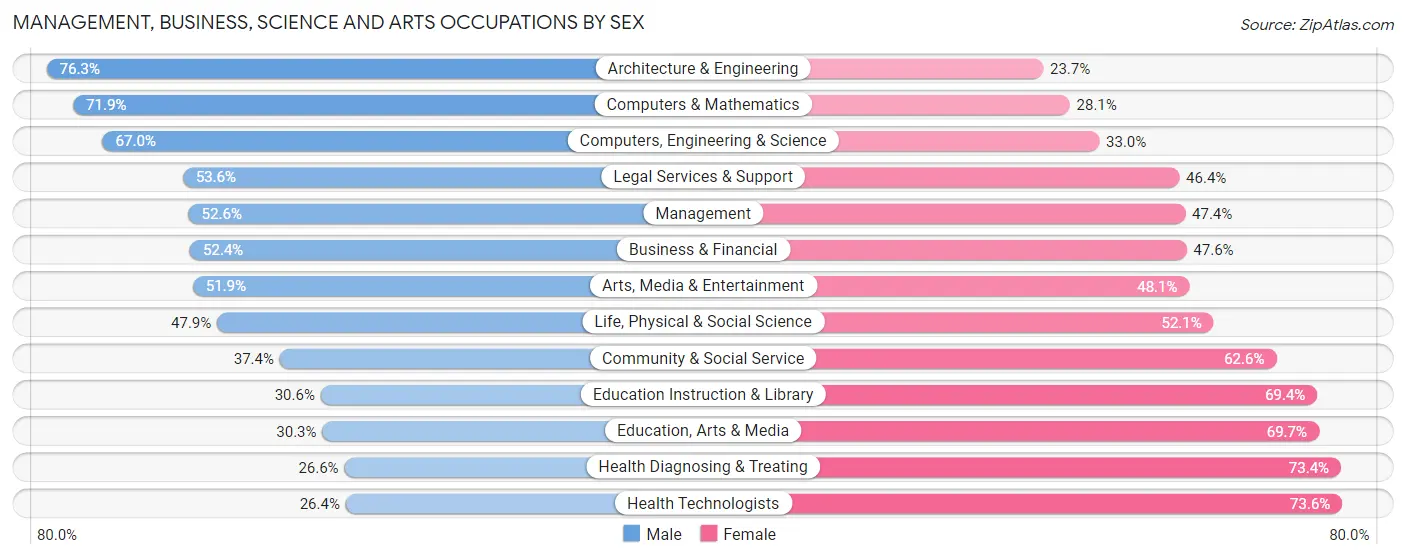
Management, Business, Science and Arts Occupations by Sex
Within the Management, Business, Science and Arts occupations in Area Code 667, the most male-oriented occupations are Architecture & Engineering (76.3%), Computers & Mathematics (71.9%), and Computers, Engineering & Science (67.0%), while the most female-oriented occupations are Health Technologists (73.6%), Health Diagnosing & Treating (73.4%), and Education, Arts & Media (69.7%).
| Occupation | Male | Female |
| Management | 12,846 (52.6%) | 11,566 (47.4%) |
| Business & Financial | 7,575 (52.4%) | 6,882 (47.6%) |
| Computers, Engineering & Science | 12,784 (67.0%) | 6,306 (33.0%) |
| Computers & Mathematics | 7,021 (71.9%) | 2,745 (28.1%) |
| Architecture & Engineering | 3,487 (76.3%) | 1,082 (23.7%) |
| Life, Physical & Social Science | 2,276 (47.9%) | 2,479 (52.1%) |
| Community & Social Service | 11,760 (37.4%) | 19,674 (62.6%) |
| Education, Arts & Media | 1,535 (30.3%) | 3,529 (69.7%) |
| Legal Services & Support | 2,191 (53.6%) | 1,896 (46.4%) |
| Education Instruction & Library | 5,067 (30.6%) | 11,501 (69.4%) |
| Arts, Media & Entertainment | 2,967 (51.9%) | 2,748 (48.1%) |
| Health Diagnosing & Treating | 4,227 (26.6%) | 11,650 (73.4%) |
| Health Technologists | 3,381 (26.4%) | 9,422 (73.6%) |
| Total (Category) | 49,192 (46.7%) | 56,078 (53.3%) |
| Total (Overall) | 103,434 (50.0%) | 103,281 (50.0%) |
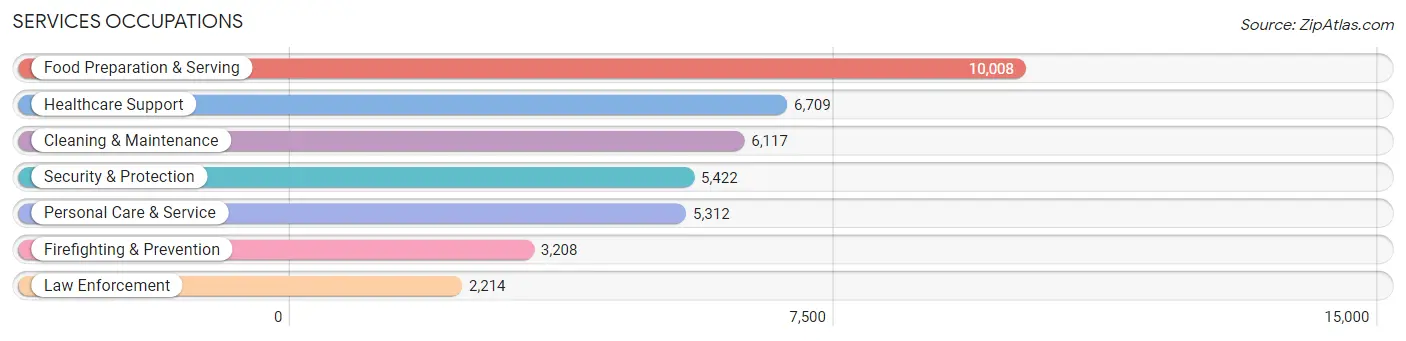
Services Occupations
The most common Services occupations in Area Code 667 are Food Preparation & Serving (10,008 | 4.8%), Healthcare Support (6,709 | 3.3%), Cleaning & Maintenance (6,117 | 3.0%), Security & Protection (5,422 | 2.6%), and Personal Care & Service (5,312 | 2.6%).
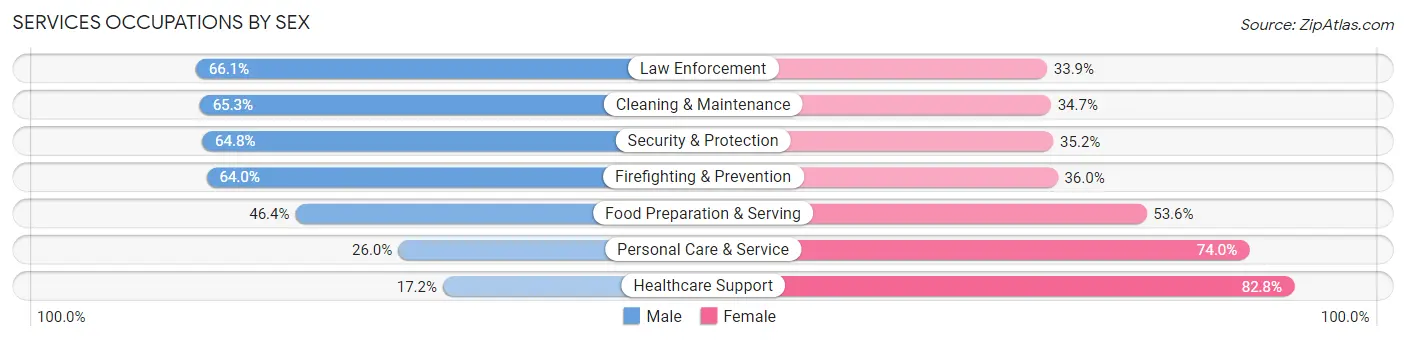
Services Occupations by Sex
Within the Services occupations in Area Code 667, the most male-oriented occupations are Law Enforcement (66.1%), Cleaning & Maintenance (65.3%), and Security & Protection (64.8%), while the most female-oriented occupations are Healthcare Support (82.8%), Personal Care & Service (74.0%), and Food Preparation & Serving (53.6%).
| Occupation | Male | Female |
| Healthcare Support | 1,153 (17.2%) | 5,556 (82.8%) |
| Security & Protection | 3,515 (64.8%) | 1,907 (35.2%) |
| Firefighting & Prevention | 2,052 (64.0%) | 1,156 (36.0%) |
| Law Enforcement | 1,463 (66.1%) | 751 (33.9%) |
| Food Preparation & Serving | 4,643 (46.4%) | 5,365 (53.6%) |
| Cleaning & Maintenance | 3,995 (65.3%) | 2,122 (34.7%) |
| Personal Care & Service | 1,383 (26.0%) | 3,929 (74.0%) |
| Total (Category) | 14,689 (43.8%) | 18,879 (56.2%) |
| Total (Overall) | 103,434 (50.0%) | 103,281 (50.0%) |
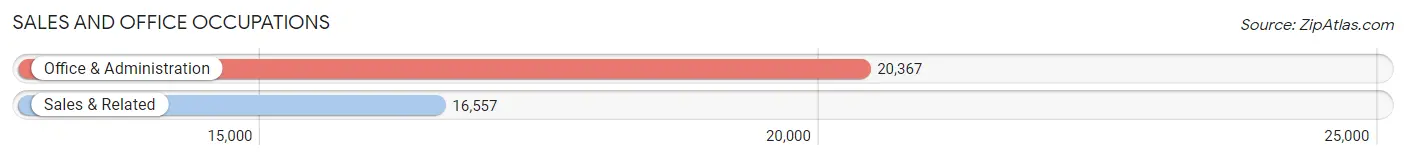
Sales and Office Occupations
The most common Sales and Office occupations in Area Code 667 are Office & Administration (20,367 | 9.9%), and Sales & Related (16,557 | 8.0%).
Sales and Office Occupations by Sex
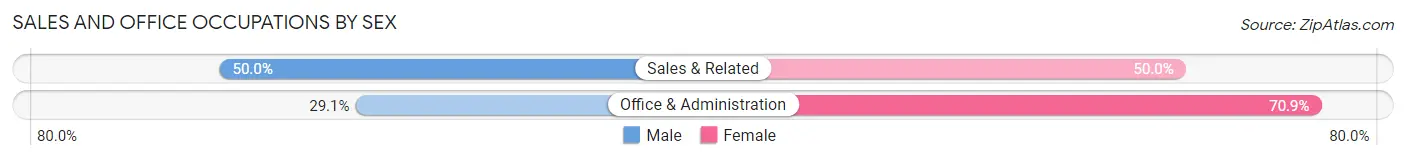
| Occupation | Male | Female |
| Sales & Related | 8,278 (50.0%) | 8,279 (50.0%) |
| Office & Administration | 5,930 (29.1%) | 14,437 (70.9%) |
| Total (Category) | 14,208 (38.5%) | 22,716 (61.5%) |
| Total (Overall) | 103,434 (50.0%) | 103,281 (50.0%) |
Natural Resources, Construction and Maintenance Occupations
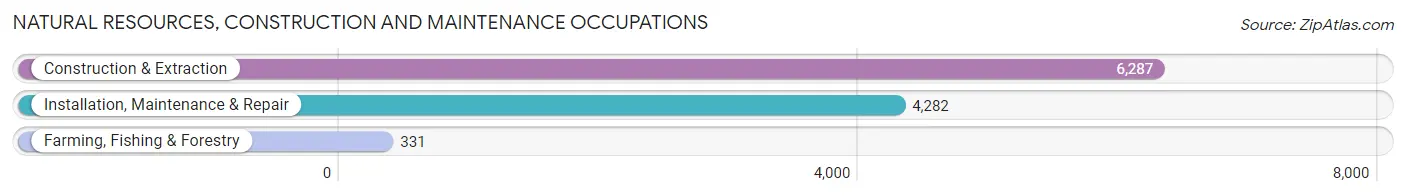
The most common Natural Resources, Construction and Maintenance occupations in Area Code 667 are Construction & Extraction (6,287 | 3.0%), Installation, Maintenance & Repair (4,282 | 2.1%), and Farming, Fishing & Forestry (331 | 0.2%).
Natural Resources, Construction and Maintenance Occupations by Sex
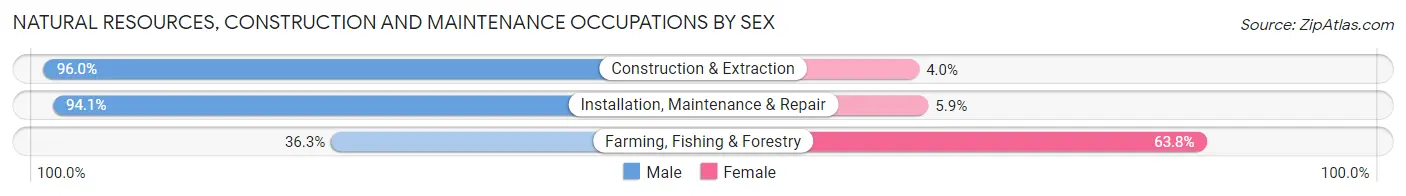
| Occupation | Male | Female |
| Farming, Fishing & Forestry | 120 (36.2%) | 211 (63.7%) |
| Construction & Extraction | 6,035 (96.0%) | 252 (4.0%) |
| Installation, Maintenance & Repair | 4,028 (94.1%) | 254 (5.9%) |
| Total (Category) | 10,183 (93.4%) | 717 (6.6%) |
| Total (Overall) | 103,434 (50.0%) | 103,281 (50.0%) |
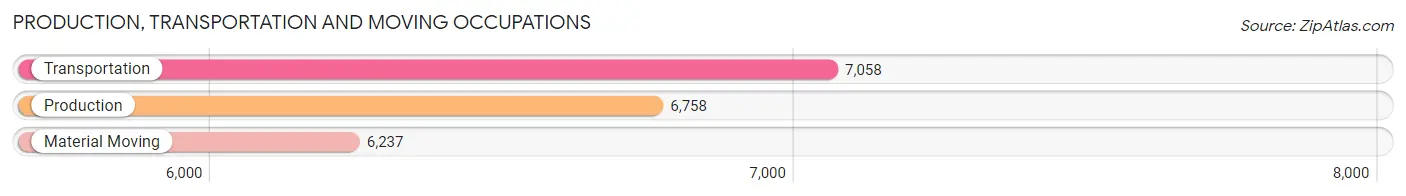
Production, Transportation and Moving Occupations
The most common Production, Transportation and Moving occupations in Area Code 667 are Transportation (7,058 | 3.4%), Production (6,758 | 3.3%), and Material Moving (6,237 | 3.0%).
Production, Transportation and Moving Occupations by Sex
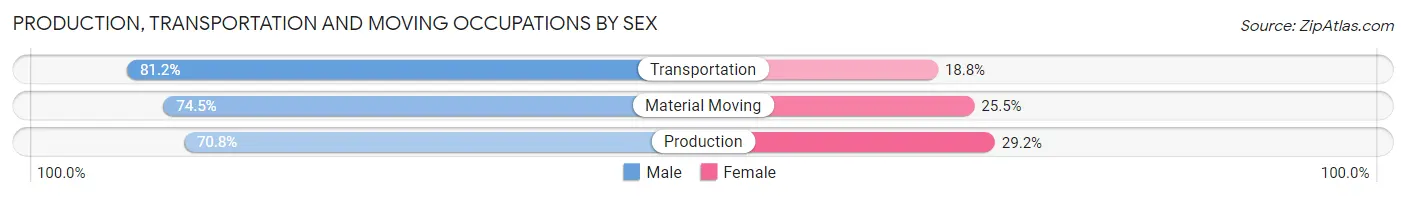
| Occupation | Male | Female |
| Production | 4,782 (70.8%) | 1,976 (29.2%) |
| Transportation | 5,732 (81.2%) | 1,326 (18.8%) |
| Material Moving | 4,648 (74.5%) | 1,589 (25.5%) |
| Total (Category) | 15,162 (75.6%) | 4,891 (24.4%) |
| Total (Overall) | 103,434 (50.0%) | 103,281 (50.0%) |
Employment Industries by Sex in Area Code 667
Employment Industries in Area Code 667
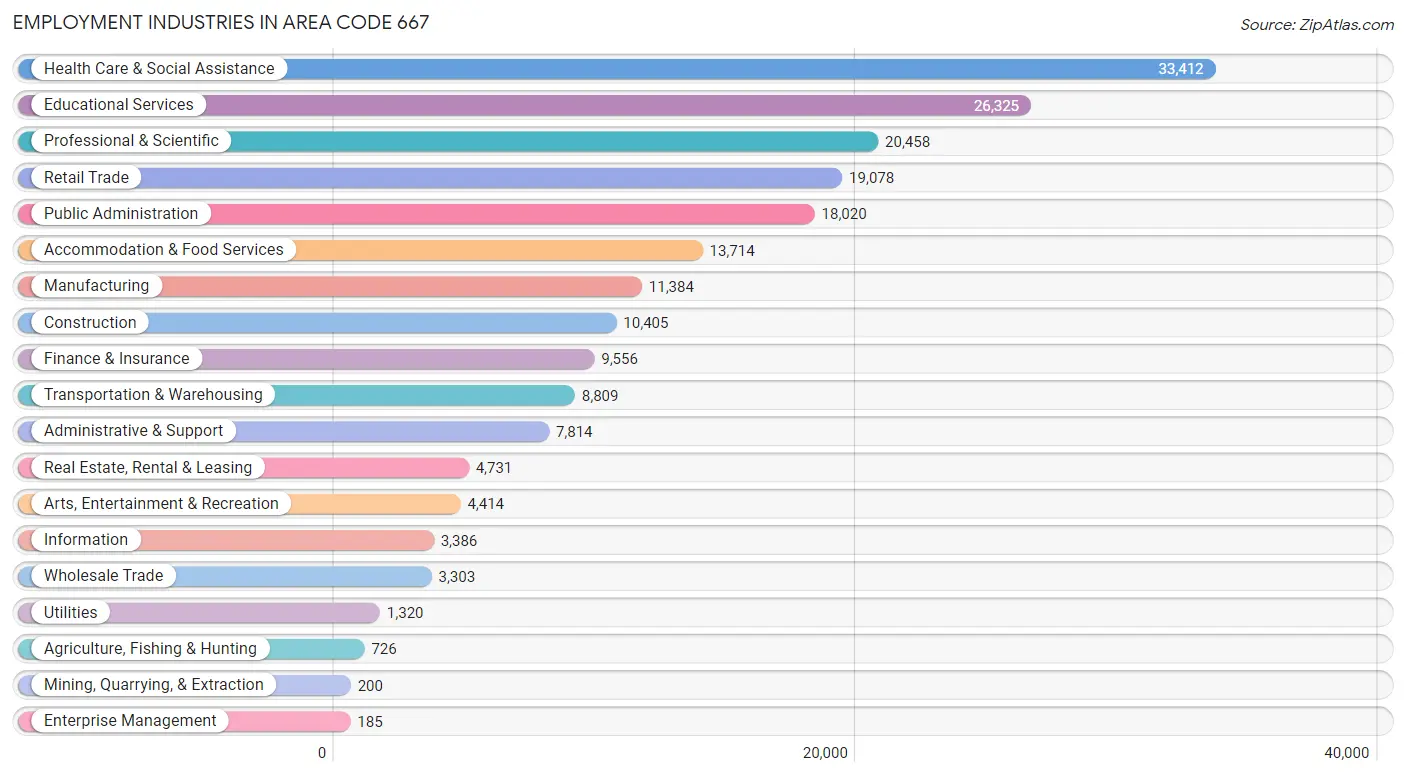
The major employment industries in Area Code 667 include Health Care & Social Assistance (33,412 | 16.2%), Educational Services (26,325 | 12.7%), Professional & Scientific (20,458 | 9.9%), Retail Trade (19,078 | 9.2%), and Public Administration (18,020 | 8.7%).
Employment Industries by Sex in Area Code 667
The Area Code 667 industries that see more men than women are Construction (86.6%), Utilities (81.1%), and Wholesale Trade (75.6%), whereas the industries that tend to have a higher number of women are Health Care & Social Assistance (75.5%), Enterprise Management (72.4%), and Educational Services (64.3%).
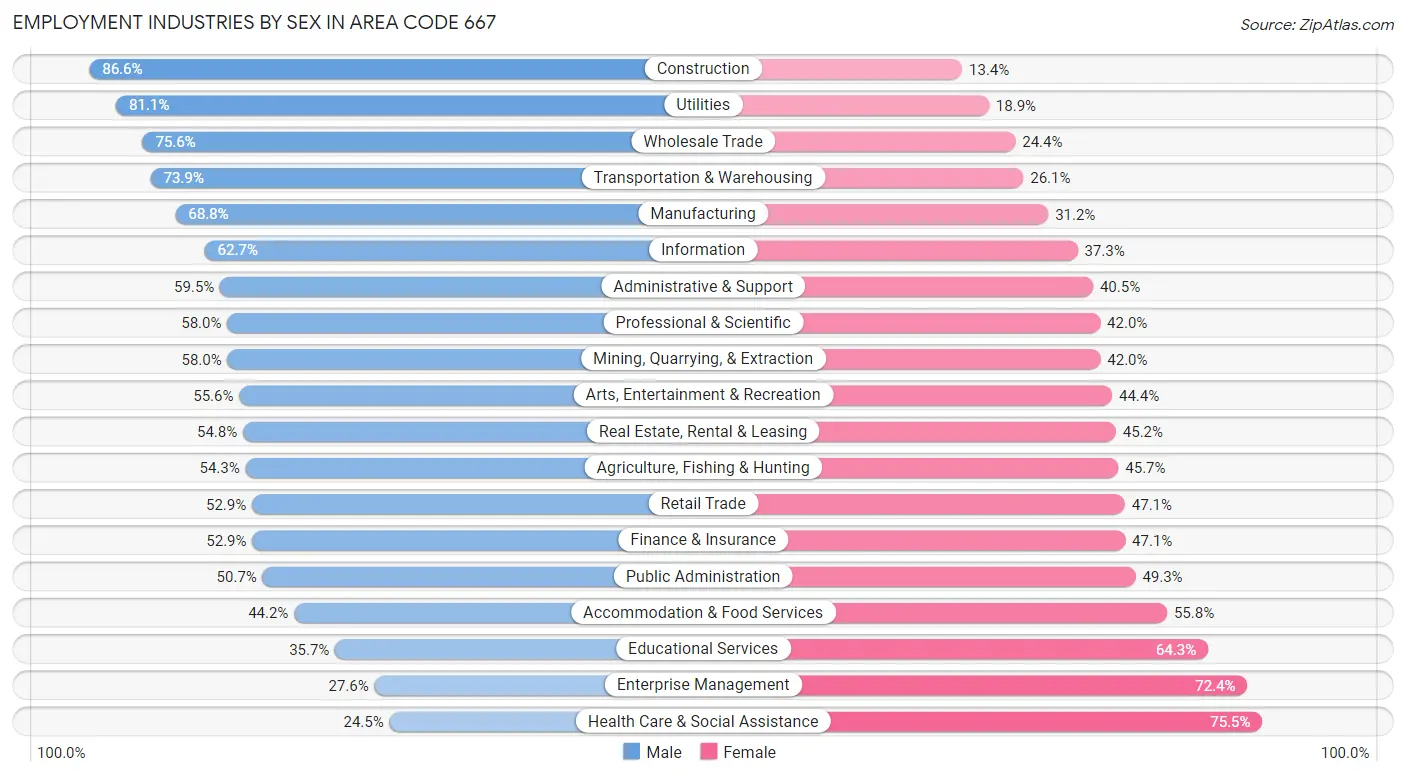
| Industry | Male | Female |
| Agriculture, Fishing & Hunting | 394 (54.3%) | 332 (45.7%) |
| Mining, Quarrying, & Extraction | 116 (58.0%) | 84 (42.0%) |
| Construction | 9,012 (86.6%) | 1,393 (13.4%) |
| Manufacturing | 7,831 (68.8%) | 3,553 (31.2%) |
| Wholesale Trade | 2,497 (75.6%) | 806 (24.4%) |
| Retail Trade | 10,096 (52.9%) | 8,982 (47.1%) |
| Transportation & Warehousing | 6,513 (73.9%) | 2,296 (26.1%) |
| Utilities | 1,070 (81.1%) | 250 (18.9%) |
| Information | 2,124 (62.7%) | 1,262 (37.3%) |
| Finance & Insurance | 5,051 (52.9%) | 4,505 (47.1%) |
| Real Estate, Rental & Leasing | 2,592 (54.8%) | 2,139 (45.2%) |
| Professional & Scientific | 11,873 (58.0%) | 8,585 (42.0%) |
| Enterprise Management | 51 (27.6%) | 134 (72.4%) |
| Administrative & Support | 4,651 (59.5%) | 3,163 (40.5%) |
| Educational Services | 9,400 (35.7%) | 16,925 (64.3%) |
| Health Care & Social Assistance | 8,176 (24.5%) | 25,236 (75.5%) |
| Arts, Entertainment & Recreation | 2,453 (55.6%) | 1,961 (44.4%) |
| Accommodation & Food Services | 6,061 (44.2%) | 7,653 (55.8%) |
| Public Administration | 9,141 (50.7%) | 8,879 (49.3%) |
| Total | 103,434 (50.0%) | 103,281 (50.0%) |
Education in Area Code 667
School Enrollment in Area Code 667
The most common levels of schooling among the 106,465 students in Area Code 667 are college / undergraduate (26,623 | 25.0%), middle school (19,474 | 18.3%), and high school (19,125 | 18.0%).
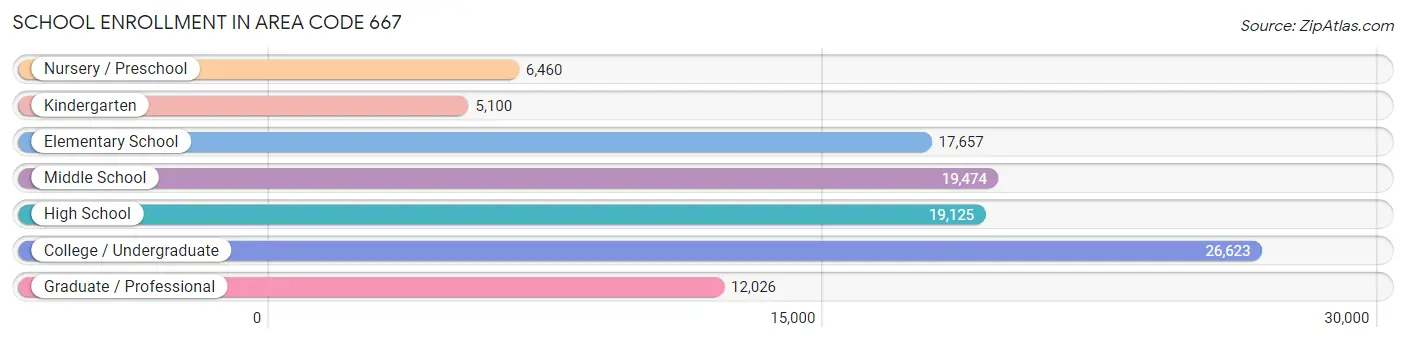
| School Level | # Students | % Students |
| Nursery / Preschool | 6,460 | 6.1% |
| Kindergarten | 5,100 | 4.8% |
| Elementary School | 17,657 | 16.6% |
| Middle School | 19,474 | 18.3% |
| High School | 19,125 | 18.0% |
| College / Undergraduate | 26,623 | 25.0% |
| Graduate / Professional | 12,026 | 11.3% |
| Total | 106,465 | 100.0% |
School Enrollment by Age by Funding Source in Area Code 667
Out of a total of 106,465 students who are enrolled in schools in Area Code 667, 23,653 (22.2%) attend a private institution, while the remaining 82,812 (77.8%) are enrolled in public schools. The age group of 3 to 4 year olds has the highest likelihood of being enrolled in private schools, with 2,225 (38.4% in the age bracket) enrolled. Conversely, the age group of 18 to 19 year olds has the lowest likelihood of being enrolled in a private school, with 7,533 (82.7% in the age bracket) attending a public institution.
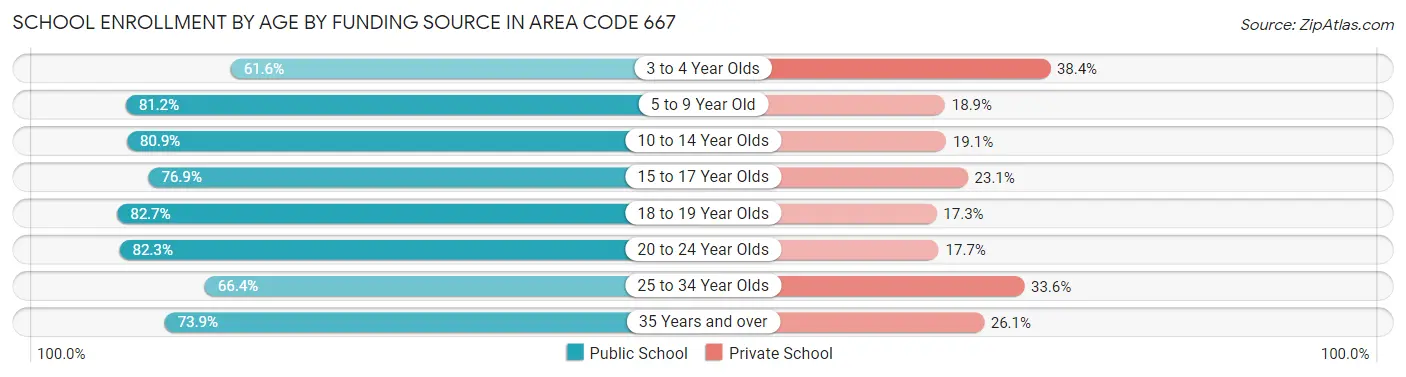
| Age Bracket | Public School | Private School |
| 3 to 4 Year Olds | 3,566 (61.6%) | 2,225 (38.4%) |
| 5 to 9 Year Old | 17,030 (81.1%) | 3,956 (18.9%) |
| 10 to 14 Year Olds | 19,584 (80.9%) | 4,613 (19.1%) |
| 15 to 17 Year Olds | 10,421 (76.9%) | 3,126 (23.1%) |
| 18 to 19 Year Olds | 7,533 (82.7%) | 1,573 (17.3%) |
| 20 to 24 Year Olds | 12,101 (82.3%) | 2,600 (17.7%) |
| 25 to 34 Year Olds | 7,251 (66.4%) | 3,668 (33.6%) |
| 35 Years and over | 5,334 (73.9%) | 1,884 (26.1%) |
| Total | 82,812 (77.8%) | 23,653 (22.2%) |
Educational Attainment by Field of Study in Area Code 667
Business (22,143 | 16.2%), social sciences (13,869 | 10.2%), science & technology (12,928 | 9.5%), education (11,306 | 8.3%), and bio, nature & agricultural (9,955 | 7.3%) are the most common fields of study among 136,544 individuals in Area Code 667 who have obtained a bachelor's degree or higher.
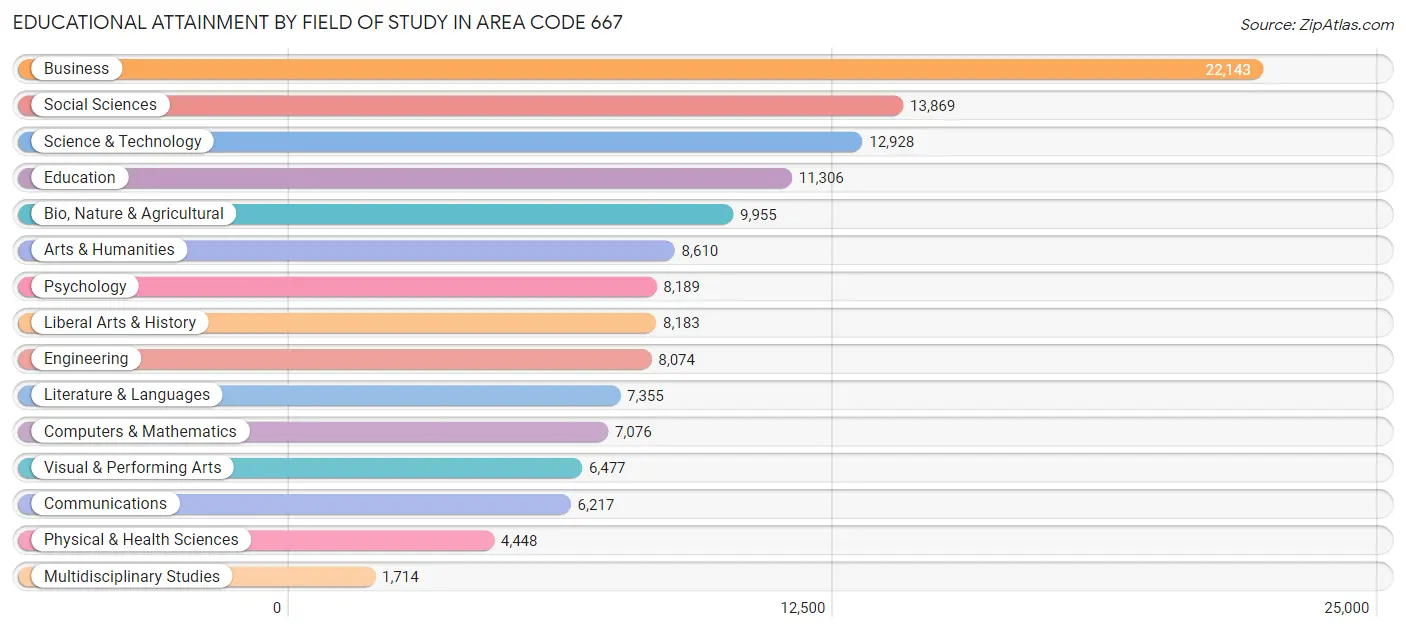
| Field of Study | # Graduates | % Graduates |
| Computers & Mathematics | 7,076 | 5.2% |
| Bio, Nature & Agricultural | 9,955 | 7.3% |
| Physical & Health Sciences | 4,448 | 3.3% |
| Psychology | 8,189 | 6.0% |
| Social Sciences | 13,869 | 10.2% |
| Engineering | 8,074 | 5.9% |
| Multidisciplinary Studies | 1,714 | 1.3% |
| Science & Technology | 12,928 | 9.5% |
| Business | 22,143 | 16.2% |
| Education | 11,306 | 8.3% |
| Literature & Languages | 7,355 | 5.4% |
| Liberal Arts & History | 8,183 | 6.0% |
| Visual & Performing Arts | 6,477 | 4.7% |
| Communications | 6,217 | 4.5% |
| Arts & Humanities | 8,610 | 6.3% |
| Total | 136,544 | 100.0% |
Transportation & Commute in Area Code 667
Vehicle Availability by Sex in Area Code 667
The most prevalent vehicle ownership categories in Area Code 667 are males with 2 vehicles (42,411, accounting for 41.3%) and females with 2 vehicles (37,676, making up 42.2%).
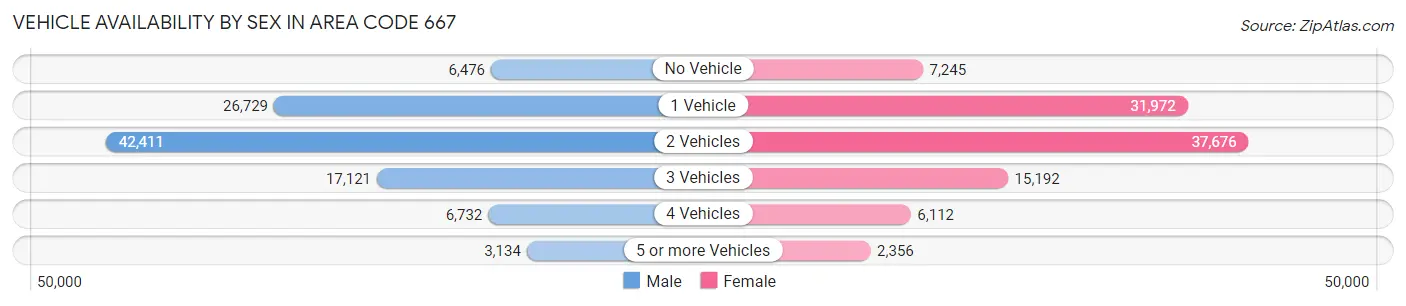
| Vehicles Available | Male | Female |
| No Vehicle | 6,476 (6.3%) | 7,245 (7.2%) |
| 1 Vehicle | 26,729 (26.1%) | 31,972 (31.8%) |
| 2 Vehicles | 42,411 (41.3%) | 37,676 (37.5%) |
| 3 Vehicles | 17,121 (16.7%) | 15,192 (15.1%) |
| 4 Vehicles | 6,732 (6.6%) | 6,112 (6.1%) |
| 5 or more Vehicles | 3,134 (3.0%) | 2,356 (2.3%) |
| Total | 102,603 (100.0%) | 100,553 (100.0%) |
Commute Time in Area Code 667
The most frequently occuring commute durations in Area Code 667 are 15 to 19 minutes (28,859 commuters, 16.3%), 30 to 34 minutes (24,822 commuters, 14.0%), and 20 to 24 minutes (24,656 commuters, 13.9%).
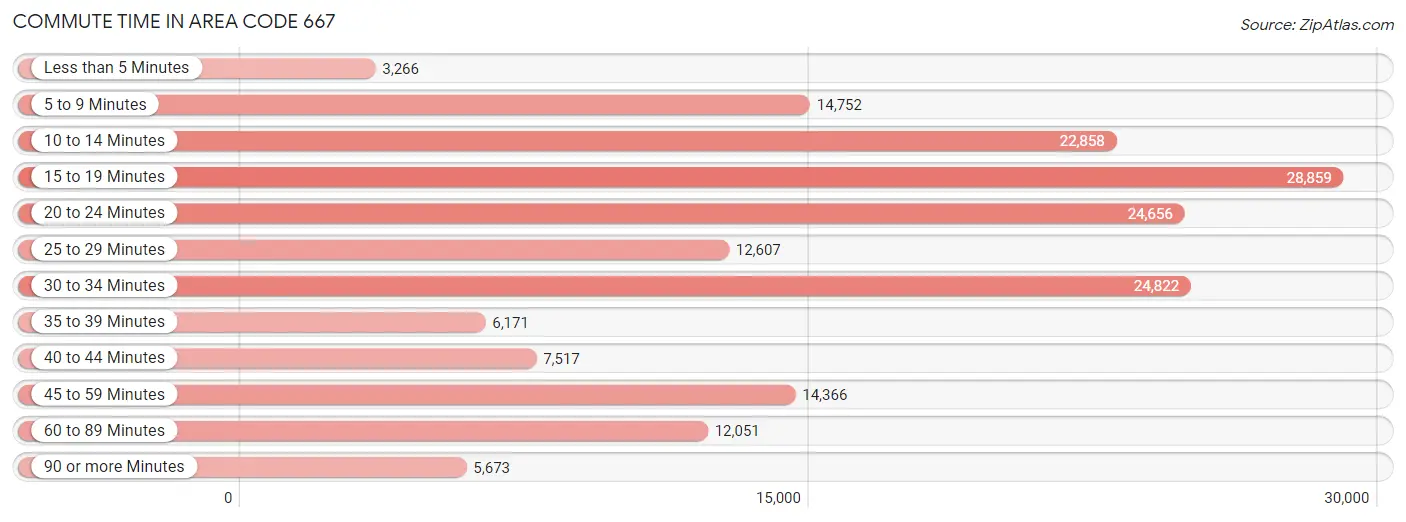
| Commute Time | # Commuters | % Commuters |
| Less than 5 Minutes | 3,266 | 1.8% |
| 5 to 9 Minutes | 14,752 | 8.3% |
| 10 to 14 Minutes | 22,858 | 12.9% |
| 15 to 19 Minutes | 28,859 | 16.3% |
| 20 to 24 Minutes | 24,656 | 13.9% |
| 25 to 29 Minutes | 12,607 | 7.1% |
| 30 to 34 Minutes | 24,822 | 14.0% |
| 35 to 39 Minutes | 6,171 | 3.5% |
| 40 to 44 Minutes | 7,517 | 4.2% |
| 45 to 59 Minutes | 14,366 | 8.1% |
| 60 to 89 Minutes | 12,051 | 6.8% |
| 90 or more Minutes | 5,673 | 3.2% |
Commute Time by Sex in Area Code 667
The most common commute times in Area Code 667 are 15 to 19 minutes (13,129 commuters, 14.5%) for males and 15 to 19 minutes (15,730 commuters, 18.1%) for females.
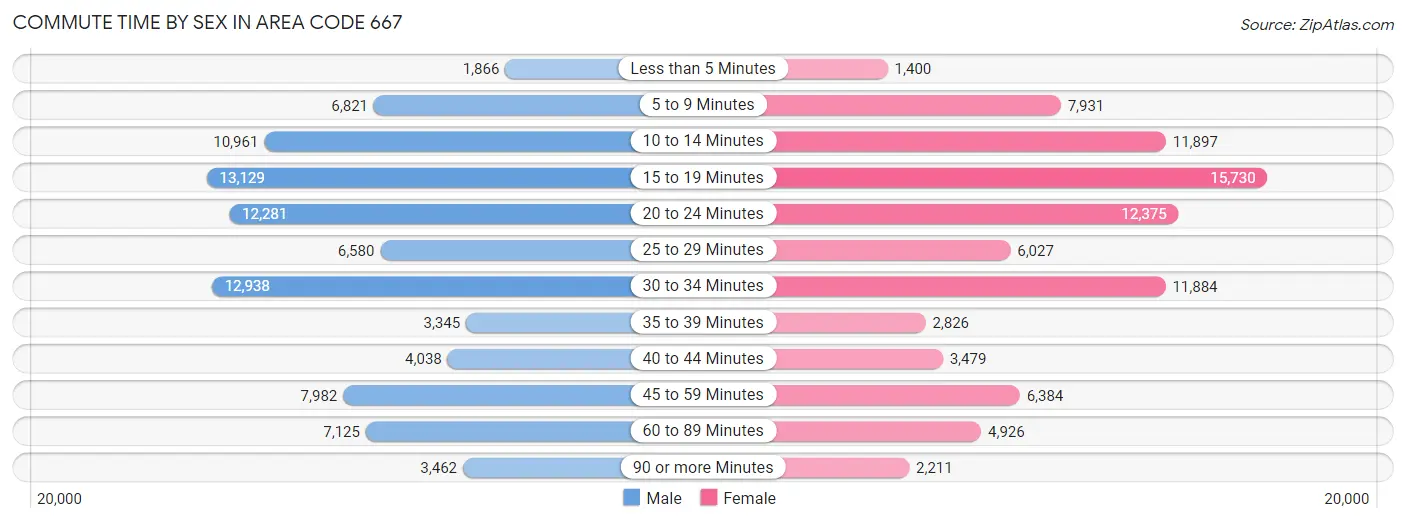
| Commute Time | Male | Female |
| Less than 5 Minutes | 1,866 (2.1%) | 1,400 (1.6%) |
| 5 to 9 Minutes | 6,821 (7.5%) | 7,931 (9.1%) |
| 10 to 14 Minutes | 10,961 (12.1%) | 11,897 (13.7%) |
| 15 to 19 Minutes | 13,129 (14.5%) | 15,730 (18.1%) |
| 20 to 24 Minutes | 12,281 (13.6%) | 12,375 (14.2%) |
| 25 to 29 Minutes | 6,580 (7.3%) | 6,027 (6.9%) |
| 30 to 34 Minutes | 12,938 (14.3%) | 11,884 (13.7%) |
| 35 to 39 Minutes | 3,345 (3.7%) | 2,826 (3.3%) |
| 40 to 44 Minutes | 4,038 (4.5%) | 3,479 (4.0%) |
| 45 to 59 Minutes | 7,982 (8.8%) | 6,384 (7.3%) |
| 60 to 89 Minutes | 7,125 (7.9%) | 4,926 (5.7%) |
| 90 or more Minutes | 3,462 (3.8%) | 2,211 (2.5%) |
Time of Departure to Work by Sex in Area Code 667
The most frequent times of departure to work in Area Code 667 are 7:00 AM to 7:29 AM (11,585, 12.8%) for males and 7:00 AM to 7:29 AM (12,645, 14.5%) for females.
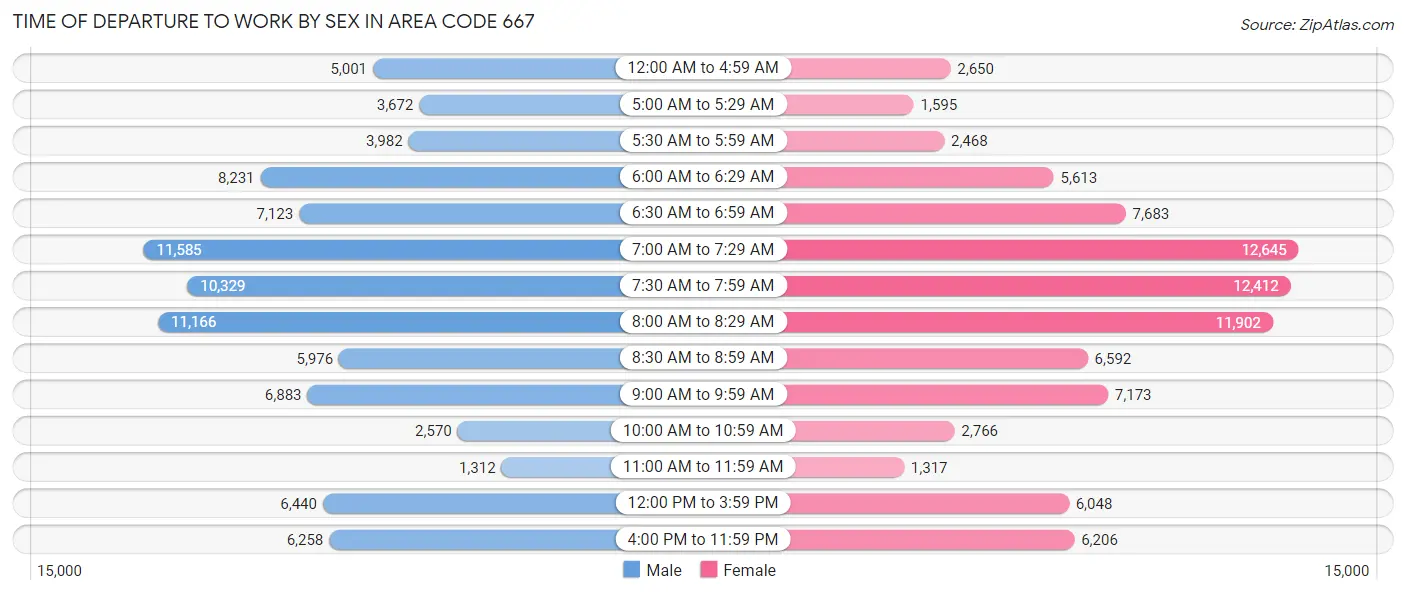
| Time of Departure | Male | Female |
| 12:00 AM to 4:59 AM | 5,001 (5.5%) | 2,650 (3.0%) |
| 5:00 AM to 5:29 AM | 3,672 (4.1%) | 1,595 (1.8%) |
| 5:30 AM to 5:59 AM | 3,982 (4.4%) | 2,468 (2.8%) |
| 6:00 AM to 6:29 AM | 8,231 (9.1%) | 5,613 (6.5%) |
| 6:30 AM to 6:59 AM | 7,123 (7.9%) | 7,683 (8.8%) |
| 7:00 AM to 7:29 AM | 11,585 (12.8%) | 12,645 (14.5%) |
| 7:30 AM to 7:59 AM | 10,329 (11.4%) | 12,412 (14.3%) |
| 8:00 AM to 8:29 AM | 11,166 (12.3%) | 11,902 (13.7%) |
| 8:30 AM to 8:59 AM | 5,976 (6.6%) | 6,592 (7.6%) |
| 9:00 AM to 9:59 AM | 6,883 (7.6%) | 7,173 (8.2%) |
| 10:00 AM to 10:59 AM | 2,570 (2.8%) | 2,766 (3.2%) |
| 11:00 AM to 11:59 AM | 1,312 (1.5%) | 1,317 (1.5%) |
| 12:00 PM to 3:59 PM | 6,440 (7.1%) | 6,048 (7.0%) |
| 4:00 PM to 11:59 PM | 6,258 (6.9%) | 6,206 (7.1%) |
| Total | 90,528 (100.0%) | 87,070 (100.0%) |
Housing Occupancy in Area Code 667
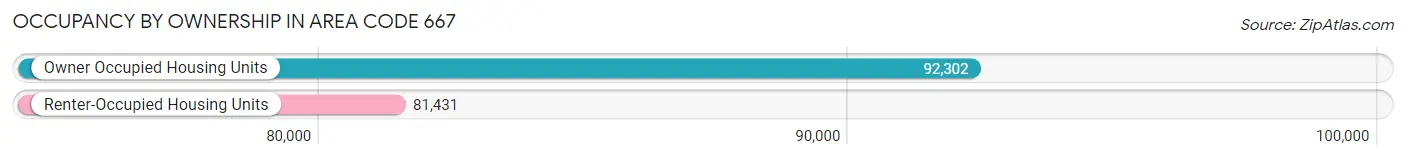
Occupancy by Ownership in Area Code 667
Of the total 173,733 dwellings in Area Code 667, owner-occupied units account for 92,302 (53.1%), while renter-occupied units make up 81,431 (46.9%).
| Occupancy | # Housing Units | % Housing Units |
| Owner Occupied Housing Units | 92,302 | 53.1% |
| Renter-Occupied Housing Units | 81,431 | 46.9% |
| Total Occupied Housing Units | 173,733 | 100.0% |
Occupancy by Household Size in Area Code 667
| Household Size | # Housing Units | % Housing Units |
| 1-Person Household | 64,281 | 37.0% |
| 2-Person Household | 56,153 | 32.3% |
| 3-Person Household | 23,731 | 13.7% |
| 4+ Person Household | 29,568 | 17.0% |
| Total Housing Units | 173,733 | 100.0% |
Occupancy by Ownership by Household Size in Area Code 667
| Household Size | Owner-occupied | Renter-occupied |
| 1-Person Household | 25,352 (39.4%) | 38,929 (60.6%) |
| 2-Person Household | 33,040 (58.8%) | 23,113 (41.2%) |
| 3-Person Household | 14,582 (61.5%) | 9,149 (38.6%) |
| 4+ Person Household | 19,328 (65.4%) | 10,240 (34.6%) |
| Total Housing Units | 92,302 (53.1%) | 81,431 (46.9%) |
Occupancy by Educational Attainment in Area Code 667
| Household Size | Owner-occupied | Renter-occupied |
| Less than High School | 4,648 (34.0%) | 9,017 (66.0%) |
| High School Diploma | 13,965 (44.3%) | 17,544 (55.7%) |
| College/Associate Degree | 22,516 (48.5%) | 23,949 (51.5%) |
| Bachelor's Degree or higher | 51,173 (62.3%) | 30,921 (37.7%) |
Occupancy by Age of Householder in Area Code 667
| Age Bracket | # Households | % Households |
| Under 35 Years | 42,919 | 24.7% |
| 35 to 44 Years | 28,101 | 16.2% |
| 45 to 54 Years | 26,787 | 15.4% |
| 55 to 64 Years | 31,516 | 18.1% |
| 65 to 74 Years | 25,450 | 14.6% |
| 75 to 84 Years | 12,661 | 7.3% |
| 85 Years and Over | 6,299 | 3.6% |
| Total | 173,733 | 100.0% |
Housing Finances in Area Code 667
Median Income by Occupancy in Area Code 667
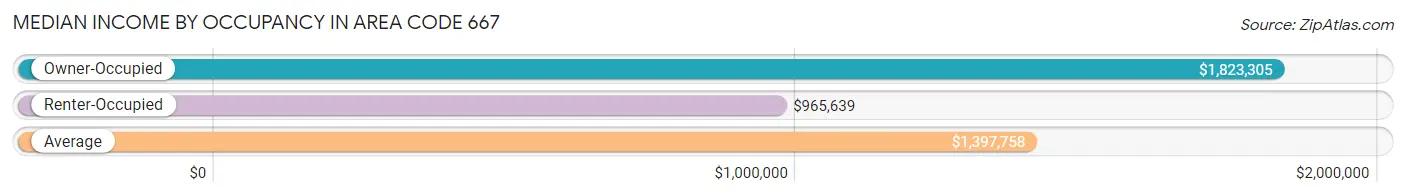
| Occupancy Type | # Households | Median Income |
| Owner-Occupied | 92,302 (53.1%) | $1,823,305 |
| Renter-Occupied | 81,431 (46.9%) | $965,639 |
| Average | 173,733 (100.0%) | $1,397,758 |
Occupancy by Householder Income Bracket in Area Code 667
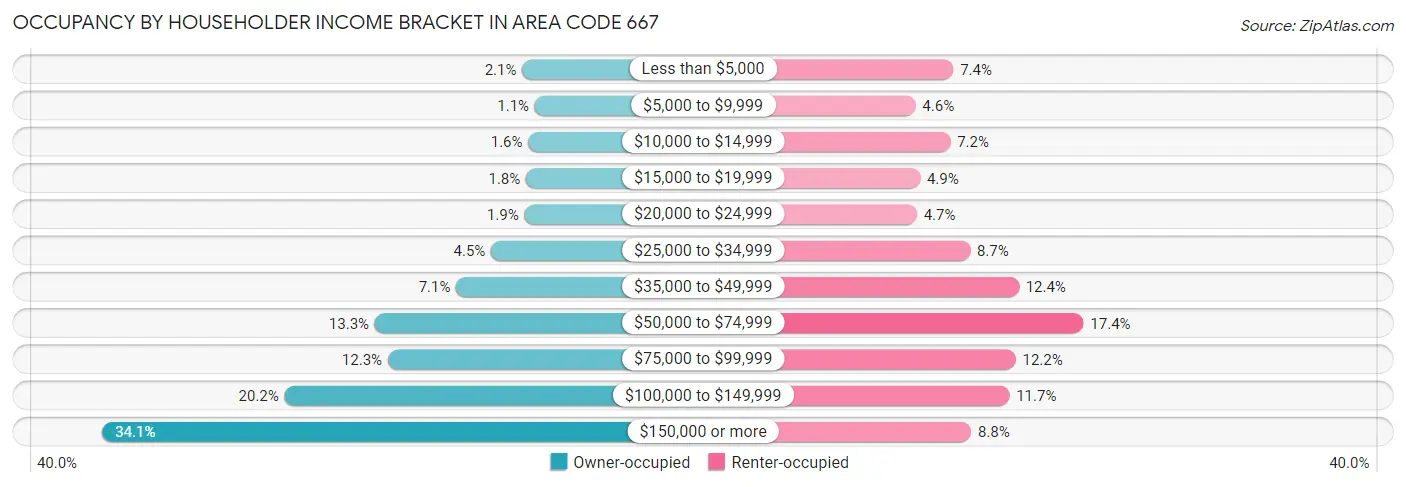
| Income Bracket | Owner-occupied | Renter-occupied |
| Less than $5,000 | 1,916 (2.1%) | 6,060 (7.4%) |
| $5,000 to $9,999 | 1,035 (1.1%) | 3,713 (4.6%) |
| $10,000 to $14,999 | 1,497 (1.6%) | 5,873 (7.2%) |
| $15,000 to $19,999 | 1,649 (1.8%) | 3,998 (4.9%) |
| $20,000 to $24,999 | 1,763 (1.9%) | 3,798 (4.7%) |
| $25,000 to $34,999 | 4,110 (4.4%) | 7,104 (8.7%) |
| $35,000 to $49,999 | 6,567 (7.1%) | 10,122 (12.4%) |
| $50,000 to $74,999 | 12,288 (13.3%) | 14,134 (17.4%) |
| $75,000 to $99,999 | 11,372 (12.3%) | 9,930 (12.2%) |
| $100,000 to $149,999 | 18,639 (20.2%) | 9,532 (11.7%) |
| $150,000 or more | 31,466 (34.1%) | 7,167 (8.8%) |
| Total | 92,302 (100.0%) | 81,431 (100.0%) |
Monthly Housing Cost Tiers in Area Code 667
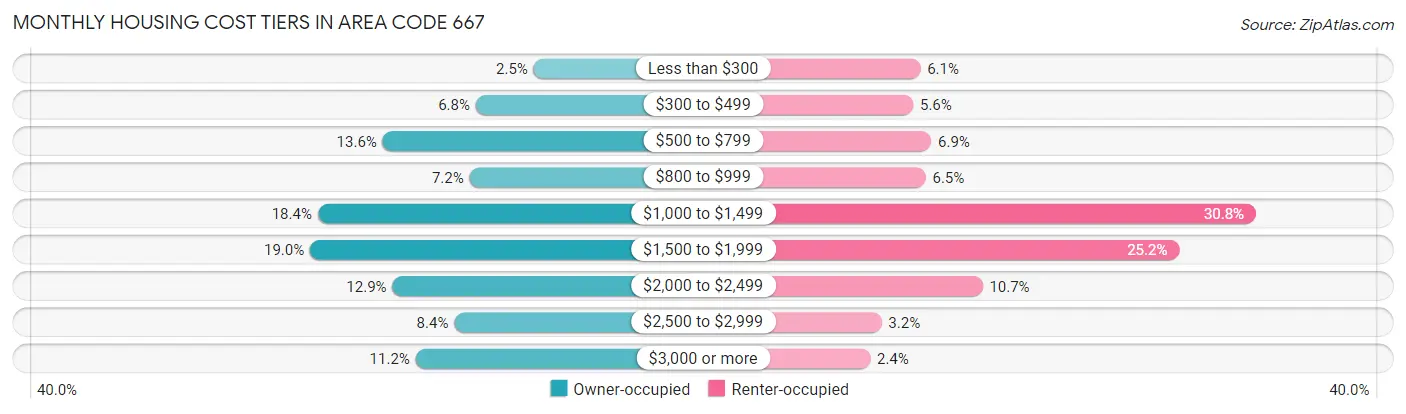
| Monthly Cost | Owner-occupied | Renter-occupied |
| Less than $300 | 2,321 (2.5%) | 4,967 (6.1%) |
| $300 to $499 | 6,253 (6.8%) | 4,538 (5.6%) |
| $500 to $799 | 12,582 (13.6%) | 5,619 (6.9%) |
| $800 to $999 | 6,670 (7.2%) | 5,282 (6.5%) |
| $1,000 to $1,499 | 16,991 (18.4%) | 25,095 (30.8%) |
| $1,500 to $1,999 | 17,517 (19.0%) | 20,496 (25.2%) |
| $2,000 to $2,499 | 11,915 (12.9%) | 8,695 (10.7%) |
| $2,500 to $2,999 | 7,719 (8.4%) | 2,638 (3.2%) |
| $3,000 or more | 10,334 (11.2%) | 1,953 (2.4%) |
| Total | 92,302 (100.0%) | 81,431 (100.0%) |
Physical Housing Characteristics in Area Code 667
Housing Structures in Area Code 667
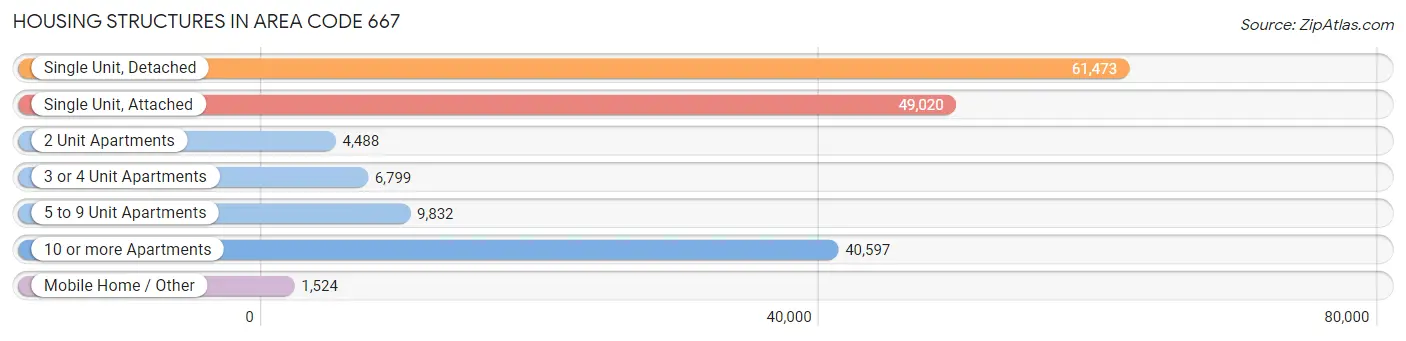
| Structure Type | # Housing Units | % Housing Units |
| Single Unit, Detached | 61,473 | 35.4% |
| Single Unit, Attached | 49,020 | 28.2% |
| 2 Unit Apartments | 4,488 | 2.6% |
| 3 or 4 Unit Apartments | 6,799 | 3.9% |
| 5 to 9 Unit Apartments | 9,832 | 5.7% |
| 10 or more Apartments | 40,597 | 23.4% |
| Mobile Home / Other | 1,524 | 0.9% |
| Total | 173,733 | 100.0% |
Housing Structures by Occupancy in Area Code 667
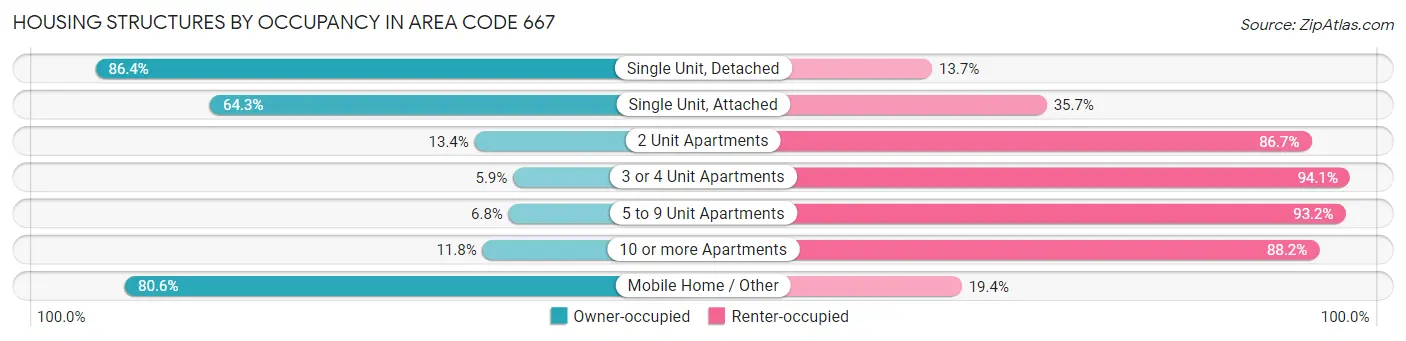
| Structure Type | Owner-occupied | Renter-occupied |
| Single Unit, Detached | 53,083 (86.4%) | 8,390 (13.7%) |
| Single Unit, Attached | 31,511 (64.3%) | 17,509 (35.7%) |
| 2 Unit Apartments | 599 (13.4%) | 3,889 (86.7%) |
| 3 or 4 Unit Apartments | 404 (5.9%) | 6,395 (94.1%) |
| 5 to 9 Unit Apartments | 668 (6.8%) | 9,164 (93.2%) |
| 10 or more Apartments | 4,808 (11.8%) | 35,789 (88.2%) |
| Mobile Home / Other | 1,229 (80.6%) | 295 (19.4%) |
| Total | 92,302 (53.1%) | 81,431 (46.9%) |
Housing Structures by Number of Rooms in Area Code 667
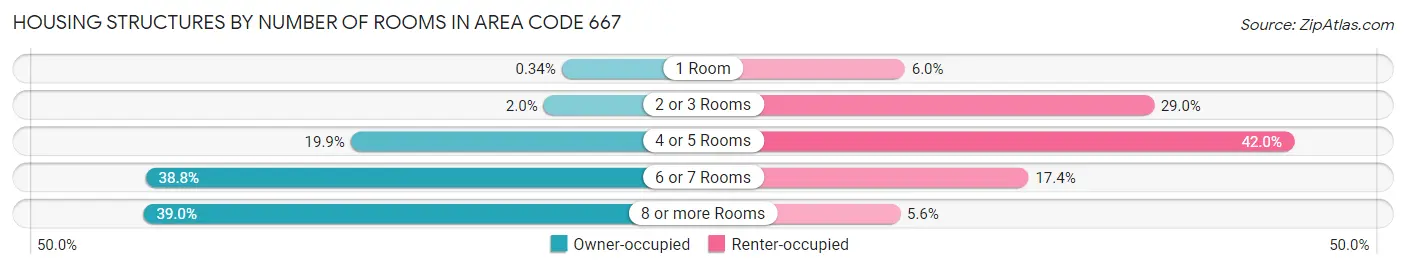
| Number of Rooms | Owner-occupied | Renter-occupied |
| 1 Room | 314 (0.3%) | 4,887 (6.0%) |
| 2 or 3 Rooms | 1,854 (2.0%) | 23,634 (29.0%) |
| 4 or 5 Rooms | 18,320 (19.9%) | 34,179 (42.0%) |
| 6 or 7 Rooms | 35,812 (38.8%) | 14,205 (17.4%) |
| 8 or more Rooms | 36,002 (39.0%) | 4,526 (5.6%) |
| Total | 92,302 (100.0%) | 81,431 (100.0%) |
Housing Structure by Heating Type in Area Code 667
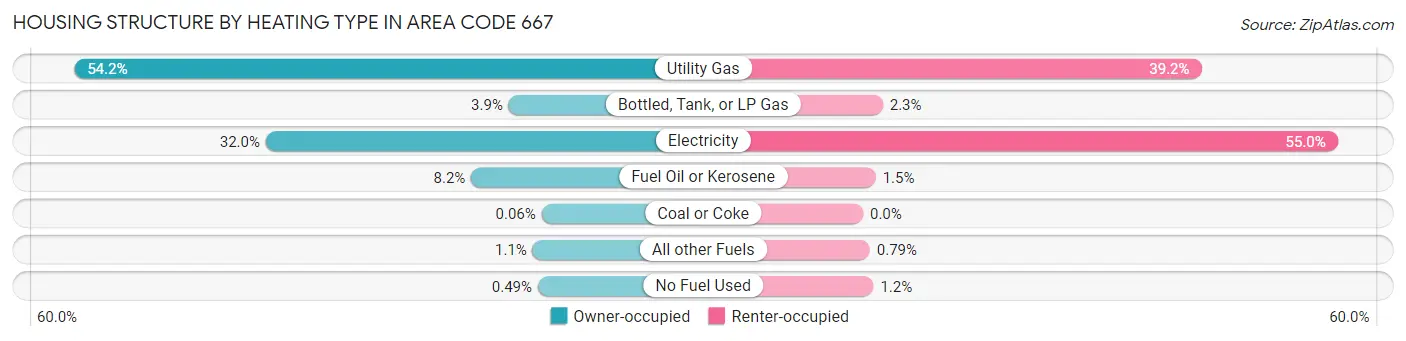
| Heating Type | Owner-occupied | Renter-occupied |
| Utility Gas | 50,067 (54.2%) | 31,941 (39.2%) |
| Bottled, Tank, or LP Gas | 3,570 (3.9%) | 1,866 (2.3%) |
| Electricity | 29,571 (32.0%) | 44,801 (55.0%) |
| Fuel Oil or Kerosene | 7,583 (8.2%) | 1,195 (1.5%) |
| Coal or Coke | 53 (0.1%) | 0 (0.0%) |
| All other Fuels | 1,007 (1.1%) | 642 (0.8%) |
| No Fuel Used | 451 (0.5%) | 986 (1.2%) |
| Total | 92,302 (100.0%) | 81,431 (100.0%) |
Household Vehicle Usage in Area Code 667
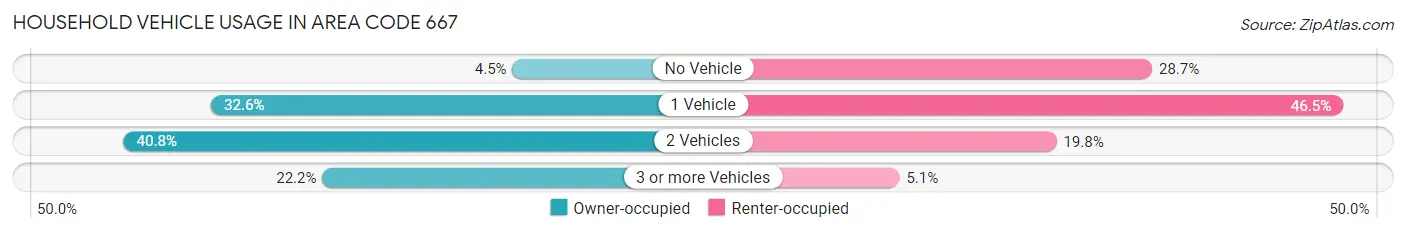
| Vehicles per Household | Owner-occupied | Renter-occupied |
| No Vehicle | 4,117 (4.5%) | 23,345 (28.7%) |
| 1 Vehicle | 30,073 (32.6%) | 37,863 (46.5%) |
| 2 Vehicles | 37,613 (40.7%) | 16,082 (19.8%) |
| 3 or more Vehicles | 20,499 (22.2%) | 4,141 (5.1%) |
| Total | 92,302 (100.0%) | 81,431 (100.0%) |
Real Estate & Mortgages in Area Code 667
Real Estate and Mortgage Overview in Area Code 667
| Characteristic | Without Mortgage | With Mortgage |
| Housing Units | 29,314 | 62,988 |
| Median Property Value | $4,119,600 | $5,145,900 |
| Median Household Income | $1,276,534 | $24,769 |
| Monthly Housing Costs | $11,542 | $10,113 |
| Real Estate Taxes | $58,347 | $2,023 |
Property Value by Mortgage Status in Area Code 667
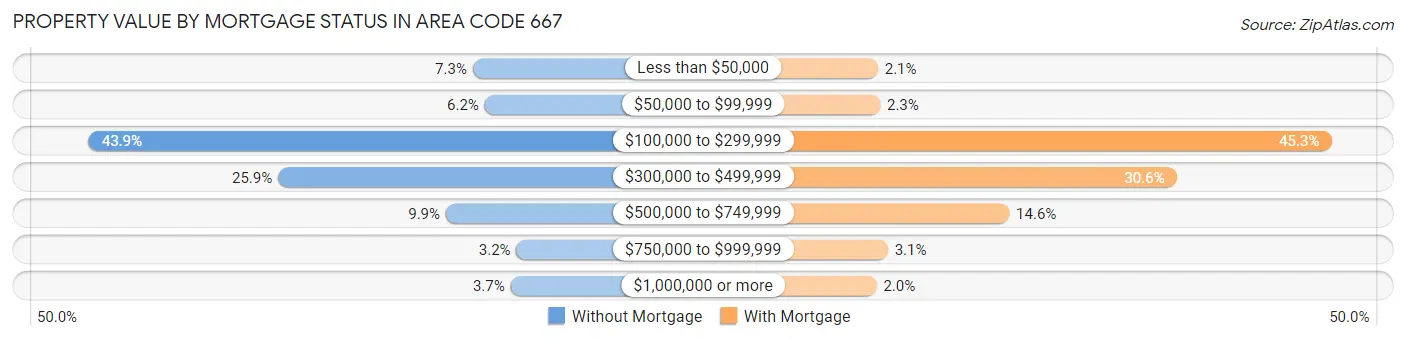
| Property Value | Without Mortgage | With Mortgage |
| Less than $50,000 | 2,147 (7.3%) | 1,337 (2.1%) |
| $50,000 to $99,999 | 1,811 (6.2%) | 1,470 (2.3%) |
| $100,000 to $299,999 | 12,862 (43.9%) | 28,533 (45.3%) |
| $300,000 to $499,999 | 7,580 (25.9%) | 19,251 (30.6%) |
| $500,000 to $749,999 | 2,897 (9.9%) | 9,215 (14.6%) |
| $750,000 to $999,999 | 926 (3.2%) | 1,927 (3.1%) |
| $1,000,000 or more | 1,091 (3.7%) | 1,255 (2.0%) |
| Total | 29,314 (100.0%) | 62,988 (100.0%) |
Household Income by Mortgage Status in Area Code 667
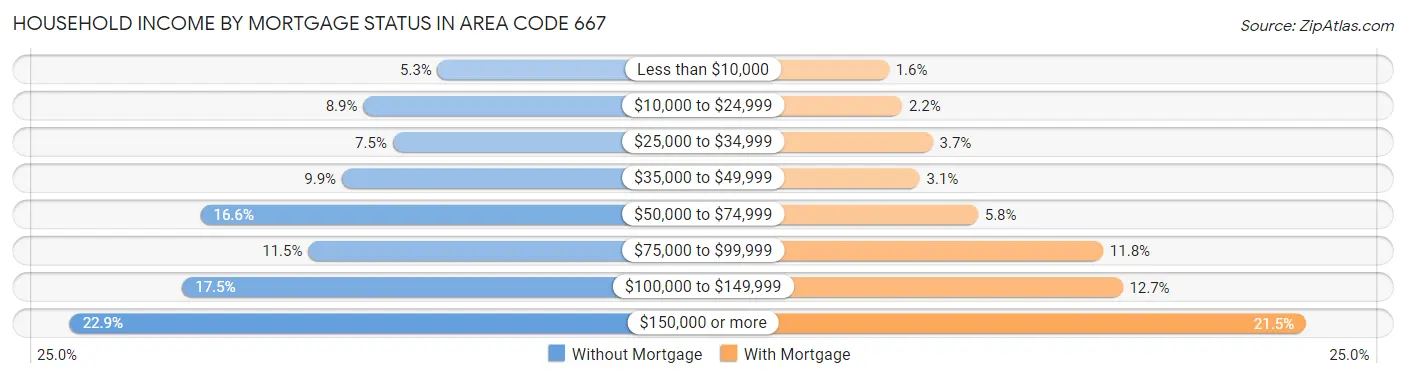
| Household Income | Without Mortgage | With Mortgage |
| Less than $10,000 | 1,562 (5.3%) | 993 (1.6%) |
| $10,000 to $24,999 | 2,599 (8.9%) | 1,389 (2.2%) |
| $25,000 to $34,999 | 2,191 (7.5%) | 2,310 (3.7%) |
| $35,000 to $49,999 | 2,900 (9.9%) | 1,919 (3.0%) |
| $50,000 to $74,999 | 4,871 (16.6%) | 3,667 (5.8%) |
| $75,000 to $99,999 | 3,367 (11.5%) | 7,417 (11.8%) |
| $100,000 to $149,999 | 5,127 (17.5%) | 8,005 (12.7%) |
| $150,000 or more | 6,697 (22.9%) | 13,512 (21.4%) |
| Total | 29,314 (100.0%) | 62,988 (100.0%) |
Property Value to Household Income Ratio in Area Code 667
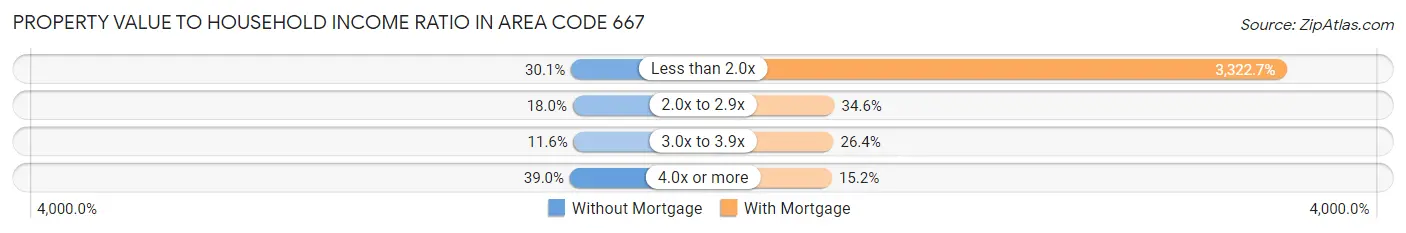
| Value-to-Income Ratio | Without Mortgage | With Mortgage |
| Less than 2.0x | 8,816 (30.1%) | 2,092,888 (3,322.7%) |
| 2.0x to 2.9x | 5,269 (18.0%) | 21,762 (34.5%) |
| 3.0x to 3.9x | 3,391 (11.6%) | 16,620 (26.4%) |
| 4.0x or more | 11,423 (39.0%) | 9,560 (15.2%) |
| Total | 29,314 (100.0%) | 62,988 (100.0%) |
Real Estate Taxes by Mortgage Status in Area Code 667
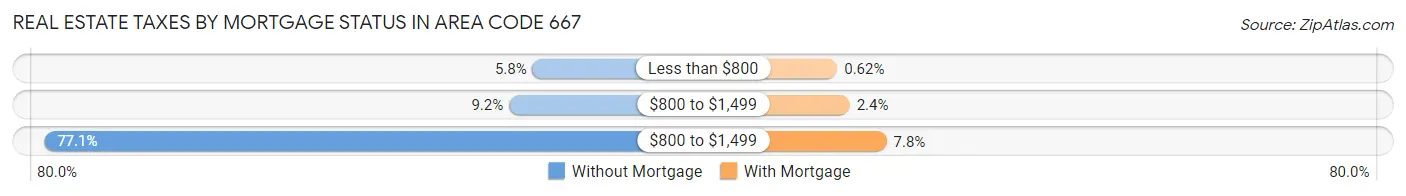
| Property Taxes | Without Mortgage | With Mortgage |
| Less than $800 | 1,695 (5.8%) | 390 (0.6%) |
| $800 to $1,499 | 2,699 (9.2%) | 1,539 (2.4%) |
| $800 to $1,499 | 22,610 (77.1%) | 4,925 (7.8%) |
| Total | 29,314 (100.0%) | 62,988 (100.0%) |
Health & Disability in Area Code 667
Health Insurance Coverage by Age in Area Code 667
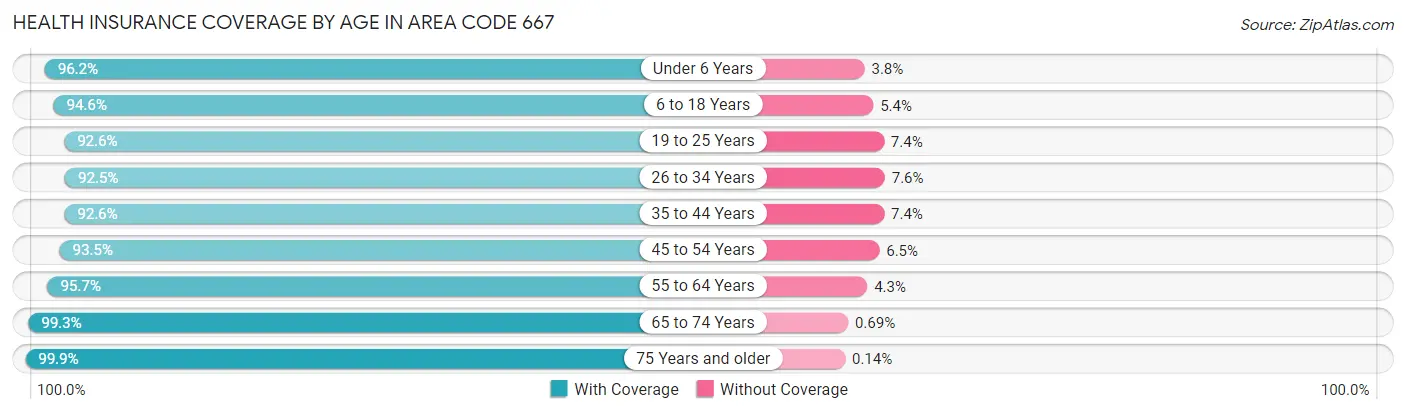
| Age Bracket | With Coverage | Without Coverage |
| Under 6 Years | 26,540 (96.2%) | 1,042 (3.8%) |
| 6 to 18 Years | 59,126 (94.6%) | 3,375 (5.4%) |
| 19 to 25 Years | 39,165 (92.6%) | 3,126 (7.4%) |
| 26 to 34 Years | 57,204 (92.4%) | 4,672 (7.5%) |
| 35 to 44 Years | 46,006 (92.6%) | 3,685 (7.4%) |
| 45 to 54 Years | 44,422 (93.5%) | 3,097 (6.5%) |
| 55 to 64 Years | 48,580 (95.7%) | 2,168 (4.3%) |
| 65 to 74 Years | 37,542 (99.3%) | 259 (0.7%) |
| 75 Years and older | 26,644 (99.9%) | 38 (0.1%) |
| Total | 385,229 (94.7%) | 21,462 (5.3%) |
Health Insurance Coverage by Citizenship Status in Area Code 667
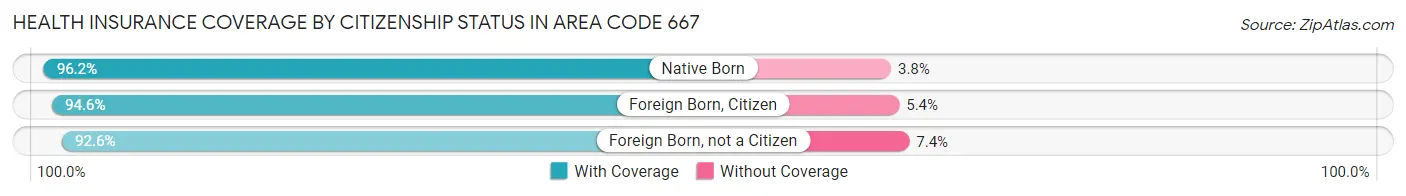
| Citizenship Status | With Coverage | Without Coverage |
| Native Born | 26,540 (96.2%) | 1,042 (3.8%) |
| Foreign Born, Citizen | 59,126 (94.6%) | 3,375 (5.4%) |
| Foreign Born, not a Citizen | 39,165 (92.6%) | 3,126 (7.4%) |
Health Insurance Coverage by Household Income in Area Code 667
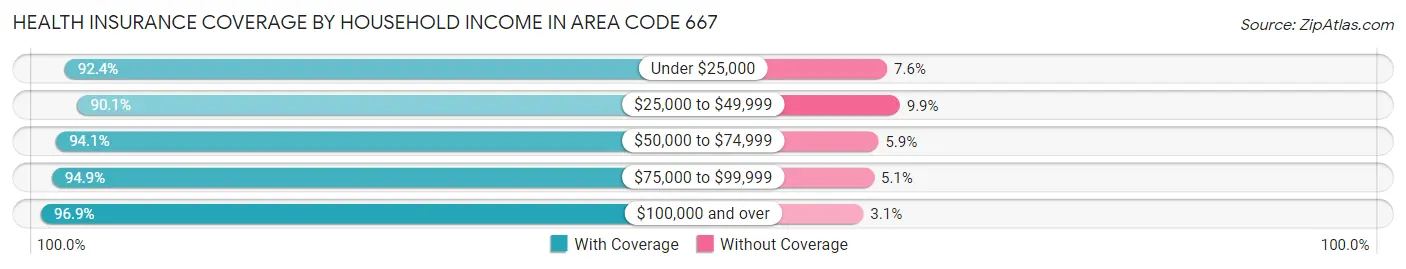
| Household Income | With Coverage | Without Coverage |
| Under $25,000 | 48,301 (92.4%) | 3,952 (7.6%) |
| $25,000 to $49,999 | 50,196 (90.1%) | 5,531 (9.9%) |
| $50,000 to $74,999 | 53,393 (94.1%) | 3,364 (5.9%) |
| $75,000 to $99,999 | 47,477 (94.9%) | 2,553 (5.1%) |
| $100,000 and over | 179,127 (96.9%) | 5,759 (3.1%) |
Public vs Private Health Insurance Coverage by Age in Area Code 667
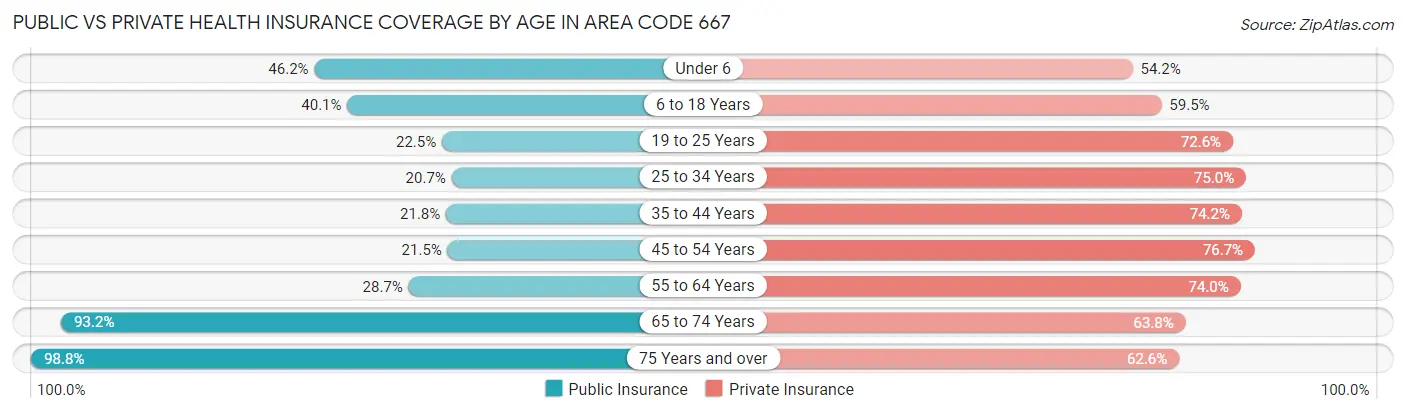
| Age Bracket | Public Insurance | Private Insurance |
| Under 6 | 12,745 (46.2%) | 14,937 (54.1%) |
| 6 to 18 Years | 25,055 (40.1%) | 37,194 (59.5%) |
| 19 to 25 Years | 9,519 (22.5%) | 30,704 (72.6%) |
| 25 to 34 Years | 12,824 (20.7%) | 46,430 (75.0%) |
| 35 to 44 Years | 10,813 (21.8%) | 36,890 (74.2%) |
| 45 to 54 Years | 10,201 (21.5%) | 36,439 (76.7%) |
| 55 to 64 Years | 14,572 (28.7%) | 37,563 (74.0%) |
| 65 to 74 Years | 35,245 (93.2%) | 24,120 (63.8%) |
| 75 Years and over | 26,364 (98.8%) | 16,704 (62.6%) |
| Total | 157,338 (38.7%) | 280,981 (69.1%) |
Disability Status by Sex by Age in Area Code 667
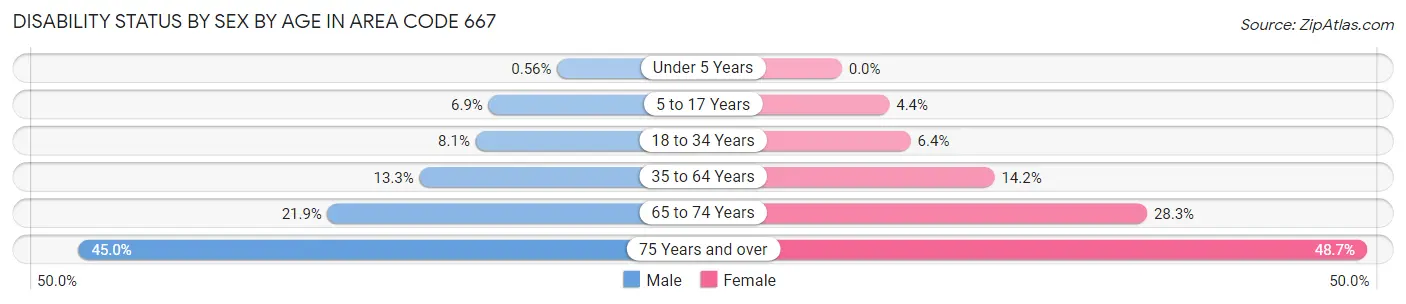
| Age Bracket | Male | Female |
| Under 5 Years | 68 (0.6%) | 0 (0.0%) |
| 5 to 17 Years | 2,209 (6.9%) | 1,323 (4.4%) |
| 18 to 34 Years | 4,255 (8.1%) | 3,630 (6.4%) |
| 35 to 64 Years | 9,367 (13.3%) | 11,014 (14.2%) |
| 65 to 74 Years | 3,646 (21.9%) | 5,984 (28.3%) |
| 75 Years and over | 4,308 (45.0%) | 8,336 (48.7%) |
Disability Class by Sex by Age in Area Code 667
Disability Class: Hearing Difficulty
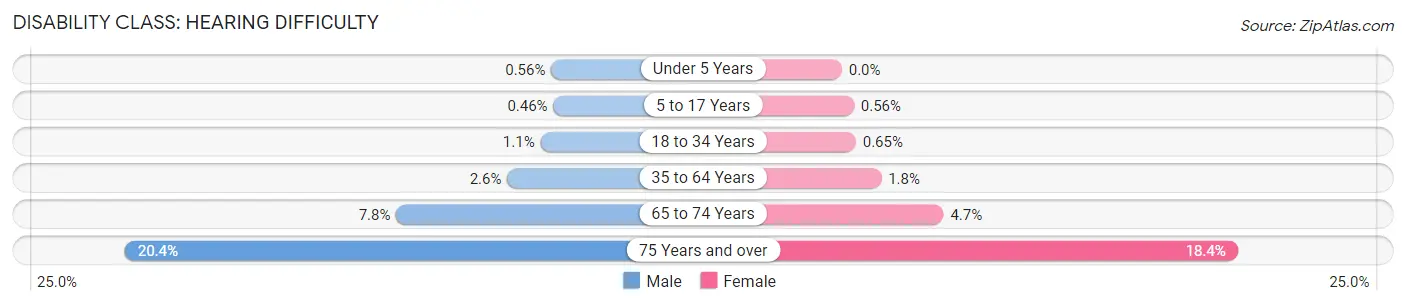
| Age Bracket | Male | Female |
| Under 5 Years | 68 (0.6%) | 0 (0.0%) |
| 5 to 17 Years | 146 (0.5%) | 168 (0.6%) |
| 18 to 34 Years | 556 (1.1%) | 370 (0.6%) |
| 35 to 64 Years | 1,825 (2.6%) | 1,426 (1.8%) |
| 65 to 74 Years | 1,292 (7.7%) | 998 (4.7%) |
| 75 Years and over | 1,948 (20.3%) | 3,143 (18.4%) |
Disability Class: Vision Difficulty
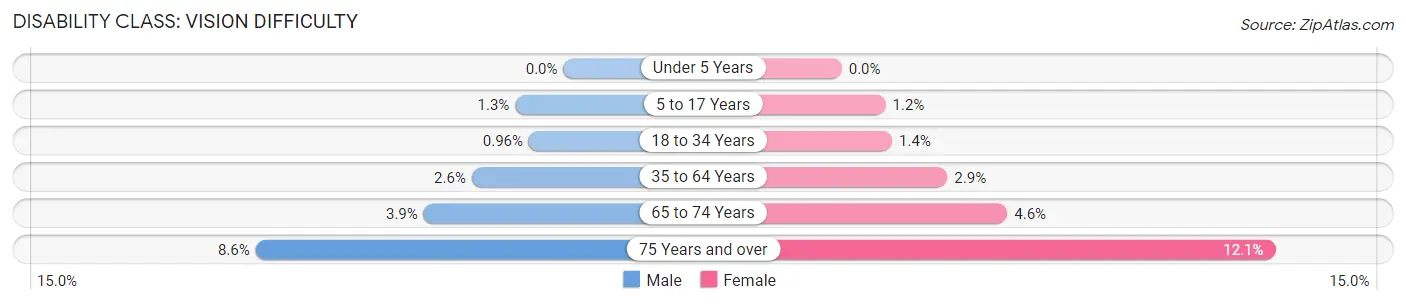
| Age Bracket | Male | Female |
| Under 5 Years | 0 (0.0%) | 0 (0.0%) |
| 5 to 17 Years | 428 (1.3%) | 366 (1.2%) |
| 18 to 34 Years | 501 (1.0%) | 795 (1.4%) |
| 35 to 64 Years | 1,790 (2.5%) | 2,284 (2.9%) |
| 65 to 74 Years | 648 (3.9%) | 974 (4.6%) |
| 75 Years and over | 820 (8.6%) | 2,065 (12.1%) |
Disability Class: Cognitive Difficulty
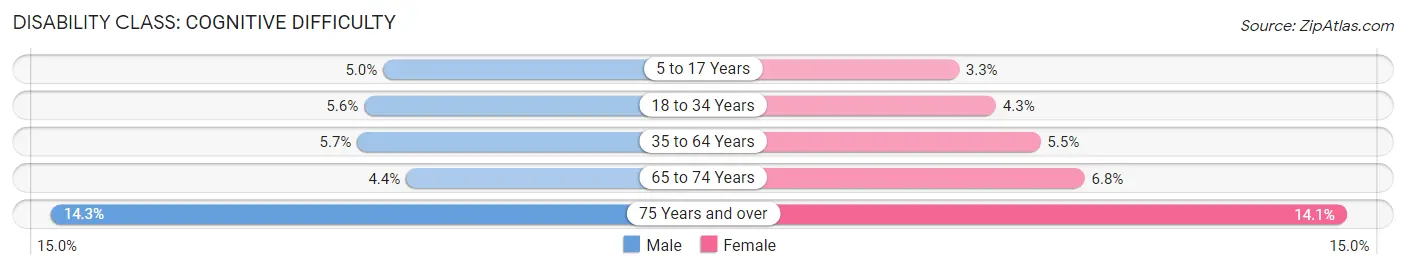
| Age Bracket | Male | Female |
| 5 to 17 Years | 1,599 (5.0%) | 977 (3.3%) |
| 18 to 34 Years | 2,902 (5.6%) | 2,440 (4.3%) |
| 35 to 64 Years | 4,032 (5.7%) | 4,302 (5.5%) |
| 65 to 74 Years | 730 (4.4%) | 1,429 (6.8%) |
| 75 Years and over | 1,366 (14.3%) | 2,404 (14.1%) |
Disability Class: Ambulatory Difficulty
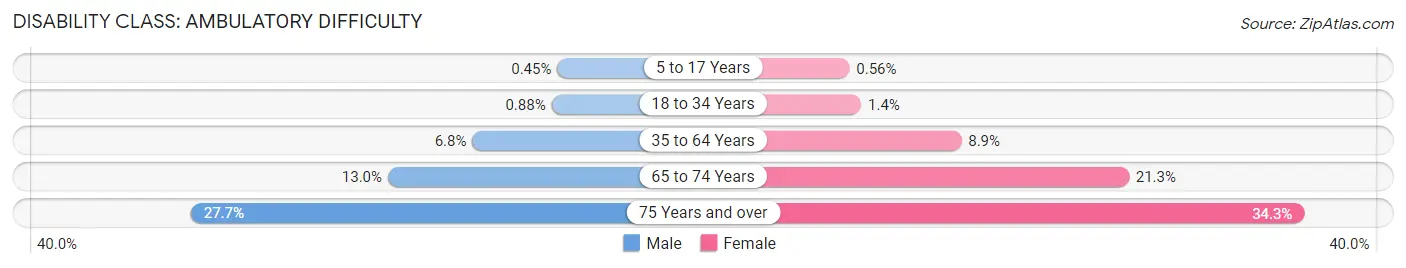
| Age Bracket | Male | Female |
| 5 to 17 Years | 145 (0.4%) | 169 (0.6%) |
| 18 to 34 Years | 461 (0.9%) | 813 (1.4%) |
| 35 to 64 Years | 4,744 (6.8%) | 6,898 (8.9%) |
| 65 to 74 Years | 2,172 (13.0%) | 4,503 (21.3%) |
| 75 Years and over | 2,648 (27.7%) | 5,873 (34.3%) |
Disability Class: Self-Care Difficulty
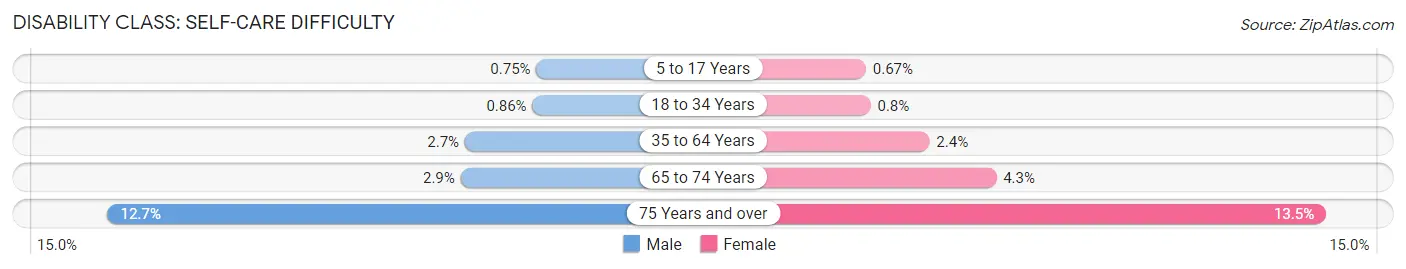
| Age Bracket | Male | Female |
| 5 to 17 Years | 240 (0.7%) | 201 (0.7%) |
| 18 to 34 Years | 450 (0.9%) | 455 (0.8%) |
| 35 to 64 Years | 1,922 (2.7%) | 1,900 (2.4%) |
| 65 to 74 Years | 477 (2.9%) | 908 (4.3%) |
| 75 Years and over | 1,215 (12.7%) | 2,307 (13.5%) |
Technology Access in Area Code 667
Computing Device Access in Area Code 667
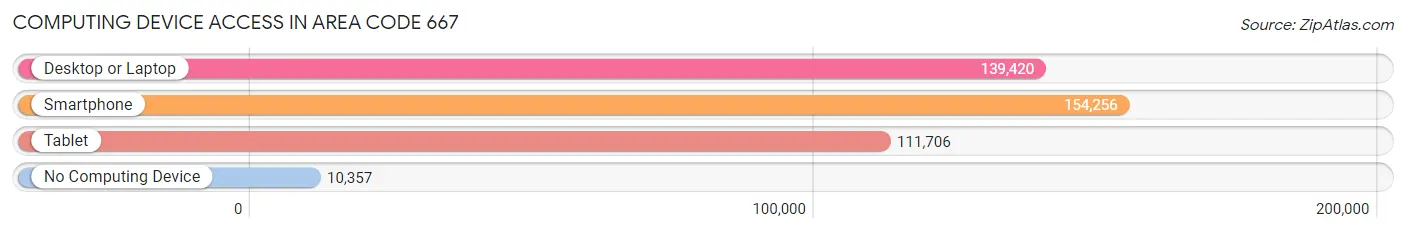
| Device Type | # Households | % Households |
| Desktop or Laptop | 139,420 | 80.2% |
| Smartphone | 154,256 | 88.8% |
| Tablet | 111,706 | 64.3% |
| No Computing Device | 10,357 | 6.0% |
| Total | 173,733 | 100.0% |
Internet Access in Area Code 667
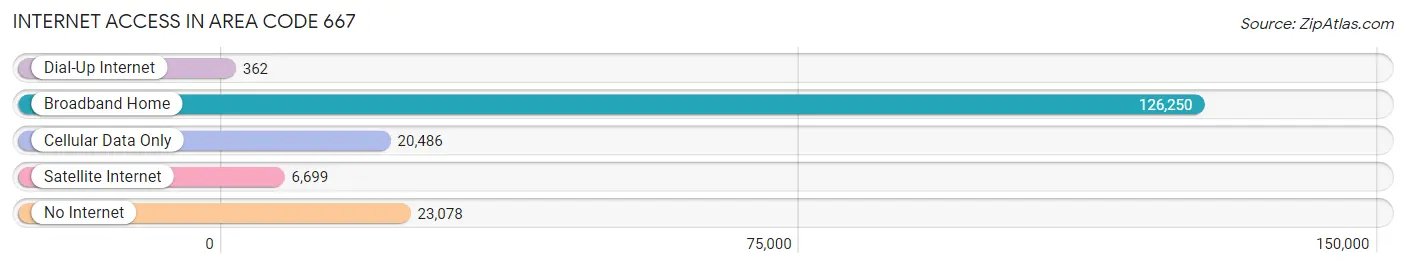
| Internet Type | # Households | % Households |
| Dial-Up Internet | 362 | 0.2% |
| Broadband Home | 126,250 | 72.7% |
| Cellular Data Only | 20,486 | 11.8% |
| Satellite Internet | 6,699 | 3.9% |
| No Internet | 23,078 | 13.3% |
| Total | 173,733 | 100.0% |
Area Code 667 Summary
Geography
Area code 667 is an overlay area code that covers the Baltimore metropolitan area in Maryland. It was created in 2011 to provide additional phone numbers for the area, which was previously served by area codes 410 and 443. The 667 area code covers the entire city of Baltimore, as well as parts of Anne Arundel, Baltimore, Carroll, Harford, and Howard counties.
Social
The 667 area code is a source of pride for many Baltimoreans, as it is a sign of the city's growth and development. It is also a reminder of the city's rich history and culture, which is reflected in the area code's unique design. The 667 area code is often seen on t-shirts, hats, and other apparel, and is a popular choice for Baltimore-themed tattoos.
Economics
The 667 area code is a major economic driver for the Baltimore metropolitan area. It has helped to attract new businesses and investments to the region, as well as create jobs and spur economic growth. The area code has also helped to increase tourism to the city, as it is a recognizable symbol of Baltimore's vibrant culture and history.
Demographics
The 667 area code is home to a diverse population, with a mix of races, ethnicities, and socio-economic backgrounds. The population is largely urban, with a large number of young professionals and families. The area code is also home to a large number of immigrants, who have brought their own unique cultures and traditions to the region.
Common Questions
What is Per Capita Income in Area Code 667?
Per Capita income in Area Code 667 is $47,679.
What is the Median Family Income in Area Code 667?
Median Family Income in Area Code 667 is $106,528.
What is the Median Household income in Area Code 667?
Median Household Income in Area Code 667 is $82,221.
What is Income or Wage Gap in Area Code 667?
Income or Wage Gap in Area Code 667 is 24.7%.
Women in Area Code 667 earn 75.3 cents for every dollar earned by a man.
What is Family Income Deficit in Area Code 667?
Family Income Deficit in Area Code 667 is $12,209.
Families that are below poverty line in Area Code 667 earn $12,209 less on average than the poverty threshold level.
What is Inequality or Gini Index in Area Code 667?
Inequality or Gini Index in Area Code 667 is 7.85.
What is the Total Population of Area Code 667?
Total Population of Area Code 667 is 415,301.
What is the Total Male Population of Area Code 667?
Total Male Population of Area Code 667 is 198,913.
What is the Total Female Population of Area Code 667?
Total Female Population of Area Code 667 is 216,388.
What is the Ratio of Males per 100 Females in Area Code 667?
There are 91.92 Males per 100 Females in Area Code 667.
What is the Ratio of Females per 100 Males in Area Code 667?
There are 108.79 Females per 100 Males in Area Code 667.
What is the Median Population Age in Area Code 667?
Median Population Age in Area Code 667 is 38.8 Years.
What is the Average Family Size in Area Code 667
Average Family Size in Area Code 667 is 3.1 People.
What is the Average Household Size in Area Code 667
Average Household Size in Area Code 667 is 2.3 People.
How Large is the Labor Force in Area Code 667?
There are 214,405 People in the Labor Forcein in Area Code 667.
What is the Percentage of People in the Labor Force in Area Code 667?
63.2% of People are in the Labor Force in Area Code 667.
What is the Unemployment Rate in Area Code 667?
Unemployment Rate in Area Code 667 is 5.5%.