Zip Codes with the Highest Percentage of Population Employed in Agriculture, Fishing & Hunting in Louisville, KY
RELATED REPORTS & OPTIONS
Agriculture, Fishing & Hunting
Louisville
Compare Zip Codes
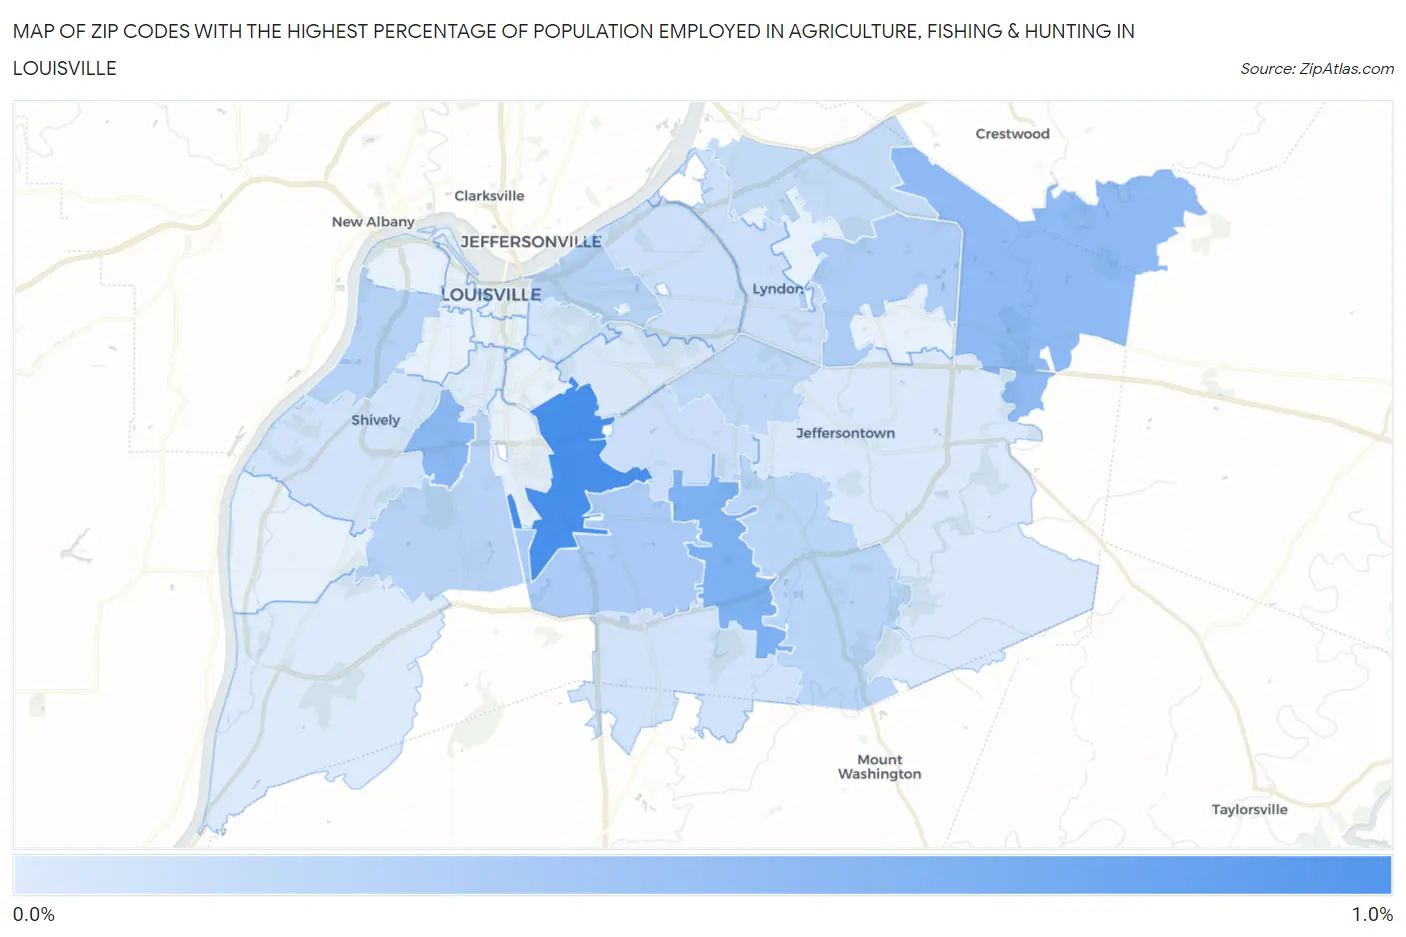
Map of Zip Codes with the Highest Percentage of Population Employed in Agriculture, Fishing & Hunting in Louisville
0.013%
0.96%
Zip Codes with the Highest Percentage of Population Employed in Agriculture, Fishing & Hunting in Louisville, KY
| Zip Code | % Employed | vs State | vs National | |
| 1. | 40213 | 0.96% | 1.3%(-0.360)#282 | 1.2%(-0.244)#16,431 |
| 2. | 40228 | 0.61% | 1.3%(-0.707)#321 | 1.2%(-0.591)#18,431 |
| 3. | 40215 | 0.54% | 1.3%(-0.780)#328 | 1.2%(-0.664)#18,973 |
| 4. | 40245 | 0.51% | 1.3%(-0.808)#330 | 1.2%(-0.693)#19,228 |
| 5. | 40219 | 0.33% | 1.3%(-0.990)#353 | 1.2%(-0.874)#20,892 |
| 6. | 40223 | 0.31% | 1.3%(-1.01)#357 | 1.2%(-0.890)#21,064 |
| 7. | 40211 | 0.26% | 1.3%(-1.05)#363 | 1.2%(-0.936)#21,608 |
| 8. | 40206 | 0.26% | 1.3%(-1.06)#365 | 1.2%(-0.941)#21,676 |
| 9. | 40214 | 0.24% | 1.3%(-1.08)#368 | 1.2%(-0.960)#21,891 |
| 10. | 40291 | 0.23% | 1.3%(-1.08)#370 | 1.2%(-0.965)#21,935 |
| 11. | 40220 | 0.20% | 1.3%(-1.11)#375 | 1.2%(-0.998)#22,350 |
| 12. | 40241 | 0.17% | 1.3%(-1.14)#379 | 1.2%(-1.03)#22,702 |
| 13. | 40218 | 0.13% | 1.3%(-1.19)#387 | 1.2%(-1.07)#23,330 |
| 14. | 40222 | 0.12% | 1.3%(-1.19)#388 | 1.2%(-1.08)#23,409 |
| 15. | 40207 | 0.11% | 1.3%(-1.21)#390 | 1.2%(-1.09)#23,558 |
| 16. | 40229 | 0.087% | 1.3%(-1.23)#394 | 1.2%(-1.11)#23,859 |
| 17. | 40216 | 0.079% | 1.3%(-1.24)#395 | 1.2%(-1.12)#23,972 |
| 18. | 40204 | 0.067% | 1.3%(-1.25)#396 | 1.2%(-1.13)#24,145 |
| 19. | 40205 | 0.037% | 1.3%(-1.28)#398 | 1.2%(-1.16)#24,478 |
| 20. | 40299 | 0.032% | 1.3%(-1.28)#399 | 1.2%(-1.17)#24,518 |
| 21. | 40272 | 0.017% | 1.3%(-1.30)#400 | 1.2%(-1.18)#24,592 |
| 22. | 40208 | 0.013% | 1.3%(-1.30)#401 | 1.2%(-1.19)#24,614 |
1
Common Questions
What are the Top 10 Zip Codes with the Highest Percentage of Population Employed in Agriculture, Fishing & Hunting in Louisville, KY?
Top 10 Zip Codes with the Highest Percentage of Population Employed in Agriculture, Fishing & Hunting in Louisville, KY are:
What zip code has the Highest Percentage of Population Employed in Agriculture, Fishing & Hunting in Louisville, KY?
40213 has the Highest Percentage of Population Employed in Agriculture, Fishing & Hunting in Louisville, KY with 0.96%.
What is the Percentage of Population Employed in Agriculture, Fishing & Hunting in Louisville, KY?
Percentage of Population Employed in Agriculture, Fishing & Hunting in Louisville is 0.22%.
What is the Percentage of Population Employed in Agriculture, Fishing & Hunting in Kentucky?
Percentage of Population Employed in Agriculture, Fishing & Hunting in Kentucky is 1.3%.
What is the Percentage of Population Employed in Agriculture, Fishing & Hunting in the United States?
Percentage of Population Employed in Agriculture, Fishing & Hunting in the United States is 1.2%.