Zip Codes with the Highest Percentage of Population Employed in Production in South Bend, IN
RELATED REPORTS & OPTIONS
Production
South Bend
Compare Zip Codes
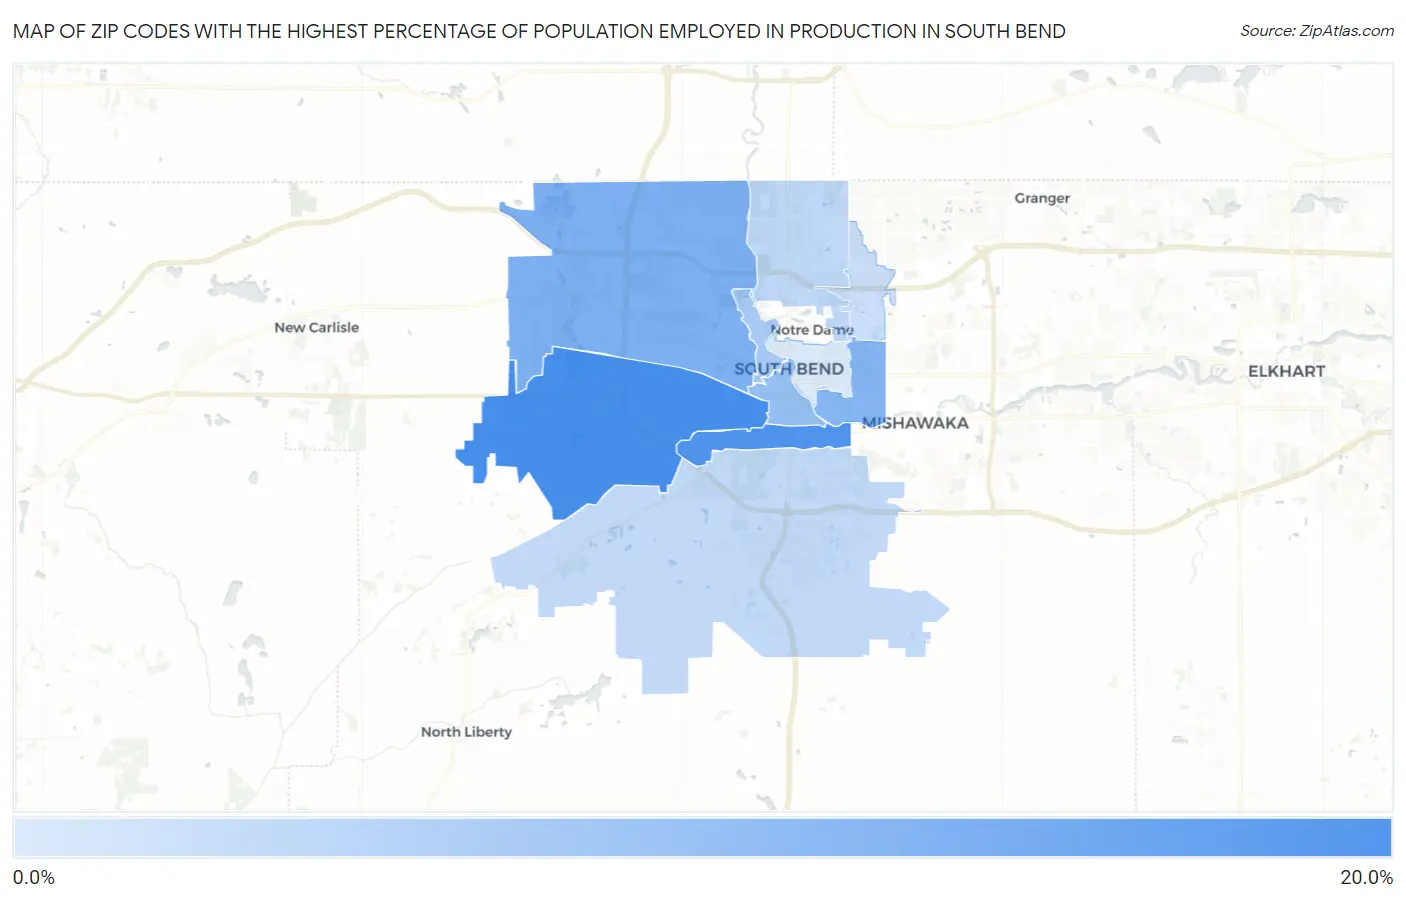
Map of Zip Codes with the Highest Percentage of Population Employed in Production in South Bend
4.2%
16.5%
Zip Codes with the Highest Percentage of Population Employed in Production in South Bend, IN
| Zip Code | % Employed | vs State | vs National | |
| 1. | 46619 | 16.5% | 10.1%(+6.34)#193 | 5.5%(+11.0)#2,466 |
| 2. | 46613 | 15.6% | 10.1%(+5.49)#226 | 5.5%(+10.1)#2,835 |
| 3. | 46628 | 12.0% | 10.1%(+1.91)#349 | 5.5%(+6.56)#5,436 |
| 4. | 46615 | 11.2% | 10.1%(+1.04)#387 | 5.5%(+5.69)#6,365 |
| 5. | 46601 | 9.9% | 10.1%(-0.250)#449 | 5.5%(+4.40)#8,026 |
| 6. | 46616 | 8.5% | 10.1%(-1.66)#513 | 5.5%(+2.99)#10,253 |
| 7. | 46637 | 6.5% | 10.1%(-3.62)#618 | 5.5%(+1.02)#14,106 |
| 8. | 46614 | 6.4% | 10.1%(-3.76)#623 | 5.5%(+0.887)#14,400 |
| 9. | 46635 | 5.7% | 10.1%(-4.45)#645 | 5.5%(+0.199)#16,037 |
| 10. | 46617 | 4.2% | 10.1%(-5.88)#679 | 5.5%(-1.23)#19,722 |
1
Common Questions
What are the Top 5 Zip Codes with the Highest Percentage of Population Employed in Production in South Bend, IN?
Top 5 Zip Codes with the Highest Percentage of Population Employed in Production in South Bend, IN are:
What zip code has the Highest Percentage of Population Employed in Production in South Bend, IN?
46619 has the Highest Percentage of Population Employed in Production in South Bend, IN with 16.5%.
What is the Percentage of Population Employed in Production in South Bend, IN?
Percentage of Population Employed in Production in South Bend is 11.0%.
What is the Percentage of Population Employed in Production in Indiana?
Percentage of Population Employed in Production in Indiana is 10.1%.
What is the Percentage of Population Employed in Production in the United States?
Percentage of Population Employed in Production in the United States is 5.5%.