Zip Codes with the Highest Percentage of Population Employed in Production in Hammond, IN
RELATED REPORTS & OPTIONS
Production
Hammond
Compare Zip Codes
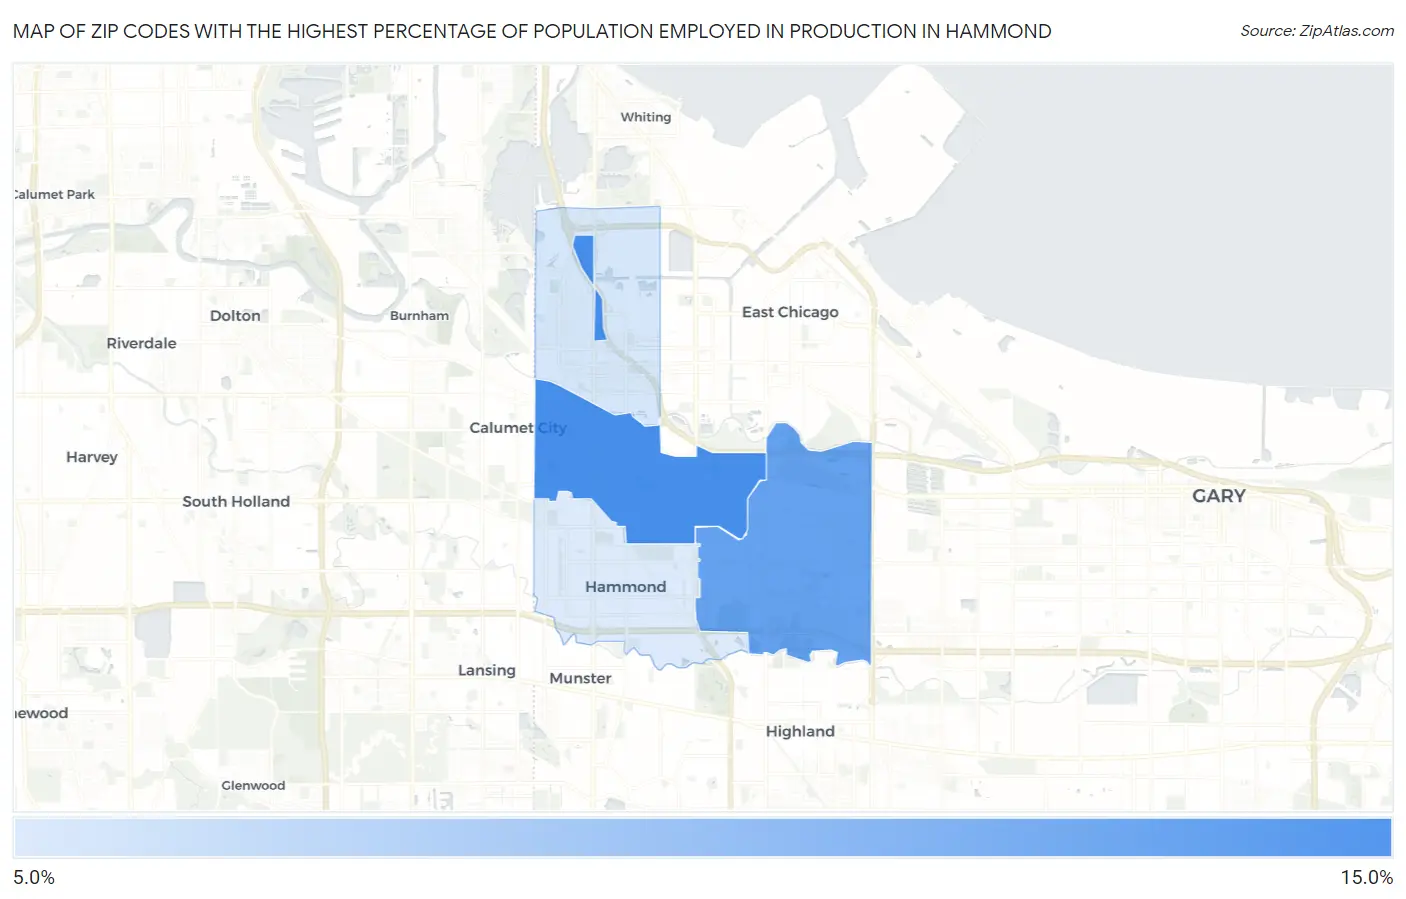
Map of Zip Codes with the Highest Percentage of Population Employed in Production in Hammond
8.9%
12.0%
Zip Codes with the Highest Percentage of Population Employed in Production in Hammond, IN
| Zip Code | % Employed | vs State | vs National | |
| 1. | 46320 | 12.0% | 10.1%(+1.86)#353 | 5.5%(+6.51)#5,495 |
| 2. | 46323 | 11.4% | 10.1%(+1.26)#378 | 5.5%(+5.91)#6,121 |
| 3. | 46327 | 9.1% | 10.1%(-1.03)#485 | 5.5%(+3.62)#9,237 |
| 4. | 46324 | 8.9% | 10.1%(-1.17)#490 | 5.5%(+3.48)#9,437 |
1
Common Questions
What are the Top 3 Zip Codes with the Highest Percentage of Population Employed in Production in Hammond, IN?
Top 3 Zip Codes with the Highest Percentage of Population Employed in Production in Hammond, IN are:
What zip code has the Highest Percentage of Population Employed in Production in Hammond, IN?
46320 has the Highest Percentage of Population Employed in Production in Hammond, IN with 12.0%.
What is the Percentage of Population Employed in Production in Hammond, IN?
Percentage of Population Employed in Production in Hammond is 10.5%.
What is the Percentage of Population Employed in Production in Indiana?
Percentage of Population Employed in Production in Indiana is 10.1%.
What is the Percentage of Population Employed in Production in the United States?
Percentage of Population Employed in Production in the United States is 5.5%.