Somerset, IN Map & Demographics
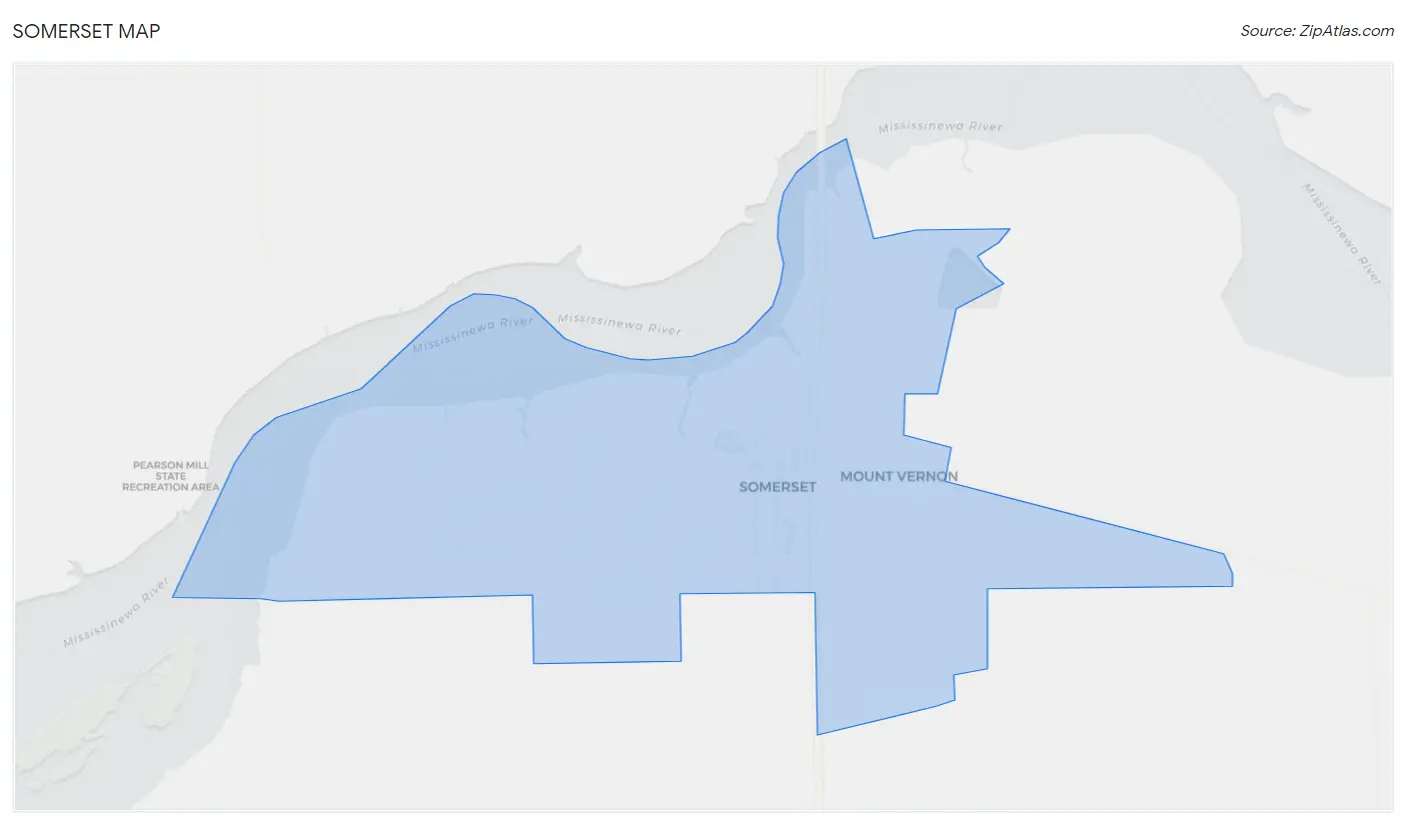
Somerset Map
Somerset Overview
$36,740
PER CAPITA INCOME
$102,833
AVG FAMILY INCOME
$81,500
AVG HOUSEHOLD INCOME
39.6%
WAGE / INCOME GAP [ % ]
60.4¢/ $1
WAGE / INCOME GAP [ $ ]
0.31
INEQUALITY / GINI INDEX
285
TOTAL POPULATION
146
MALE POPULATION
139
FEMALE POPULATION
105.04
MALES / 100 FEMALES
95.21
FEMALES / 100 MALES
61.3
MEDIAN AGE
2.5
AVG FAMILY SIZE
2.1
AVG HOUSEHOLD SIZE
107
LABOR FORCE [ PEOPLE ]
38.6%
PERCENT IN LABOR FORCE
Somerset Zip Codes
Income in Somerset
Income Overview in Somerset
Per Capita Income in Somerset is $36,740, while median incomes of families and households are $102,833 and $81,500 respectively.
| Characteristic | Number | Measure |
| Per Capita Income | 285 | $36,740 |
| Median Family Income | 100 | $102,833 |
| Mean Family Income | 100 | $85,309 |
| Median Household Income | 134 | $81,500 |
| Mean Household Income | 134 | $71,855 |
| Income Deficit | 100 | $0 |
| Wage / Income Gap (%) | 285 | 39.57% |
| Wage / Income Gap ($) | 285 | 60.43¢ per $1 |
| Gini / Inequality Index | 285 | 0.31 |
Earnings by Sex in Somerset
Average Earnings in Somerset are $59,375, $68,264 for men and $41,250 for women, a difference of 39.6%.
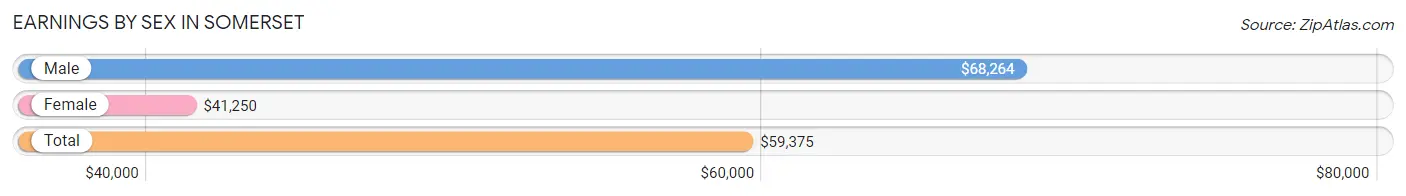
| Sex | Number | Average Earnings |
| Male | 72 (62.1%) | $68,264 |
| Female | 44 (37.9%) | $41,250 |
| Total | 116 (100.0%) | $59,375 |
Earnings by Sex by Income Bracket in Somerset
The most common earnings brackets in Somerset are $65,000 to $74,999 for men (47 | 65.3%) and $30,000 to $34,999 for women (22 | 50.0%).
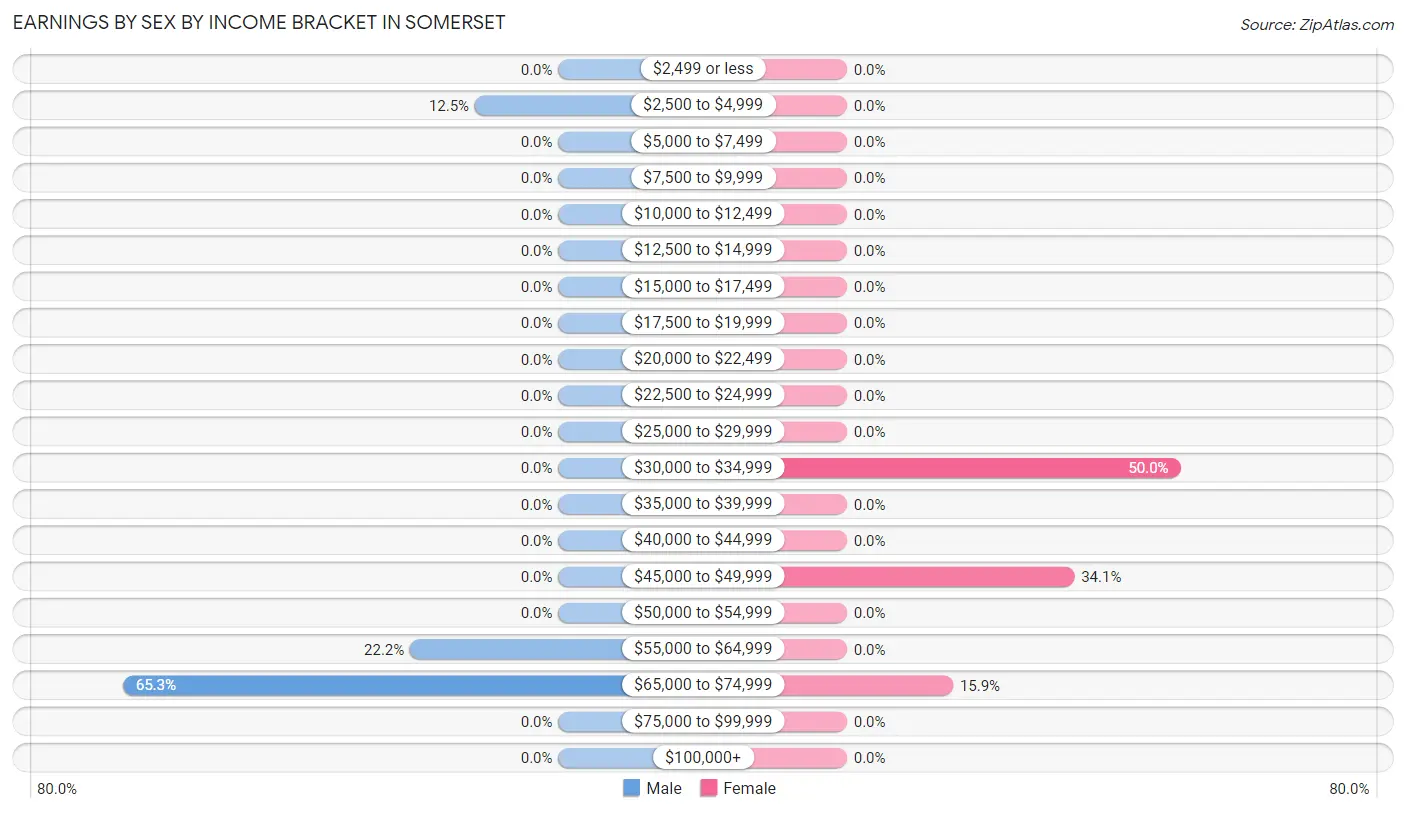
| Income | Male | Female |
| $2,499 or less | 0 (0.0%) | 0 (0.0%) |
| $2,500 to $4,999 | 9 (12.5%) | 0 (0.0%) |
| $5,000 to $7,499 | 0 (0.0%) | 0 (0.0%) |
| $7,500 to $9,999 | 0 (0.0%) | 0 (0.0%) |
| $10,000 to $12,499 | 0 (0.0%) | 0 (0.0%) |
| $12,500 to $14,999 | 0 (0.0%) | 0 (0.0%) |
| $15,000 to $17,499 | 0 (0.0%) | 0 (0.0%) |
| $17,500 to $19,999 | 0 (0.0%) | 0 (0.0%) |
| $20,000 to $22,499 | 0 (0.0%) | 0 (0.0%) |
| $22,500 to $24,999 | 0 (0.0%) | 0 (0.0%) |
| $25,000 to $29,999 | 0 (0.0%) | 0 (0.0%) |
| $30,000 to $34,999 | 0 (0.0%) | 22 (50.0%) |
| $35,000 to $39,999 | 0 (0.0%) | 0 (0.0%) |
| $40,000 to $44,999 | 0 (0.0%) | 0 (0.0%) |
| $45,000 to $49,999 | 0 (0.0%) | 15 (34.1%) |
| $50,000 to $54,999 | 0 (0.0%) | 0 (0.0%) |
| $55,000 to $64,999 | 16 (22.2%) | 0 (0.0%) |
| $65,000 to $74,999 | 47 (65.3%) | 7 (15.9%) |
| $75,000 to $99,999 | 0 (0.0%) | 0 (0.0%) |
| $100,000+ | 0 (0.0%) | 0 (0.0%) |
| Total | 72 (100.0%) | 44 (100.0%) |
Earnings by Sex by Educational Attainment in Somerset
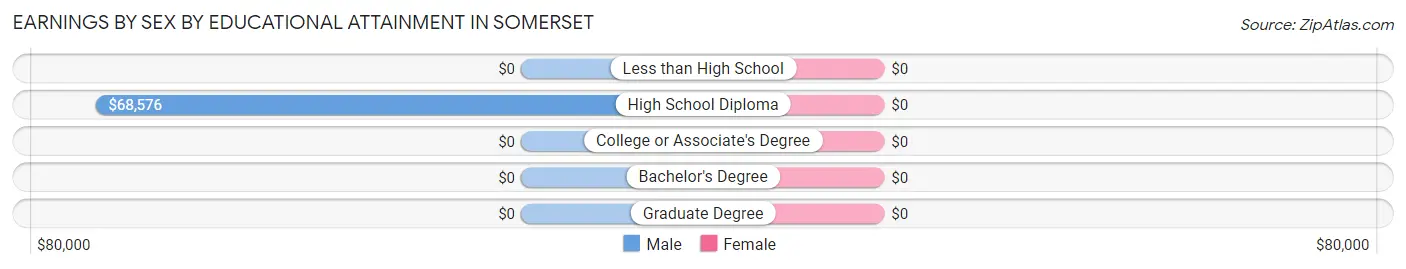
| Educational Attainment | Male Income | Female Income |
| Less than High School | - | - |
| High School Diploma | $68,576 | $0 |
| College or Associate's Degree | - | - |
| Bachelor's Degree | - | - |
| Graduate Degree | - | - |
| Total | $68,264 | $41,250 |
Family Income in Somerset
Family Income Brackets in Somerset
According to the Somerset family income data, there are 54 families falling into the $100,000 to $149,999 income range, which is the most common income bracket and makes up 54.0% of all families.
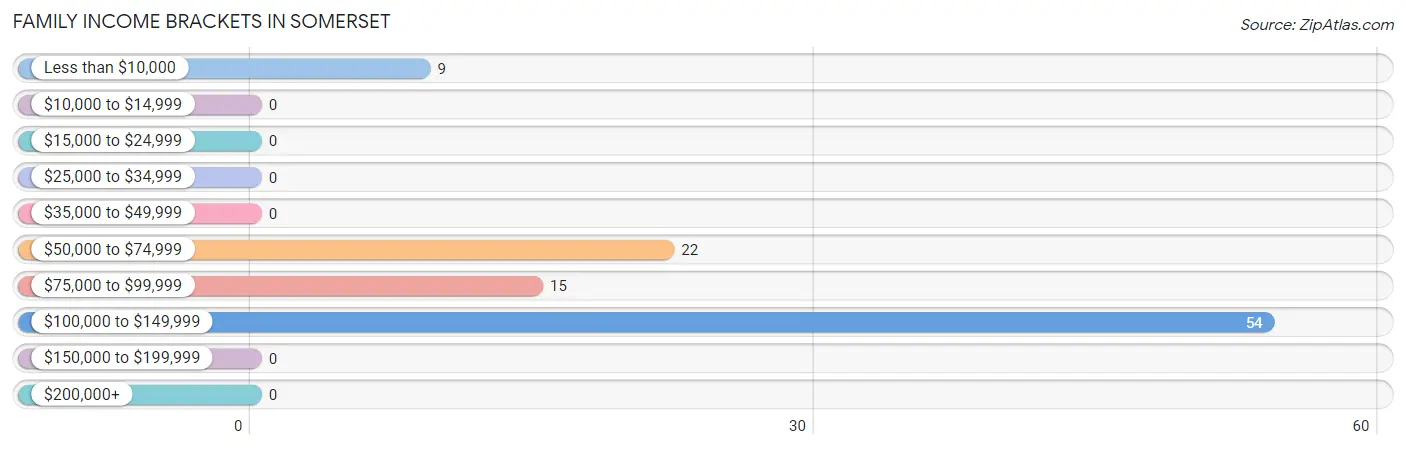
| Income Bracket | # Families | % Families |
| Less than $10,000 | 9 | 9.0% |
| $10,000 to $14,999 | 0 | 0.0% |
| $15,000 to $24,999 | 0 | 0.0% |
| $25,000 to $34,999 | 0 | 0.0% |
| $35,000 to $49,999 | 0 | 0.0% |
| $50,000 to $74,999 | 22 | 22.0% |
| $75,000 to $99,999 | 15 | 15.0% |
| $100,000 to $149,999 | 54 | 54.0% |
| $150,000 to $199,999 | 0 | 0.0% |
| $200,000+ | 0 | 0.0% |
Family Income by Famaliy Size in Somerset
2-person families (84 | 84.0%) account for the highest median family income in Somerset with $81,833 per family, while 2-person families (84 | 84.0%) have the highest median income of $40,916 per family member.
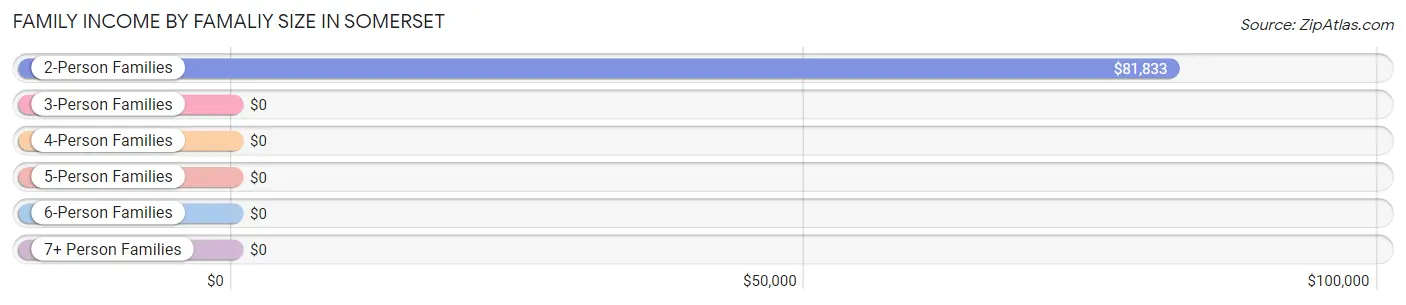
| Income Bracket | # Families | Median Income |
| 2-Person Families | 84 (84.0%) | $81,833 |
| 3-Person Families | 0 (0.0%) | $0 |
| 4-Person Families | 16 (16.0%) | $0 |
| 5-Person Families | 0 (0.0%) | $0 |
| 6-Person Families | 0 (0.0%) | $0 |
| 7+ Person Families | 0 (0.0%) | $0 |
| Total | 100 (100.0%) | $102,833 |
Family Income by Number of Earners in Somerset
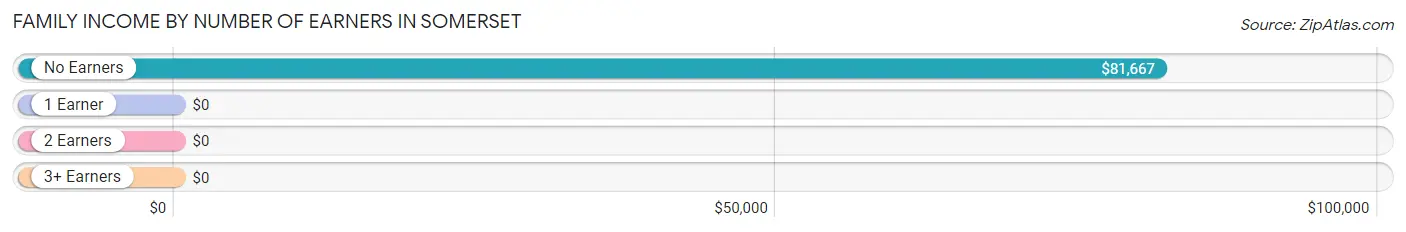
| Number of Earners | # Families | Median Income |
| No Earners | 42 (42.0%) | $81,667 |
| 1 Earner | 20 (20.0%) | $0 |
| 2 Earners | 38 (38.0%) | $0 |
| 3+ Earners | 0 (0.0%) | $0 |
| Total | 100 (100.0%) | $102,833 |
Household Income in Somerset
Household Income Brackets in Somerset
With 61 households falling in the category, the $100,000 to $149,999 income range is the most frequent in Somerset, accounting for 45.5% of all households.
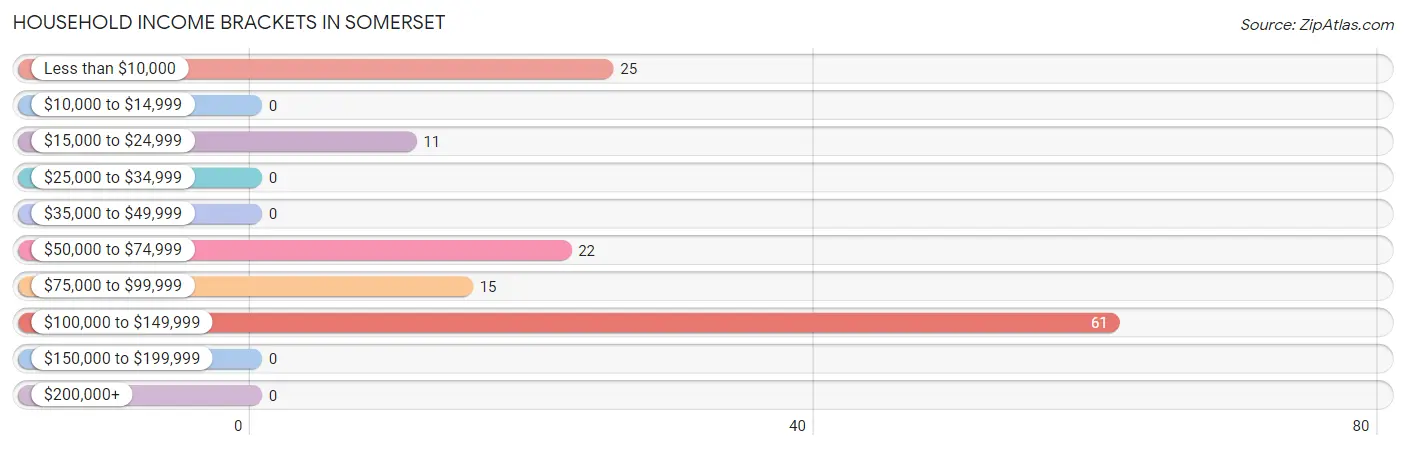
| Income Bracket | # Households | % Households |
| Less than $10,000 | 25 | 18.7% |
| $10,000 to $14,999 | 0 | 0.0% |
| $15,000 to $24,999 | 11 | 8.2% |
| $25,000 to $34,999 | 0 | 0.0% |
| $35,000 to $49,999 | 0 | 0.0% |
| $50,000 to $74,999 | 22 | 16.4% |
| $75,000 to $99,999 | 15 | 11.2% |
| $100,000 to $149,999 | 61 | 45.5% |
| $150,000 to $199,999 | 0 | 0.0% |
| $200,000+ | 0 | 0.0% |
Household Income by Householder Age in Somerset
The median household income in Somerset is $81,500, with the highest median household income of $103,693 found in the 45 to 64 years age bracket for the primary householder. A total of 39 households (29.1%) fall into this category.
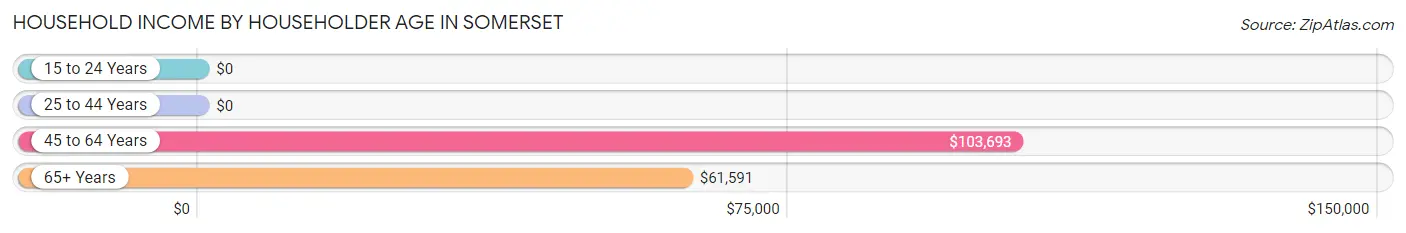
| Income Bracket | # Households | Median Income |
| 15 to 24 Years | 0 (0.0%) | $0 |
| 25 to 44 Years | 27 (20.2%) | $0 |
| 45 to 64 Years | 39 (29.1%) | $103,693 |
| 65+ Years | 68 (50.7%) | $61,591 |
| Total | 134 (100.0%) | $81,500 |
Poverty in Somerset
Income Below Poverty by Sex and Age in Somerset
With 6.2% poverty level for males and 16.6% for females among the residents of Somerset, 55 to 64 year old males and 75 year old and over females are the most vulnerable to poverty, with 9 males (20.0%) and 8 females (57.1%) in their respective age groups living below the poverty level.
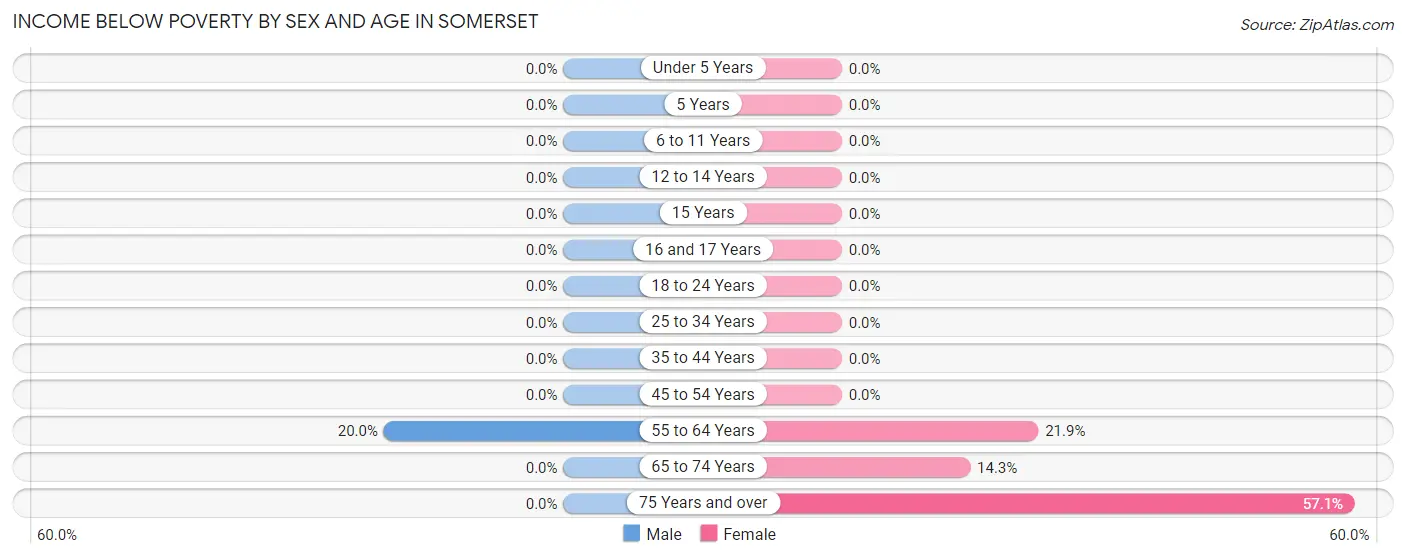
| Age Bracket | Male | Female |
| Under 5 Years | 0 (0.0%) | 0 (0.0%) |
| 5 Years | 0 (0.0%) | 0 (0.0%) |
| 6 to 11 Years | 0 (0.0%) | 0 (0.0%) |
| 12 to 14 Years | 0 (0.0%) | 0 (0.0%) |
| 15 Years | 0 (0.0%) | 0 (0.0%) |
| 16 and 17 Years | 0 (0.0%) | 0 (0.0%) |
| 18 to 24 Years | 0 (0.0%) | 0 (0.0%) |
| 25 to 34 Years | 0 (0.0%) | 0 (0.0%) |
| 35 to 44 Years | 0 (0.0%) | 0 (0.0%) |
| 45 to 54 Years | 0 (0.0%) | 0 (0.0%) |
| 55 to 64 Years | 9 (20.0%) | 7 (21.9%) |
| 65 to 74 Years | 0 (0.0%) | 8 (14.3%) |
| 75 Years and over | 0 (0.0%) | 8 (57.1%) |
| Total | 9 (6.2%) | 23 (16.6%) |
Income Above Poverty by Sex and Age in Somerset
According to the poverty statistics in Somerset, males aged under 5 years and females aged 25 to 34 years are the age groups that are most secure financially, with 100.0% of males and 100.0% of females in these age groups living above the poverty line.
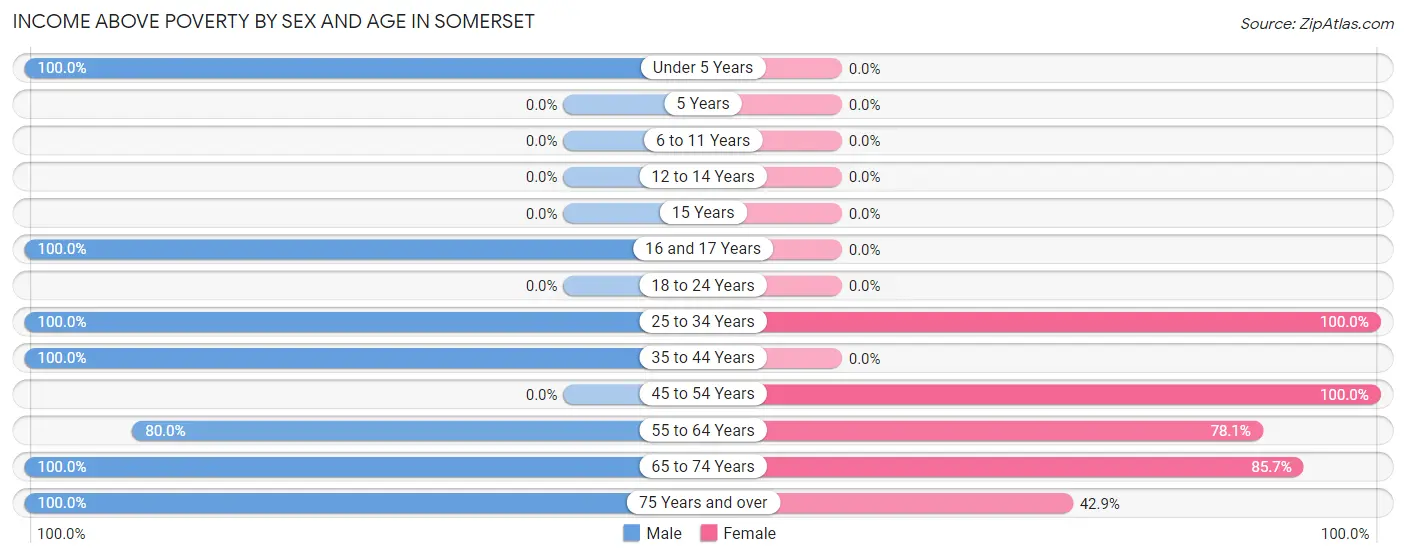
| Age Bracket | Male | Female |
| Under 5 Years | 8 (100.0%) | 0 (0.0%) |
| 5 Years | 0 (0.0%) | 0 (0.0%) |
| 6 to 11 Years | 0 (0.0%) | 0 (0.0%) |
| 12 to 14 Years | 0 (0.0%) | 0 (0.0%) |
| 15 Years | 0 (0.0%) | 0 (0.0%) |
| 16 and 17 Years | 25 (100.0%) | 0 (0.0%) |
| 18 to 24 Years | 0 (0.0%) | 0 (0.0%) |
| 25 to 34 Years | 11 (100.0%) | 15 (100.0%) |
| 35 to 44 Years | 16 (100.0%) | 0 (0.0%) |
| 45 to 54 Years | 0 (0.0%) | 22 (100.0%) |
| 55 to 64 Years | 36 (80.0%) | 25 (78.1%) |
| 65 to 74 Years | 8 (100.0%) | 48 (85.7%) |
| 75 Years and over | 33 (100.0%) | 6 (42.9%) |
| Total | 137 (93.8%) | 116 (83.5%) |
Income Below Poverty Among Married-Couple Families in Somerset
The poverty statistics for married-couple families in Somerset show that 10.1% or 9 of the total 89 families live below the poverty line. Families with no children have the highest poverty rate of 12.3%, comprising of 9 families. On the other hand, families with 1 or 2 children have the lowest poverty rate of 0.0%, which includes 0 families.
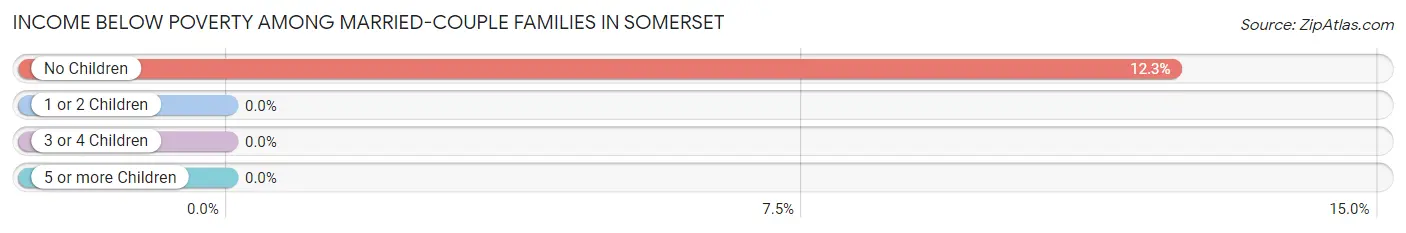
| Children | Above Poverty | Below Poverty |
| No Children | 64 (87.7%) | 9 (12.3%) |
| 1 or 2 Children | 16 (100.0%) | 0 (0.0%) |
| 3 or 4 Children | 0 (0.0%) | 0 (0.0%) |
| 5 or more Children | 0 (0.0%) | 0 (0.0%) |
| Total | 80 (89.9%) | 9 (10.1%) |
Income Below Poverty Among Single-Parent Households in Somerset
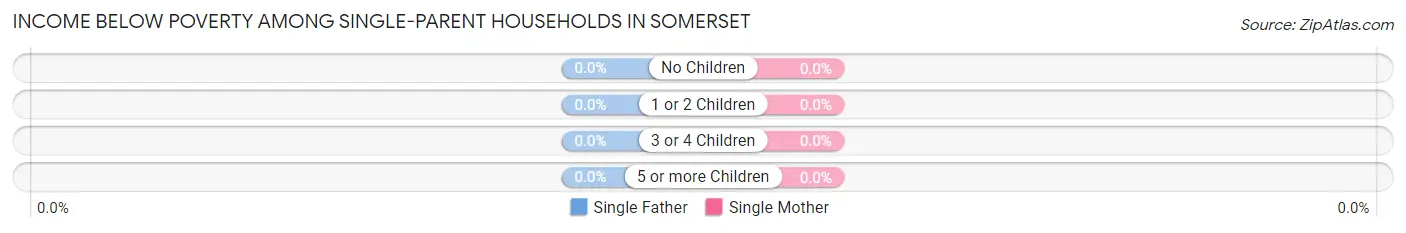
| Children | Single Father | Single Mother |
| No Children | 0 (0.0%) | 0 (0.0%) |
| 1 or 2 Children | 0 (0.0%) | 0 (0.0%) |
| 3 or 4 Children | 0 (0.0%) | 0 (0.0%) |
| 5 or more Children | 0 (0.0%) | 0 (0.0%) |
| Total | 0 (0.0%) | 0 (0.0%) |
Income Below Poverty Among Married-Couple vs Single-Parent Households in Somerset
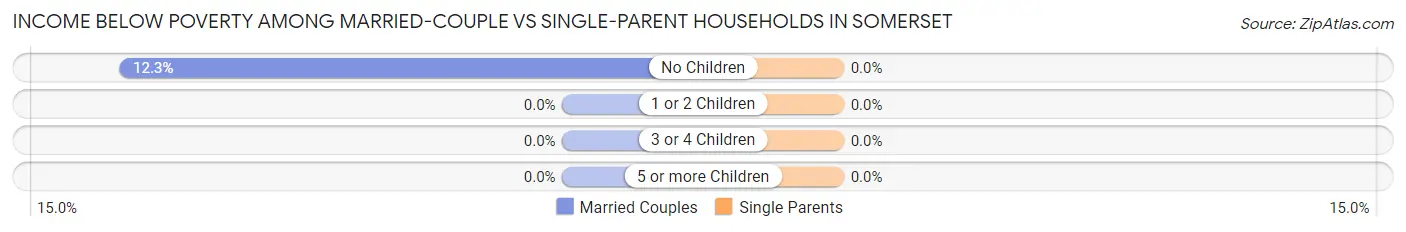
| Children | Married-Couple Families | Single-Parent Households |
| No Children | 9 (12.3%) | 0 (0.0%) |
| 1 or 2 Children | 0 (0.0%) | 0 (0.0%) |
| 3 or 4 Children | 0 (0.0%) | 0 (0.0%) |
| 5 or more Children | 0 (0.0%) | 0 (0.0%) |
| Total | 9 (10.1%) | 0 (0.0%) |
Race in Somerset
The most populous races in Somerset are , and White / Caucasian (285 | 100.0%).
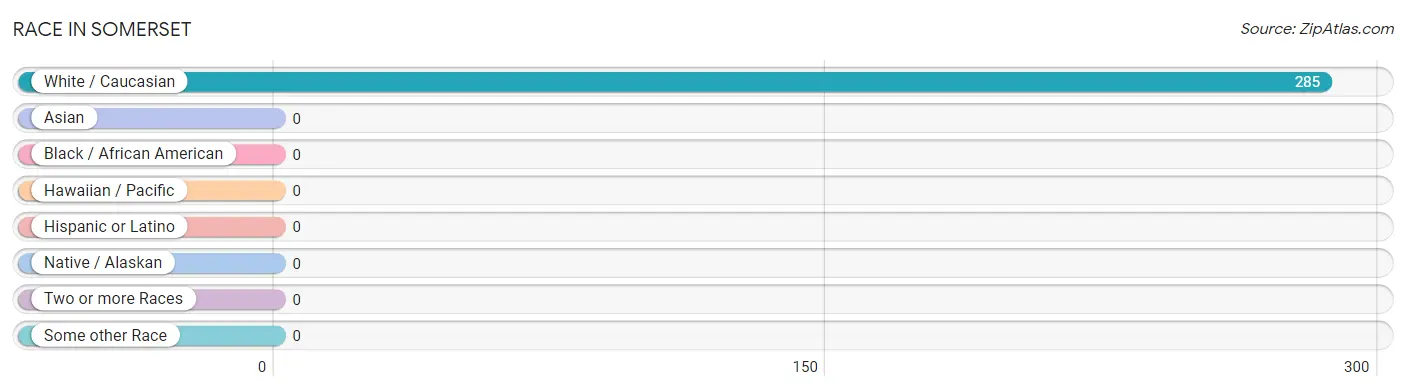
| Race | # Population | % Population |
| Asian | 0 | 0.0% |
| Black / African American | 0 | 0.0% |
| Hawaiian / Pacific | 0 | 0.0% |
| Hispanic or Latino | 0 | 0.0% |
| Native / Alaskan | 0 | 0.0% |
| White / Caucasian | 285 | 100.0% |
| Two or more Races | 0 | 0.0% |
| Some other Race | 0 | 0.0% |
| Total | 285 | 100.0% |
Ancestry in Somerset
The most populous ancestries reported in Somerset are English (34 | 11.9%), German (26 | 9.1%), Scottish (16 | 5.6%), Scotch-Irish (15 | 5.3%), and American (8 | 2.8%), together accounting for 34.7% of all Somerset residents.
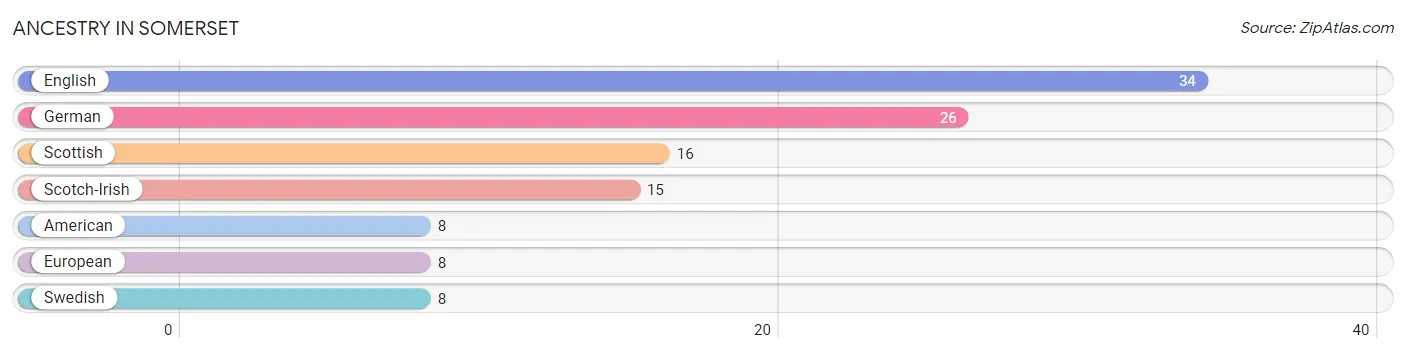
| Ancestry | # Population | % Population |
| American | 8 | 2.8% |
| English | 34 | 11.9% |
| European | 8 | 2.8% |
| German | 26 | 9.1% |
| Scotch-Irish | 15 | 5.3% |
| Scottish | 16 | 5.6% |
| Swedish | 8 | 2.8% | View All 7 Rows |
Immigrants in Somerset

| Immigration Origin | # Population | % Population | View All 0 Rows |
Sex and Age in Somerset
Sex and Age in Somerset
The most populous age groups in Somerset are 55 to 59 Years (36 | 24.7%) for men and 70 to 74 Years (41 | 29.5%) for women.
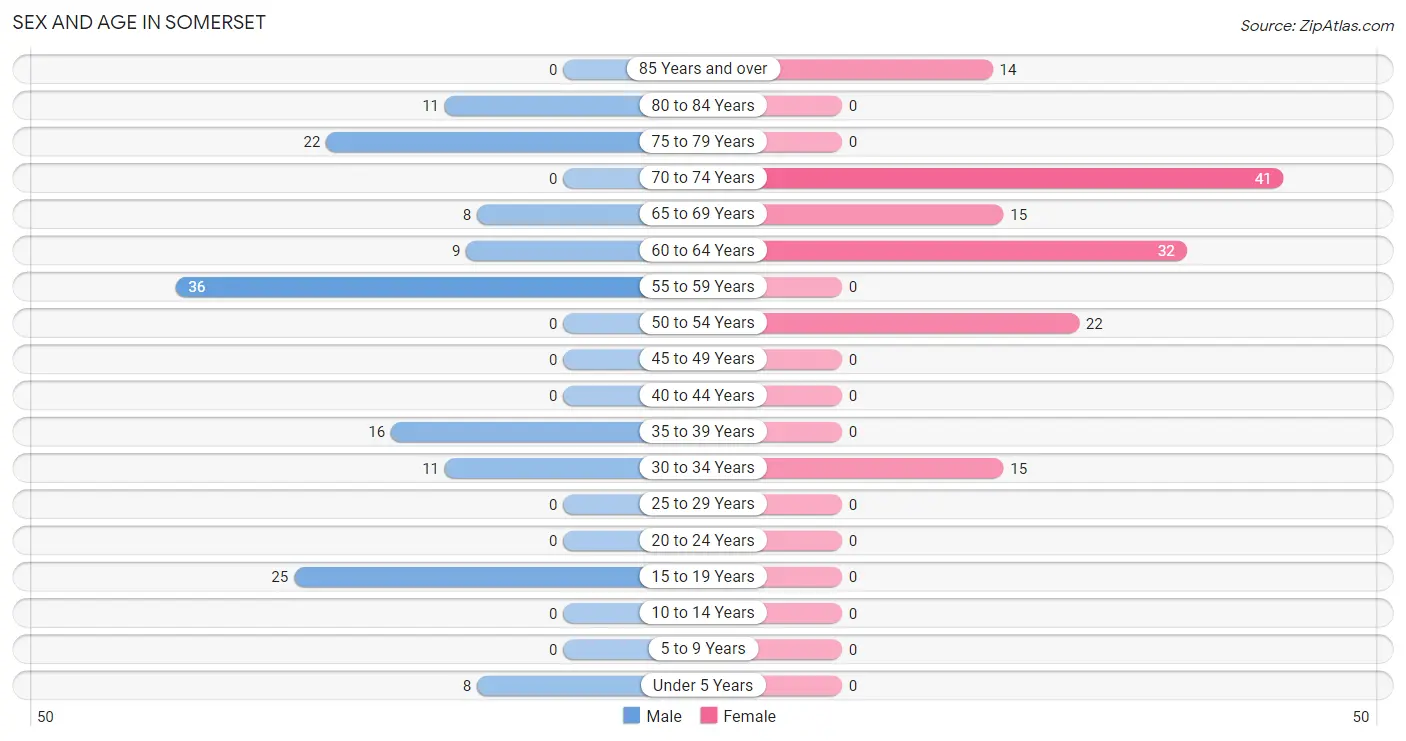
| Age Bracket | Male | Female |
| Under 5 Years | 8 (5.5%) | 0 (0.0%) |
| 5 to 9 Years | 0 (0.0%) | 0 (0.0%) |
| 10 to 14 Years | 0 (0.0%) | 0 (0.0%) |
| 15 to 19 Years | 25 (17.1%) | 0 (0.0%) |
| 20 to 24 Years | 0 (0.0%) | 0 (0.0%) |
| 25 to 29 Years | 0 (0.0%) | 0 (0.0%) |
| 30 to 34 Years | 11 (7.5%) | 15 (10.8%) |
| 35 to 39 Years | 16 (11.0%) | 0 (0.0%) |
| 40 to 44 Years | 0 (0.0%) | 0 (0.0%) |
| 45 to 49 Years | 0 (0.0%) | 0 (0.0%) |
| 50 to 54 Years | 0 (0.0%) | 22 (15.8%) |
| 55 to 59 Years | 36 (24.7%) | 0 (0.0%) |
| 60 to 64 Years | 9 (6.2%) | 32 (23.0%) |
| 65 to 69 Years | 8 (5.5%) | 15 (10.8%) |
| 70 to 74 Years | 0 (0.0%) | 41 (29.5%) |
| 75 to 79 Years | 22 (15.1%) | 0 (0.0%) |
| 80 to 84 Years | 11 (7.5%) | 0 (0.0%) |
| 85 Years and over | 0 (0.0%) | 14 (10.1%) |
| Total | 146 (100.0%) | 139 (100.0%) |
Families and Households in Somerset
Median Family Size in Somerset
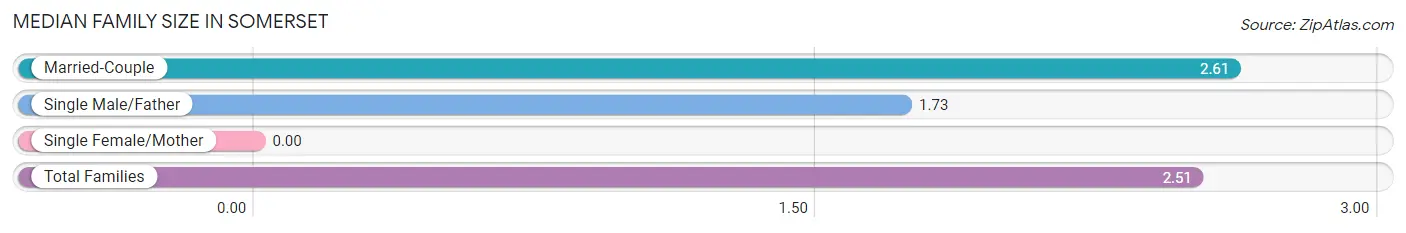
| Family Type | # Families | Family Size |
| Married-Couple | 89 (89.0%) | 2.61 |
| Single Male/Father | 11 (11.0%) | 1.73 |
| Single Female/Mother | 0 (0.0%) | - |
| Total Families | 100 (100.0%) | 2.51 |
Median Household Size in Somerset
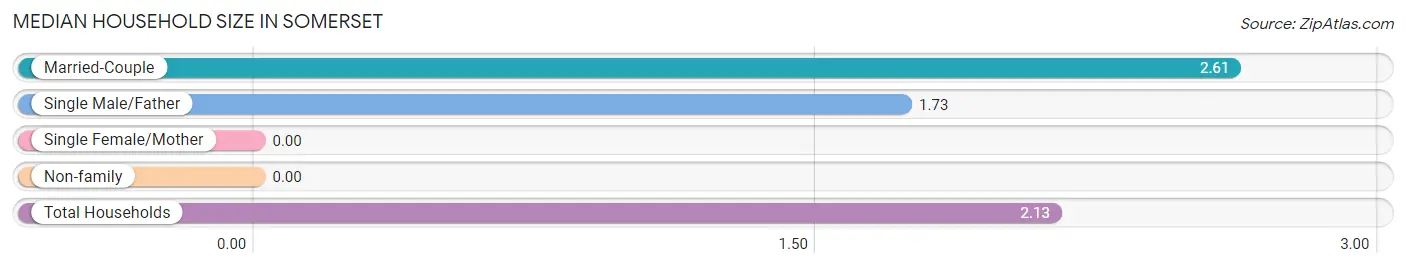
| Household Type | # Households | Household Size |
| Married-Couple | 89 (66.4%) | 2.61 |
| Single Male/Father | 11 (8.2%) | 1.73 |
| Single Female/Mother | 0 (0.0%) | - |
| Non-family | 34 (25.4%) | - |
| Total Households | 134 (100.0%) | 2.13 |
Household Size by Marriage Status in Somerset
Out of a total of 134 households in Somerset, 100 (74.6%) are family households, while 34 (25.4%) are nonfamily households. The most numerous type of family households are 2-person households, comprising 84, and the most common type of nonfamily households are 1-person households, comprising 34.
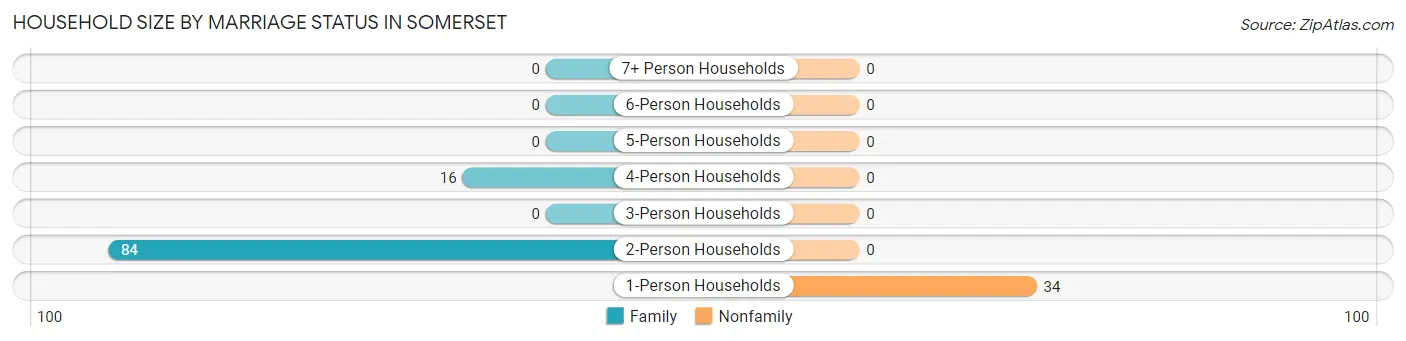
| Household Size | Family Households | Nonfamily Households |
| 1-Person Households | - | 34 (25.4%) |
| 2-Person Households | 84 (62.7%) | 0 (0.0%) |
| 3-Person Households | 0 (0.0%) | 0 (0.0%) |
| 4-Person Households | 16 (11.9%) | 0 (0.0%) |
| 5-Person Households | 0 (0.0%) | 0 (0.0%) |
| 6-Person Households | 0 (0.0%) | 0 (0.0%) |
| 7+ Person Households | 0 (0.0%) | 0 (0.0%) |
| Total | 100 (74.6%) | 34 (25.4%) |
Female Fertility in Somerset
Fertility by Age in Somerset
| Age Bracket | Women with Births | Births / 1,000 Women |
| 15 to 19 years | 0 (0.0%) | 0.0 |
| 20 to 34 years | 0 (0.0%) | 0.0 |
| 35 to 50 years | 0 (0.0%) | 0.0 |
| Total | 0 (0.0%) | 0.0 |
Fertility by Age by Marriage Status in Somerset
| Age Bracket | Married | Unmarried |
| 15 to 19 years | 0 (0.0%) | 0 (0.0%) |
| 20 to 34 years | 0 (0.0%) | 0 (0.0%) |
| 35 to 50 years | 0 (0.0%) | 0 (0.0%) |
| Total | 0 (0.0%) | 0 (0.0%) |
Fertility by Education in Somerset
| Educational Attainment | Women with Births | Births / 1,000 Women |
| Less than High School | 0 (0.0%) | 0.0 |
| High School Diploma | 0 (0.0%) | 0.0 |
| College or Associate's Degree | 0 (0.0%) | 0.0 |
| Bachelor's Degree | 0 (0.0%) | 0.0 |
| Graduate Degree | 0 (0.0%) | 0.0 |
| Total | 0 (0.0%) | 0.0 |
Fertility by Education by Marriage Status in Somerset
| Educational Attainment | Married | Unmarried |
| Less than High School | 0 (0.0%) | 0 (0.0%) |
| High School Diploma | 0 (0.0%) | 0 (0.0%) |
| College or Associate's Degree | 0 (0.0%) | 0 (0.0%) |
| Bachelor's Degree | 0 (0.0%) | 0 (0.0%) |
| Graduate Degree | 0 (0.0%) | 0 (0.0%) |
| Total | 0 (0.0%) | 0 (0.0%) |
Employment Characteristics in Somerset
Employment by Class of Employer in Somerset
Among the 107 employed individuals in Somerset, private company employees (91 | 85.1%), and self-employed (not incorporated) (16 | 14.9%) make up the most common classes of employment.
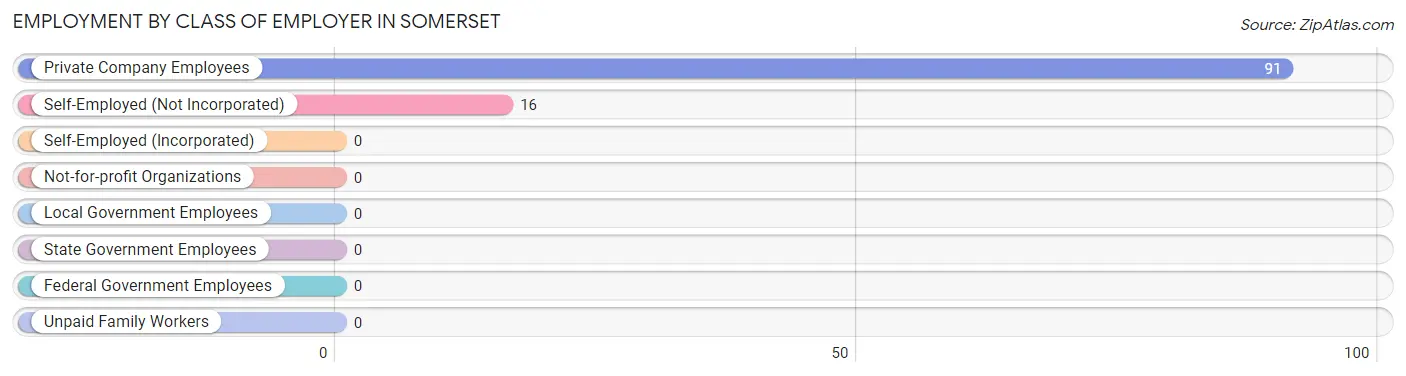
| Employer Class | # Employees | % Employees |
| Private Company Employees | 91 | 85.1% |
| Self-Employed (Incorporated) | 0 | 0.0% |
| Self-Employed (Not Incorporated) | 16 | 14.9% |
| Not-for-profit Organizations | 0 | 0.0% |
| Local Government Employees | 0 | 0.0% |
| State Government Employees | 0 | 0.0% |
| Federal Government Employees | 0 | 0.0% |
| Unpaid Family Workers | 0 | 0.0% |
| Total | 107 | 100.0% |
Employment Status by Age in Somerset
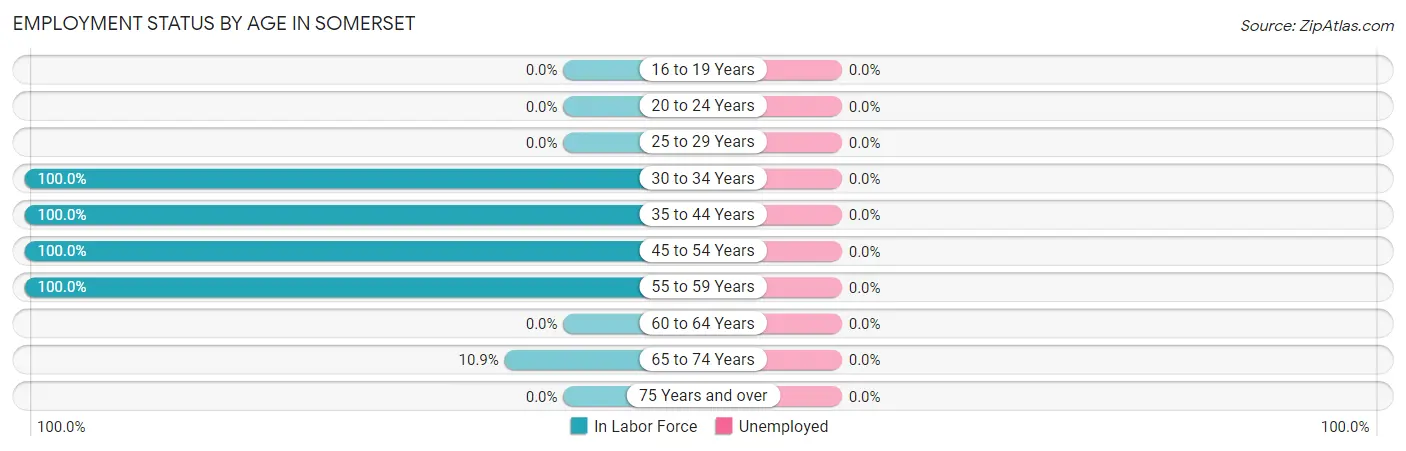
| Age Bracket | In Labor Force | Unemployed |
| 16 to 19 Years | 0 (0.0%) | 0 (0.0%) |
| 20 to 24 Years | 0 (0.0%) | 0 (0.0%) |
| 25 to 29 Years | 0 (0.0%) | 0 (0.0%) |
| 30 to 34 Years | 26 (100.0%) | 0 (0.0%) |
| 35 to 44 Years | 16 (100.0%) | 0 (0.0%) |
| 45 to 54 Years | 22 (100.0%) | 0 (0.0%) |
| 55 to 59 Years | 36 (100.0%) | 0 (0.0%) |
| 60 to 64 Years | 0 (0.0%) | 0 (0.0%) |
| 65 to 74 Years | 7 (10.9%) | 0 (0.0%) |
| 75 Years and over | 0 (0.0%) | 0 (0.0%) |
| Total | 107 (38.6%) | 0 (0.0%) |
Employment Status by Educational Attainment in Somerset
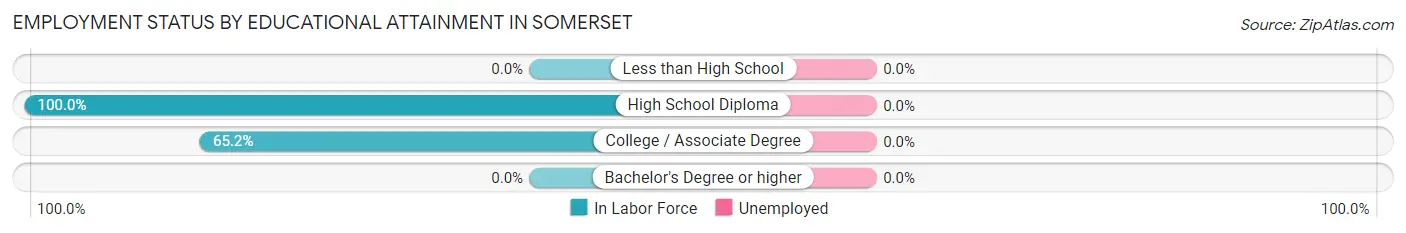
| Educational Attainment | In Labor Force | Unemployed |
| Less than High School | 0 (0.0%) | 0 (0.0%) |
| High School Diploma | 85 (100.0%) | 0 (0.0%) |
| College / Associate Degree | 15 (65.2%) | 0 (0.0%) |
| Bachelor's Degree or higher | 0 (0.0%) | 0 (0.0%) |
| Total | 100 (70.9%) | 0 (0.0%) |
Employment Occupations by Sex in Somerset
Management, Business, Science and Arts Occupations
Management, Business, Science and Arts Occupations by Sex
| Occupation | Male | Female |
| Management | 0 (0.0%) | 0 (0.0%) |
| Business & Financial | 0 (0.0%) | 0 (0.0%) |
| Computers, Engineering & Science | 0 (0.0%) | 0 (0.0%) |
| Computers & Mathematics | 0 (0.0%) | 0 (0.0%) |
| Architecture & Engineering | 0 (0.0%) | 0 (0.0%) |
| Life, Physical & Social Science | 0 (0.0%) | 0 (0.0%) |
| Community & Social Service | 0 (0.0%) | 0 (0.0%) |
| Education, Arts & Media | 0 (0.0%) | 0 (0.0%) |
| Legal Services & Support | 0 (0.0%) | 0 (0.0%) |
| Education Instruction & Library | 0 (0.0%) | 0 (0.0%) |
| Arts, Media & Entertainment | 0 (0.0%) | 0 (0.0%) |
| Health Diagnosing & Treating | 0 (0.0%) | 0 (0.0%) |
| Health Technologists | 0 (0.0%) | 0 (0.0%) |
| Total (Category) | 0 (0.0%) | 0 (0.0%) |
| Total (Overall) | 63 (58.9%) | 44 (41.1%) |
Services Occupations
The most common Services occupations in Somerset are , and Healthcare Support (29 | 27.1%).
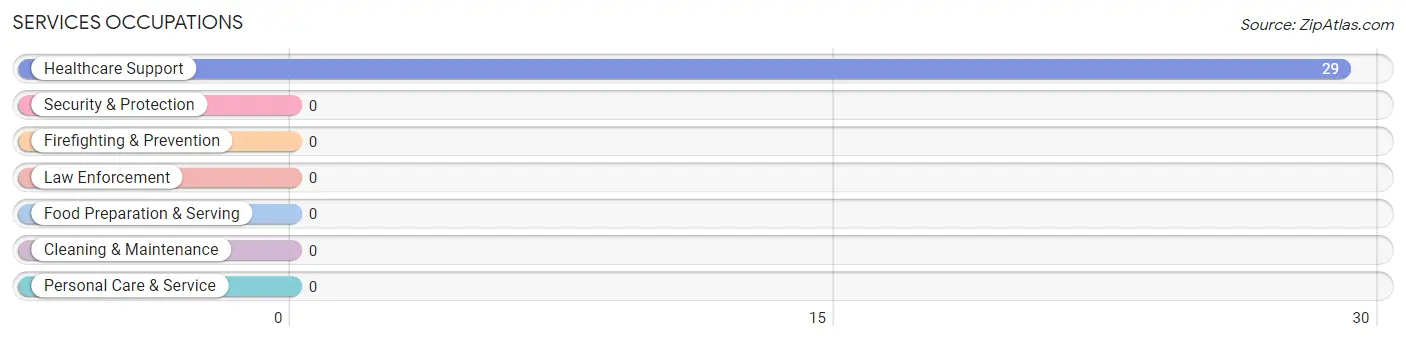
Services Occupations by Sex
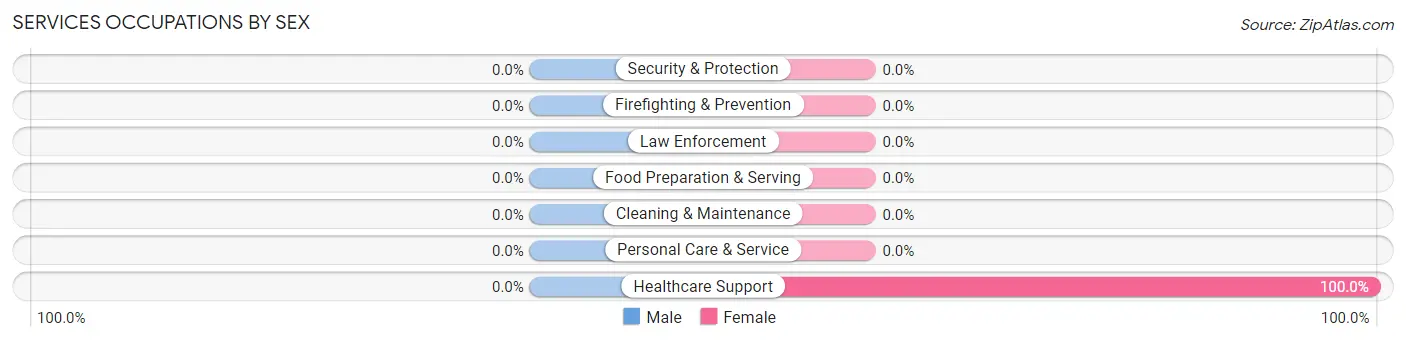
| Occupation | Male | Female |
| Healthcare Support | 0 (0.0%) | 29 (100.0%) |
| Security & Protection | 0 (0.0%) | 0 (0.0%) |
| Firefighting & Prevention | 0 (0.0%) | 0 (0.0%) |
| Law Enforcement | 0 (0.0%) | 0 (0.0%) |
| Food Preparation & Serving | 0 (0.0%) | 0 (0.0%) |
| Cleaning & Maintenance | 0 (0.0%) | 0 (0.0%) |
| Personal Care & Service | 0 (0.0%) | 0 (0.0%) |
| Total (Category) | 0 (0.0%) | 29 (100.0%) |
| Total (Overall) | 63 (58.9%) | 44 (41.1%) |
Sales and Office Occupations
The most common Sales and Office occupations in Somerset are Office & Administration (15 | 14.0%), and Sales & Related (11 | 10.3%).
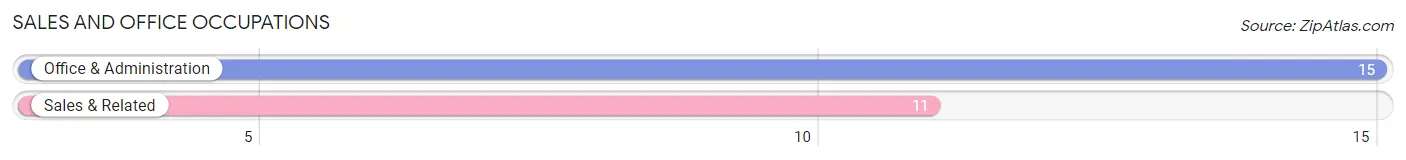
Sales and Office Occupations by Sex
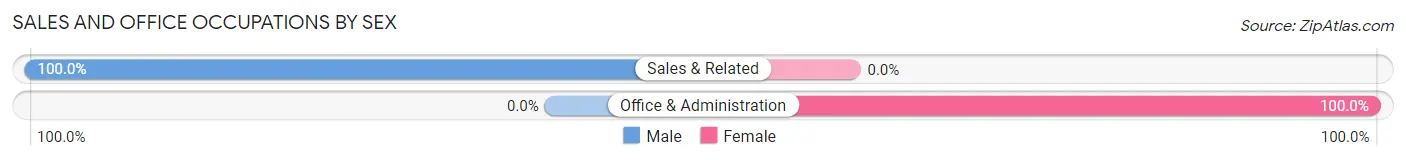
| Occupation | Male | Female |
| Sales & Related | 11 (100.0%) | 0 (0.0%) |
| Office & Administration | 0 (0.0%) | 15 (100.0%) |
| Total (Category) | 11 (42.3%) | 15 (57.7%) |
| Total (Overall) | 63 (58.9%) | 44 (41.1%) |
Natural Resources, Construction and Maintenance Occupations
Natural Resources, Construction and Maintenance Occupations by Sex
| Occupation | Male | Female |
| Farming, Fishing & Forestry | 0 (0.0%) | 0 (0.0%) |
| Construction & Extraction | 0 (0.0%) | 0 (0.0%) |
| Installation, Maintenance & Repair | 0 (0.0%) | 0 (0.0%) |
| Total (Category) | 0 (0.0%) | 0 (0.0%) |
| Total (Overall) | 63 (58.9%) | 44 (41.1%) |
Production, Transportation and Moving Occupations
The most common Production, Transportation and Moving occupations in Somerset are Production (36 | 33.6%), and Transportation (16 | 14.9%).
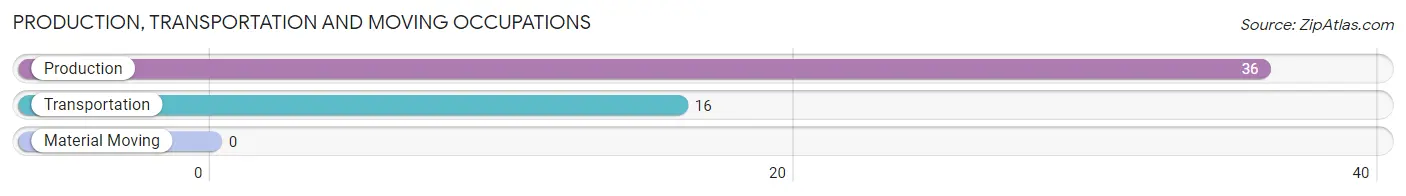
Production, Transportation and Moving Occupations by Sex
| Occupation | Male | Female |
| Production | 36 (100.0%) | 0 (0.0%) |
| Transportation | 16 (100.0%) | 0 (0.0%) |
| Material Moving | 0 (0.0%) | 0 (0.0%) |
| Total (Category) | 52 (100.0%) | 0 (0.0%) |
| Total (Overall) | 63 (58.9%) | 44 (41.1%) |
Employment Industries by Sex in Somerset
Employment Industries in Somerset
The major employment industries in Somerset include Manufacturing (51 | 47.7%), Health Care & Social Assistance (29 | 27.1%), Transportation & Warehousing (16 | 14.9%), and Retail Trade (11 | 10.3%).
Employment Industries by Sex in Somerset
The Somerset industries that see more men than women are Retail Trade (100.0%), Transportation & Warehousing (100.0%), and Manufacturing (70.6%), whereas the industries that tend to have a higher number of women are Health Care & Social Assistance (100.0%), and Manufacturing (29.4%).
| Industry | Male | Female |
| Agriculture, Fishing & Hunting | 0 (0.0%) | 0 (0.0%) |
| Mining, Quarrying, & Extraction | 0 (0.0%) | 0 (0.0%) |
| Construction | 0 (0.0%) | 0 (0.0%) |
| Manufacturing | 36 (70.6%) | 15 (29.4%) |
| Wholesale Trade | 0 (0.0%) | 0 (0.0%) |
| Retail Trade | 11 (100.0%) | 0 (0.0%) |
| Transportation & Warehousing | 16 (100.0%) | 0 (0.0%) |
| Utilities | 0 (0.0%) | 0 (0.0%) |
| Information | 0 (0.0%) | 0 (0.0%) |
| Finance & Insurance | 0 (0.0%) | 0 (0.0%) |
| Real Estate, Rental & Leasing | 0 (0.0%) | 0 (0.0%) |
| Professional & Scientific | 0 (0.0%) | 0 (0.0%) |
| Enterprise Management | 0 (0.0%) | 0 (0.0%) |
| Administrative & Support | 0 (0.0%) | 0 (0.0%) |
| Educational Services | 0 (0.0%) | 0 (0.0%) |
| Health Care & Social Assistance | 0 (0.0%) | 29 (100.0%) |
| Arts, Entertainment & Recreation | 0 (0.0%) | 0 (0.0%) |
| Accommodation & Food Services | 0 (0.0%) | 0 (0.0%) |
| Public Administration | 0 (0.0%) | 0 (0.0%) |
| Total | 63 (58.9%) | 44 (41.1%) |
Education in Somerset
School Enrollment in Somerset
The most common levels of schooling among the 33 students in Somerset are high school (25 | 75.8%), and nursery / preschool (8 | 24.2%).
| School Level | # Students | % Students |
| Nursery / Preschool | 8 | 24.2% |
| Kindergarten | 0 | 0.0% |
| Elementary School | 0 | 0.0% |
| Middle School | 0 | 0.0% |
| High School | 25 | 75.8% |
| College / Undergraduate | 0 | 0.0% |
| Graduate / Professional | 0 | 0.0% |
| Total | 33 | 100.0% |
School Enrollment by Age by Funding Source in Somerset
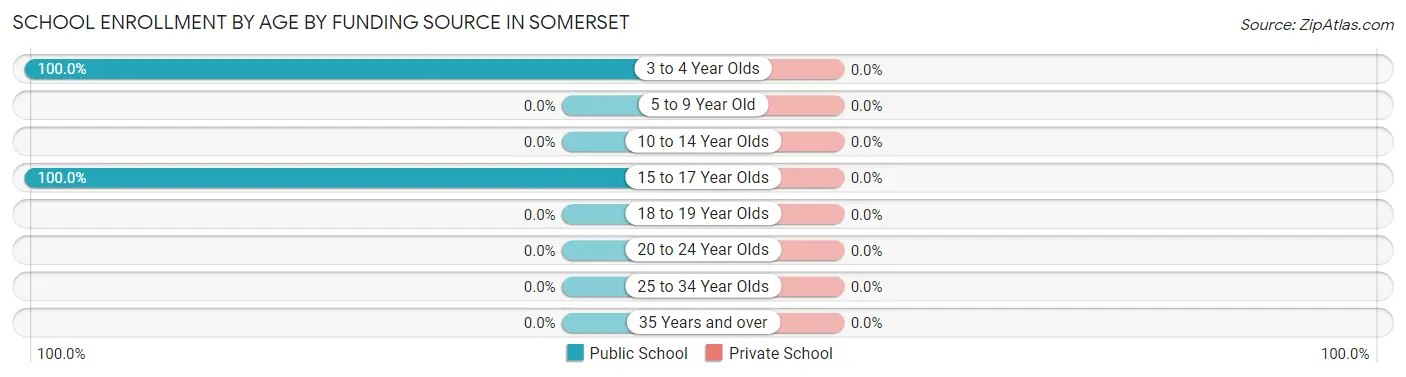
| Age Bracket | Public School | Private School |
| 3 to 4 Year Olds | 8 (100.0%) | 0 (0.0%) |
| 5 to 9 Year Old | 0 (0.0%) | 0 (0.0%) |
| 10 to 14 Year Olds | 0 (0.0%) | 0 (0.0%) |
| 15 to 17 Year Olds | 25 (100.0%) | 0 (0.0%) |
| 18 to 19 Year Olds | 0 (0.0%) | 0 (0.0%) |
| 20 to 24 Year Olds | 0 (0.0%) | 0 (0.0%) |
| 25 to 34 Year Olds | 0 (0.0%) | 0 (0.0%) |
| 35 Years and over | 0 (0.0%) | 0 (0.0%) |
| Total | 33 (100.0%) | 0 (0.0%) |
Educational Attainment by Field of Study in Somerset
| Field of Study | # Graduates | % Graduates |
| Computers & Mathematics | 0 | 0.0% |
| Bio, Nature & Agricultural | 0 | 0.0% |
| Physical & Health Sciences | 0 | 0.0% |
| Psychology | 0 | 0.0% |
| Social Sciences | 0 | 0.0% |
| Engineering | 0 | 0.0% |
| Multidisciplinary Studies | 0 | 0.0% |
| Science & Technology | 0 | 0.0% |
| Business | 0 | 0.0% |
| Education | 0 | 0.0% |
| Literature & Languages | 0 | 0.0% |
| Liberal Arts & History | 0 | 0.0% |
| Visual & Performing Arts | 0 | 0.0% |
| Communications | 0 | 0.0% |
| Arts & Humanities | 0 | 0.0% |
| Total | 0 | 0.0% |
Transportation & Commute in Somerset
Vehicle Availability by Sex in Somerset
The most prevalent vehicle ownership categories in Somerset are males with 2 vehicles (36, accounting for 57.1%) and females with 2 vehicles (22, making up 81.8%).
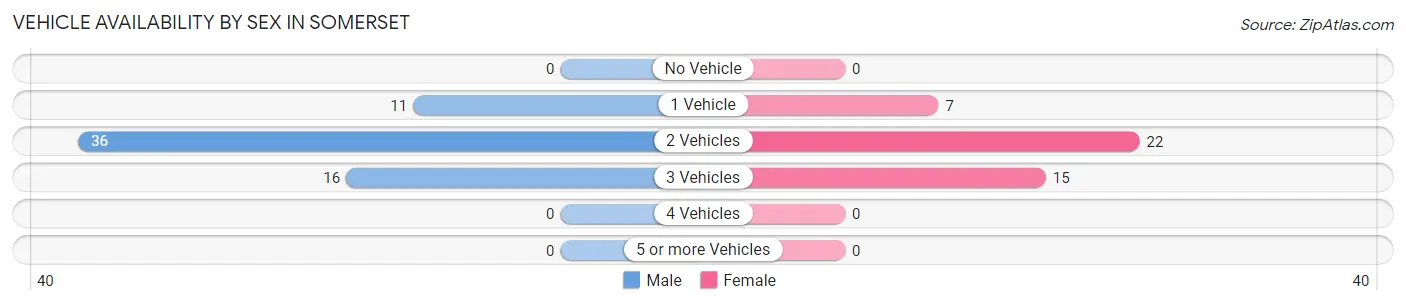
| Vehicles Available | Male | Female |
| No Vehicle | 0 (0.0%) | 0 (0.0%) |
| 1 Vehicle | 11 (17.5%) | 7 (15.9%) |
| 2 Vehicles | 36 (57.1%) | 22 (50.0%) |
| 3 Vehicles | 16 (25.4%) | 15 (34.1%) |
| 4 Vehicles | 0 (0.0%) | 0 (0.0%) |
| 5 or more Vehicles | 0 (0.0%) | 0 (0.0%) |
| Total | 63 (100.0%) | 44 (100.0%) |
Commute Time in Somerset
The most frequently occuring commute durations in Somerset are 15 to 19 minutes (58 commuters, 54.2%), 5 to 9 minutes (27 commuters, 25.2%), and 20 to 24 minutes (15 commuters, 14.0%).
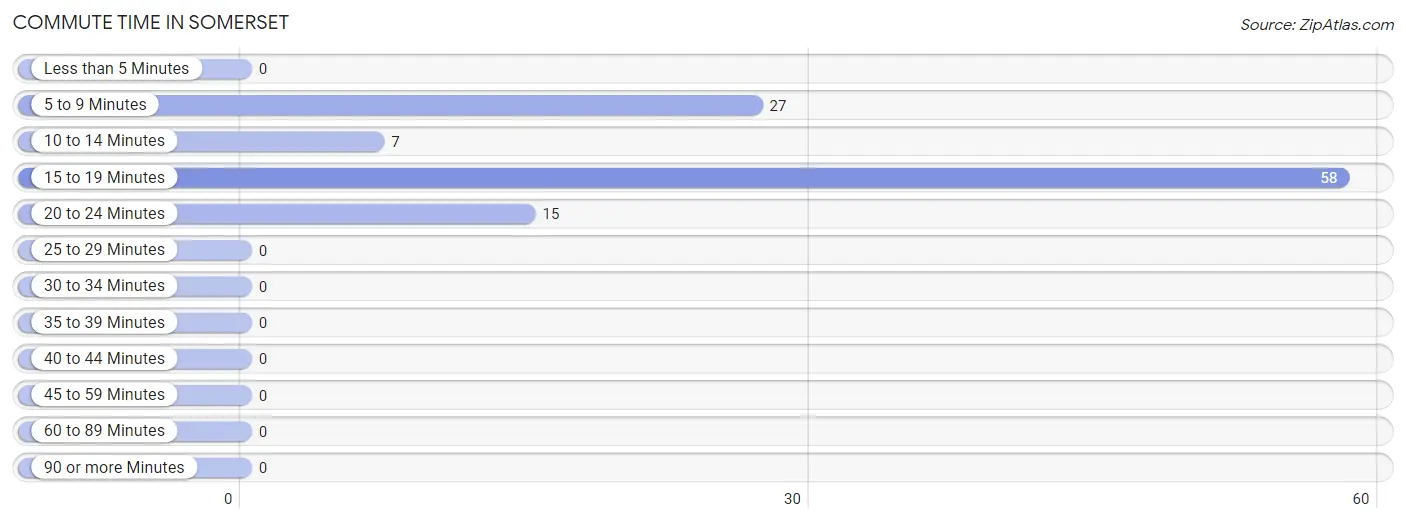
| Commute Time | # Commuters | % Commuters |
| Less than 5 Minutes | 0 | 0.0% |
| 5 to 9 Minutes | 27 | 25.2% |
| 10 to 14 Minutes | 7 | 6.5% |
| 15 to 19 Minutes | 58 | 54.2% |
| 20 to 24 Minutes | 15 | 14.0% |
| 25 to 29 Minutes | 0 | 0.0% |
| 30 to 34 Minutes | 0 | 0.0% |
| 35 to 39 Minutes | 0 | 0.0% |
| 40 to 44 Minutes | 0 | 0.0% |
| 45 to 59 Minutes | 0 | 0.0% |
| 60 to 89 Minutes | 0 | 0.0% |
| 90 or more Minutes | 0 | 0.0% |
Commute Time by Sex in Somerset
The most common commute times in Somerset are 15 to 19 minutes (36 commuters, 57.1%) for males and 15 to 19 minutes (22 commuters, 50.0%) for females.
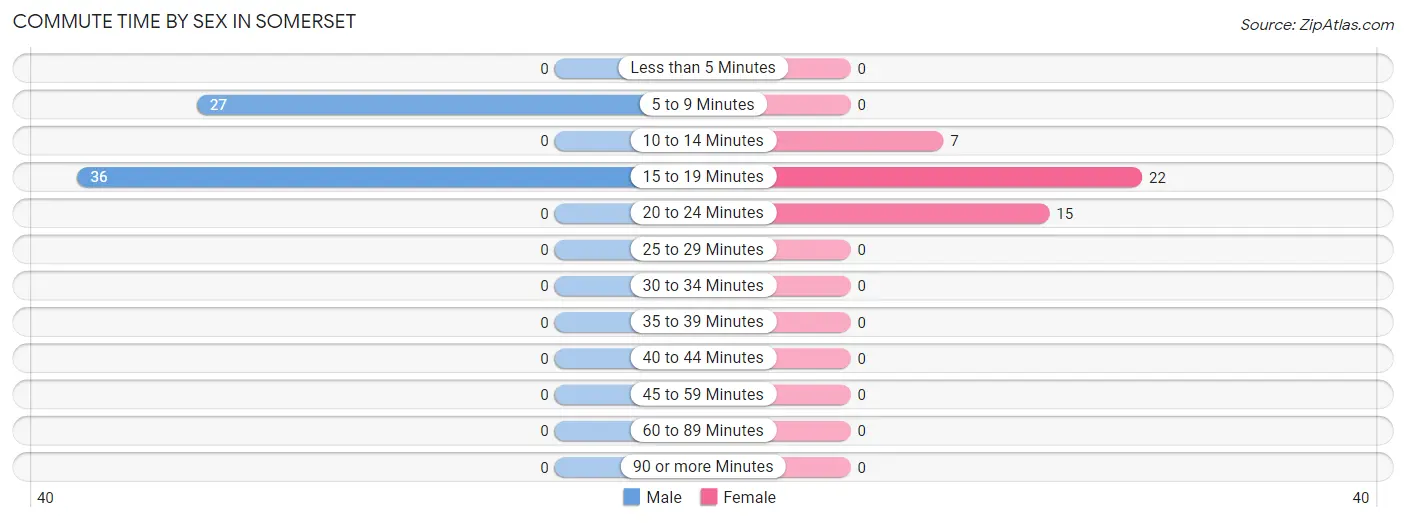
| Commute Time | Male | Female |
| Less than 5 Minutes | 0 (0.0%) | 0 (0.0%) |
| 5 to 9 Minutes | 27 (42.9%) | 0 (0.0%) |
| 10 to 14 Minutes | 0 (0.0%) | 7 (15.9%) |
| 15 to 19 Minutes | 36 (57.1%) | 22 (50.0%) |
| 20 to 24 Minutes | 0 (0.0%) | 15 (34.1%) |
| 25 to 29 Minutes | 0 (0.0%) | 0 (0.0%) |
| 30 to 34 Minutes | 0 (0.0%) | 0 (0.0%) |
| 35 to 39 Minutes | 0 (0.0%) | 0 (0.0%) |
| 40 to 44 Minutes | 0 (0.0%) | 0 (0.0%) |
| 45 to 59 Minutes | 0 (0.0%) | 0 (0.0%) |
| 60 to 89 Minutes | 0 (0.0%) | 0 (0.0%) |
| 90 or more Minutes | 0 (0.0%) | 0 (0.0%) |
Time of Departure to Work by Sex in Somerset
The most frequent times of departure to work in Somerset are 6:00 AM to 6:29 AM (36, 57.1%) for males and 5:00 AM to 5:29 AM (22, 50.0%) for females.
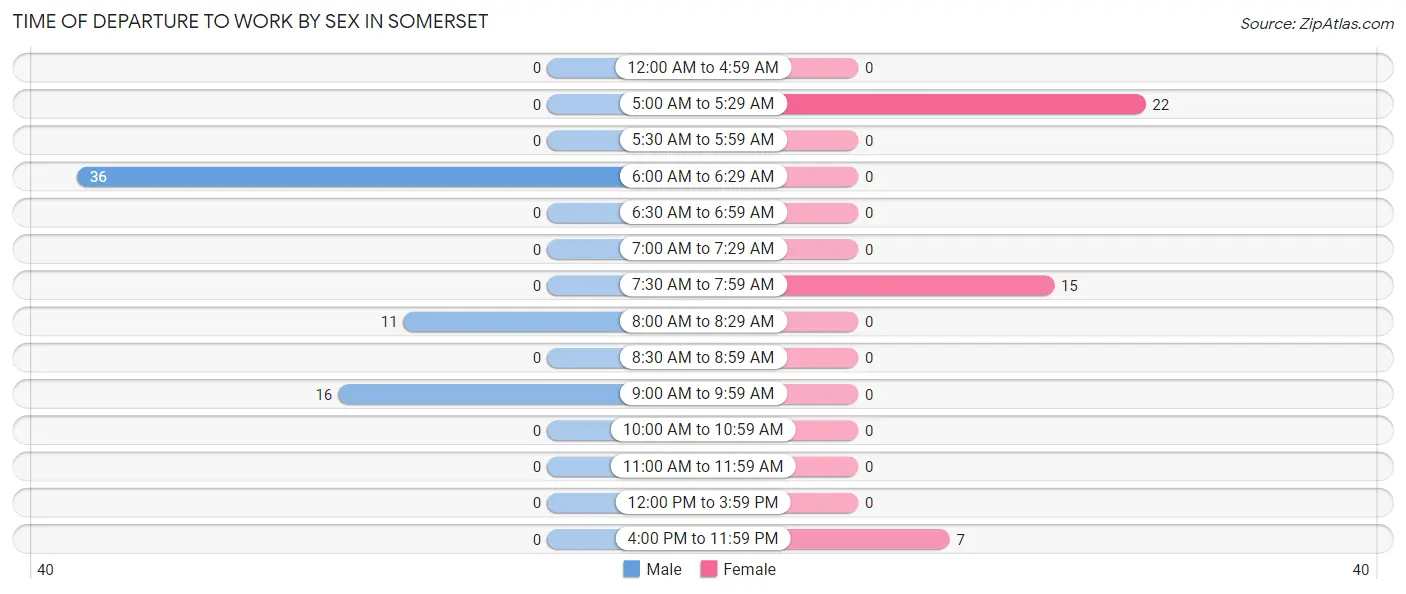
| Time of Departure | Male | Female |
| 12:00 AM to 4:59 AM | 0 (0.0%) | 0 (0.0%) |
| 5:00 AM to 5:29 AM | 0 (0.0%) | 22 (50.0%) |
| 5:30 AM to 5:59 AM | 0 (0.0%) | 0 (0.0%) |
| 6:00 AM to 6:29 AM | 36 (57.1%) | 0 (0.0%) |
| 6:30 AM to 6:59 AM | 0 (0.0%) | 0 (0.0%) |
| 7:00 AM to 7:29 AM | 0 (0.0%) | 0 (0.0%) |
| 7:30 AM to 7:59 AM | 0 (0.0%) | 15 (34.1%) |
| 8:00 AM to 8:29 AM | 11 (17.5%) | 0 (0.0%) |
| 8:30 AM to 8:59 AM | 0 (0.0%) | 0 (0.0%) |
| 9:00 AM to 9:59 AM | 16 (25.4%) | 0 (0.0%) |
| 10:00 AM to 10:59 AM | 0 (0.0%) | 0 (0.0%) |
| 11:00 AM to 11:59 AM | 0 (0.0%) | 0 (0.0%) |
| 12:00 PM to 3:59 PM | 0 (0.0%) | 0 (0.0%) |
| 4:00 PM to 11:59 PM | 0 (0.0%) | 7 (15.9%) |
| Total | 63 (100.0%) | 44 (100.0%) |
Housing Occupancy in Somerset
Occupancy by Ownership in Somerset
Of the total 134 dwellings in Somerset, owner-occupied units account for 107 (79.8%), while renter-occupied units make up 27 (20.2%).
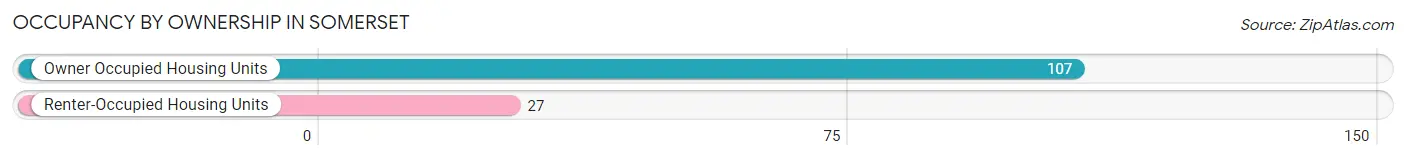
| Occupancy | # Housing Units | % Housing Units |
| Owner Occupied Housing Units | 107 | 79.8% |
| Renter-Occupied Housing Units | 27 | 20.2% |
| Total Occupied Housing Units | 134 | 100.0% |
Occupancy by Household Size in Somerset
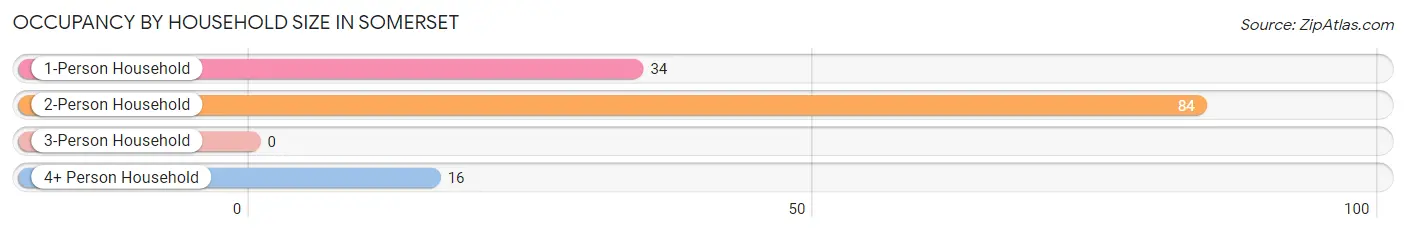
| Household Size | # Housing Units | % Housing Units |
| 1-Person Household | 34 | 25.4% |
| 2-Person Household | 84 | 62.7% |
| 3-Person Household | 0 | 0.0% |
| 4+ Person Household | 16 | 11.9% |
| Total Housing Units | 134 | 100.0% |
Occupancy by Ownership by Household Size in Somerset
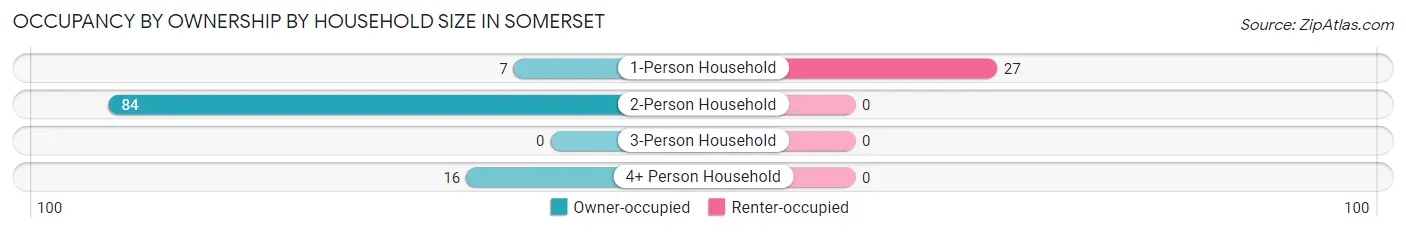
| Household Size | Owner-occupied | Renter-occupied |
| 1-Person Household | 7 (20.6%) | 27 (79.4%) |
| 2-Person Household | 84 (100.0%) | 0 (0.0%) |
| 3-Person Household | 0 (0.0%) | 0 (0.0%) |
| 4+ Person Household | 16 (100.0%) | 0 (0.0%) |
| Total Housing Units | 107 (79.8%) | 27 (20.2%) |
Occupancy by Educational Attainment in Somerset
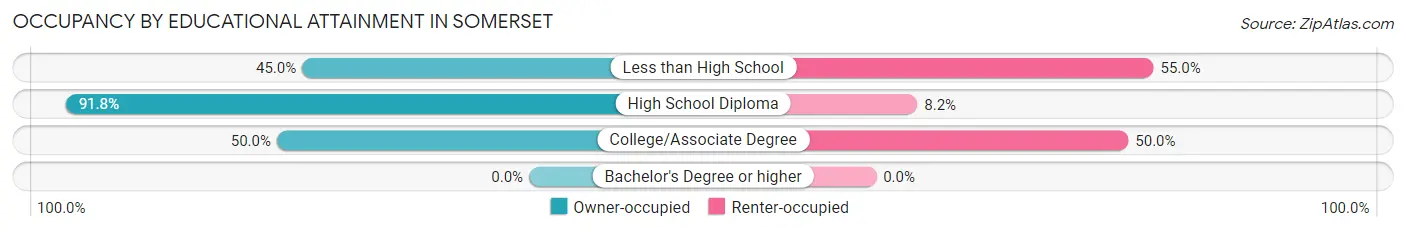
| Household Size | Owner-occupied | Renter-occupied |
| Less than High School | 9 (45.0%) | 11 (55.0%) |
| High School Diploma | 90 (91.8%) | 8 (8.2%) |
| College/Associate Degree | 8 (50.0%) | 8 (50.0%) |
| Bachelor's Degree or higher | 0 (0.0%) | 0 (0.0%) |
Occupancy by Age of Householder in Somerset
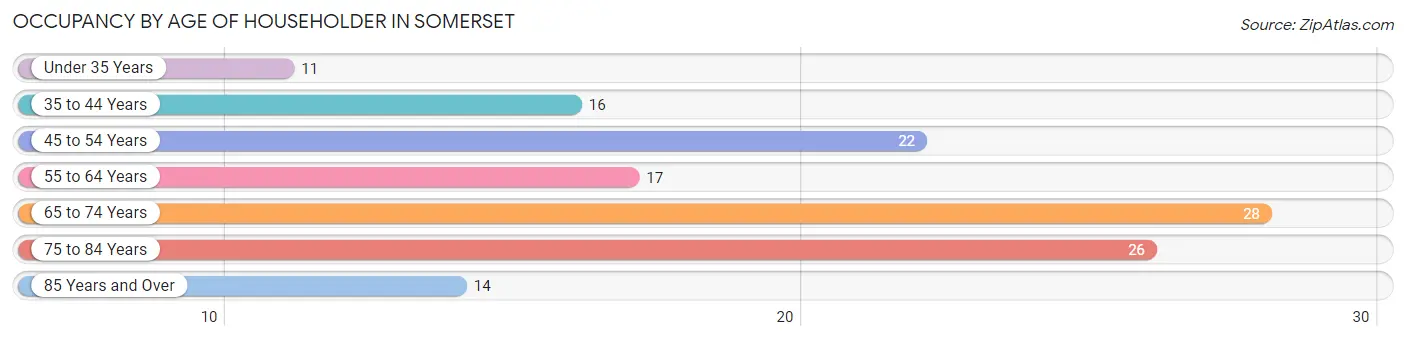
| Age Bracket | # Households | % Households |
| Under 35 Years | 11 | 8.2% |
| 35 to 44 Years | 16 | 11.9% |
| 45 to 54 Years | 22 | 16.4% |
| 55 to 64 Years | 17 | 12.7% |
| 65 to 74 Years | 28 | 20.9% |
| 75 to 84 Years | 26 | 19.4% |
| 85 Years and Over | 14 | 10.4% |
| Total | 134 | 100.0% |
Housing Finances in Somerset
Median Income by Occupancy in Somerset
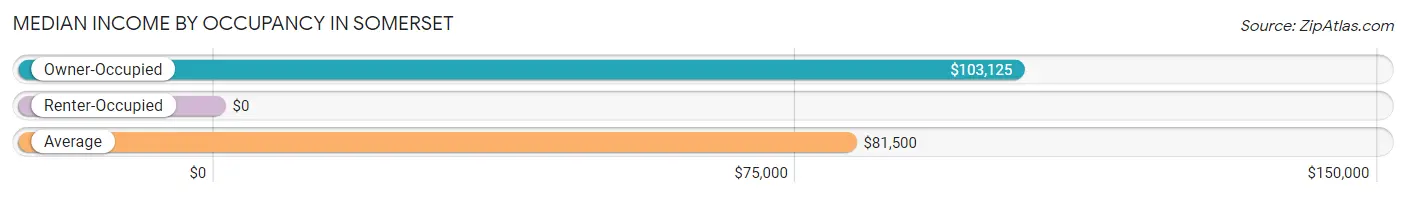
| Occupancy Type | # Households | Median Income |
| Owner-Occupied | 107 (79.8%) | $103,125 |
| Renter-Occupied | 27 (20.2%) | $0 |
| Average | 134 (100.0%) | $81,500 |
Occupancy by Householder Income Bracket in Somerset
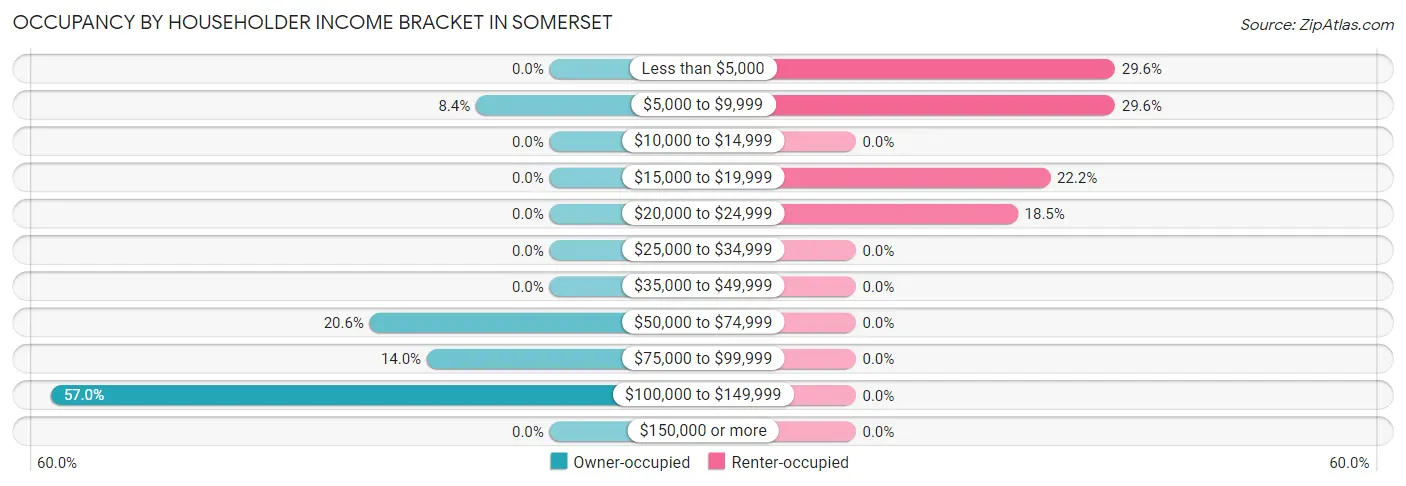
| Income Bracket | Owner-occupied | Renter-occupied |
| Less than $5,000 | 0 (0.0%) | 8 (29.6%) |
| $5,000 to $9,999 | 9 (8.4%) | 8 (29.6%) |
| $10,000 to $14,999 | 0 (0.0%) | 0 (0.0%) |
| $15,000 to $19,999 | 0 (0.0%) | 6 (22.2%) |
| $20,000 to $24,999 | 0 (0.0%) | 5 (18.5%) |
| $25,000 to $34,999 | 0 (0.0%) | 0 (0.0%) |
| $35,000 to $49,999 | 0 (0.0%) | 0 (0.0%) |
| $50,000 to $74,999 | 22 (20.6%) | 0 (0.0%) |
| $75,000 to $99,999 | 15 (14.0%) | 0 (0.0%) |
| $100,000 to $149,999 | 61 (57.0%) | 0 (0.0%) |
| $150,000 or more | 0 (0.0%) | 0 (0.0%) |
| Total | 107 (100.0%) | 27 (100.0%) |
Monthly Housing Cost Tiers in Somerset
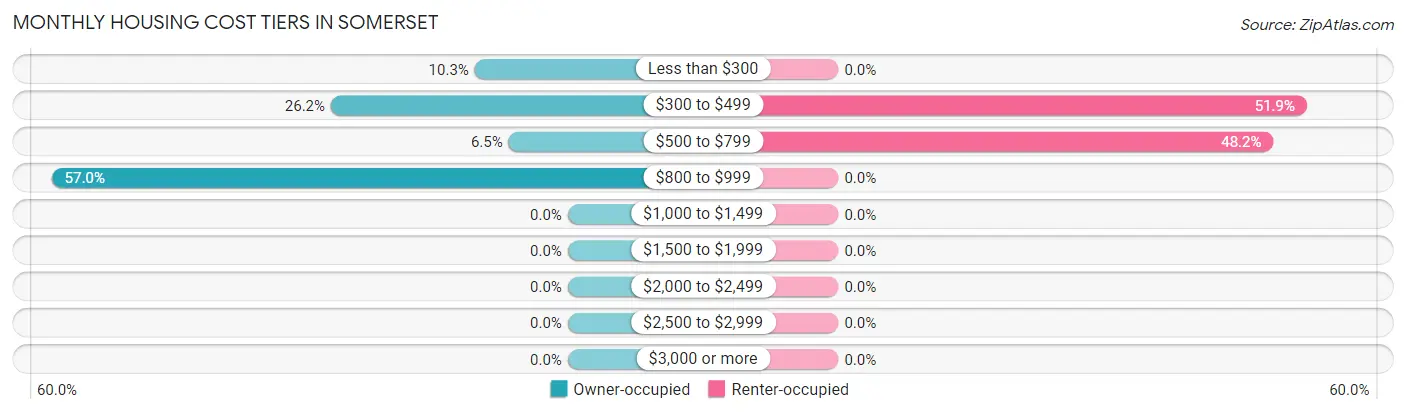
| Monthly Cost | Owner-occupied | Renter-occupied |
| Less than $300 | 11 (10.3%) | 0 (0.0%) |
| $300 to $499 | 28 (26.2%) | 14 (51.8%) |
| $500 to $799 | 7 (6.5%) | 13 (48.1%) |
| $800 to $999 | 61 (57.0%) | 0 (0.0%) |
| $1,000 to $1,499 | 0 (0.0%) | 0 (0.0%) |
| $1,500 to $1,999 | 0 (0.0%) | 0 (0.0%) |
| $2,000 to $2,499 | 0 (0.0%) | 0 (0.0%) |
| $2,500 to $2,999 | 0 (0.0%) | 0 (0.0%) |
| $3,000 or more | 0 (0.0%) | 0 (0.0%) |
| Total | 107 (100.0%) | 27 (100.0%) |
Physical Housing Characteristics in Somerset
Housing Structures in Somerset
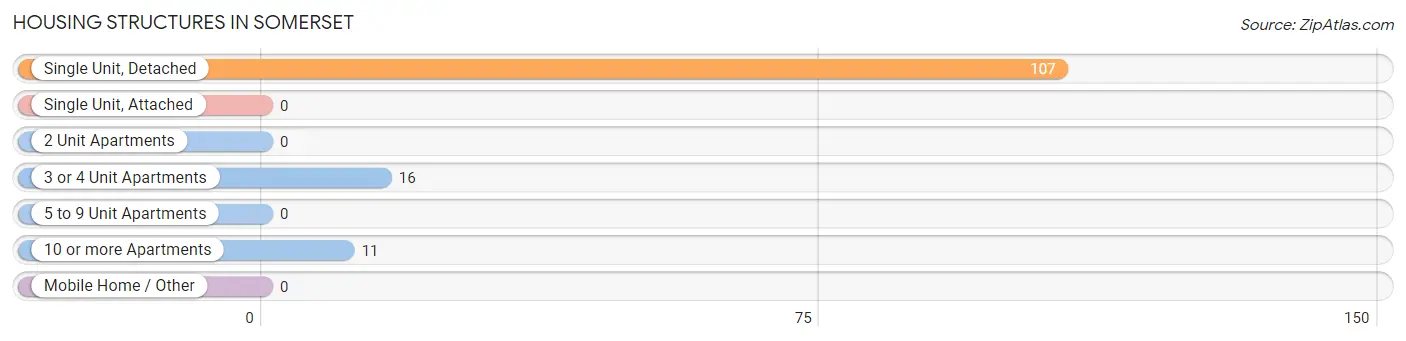
| Structure Type | # Housing Units | % Housing Units |
| Single Unit, Detached | 107 | 79.8% |
| Single Unit, Attached | 0 | 0.0% |
| 2 Unit Apartments | 0 | 0.0% |
| 3 or 4 Unit Apartments | 16 | 11.9% |
| 5 to 9 Unit Apartments | 0 | 0.0% |
| 10 or more Apartments | 11 | 8.2% |
| Mobile Home / Other | 0 | 0.0% |
| Total | 134 | 100.0% |
Housing Structures by Occupancy in Somerset
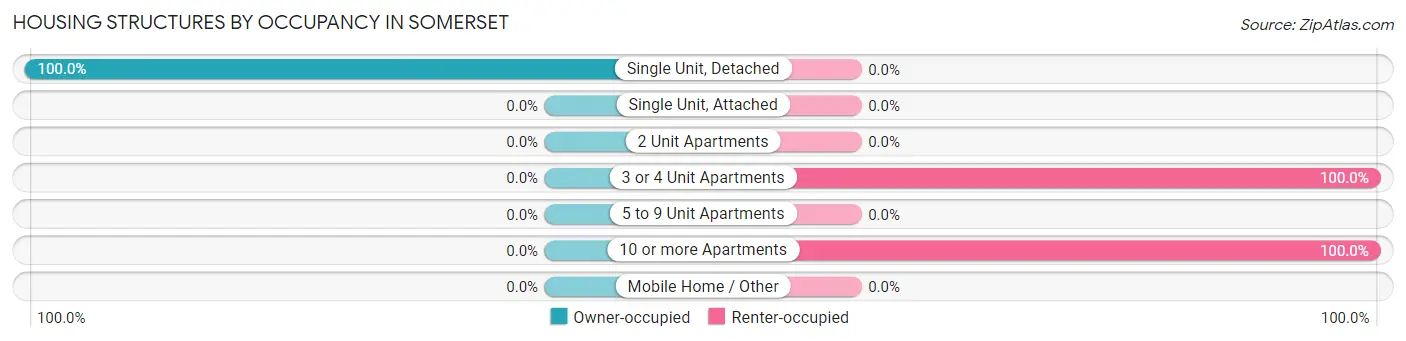
| Structure Type | Owner-occupied | Renter-occupied |
| Single Unit, Detached | 107 (100.0%) | 0 (0.0%) |
| Single Unit, Attached | 0 (0.0%) | 0 (0.0%) |
| 2 Unit Apartments | 0 (0.0%) | 0 (0.0%) |
| 3 or 4 Unit Apartments | 0 (0.0%) | 16 (100.0%) |
| 5 to 9 Unit Apartments | 0 (0.0%) | 0 (0.0%) |
| 10 or more Apartments | 0 (0.0%) | 11 (100.0%) |
| Mobile Home / Other | 0 (0.0%) | 0 (0.0%) |
| Total | 107 (79.8%) | 27 (20.2%) |
Housing Structures by Number of Rooms in Somerset
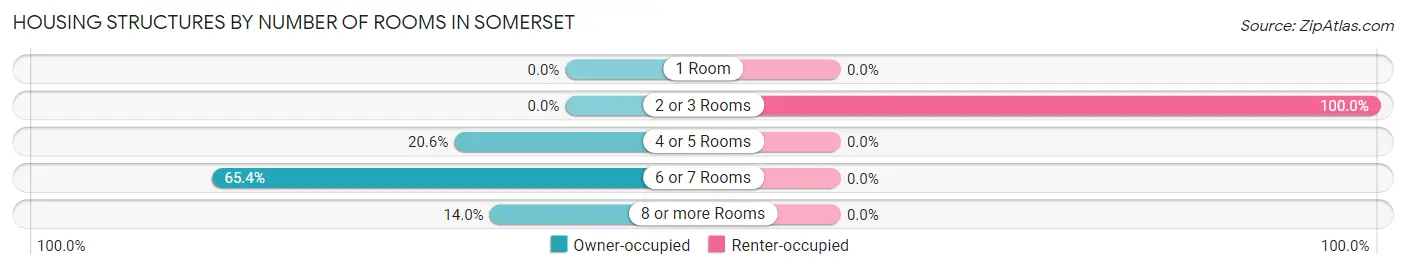
| Number of Rooms | Owner-occupied | Renter-occupied |
| 1 Room | 0 (0.0%) | 0 (0.0%) |
| 2 or 3 Rooms | 0 (0.0%) | 27 (100.0%) |
| 4 or 5 Rooms | 22 (20.6%) | 0 (0.0%) |
| 6 or 7 Rooms | 70 (65.4%) | 0 (0.0%) |
| 8 or more Rooms | 15 (14.0%) | 0 (0.0%) |
| Total | 107 (100.0%) | 27 (100.0%) |
Housing Structure by Heating Type in Somerset
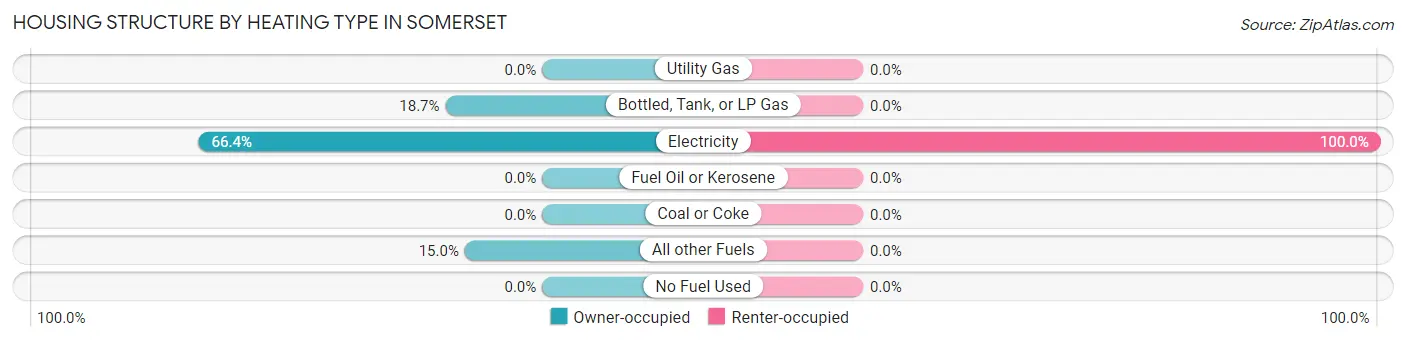
| Heating Type | Owner-occupied | Renter-occupied |
| Utility Gas | 0 (0.0%) | 0 (0.0%) |
| Bottled, Tank, or LP Gas | 20 (18.7%) | 0 (0.0%) |
| Electricity | 71 (66.4%) | 27 (100.0%) |
| Fuel Oil or Kerosene | 0 (0.0%) | 0 (0.0%) |
| Coal or Coke | 0 (0.0%) | 0 (0.0%) |
| All other Fuels | 16 (14.9%) | 0 (0.0%) |
| No Fuel Used | 0 (0.0%) | 0 (0.0%) |
| Total | 107 (100.0%) | 27 (100.0%) |
Household Vehicle Usage in Somerset
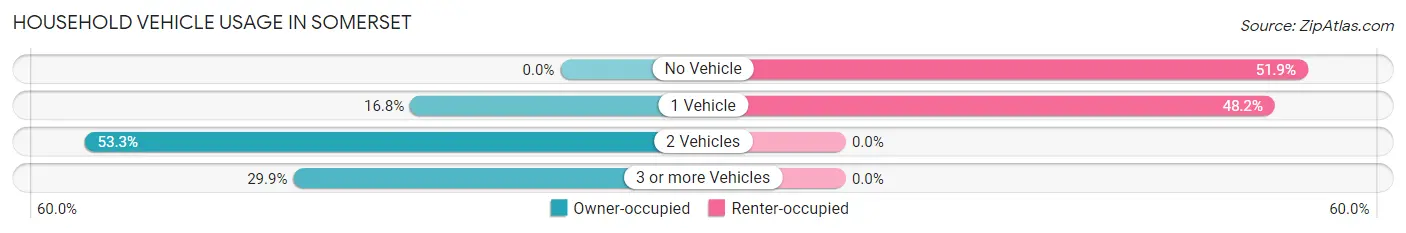
| Vehicles per Household | Owner-occupied | Renter-occupied |
| No Vehicle | 0 (0.0%) | 14 (51.8%) |
| 1 Vehicle | 18 (16.8%) | 13 (48.1%) |
| 2 Vehicles | 57 (53.3%) | 0 (0.0%) |
| 3 or more Vehicles | 32 (29.9%) | 0 (0.0%) |
| Total | 107 (100.0%) | 27 (100.0%) |
Real Estate & Mortgages in Somerset
Real Estate and Mortgage Overview in Somerset
| Characteristic | Without Mortgage | With Mortgage |
| Housing Units | 30 | 77 |
| Median Property Value | $275,000 | $77,800 |
| Median Household Income | $70,909 | $0 |
| Monthly Housing Costs | $361 | $0 |
| Real Estate Taxes | $642 | $0 |
Property Value by Mortgage Status in Somerset
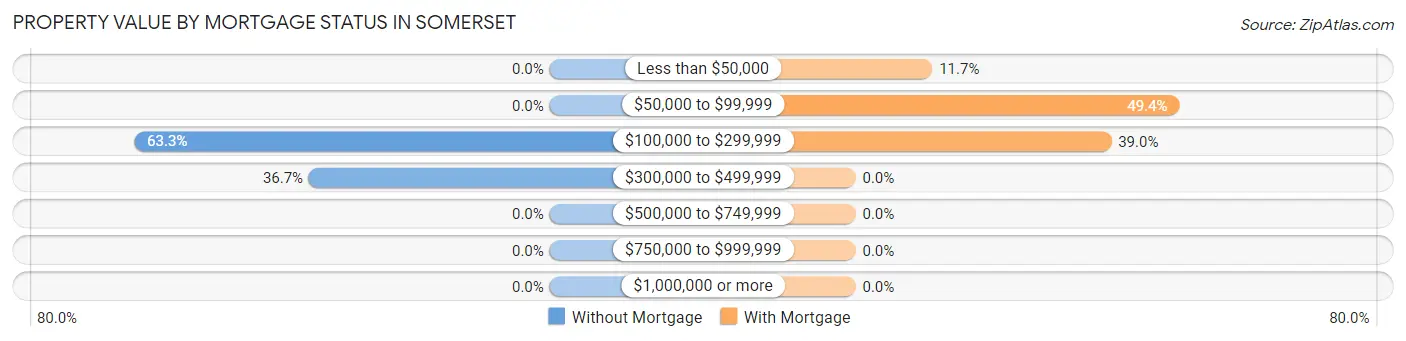
| Property Value | Without Mortgage | With Mortgage |
| Less than $50,000 | 0 (0.0%) | 9 (11.7%) |
| $50,000 to $99,999 | 0 (0.0%) | 38 (49.3%) |
| $100,000 to $299,999 | 19 (63.3%) | 30 (39.0%) |
| $300,000 to $499,999 | 11 (36.7%) | 0 (0.0%) |
| $500,000 to $749,999 | 0 (0.0%) | 0 (0.0%) |
| $750,000 to $999,999 | 0 (0.0%) | 0 (0.0%) |
| $1,000,000 or more | 0 (0.0%) | 0 (0.0%) |
| Total | 30 (100.0%) | 77 (100.0%) |
Household Income by Mortgage Status in Somerset
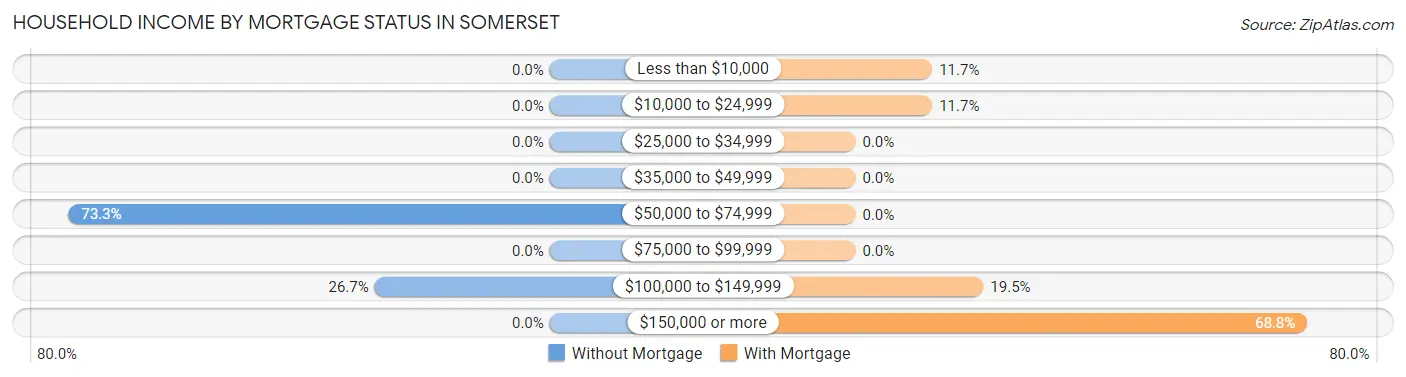
| Household Income | Without Mortgage | With Mortgage |
| Less than $10,000 | 0 (0.0%) | 9 (11.7%) |
| $10,000 to $24,999 | 0 (0.0%) | 9 (11.7%) |
| $25,000 to $34,999 | 0 (0.0%) | 0 (0.0%) |
| $35,000 to $49,999 | 0 (0.0%) | 0 (0.0%) |
| $50,000 to $74,999 | 22 (73.3%) | 0 (0.0%) |
| $75,000 to $99,999 | 0 (0.0%) | 0 (0.0%) |
| $100,000 to $149,999 | 8 (26.7%) | 15 (19.5%) |
| $150,000 or more | 0 (0.0%) | 53 (68.8%) |
| Total | 30 (100.0%) | 77 (100.0%) |
Property Value to Household Income Ratio in Somerset
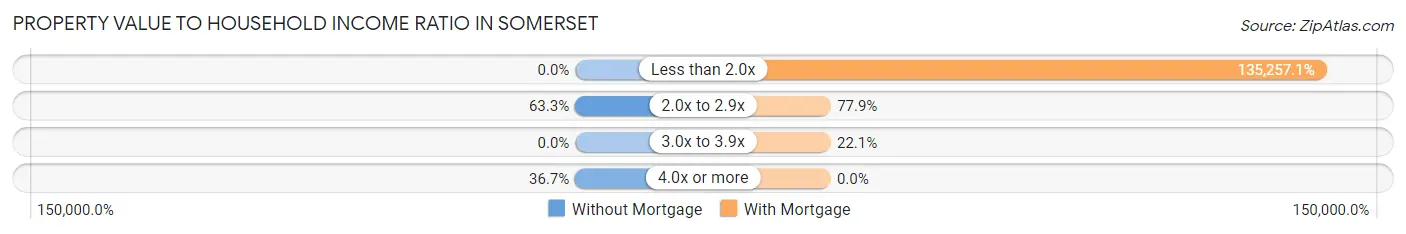
| Value-to-Income Ratio | Without Mortgage | With Mortgage |
| Less than 2.0x | 0 (0.0%) | 104,148 (135,257.1%) |
| 2.0x to 2.9x | 19 (63.3%) | 60 (77.9%) |
| 3.0x to 3.9x | 0 (0.0%) | 17 (22.1%) |
| 4.0x or more | 11 (36.7%) | 0 (0.0%) |
| Total | 30 (100.0%) | 77 (100.0%) |
Real Estate Taxes by Mortgage Status in Somerset
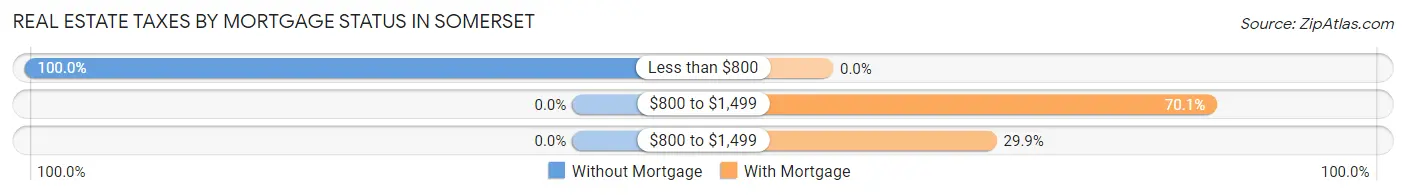
| Property Taxes | Without Mortgage | With Mortgage |
| Less than $800 | 30 (100.0%) | 0 (0.0%) |
| $800 to $1,499 | 0 (0.0%) | 54 (70.1%) |
| $800 to $1,499 | 0 (0.0%) | 23 (29.9%) |
| Total | 30 (100.0%) | 77 (100.0%) |
Health & Disability in Somerset
Health Insurance Coverage by Age in Somerset
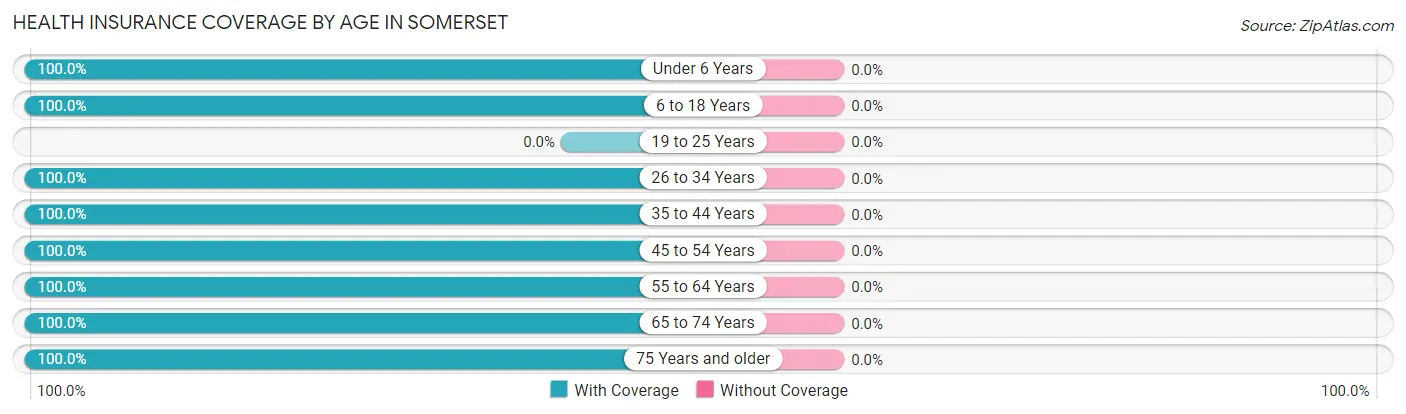
| Age Bracket | With Coverage | Without Coverage |
| Under 6 Years | 8 (100.0%) | 0 (0.0%) |
| 6 to 18 Years | 25 (100.0%) | 0 (0.0%) |
| 19 to 25 Years | 0 (0.0%) | 0 (0.0%) |
| 26 to 34 Years | 26 (100.0%) | 0 (0.0%) |
| 35 to 44 Years | 16 (100.0%) | 0 (0.0%) |
| 45 to 54 Years | 22 (100.0%) | 0 (0.0%) |
| 55 to 64 Years | 77 (100.0%) | 0 (0.0%) |
| 65 to 74 Years | 64 (100.0%) | 0 (0.0%) |
| 75 Years and older | 47 (100.0%) | 0 (0.0%) |
| Total | 285 (100.0%) | 0 (0.0%) |
Health Insurance Coverage by Citizenship Status in Somerset
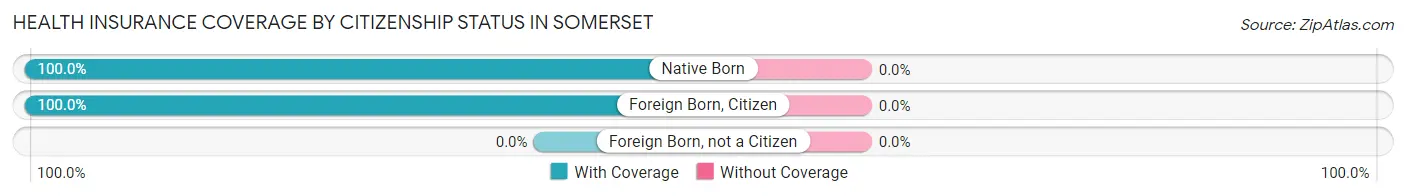
| Citizenship Status | With Coverage | Without Coverage |
| Native Born | 8 (100.0%) | 0 (0.0%) |
| Foreign Born, Citizen | 25 (100.0%) | 0 (0.0%) |
| Foreign Born, not a Citizen | 0 (0.0%) | 0 (0.0%) |
Health Insurance Coverage by Household Income in Somerset
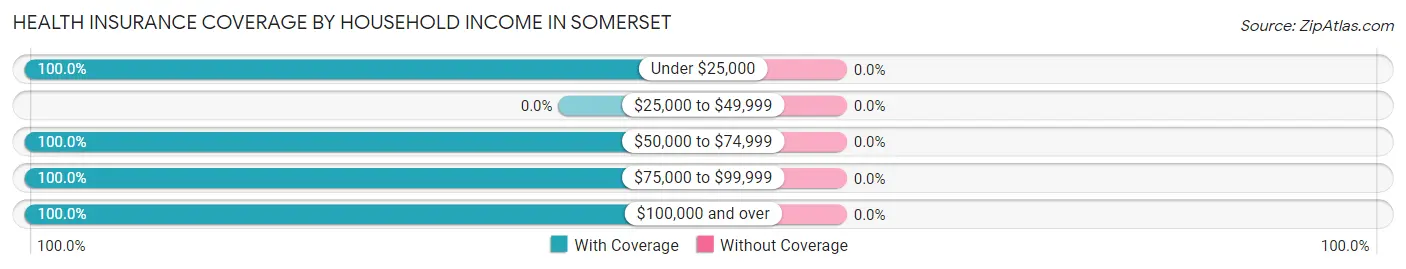
| Household Income | With Coverage | Without Coverage |
| Under $25,000 | 43 (100.0%) | 0 (0.0%) |
| $25,000 to $49,999 | 0 (0.0%) | 0 (0.0%) |
| $50,000 to $74,999 | 39 (100.0%) | 0 (0.0%) |
| $75,000 to $99,999 | 34 (100.0%) | 0 (0.0%) |
| $100,000 and over | 169 (100.0%) | 0 (0.0%) |
Public vs Private Health Insurance Coverage by Age in Somerset
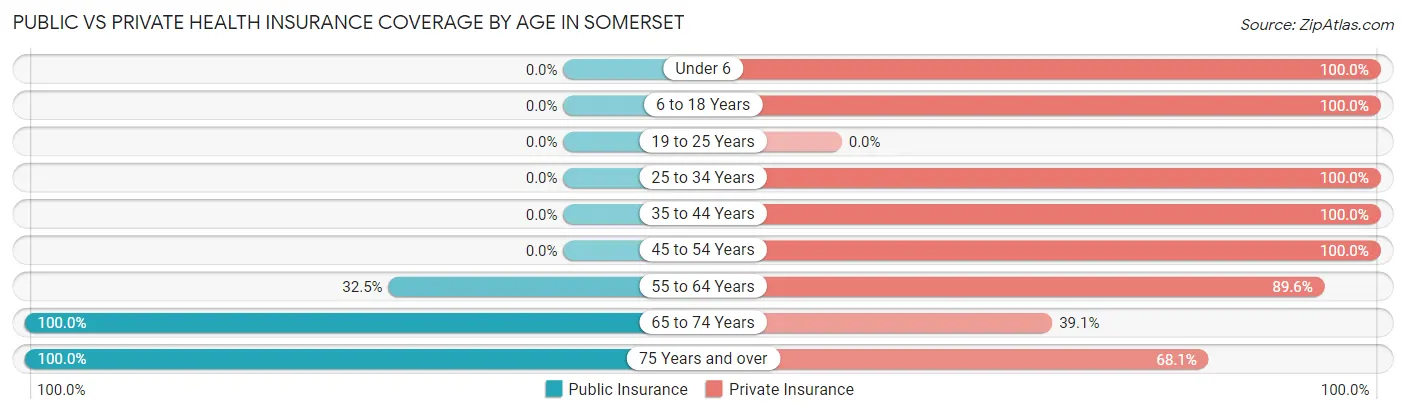
| Age Bracket | Public Insurance | Private Insurance |
| Under 6 | 0 (0.0%) | 8 (100.0%) |
| 6 to 18 Years | 0 (0.0%) | 25 (100.0%) |
| 19 to 25 Years | 0 (0.0%) | 0 (0.0%) |
| 25 to 34 Years | 0 (0.0%) | 26 (100.0%) |
| 35 to 44 Years | 0 (0.0%) | 16 (100.0%) |
| 45 to 54 Years | 0 (0.0%) | 22 (100.0%) |
| 55 to 64 Years | 25 (32.5%) | 69 (89.6%) |
| 65 to 74 Years | 64 (100.0%) | 25 (39.1%) |
| 75 Years and over | 47 (100.0%) | 32 (68.1%) |
| Total | 136 (47.7%) | 223 (78.2%) |
Disability Status by Sex by Age in Somerset
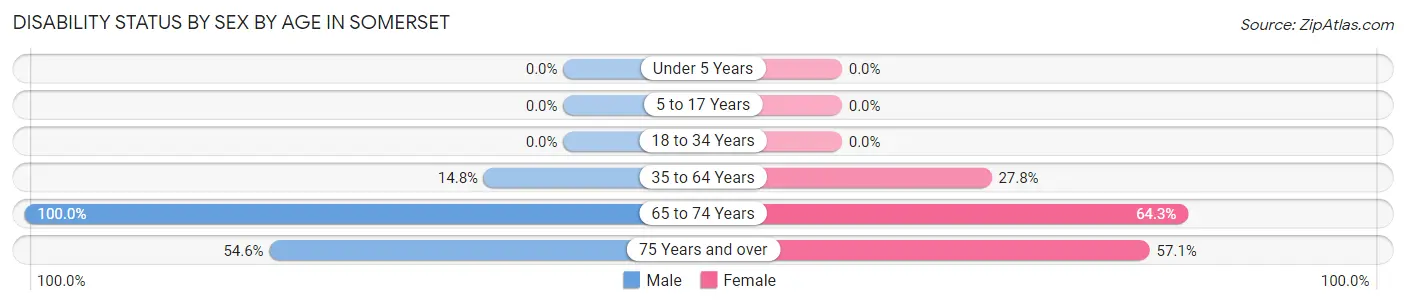
| Age Bracket | Male | Female |
| Under 5 Years | 0 (0.0%) | 0 (0.0%) |
| 5 to 17 Years | 0 (0.0%) | 0 (0.0%) |
| 18 to 34 Years | 0 (0.0%) | 0 (0.0%) |
| 35 to 64 Years | 9 (14.7%) | 15 (27.8%) |
| 65 to 74 Years | 8 (100.0%) | 36 (64.3%) |
| 75 Years and over | 18 (54.5%) | 8 (57.1%) |
Disability Class by Sex by Age in Somerset
Disability Class: Hearing Difficulty
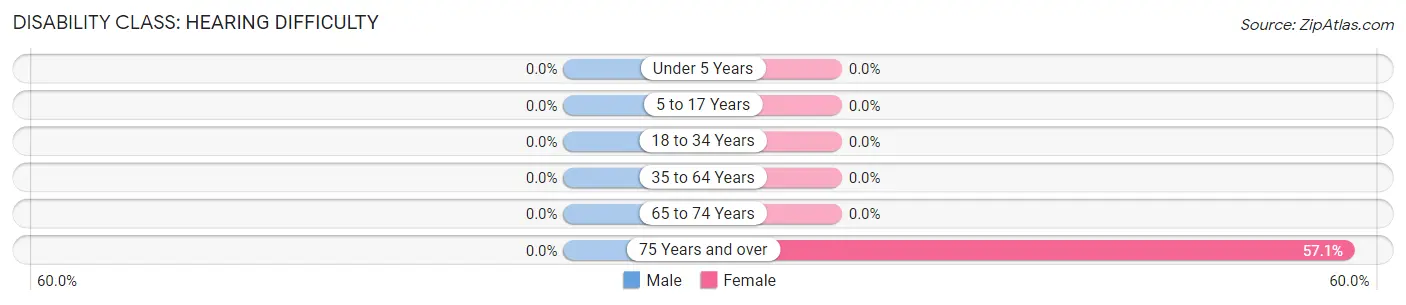
| Age Bracket | Male | Female |
| Under 5 Years | 0 (0.0%) | 0 (0.0%) |
| 5 to 17 Years | 0 (0.0%) | 0 (0.0%) |
| 18 to 34 Years | 0 (0.0%) | 0 (0.0%) |
| 35 to 64 Years | 0 (0.0%) | 0 (0.0%) |
| 65 to 74 Years | 0 (0.0%) | 0 (0.0%) |
| 75 Years and over | 0 (0.0%) | 8 (57.1%) |
Disability Class: Vision Difficulty
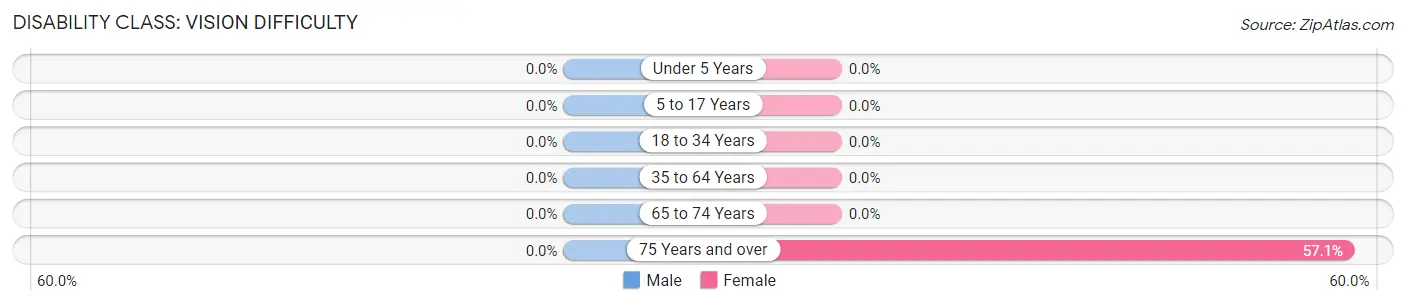
| Age Bracket | Male | Female |
| Under 5 Years | 0 (0.0%) | 0 (0.0%) |
| 5 to 17 Years | 0 (0.0%) | 0 (0.0%) |
| 18 to 34 Years | 0 (0.0%) | 0 (0.0%) |
| 35 to 64 Years | 0 (0.0%) | 0 (0.0%) |
| 65 to 74 Years | 0 (0.0%) | 0 (0.0%) |
| 75 Years and over | 0 (0.0%) | 8 (57.1%) |
Disability Class: Cognitive Difficulty
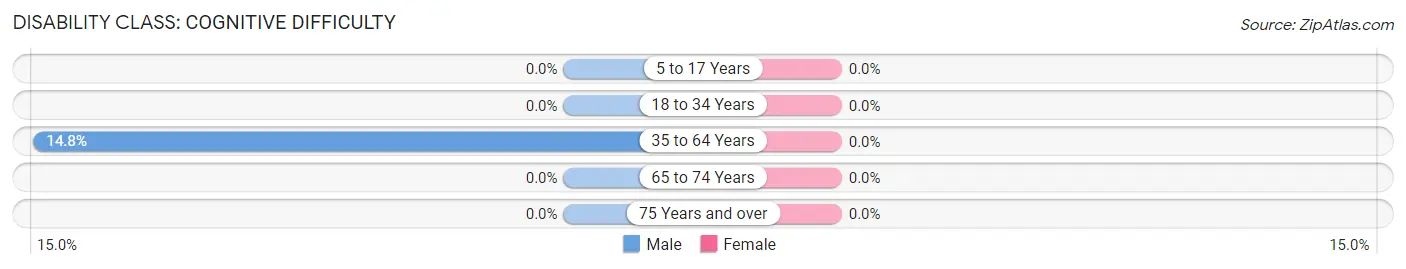
| Age Bracket | Male | Female |
| 5 to 17 Years | 0 (0.0%) | 0 (0.0%) |
| 18 to 34 Years | 0 (0.0%) | 0 (0.0%) |
| 35 to 64 Years | 9 (14.7%) | 0 (0.0%) |
| 65 to 74 Years | 0 (0.0%) | 0 (0.0%) |
| 75 Years and over | 0 (0.0%) | 0 (0.0%) |
Disability Class: Ambulatory Difficulty
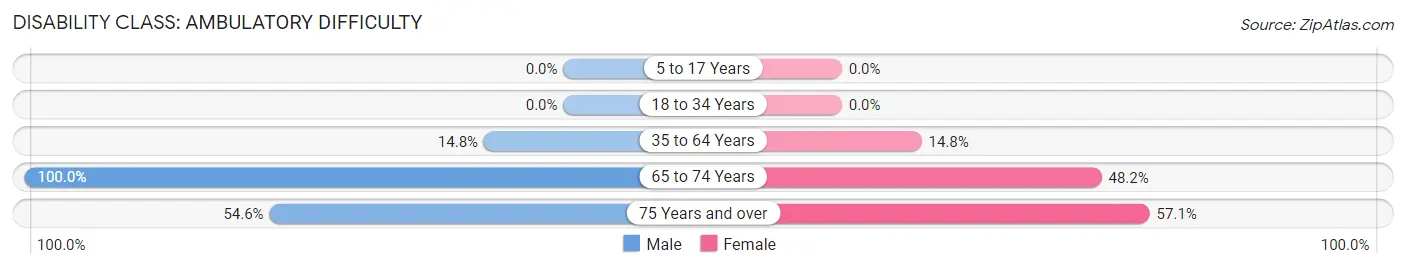
| Age Bracket | Male | Female |
| 5 to 17 Years | 0 (0.0%) | 0 (0.0%) |
| 18 to 34 Years | 0 (0.0%) | 0 (0.0%) |
| 35 to 64 Years | 9 (14.7%) | 8 (14.8%) |
| 65 to 74 Years | 8 (100.0%) | 27 (48.2%) |
| 75 Years and over | 18 (54.5%) | 8 (57.1%) |
Disability Class: Self-Care Difficulty
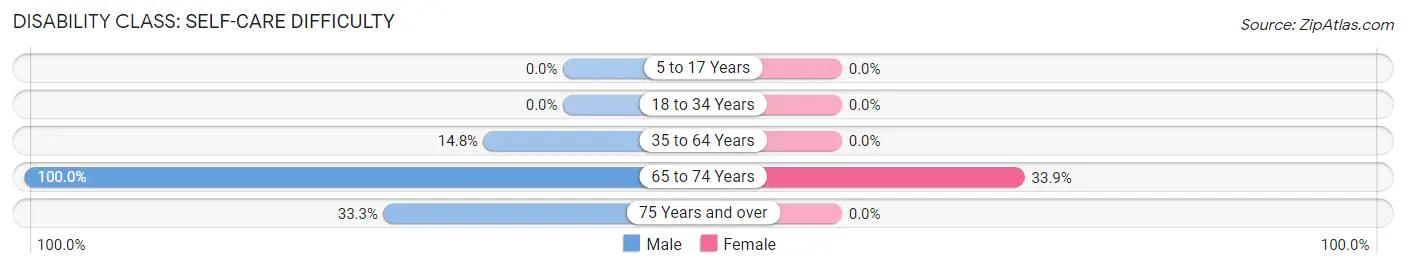
| Age Bracket | Male | Female |
| 5 to 17 Years | 0 (0.0%) | 0 (0.0%) |
| 18 to 34 Years | 0 (0.0%) | 0 (0.0%) |
| 35 to 64 Years | 9 (14.7%) | 0 (0.0%) |
| 65 to 74 Years | 8 (100.0%) | 19 (33.9%) |
| 75 Years and over | 11 (33.3%) | 0 (0.0%) |
Technology Access in Somerset
Computing Device Access in Somerset
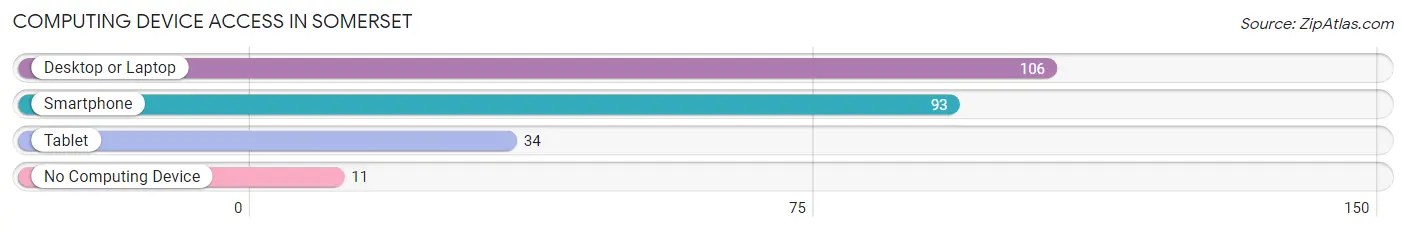
| Device Type | # Households | % Households |
| Desktop or Laptop | 106 | 79.1% |
| Smartphone | 93 | 69.4% |
| Tablet | 34 | 25.4% |
| No Computing Device | 11 | 8.2% |
| Total | 134 | 100.0% |
Internet Access in Somerset
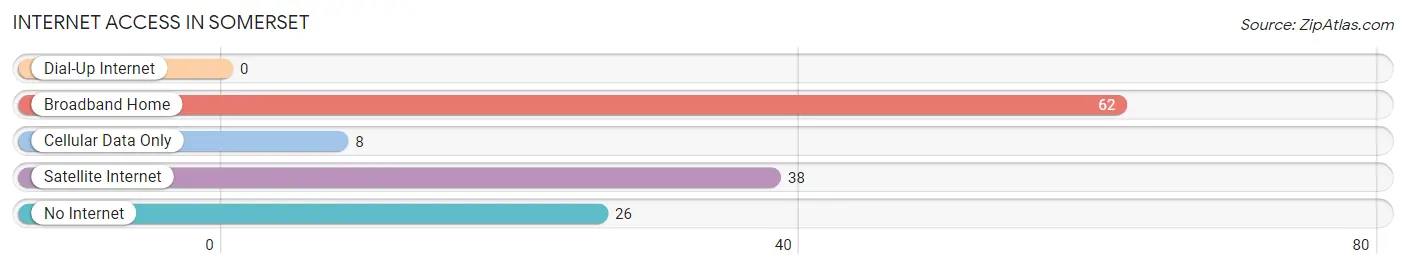
| Internet Type | # Households | % Households |
| Dial-Up Internet | 0 | 0.0% |
| Broadband Home | 62 | 46.3% |
| Cellular Data Only | 8 | 6.0% |
| Satellite Internet | 38 | 28.4% |
| No Internet | 26 | 19.4% |
| Total | 134 | 100.0% |
Somerset Summary
Somerset, Indiana is a small town located in the southwestern part of the state, in the heart of the Hoosier State. It is situated in the Wabash Valley, near the Wabash River, and is part of the Terre Haute metropolitan area. The town has a population of approximately 2,000 people, and is the county seat of Perry County.
Geography
Somerset is located in the southwestern part of Indiana, in the Wabash Valley. It is situated in Perry County, and is part of the Terre Haute metropolitan area. The town is located at the intersection of State Road 37 and State Road 64, and is approximately 30 miles south of Terre Haute. The town is surrounded by rolling hills and farmland, and is situated on the banks of the Wabash River.
History
Somerset was founded in 1817 by a group of settlers from North Carolina. The town was named after the English county of Somerset, and was originally intended to be a trading post. The town quickly grew, and by 1820 it had become the county seat of Perry County. In 1821, the town was officially incorporated, and the first post office was established.
In the late 19th century, Somerset became a major hub for the coal mining industry. The town was home to several coal mines, and the coal industry provided much of the town's economic activity. The coal industry declined in the early 20th century, and the town's economy shifted to agriculture and manufacturing.
Economy
Somerset's economy is largely based on agriculture and manufacturing. The town is home to several large farms, and the surrounding area is known for its production of corn, soybeans, and wheat. The town is also home to several manufacturing companies, including a plastics factory and a metal fabrication plant.
Demographics
As of the 2010 census, the population of Somerset was 2,000. The town is predominantly white, with a small African American population. The median household income is $37,000, and the median home value is $90,000. The town has a low unemployment rate, and the poverty rate is below the national average.
Conclusion
Somerset, Indiana is a small town located in the southwestern part of the state, in the heart of the Hoosier State. It is situated in the Wabash Valley, near the Wabash River, and is part of the Terre Haute metropolitan area. The town has a population of approximately 2,000 people, and is the county seat of Perry County. The town's economy is largely based on agriculture and manufacturing, and the median household income is $37,000. Somerset is a small, rural town with a low unemployment rate and a below-average poverty rate.
Common Questions
What is Per Capita Income in Somerset?
Per Capita income in Somerset is $36,740.
What is the Median Family Income in Somerset?
Median Family Income in Somerset is $102,833.
What is the Median Household income in Somerset?
Median Household Income in Somerset is $81,500.
What is Income or Wage Gap in Somerset?
Income or Wage Gap in Somerset is 39.6%.
Women in Somerset earn 60.4 cents for every dollar earned by a man.
What is Inequality or Gini Index in Somerset?
Inequality or Gini Index in Somerset is 0.31.
What is the Total Population of Somerset?
Total Population of Somerset is 285.
What is the Total Male Population of Somerset?
Total Male Population of Somerset is 146.
What is the Total Female Population of Somerset?
Total Female Population of Somerset is 139.
What is the Ratio of Males per 100 Females in Somerset?
There are 105.04 Males per 100 Females in Somerset.
What is the Ratio of Females per 100 Males in Somerset?
There are 95.21 Females per 100 Males in Somerset.
What is the Median Population Age in Somerset?
Median Population Age in Somerset is 61.3 Years.
What is the Average Family Size in Somerset
Average Family Size in Somerset is 2.5 People.
What is the Average Household Size in Somerset
Average Household Size in Somerset is 2.1 People.
How Large is the Labor Force in Somerset?
There are 107 People in the Labor Forcein in Somerset.
What is the Percentage of People in the Labor Force in Somerset?
38.6% of People are in the Labor Force in Somerset.