Zip Codes with the Highest Percentage of Population Employed in Production in Evansville, IN
RELATED REPORTS & OPTIONS
Production
Evansville
Compare Zip Codes
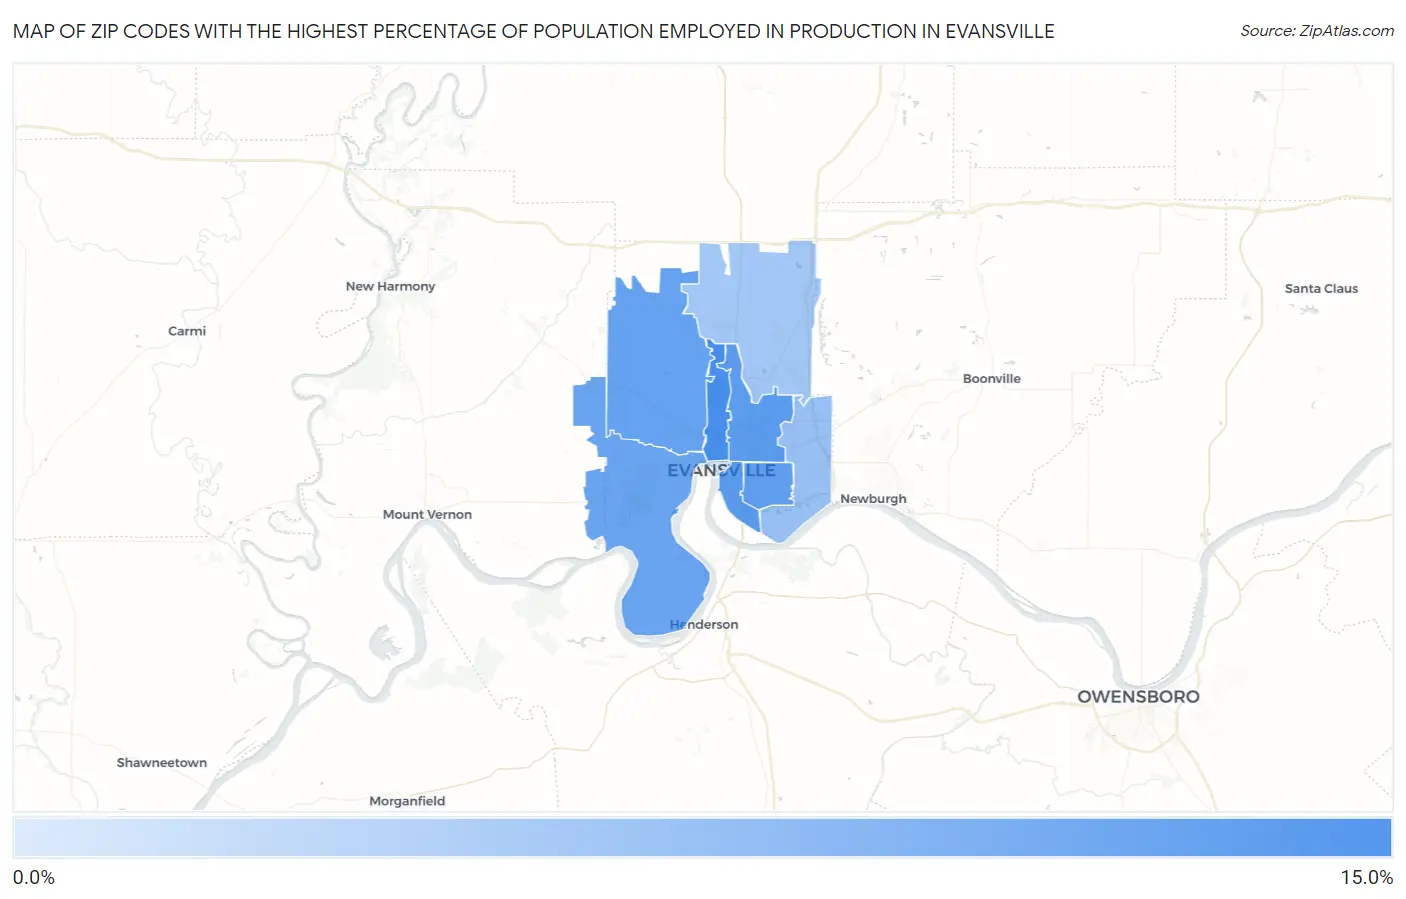
Map of Zip Codes with the Highest Percentage of Population Employed in Production in Evansville
4.6%
11.5%
Zip Codes with the Highest Percentage of Population Employed in Production in Evansville, IN
| Zip Code | % Employed | vs State | vs National | |
| 1. | 47710 | 11.5% | 10.1%(+1.41)#366 | 5.5%(+6.06)#5,941 |
| 2. | 47711 | 10.7% | 10.1%(+0.584)#407 | 5.5%(+5.23)#6,898 |
| 3. | 47713 | 10.6% | 10.1%(+0.514)#414 | 5.5%(+5.16)#6,998 |
| 4. | 47714 | 10.3% | 10.1%(+0.189)#426 | 5.5%(+4.84)#7,416 |
| 5. | 47720 | 10.1% | 10.1%(-0.017)#441 | 5.5%(+4.63)#7,695 |
| 6. | 47712 | 9.9% | 10.1%(-0.186)#448 | 5.5%(+4.46)#7,919 |
| 7. | 47715 | 7.7% | 10.1%(-2.39)#548 | 5.5%(+2.26)#11,538 |
| 8. | 47725 | 7.2% | 10.1%(-2.91)#577 | 5.5%(+1.73)#12,605 |
| 9. | 47708 | 4.6% | 10.1%(-5.53)#670 | 5.5%(-0.877)#18,740 |
1
Common Questions
What are the Top 5 Zip Codes with the Highest Percentage of Population Employed in Production in Evansville, IN?
Top 5 Zip Codes with the Highest Percentage of Population Employed in Production in Evansville, IN are:
What zip code has the Highest Percentage of Population Employed in Production in Evansville, IN?
47710 has the Highest Percentage of Population Employed in Production in Evansville, IN with 11.5%.
What is the Percentage of Population Employed in Production in Evansville, IN?
Percentage of Population Employed in Production in Evansville is 10.2%.
What is the Percentage of Population Employed in Production in Indiana?
Percentage of Population Employed in Production in Indiana is 10.1%.
What is the Percentage of Population Employed in Production in the United States?
Percentage of Population Employed in Production in the United States is 5.5%.