Alfordsville, IN Map & Demographics
Alfordsville Map
Alfordsville Overview
$22,695
PER CAPITA INCOME
$44,375
AVG FAMILY INCOME
$42,917
AVG HOUSEHOLD INCOME
0.19
INEQUALITY / GINI INDEX
39
TOTAL POPULATION
20
MALE POPULATION
19
FEMALE POPULATION
105.26
MALES / 100 FEMALES
95.00
FEMALES / 100 MALES
67.2
MEDIAN AGE
2.3
AVG FAMILY SIZE
1.9
AVG HOUSEHOLD SIZE
11
LABOR FORCE [ PEOPLE ]
31.4%
PERCENT IN LABOR FORCE
Income in Alfordsville
Income Overview in Alfordsville
Per Capita Income in Alfordsville is $22,695, while median incomes of families and households are $44,375 and $42,917 respectively.
| Characteristic | Number | Measure |
| Per Capita Income | 39 | $22,695 |
| Median Family Income | 13 | $44,375 |
| Mean Family Income | 13 | $48,815 |
| Median Household Income | 21 | $42,917 |
| Mean Household Income | 21 | $43,014 |
| Income Deficit | 13 | $0 |
| Wage / Income Gap (%) | 39 | 0.00% |
| Wage / Income Gap ($) | 39 | 100.00¢ per $1 |
| Gini / Inequality Index | 39 | 0.19 |
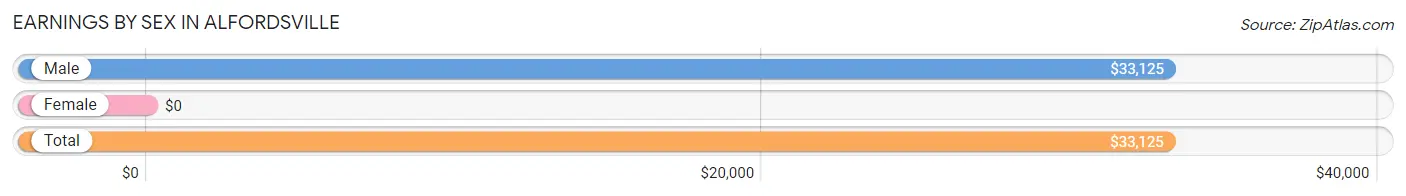
Earnings by Sex in Alfordsville
| Sex | Number | Average Earnings |
| Male | 9 (81.8%) | $33,125 |
| Female | 2 (18.2%) | $0 |
| Total | 11 (100.0%) | $33,125 |
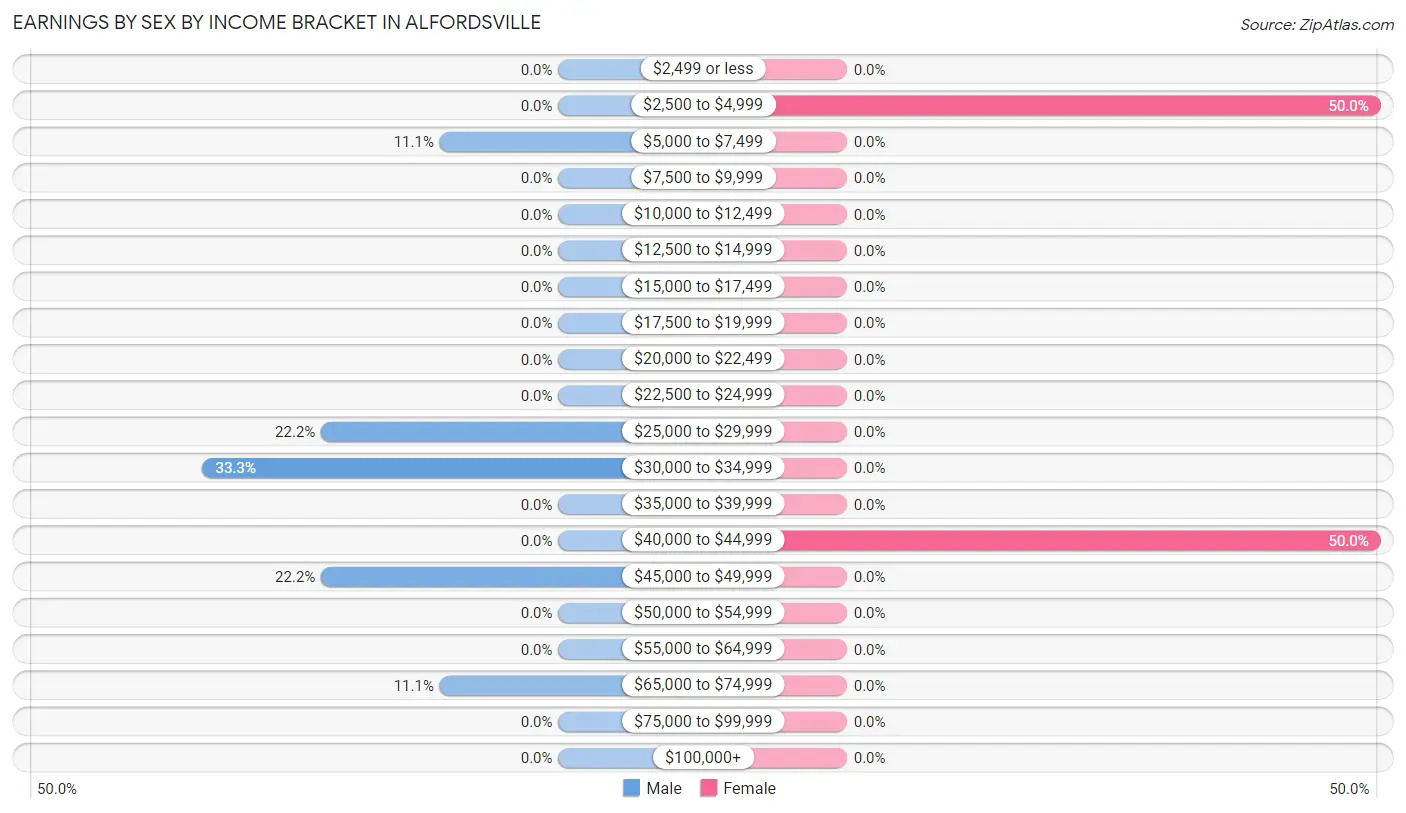
Earnings by Sex by Income Bracket in Alfordsville
The most common earnings brackets in Alfordsville are $30,000 to $34,999 for men (3 | 33.3%) and $2,500 to $4,999 for women (1 | 50.0%).
| Income | Male | Female |
| $2,499 or less | 0 (0.0%) | 0 (0.0%) |
| $2,500 to $4,999 | 0 (0.0%) | 1 (50.0%) |
| $5,000 to $7,499 | 1 (11.1%) | 0 (0.0%) |
| $7,500 to $9,999 | 0 (0.0%) | 0 (0.0%) |
| $10,000 to $12,499 | 0 (0.0%) | 0 (0.0%) |
| $12,500 to $14,999 | 0 (0.0%) | 0 (0.0%) |
| $15,000 to $17,499 | 0 (0.0%) | 0 (0.0%) |
| $17,500 to $19,999 | 0 (0.0%) | 0 (0.0%) |
| $20,000 to $22,499 | 0 (0.0%) | 0 (0.0%) |
| $22,500 to $24,999 | 0 (0.0%) | 0 (0.0%) |
| $25,000 to $29,999 | 2 (22.2%) | 0 (0.0%) |
| $30,000 to $34,999 | 3 (33.3%) | 0 (0.0%) |
| $35,000 to $39,999 | 0 (0.0%) | 0 (0.0%) |
| $40,000 to $44,999 | 0 (0.0%) | 1 (50.0%) |
| $45,000 to $49,999 | 2 (22.2%) | 0 (0.0%) |
| $50,000 to $54,999 | 0 (0.0%) | 0 (0.0%) |
| $55,000 to $64,999 | 0 (0.0%) | 0 (0.0%) |
| $65,000 to $74,999 | 1 (11.1%) | 0 (0.0%) |
| $75,000 to $99,999 | 0 (0.0%) | 0 (0.0%) |
| $100,000+ | 0 (0.0%) | 0 (0.0%) |
| Total | 9 (100.0%) | 2 (100.0%) |
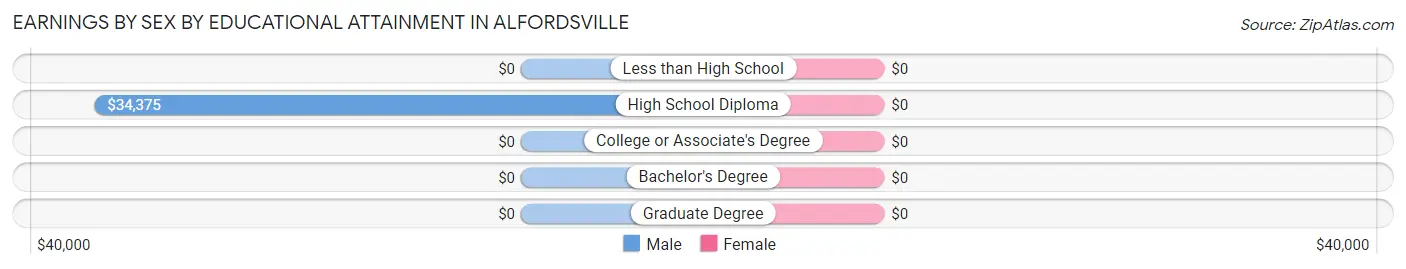
Earnings by Sex by Educational Attainment in Alfordsville
| Educational Attainment | Male Income | Female Income |
| Less than High School | - | - |
| High School Diploma | $34,375 | $0 |
| College or Associate's Degree | - | - |
| Bachelor's Degree | - | - |
| Graduate Degree | - | - |
| Total | $33,125 | $0 |
Family Income in Alfordsville
Family Income Brackets in Alfordsville
According to the Alfordsville family income data, there are 5 families falling into the $50,000 to $74,999 income range, which is the most common income bracket and makes up 38.5% of all families.
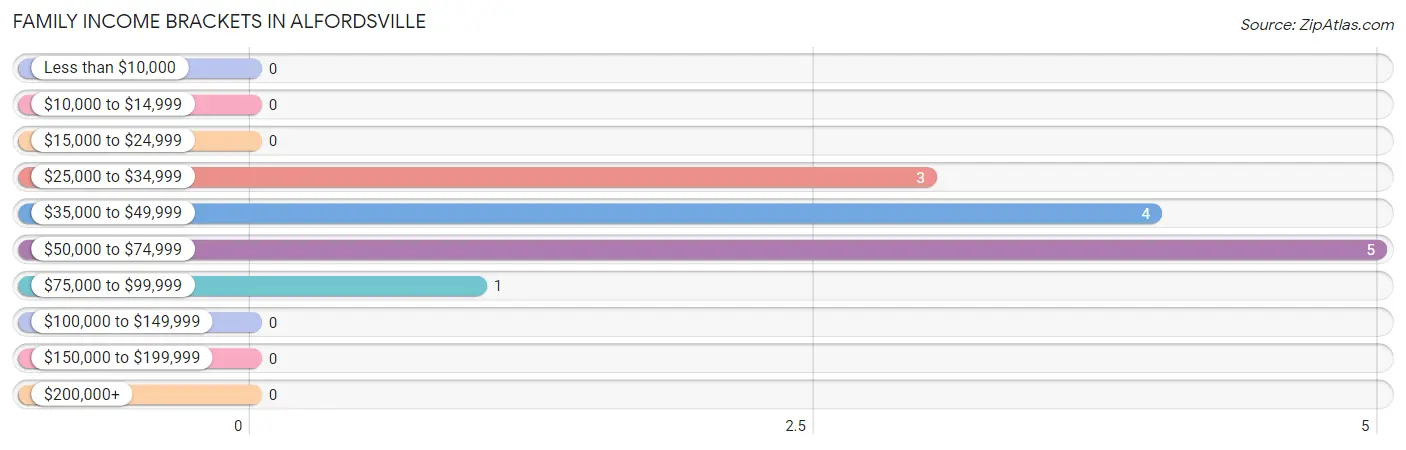
| Income Bracket | # Families | % Families |
| Less than $10,000 | 0 | 0.0% |
| $10,000 to $14,999 | 0 | 0.0% |
| $15,000 to $24,999 | 0 | 0.0% |
| $25,000 to $34,999 | 3 | 23.1% |
| $35,000 to $49,999 | 4 | 30.8% |
| $50,000 to $74,999 | 5 | 38.5% |
| $75,000 to $99,999 | 1 | 7.7% |
| $100,000 to $149,999 | 0 | 0.0% |
| $150,000 to $199,999 | 0 | 0.0% |
| $200,000+ | 0 | 0.0% |
Family Income by Famaliy Size in Alfordsville
2-person families (12 | 92.3%) account for the highest median family income in Alfordsville with $43,750 per family, while 2-person families (12 | 92.3%) have the highest median income of $21,875 per family member.
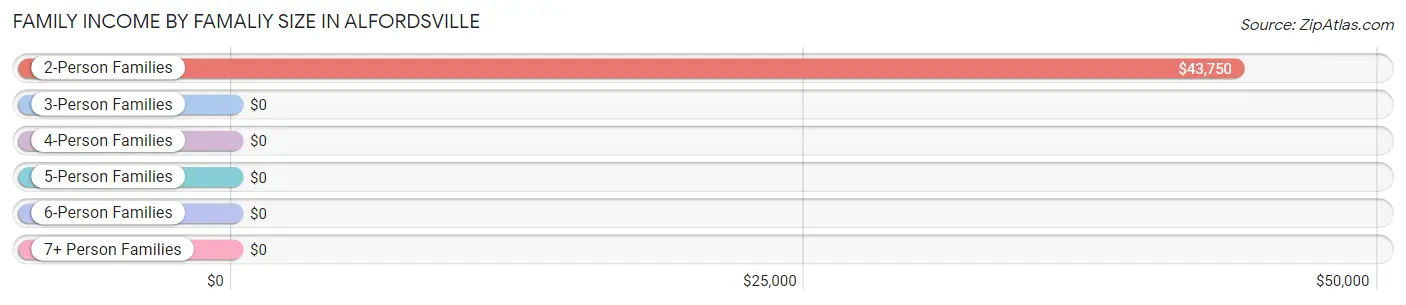
| Income Bracket | # Families | Median Income |
| 2-Person Families | 12 (92.3%) | $43,750 |
| 3-Person Families | 0 (0.0%) | $0 |
| 4-Person Families | 0 (0.0%) | $0 |
| 5-Person Families | 1 (7.7%) | $0 |
| 6-Person Families | 0 (0.0%) | $0 |
| 7+ Person Families | 0 (0.0%) | $0 |
| Total | 13 (100.0%) | $44,375 |
Family Income by Number of Earners in Alfordsville
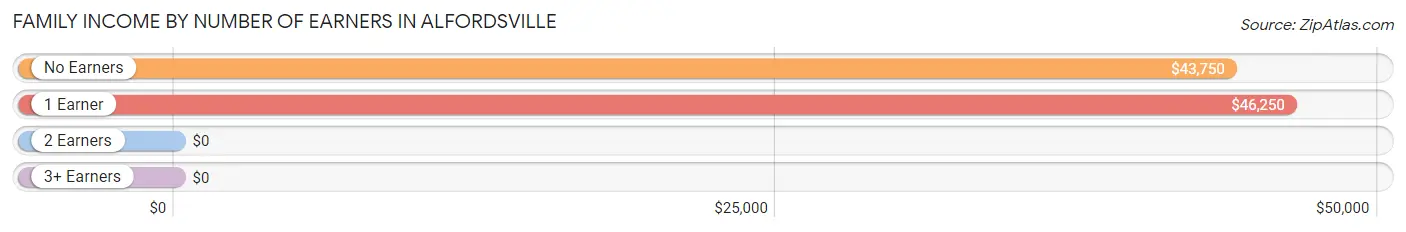
| Number of Earners | # Families | Median Income |
| No Earners | 6 (46.2%) | $43,750 |
| 1 Earner | 6 (46.2%) | $46,250 |
| 2 Earners | 1 (7.7%) | $0 |
| 3+ Earners | 0 (0.0%) | $0 |
| Total | 13 (100.0%) | $44,375 |
Household Income in Alfordsville
Household Income Brackets in Alfordsville
With 7 households falling in the category, the $25,000 to $34,999 income range is the most frequent in Alfordsville, accounting for 33.3% of all households.
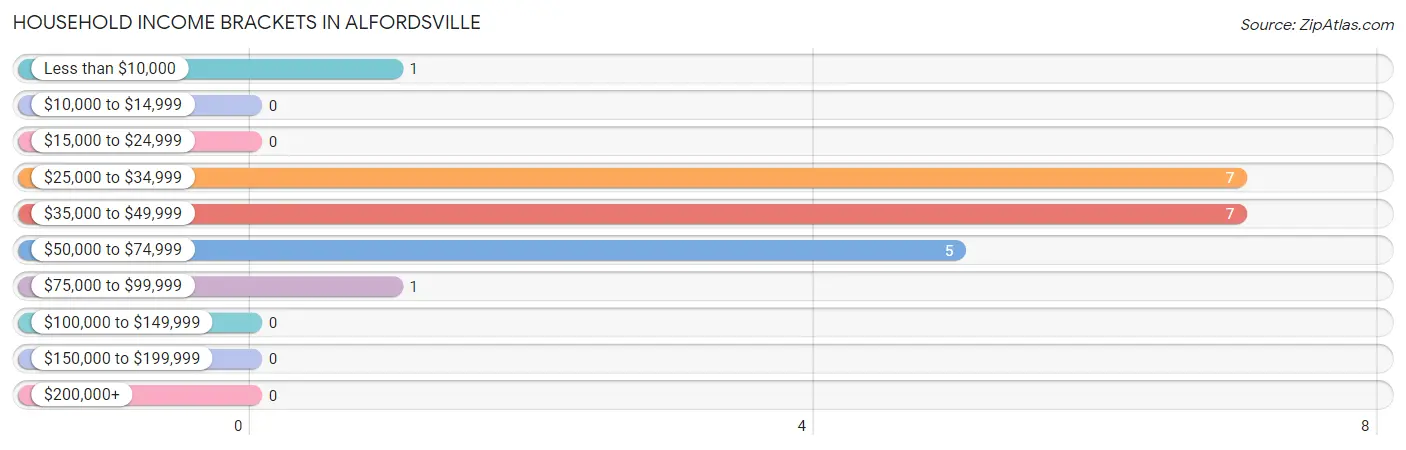
| Income Bracket | # Households | % Households |
| Less than $10,000 | 1 | 4.8% |
| $10,000 to $14,999 | 0 | 0.0% |
| $15,000 to $24,999 | 0 | 0.0% |
| $25,000 to $34,999 | 7 | 33.3% |
| $35,000 to $49,999 | 7 | 33.3% |
| $50,000 to $74,999 | 5 | 23.8% |
| $75,000 to $99,999 | 1 | 4.8% |
| $100,000 to $149,999 | 0 | 0.0% |
| $150,000 to $199,999 | 0 | 0.0% |
| $200,000+ | 0 | 0.0% |
Household Income by Householder Age in Alfordsville
The median household income in Alfordsville is $42,917, with the highest median household income of $42,917 found in the 65+ years age bracket for the primary householder. A total of 15 households (71.4%) fall into this category.
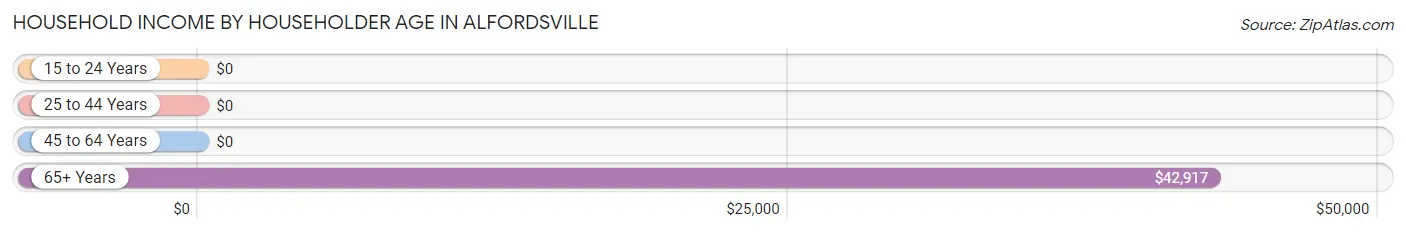
| Income Bracket | # Households | Median Income |
| 15 to 24 Years | 0 (0.0%) | $0 |
| 25 to 44 Years | 3 (14.3%) | $0 |
| 45 to 64 Years | 3 (14.3%) | $0 |
| 65+ Years | 15 (71.4%) | $42,917 |
| Total | 21 (100.0%) | $42,917 |
Poverty in Alfordsville
Income Below Poverty by Sex and Age in Alfordsville
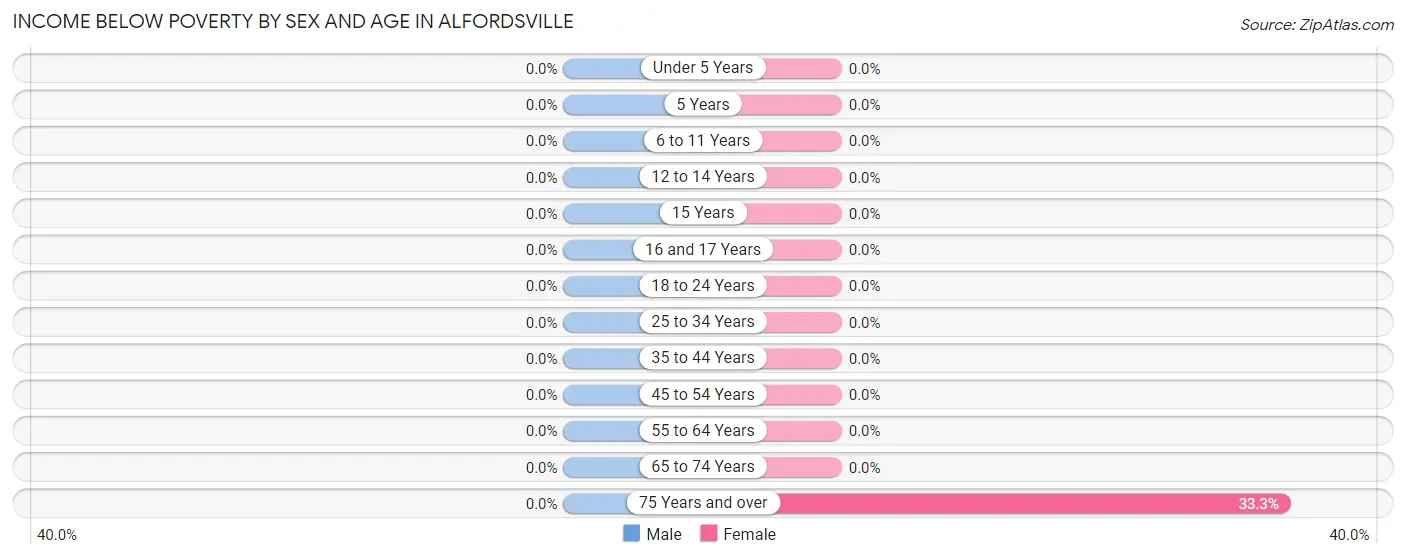
| Age Bracket | Male | Female |
| Under 5 Years | 0 (0.0%) | 0 (0.0%) |
| 5 Years | 0 (0.0%) | 0 (0.0%) |
| 6 to 11 Years | 0 (0.0%) | 0 (0.0%) |
| 12 to 14 Years | 0 (0.0%) | 0 (0.0%) |
| 15 Years | 0 (0.0%) | 0 (0.0%) |
| 16 and 17 Years | 0 (0.0%) | 0 (0.0%) |
| 18 to 24 Years | 0 (0.0%) | 0 (0.0%) |
| 25 to 34 Years | 0 (0.0%) | 0 (0.0%) |
| 35 to 44 Years | 0 (0.0%) | 0 (0.0%) |
| 45 to 54 Years | 0 (0.0%) | 0 (0.0%) |
| 55 to 64 Years | 0 (0.0%) | 0 (0.0%) |
| 65 to 74 Years | 0 (0.0%) | 0 (0.0%) |
| 75 Years and over | 0 (0.0%) | 1 (33.3%) |
| Total | 0 (0.0%) | 1 (5.6%) |
Income Above Poverty by Sex and Age in Alfordsville
According to the poverty statistics in Alfordsville, males aged under 5 years and females aged 5 years are the age groups that are most secure financially, with 100.0% of males and 100.0% of females in these age groups living above the poverty line.
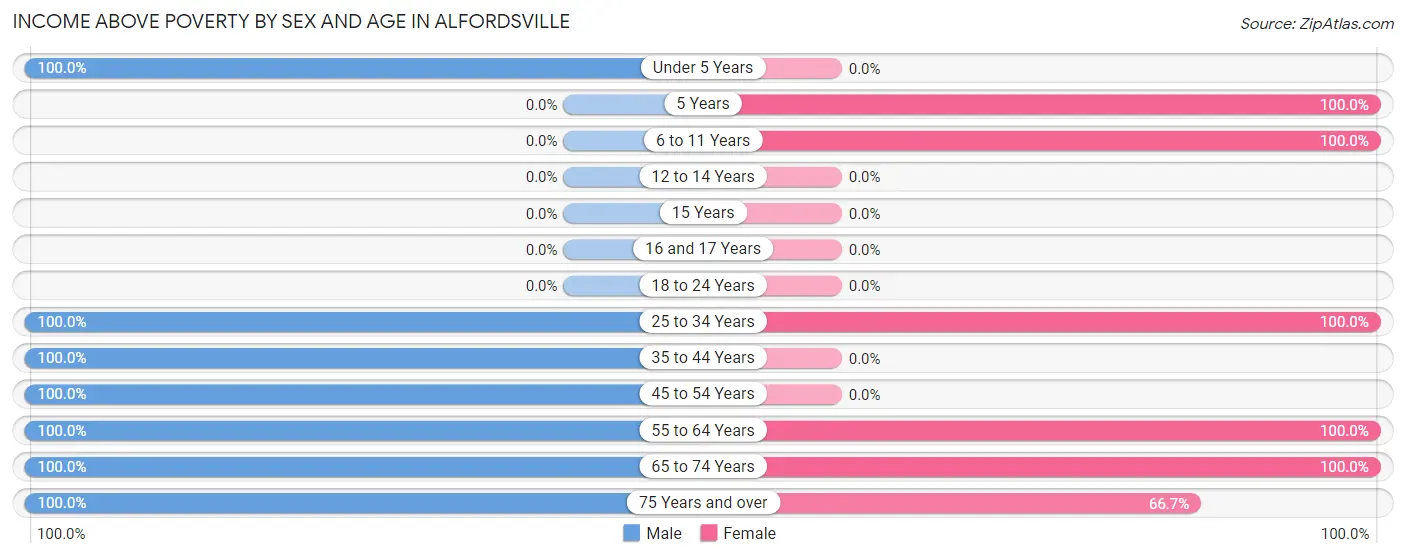
| Age Bracket | Male | Female |
| Under 5 Years | 1 (100.0%) | 0 (0.0%) |
| 5 Years | 0 (0.0%) | 1 (100.0%) |
| 6 to 11 Years | 0 (0.0%) | 1 (100.0%) |
| 12 to 14 Years | 0 (0.0%) | 0 (0.0%) |
| 15 Years | 0 (0.0%) | 0 (0.0%) |
| 16 and 17 Years | 0 (0.0%) | 0 (0.0%) |
| 18 to 24 Years | 0 (0.0%) | 0 (0.0%) |
| 25 to 34 Years | 1 (100.0%) | 1 (100.0%) |
| 35 to 44 Years | 2 (100.0%) | 0 (0.0%) |
| 45 to 54 Years | 2 (100.0%) | 0 (0.0%) |
| 55 to 64 Years | 1 (100.0%) | 5 (100.0%) |
| 65 to 74 Years | 11 (100.0%) | 7 (100.0%) |
| 75 Years and over | 2 (100.0%) | 2 (66.7%) |
| Total | 20 (100.0%) | 17 (94.4%) |
Income Below Poverty Among Married-Couple Families in Alfordsville
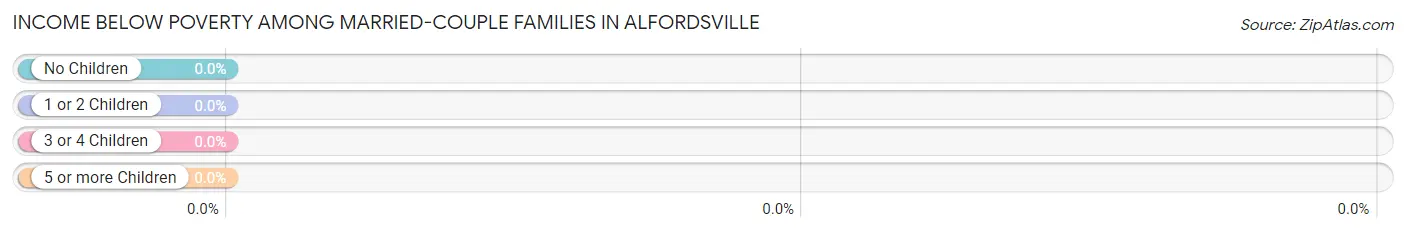
| Children | Above Poverty | Below Poverty |
| No Children | 12 (100.0%) | 0 (0.0%) |
| 1 or 2 Children | 0 (0.0%) | 0 (0.0%) |
| 3 or 4 Children | 1 (100.0%) | 0 (0.0%) |
| 5 or more Children | 0 (0.0%) | 0 (0.0%) |
| Total | 13 (100.0%) | 0 (0.0%) |
Income Below Poverty Among Single-Parent Households in Alfordsville
| Children | Single Father | Single Mother |
| No Children | 0 (0.0%) | 0 (0.0%) |
| 1 or 2 Children | 0 (0.0%) | 0 (0.0%) |
| 3 or 4 Children | 0 (0.0%) | 0 (0.0%) |
| 5 or more Children | 0 (0.0%) | 0 (0.0%) |
| Total | 0 (0.0%) | 0 (0.0%) |
Income Below Poverty Among Married-Couple vs Single-Parent Households in Alfordsville
| Children | Married-Couple Families | Single-Parent Households |
| No Children | 0 (0.0%) | 0 (0.0%) |
| 1 or 2 Children | 0 (0.0%) | 0 (0.0%) |
| 3 or 4 Children | 0 (0.0%) | 0 (0.0%) |
| 5 or more Children | 0 (0.0%) | 0 (0.0%) |
| Total | 0 (0.0%) | 0 (0.0%) |
Race in Alfordsville
The most populous races in Alfordsville are , and White / Caucasian (39 | 100.0%).
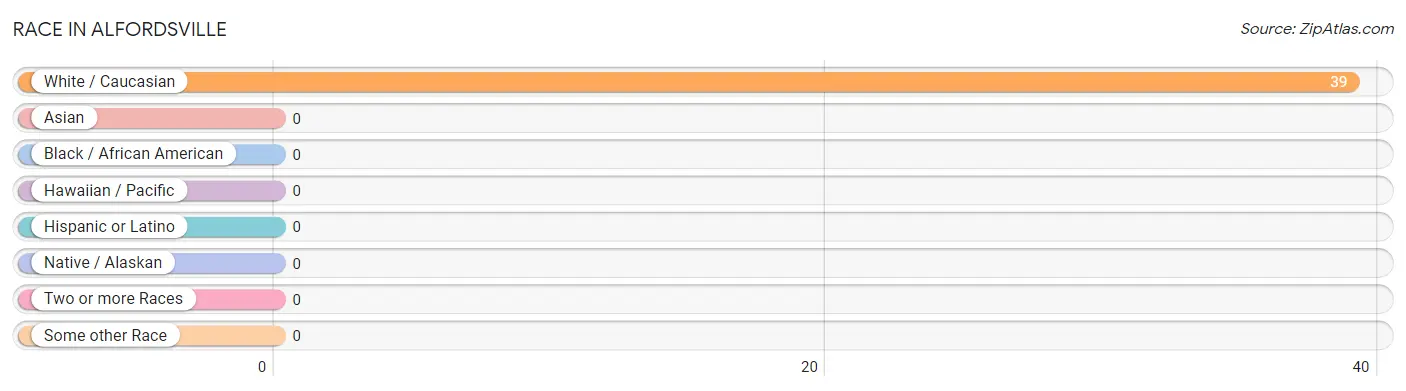
| Race | # Population | % Population |
| Asian | 0 | 0.0% |
| Black / African American | 0 | 0.0% |
| Hawaiian / Pacific | 0 | 0.0% |
| Hispanic or Latino | 0 | 0.0% |
| Native / Alaskan | 0 | 0.0% |
| White / Caucasian | 39 | 100.0% |
| Two or more Races | 0 | 0.0% |
| Some other Race | 0 | 0.0% |
| Total | 39 | 100.0% |
Ancestry in Alfordsville
The most populous ancestries reported in Alfordsville are German (12 | 30.8%), Irish (7 | 17.9%), Swiss (4 | 10.3%), English (3 | 7.7%), and American (2 | 5.1%), together accounting for 71.8% of all Alfordsville residents.
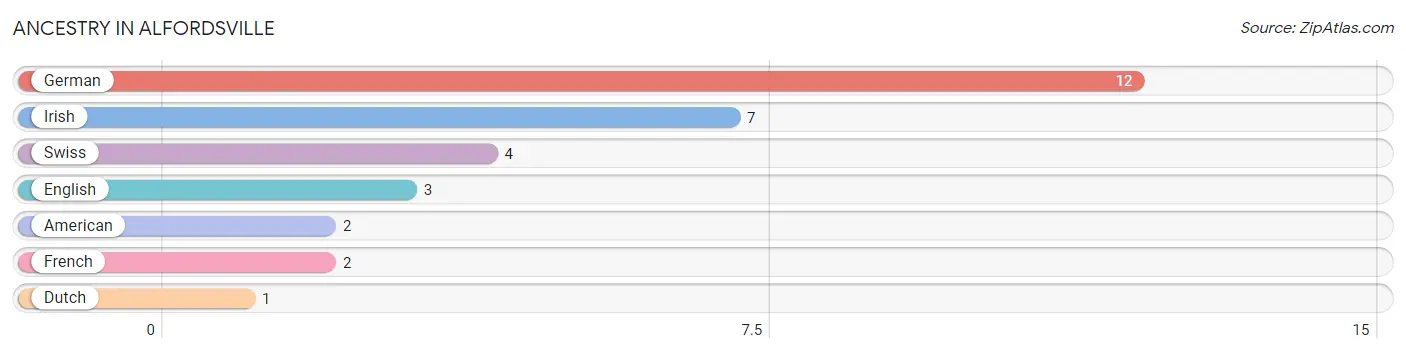
| Ancestry | # Population | % Population |
| American | 2 | 5.1% |
| Dutch | 1 | 2.6% |
| English | 3 | 7.7% |
| French | 2 | 5.1% |
| German | 12 | 30.8% |
| Irish | 7 | 17.9% |
| Swiss | 4 | 10.3% | View All 7 Rows |
Immigrants in Alfordsville

| Immigration Origin | # Population | % Population | View All 0 Rows |
Sex and Age in Alfordsville
Sex and Age in Alfordsville
The most populous age groups in Alfordsville are 70 to 74 Years (9 | 45.0%) for men and 55 to 59 Years (5 | 26.3%) for women.
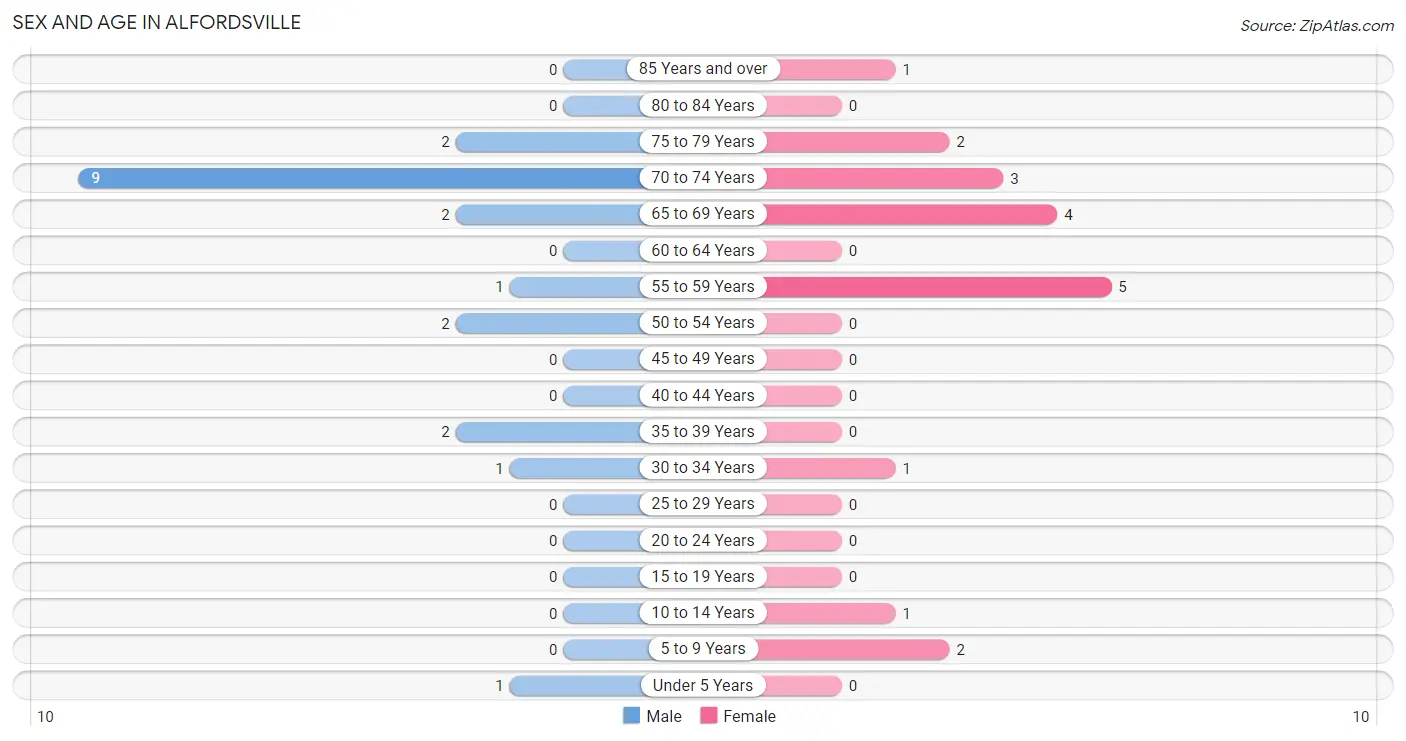
| Age Bracket | Male | Female |
| Under 5 Years | 1 (5.0%) | 0 (0.0%) |
| 5 to 9 Years | 0 (0.0%) | 2 (10.5%) |
| 10 to 14 Years | 0 (0.0%) | 1 (5.3%) |
| 15 to 19 Years | 0 (0.0%) | 0 (0.0%) |
| 20 to 24 Years | 0 (0.0%) | 0 (0.0%) |
| 25 to 29 Years | 0 (0.0%) | 0 (0.0%) |
| 30 to 34 Years | 1 (5.0%) | 1 (5.3%) |
| 35 to 39 Years | 2 (10.0%) | 0 (0.0%) |
| 40 to 44 Years | 0 (0.0%) | 0 (0.0%) |
| 45 to 49 Years | 0 (0.0%) | 0 (0.0%) |
| 50 to 54 Years | 2 (10.0%) | 0 (0.0%) |
| 55 to 59 Years | 1 (5.0%) | 5 (26.3%) |
| 60 to 64 Years | 0 (0.0%) | 0 (0.0%) |
| 65 to 69 Years | 2 (10.0%) | 4 (21.0%) |
| 70 to 74 Years | 9 (45.0%) | 3 (15.8%) |
| 75 to 79 Years | 2 (10.0%) | 2 (10.5%) |
| 80 to 84 Years | 0 (0.0%) | 0 (0.0%) |
| 85 Years and over | 0 (0.0%) | 1 (5.3%) |
| Total | 20 (100.0%) | 19 (100.0%) |
Families and Households in Alfordsville
Median Family Size in Alfordsville
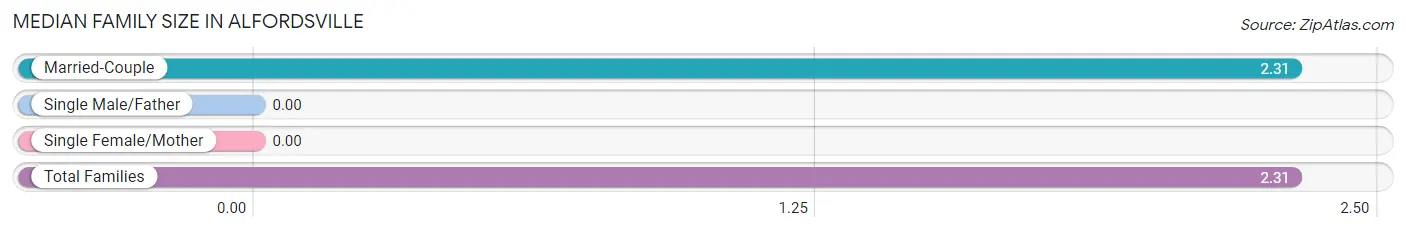
| Family Type | # Families | Family Size |
| Married-Couple | 13 (100.0%) | 2.31 |
| Single Male/Father | 0 (0.0%) | - |
| Single Female/Mother | 0 (0.0%) | - |
| Total Families | 13 (100.0%) | 2.31 |
Median Household Size in Alfordsville
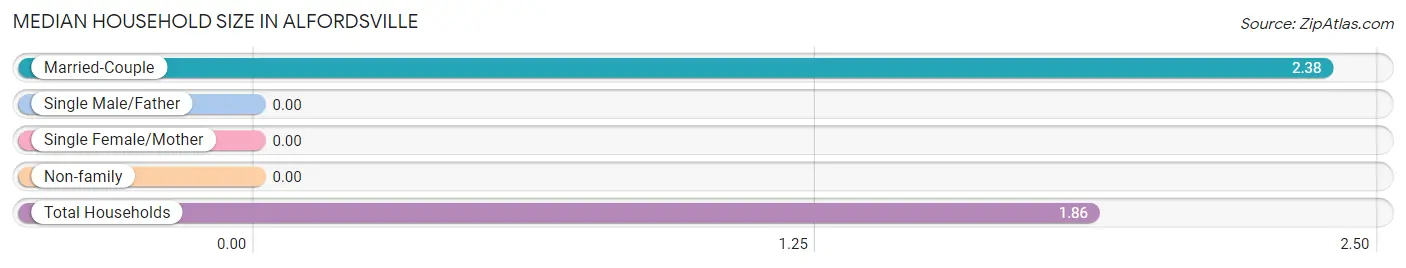
| Household Type | # Households | Household Size |
| Married-Couple | 13 (61.9%) | 2.38 |
| Single Male/Father | 0 (0.0%) | - |
| Single Female/Mother | 0 (0.0%) | - |
| Non-family | 8 (38.1%) | - |
| Total Households | 21 (100.0%) | 1.86 |
Household Size by Marriage Status in Alfordsville
Out of a total of 21 households in Alfordsville, 13 (61.9%) are family households, while 8 (38.1%) are nonfamily households. The most numerous type of family households are 2-person households, comprising 11, and the most common type of nonfamily households are 1-person households, comprising 8.
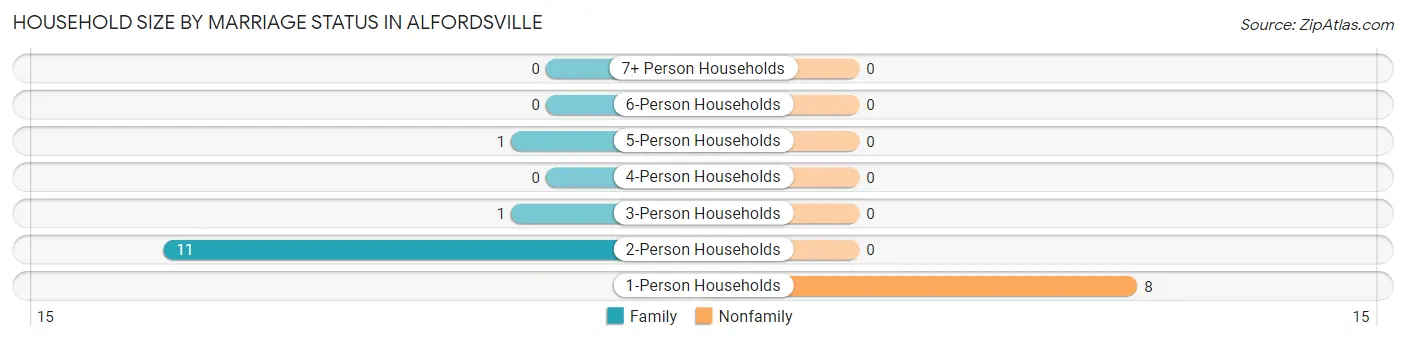
| Household Size | Family Households | Nonfamily Households |
| 1-Person Households | - | 8 (38.1%) |
| 2-Person Households | 11 (52.4%) | 0 (0.0%) |
| 3-Person Households | 1 (4.8%) | 0 (0.0%) |
| 4-Person Households | 0 (0.0%) | 0 (0.0%) |
| 5-Person Households | 1 (4.8%) | 0 (0.0%) |
| 6-Person Households | 0 (0.0%) | 0 (0.0%) |
| 7+ Person Households | 0 (0.0%) | 0 (0.0%) |
| Total | 13 (61.9%) | 8 (38.1%) |
Female Fertility in Alfordsville
Fertility by Age in Alfordsville
| Age Bracket | Women with Births | Births / 1,000 Women |
| 15 to 19 years | 0 (0.0%) | 0.0 |
| 20 to 34 years | 0 (0.0%) | 0.0 |
| 35 to 50 years | 0 (0.0%) | 0.0 |
| Total | 0 (0.0%) | 0.0 |
Fertility by Age by Marriage Status in Alfordsville
| Age Bracket | Married | Unmarried |
| 15 to 19 years | 0 (0.0%) | 0 (0.0%) |
| 20 to 34 years | 0 (0.0%) | 0 (0.0%) |
| 35 to 50 years | 0 (0.0%) | 0 (0.0%) |
| Total | 0 (0.0%) | 0 (0.0%) |
Fertility by Education in Alfordsville
| Educational Attainment | Women with Births | Births / 1,000 Women |
| Less than High School | 0 (0.0%) | 0.0 |
| High School Diploma | 0 (0.0%) | 0.0 |
| College or Associate's Degree | 0 (0.0%) | 0.0 |
| Bachelor's Degree | 0 (0.0%) | 0.0 |
| Graduate Degree | 0 (0.0%) | 0.0 |
| Total | 0 (0.0%) | 0.0 |
Fertility by Education by Marriage Status in Alfordsville
| Educational Attainment | Married | Unmarried |
| Less than High School | 0 (0.0%) | 0 (0.0%) |
| High School Diploma | 0 (0.0%) | 0 (0.0%) |
| College or Associate's Degree | 0 (0.0%) | 0 (0.0%) |
| Bachelor's Degree | 0 (0.0%) | 0 (0.0%) |
| Graduate Degree | 0 (0.0%) | 0 (0.0%) |
| Total | 0 (0.0%) | 0 (0.0%) |
Employment Characteristics in Alfordsville
Employment by Class of Employer in Alfordsville
Among the 11 employed individuals in Alfordsville, private company employees (9 | 81.8%), and not-for-profit organizations (2 | 18.2%) make up the most common classes of employment.
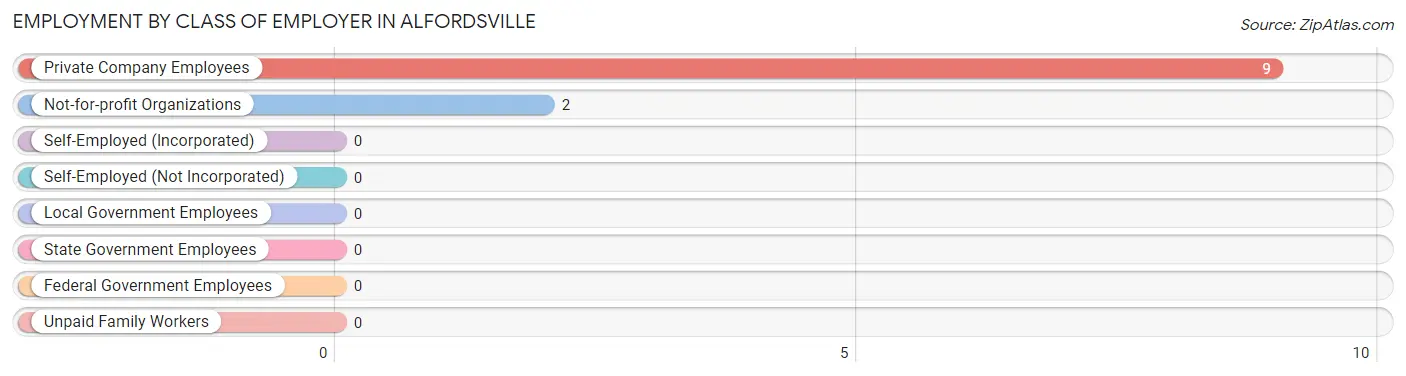
| Employer Class | # Employees | % Employees |
| Private Company Employees | 9 | 81.8% |
| Self-Employed (Incorporated) | 0 | 0.0% |
| Self-Employed (Not Incorporated) | 0 | 0.0% |
| Not-for-profit Organizations | 2 | 18.2% |
| Local Government Employees | 0 | 0.0% |
| State Government Employees | 0 | 0.0% |
| Federal Government Employees | 0 | 0.0% |
| Unpaid Family Workers | 0 | 0.0% |
| Total | 11 | 100.0% |
Employment Status by Age in Alfordsville
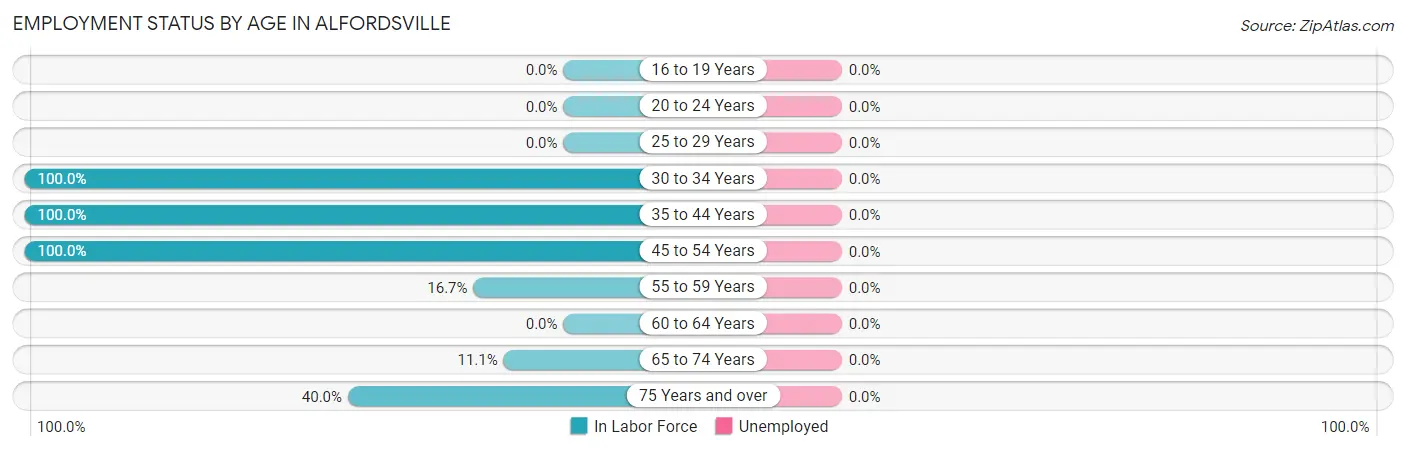
| Age Bracket | In Labor Force | Unemployed |
| 16 to 19 Years | 0 (0.0%) | 0 (0.0%) |
| 20 to 24 Years | 0 (0.0%) | 0 (0.0%) |
| 25 to 29 Years | 0 (0.0%) | 0 (0.0%) |
| 30 to 34 Years | 2 (100.0%) | 0 (0.0%) |
| 35 to 44 Years | 2 (100.0%) | 0 (0.0%) |
| 45 to 54 Years | 2 (100.0%) | 0 (0.0%) |
| 55 to 59 Years | 1 (16.7%) | 0 (0.0%) |
| 60 to 64 Years | 0 (0.0%) | 0 (0.0%) |
| 65 to 74 Years | 2 (11.1%) | 0 (0.0%) |
| 75 Years and over | 2 (40.0%) | 0 (0.0%) |
| Total | 11 (31.4%) | 0 (0.0%) |
Employment Status by Educational Attainment in Alfordsville

| Educational Attainment | In Labor Force | Unemployed |
| Less than High School | 0 (0.0%) | 0 (0.0%) |
| High School Diploma | 6 (54.5%) | 0 (0.0%) |
| College / Associate Degree | 1 (100.0%) | 0 (0.0%) |
| Bachelor's Degree or higher | 0 (0.0%) | 0 (0.0%) |
| Total | 7 (58.3%) | 0 (0.0%) |
Employment Occupations by Sex in Alfordsville
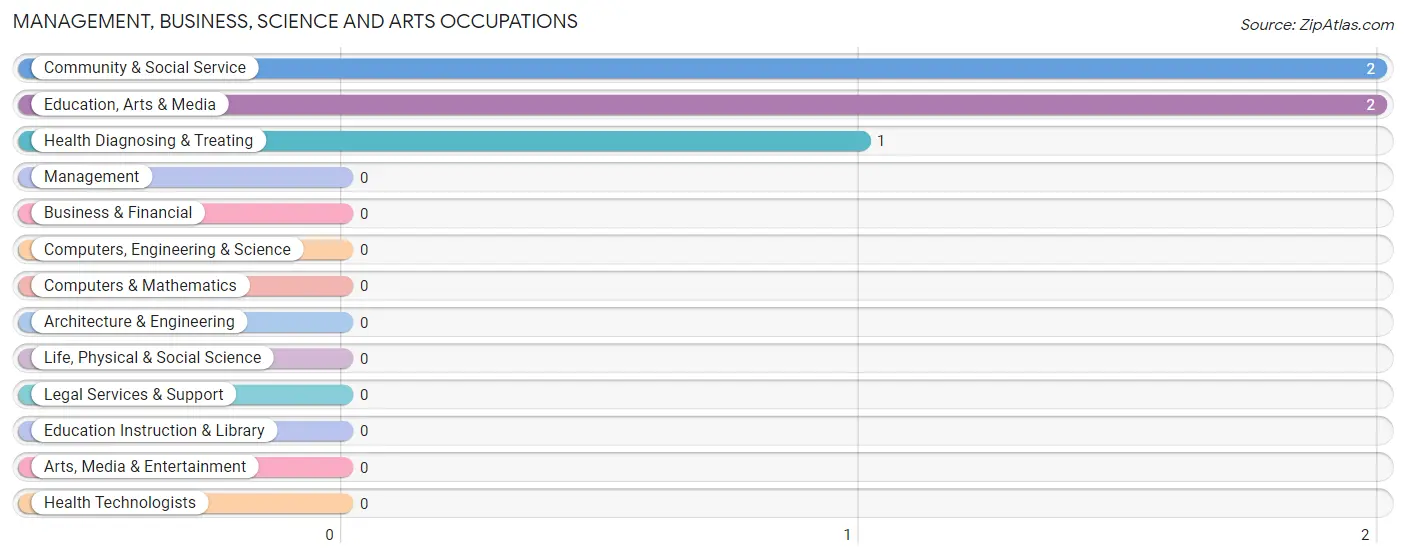
Management, Business, Science and Arts Occupations
The most common Management, Business, Science and Arts occupations in Alfordsville are Community & Social Service (2 | 18.2%), Education, Arts & Media (2 | 18.2%), and Health Diagnosing & Treating (1 | 9.1%).
Management, Business, Science and Arts Occupations by Sex
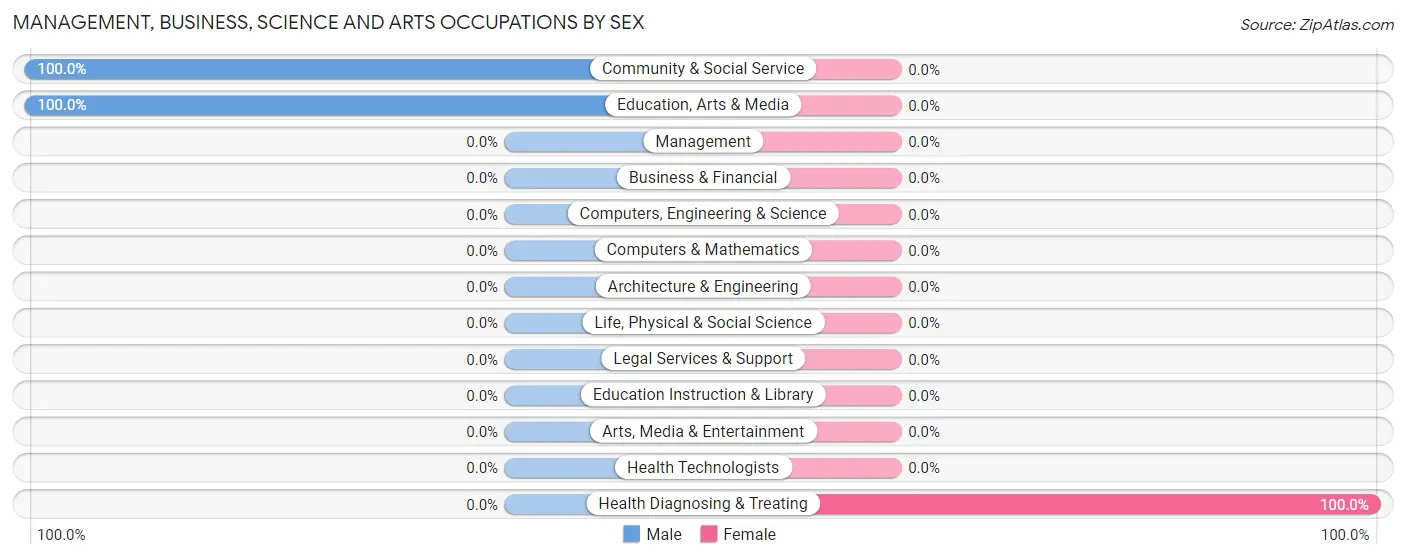
| Occupation | Male | Female |
| Management | 0 (0.0%) | 0 (0.0%) |
| Business & Financial | 0 (0.0%) | 0 (0.0%) |
| Computers, Engineering & Science | 0 (0.0%) | 0 (0.0%) |
| Computers & Mathematics | 0 (0.0%) | 0 (0.0%) |
| Architecture & Engineering | 0 (0.0%) | 0 (0.0%) |
| Life, Physical & Social Science | 0 (0.0%) | 0 (0.0%) |
| Community & Social Service | 2 (100.0%) | 0 (0.0%) |
| Education, Arts & Media | 2 (100.0%) | 0 (0.0%) |
| Legal Services & Support | 0 (0.0%) | 0 (0.0%) |
| Education Instruction & Library | 0 (0.0%) | 0 (0.0%) |
| Arts, Media & Entertainment | 0 (0.0%) | 0 (0.0%) |
| Health Diagnosing & Treating | 0 (0.0%) | 1 (100.0%) |
| Health Technologists | 0 (0.0%) | 0 (0.0%) |
| Total (Category) | 2 (66.7%) | 1 (33.3%) |
| Total (Overall) | 9 (81.8%) | 2 (18.2%) |
Services Occupations
Services Occupations by Sex
| Occupation | Male | Female |
| Healthcare Support | 0 (0.0%) | 0 (0.0%) |
| Security & Protection | 0 (0.0%) | 0 (0.0%) |
| Firefighting & Prevention | 0 (0.0%) | 0 (0.0%) |
| Law Enforcement | 0 (0.0%) | 0 (0.0%) |
| Food Preparation & Serving | 0 (0.0%) | 0 (0.0%) |
| Cleaning & Maintenance | 0 (0.0%) | 0 (0.0%) |
| Personal Care & Service | 0 (0.0%) | 0 (0.0%) |
| Total (Category) | 0 (0.0%) | 0 (0.0%) |
| Total (Overall) | 9 (81.8%) | 2 (18.2%) |
Sales and Office Occupations
Sales and Office Occupations by Sex
| Occupation | Male | Female |
| Sales & Related | 0 (0.0%) | 0 (0.0%) |
| Office & Administration | 0 (0.0%) | 0 (0.0%) |
| Total (Category) | 0 (0.0%) | 0 (0.0%) |
| Total (Overall) | 9 (81.8%) | 2 (18.2%) |
Natural Resources, Construction and Maintenance Occupations

Natural Resources, Construction and Maintenance Occupations by Sex

| Occupation | Male | Female |
| Farming, Fishing & Forestry | 0 (0.0%) | 0 (0.0%) |
| Construction & Extraction | 0 (0.0%) | 0 (0.0%) |
| Installation, Maintenance & Repair | 0 (0.0%) | 0 (0.0%) |
| Total (Category) | 0 (0.0%) | 0 (0.0%) |
| Total (Overall) | 9 (81.8%) | 2 (18.2%) |
Production, Transportation and Moving Occupations
The most common Production, Transportation and Moving occupations in Alfordsville are Production (6 | 54.5%), Transportation (1 | 9.1%), and Material Moving (1 | 9.1%).
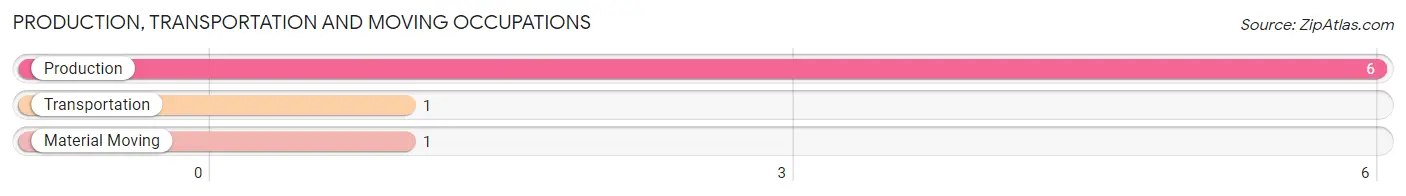
Production, Transportation and Moving Occupations by Sex
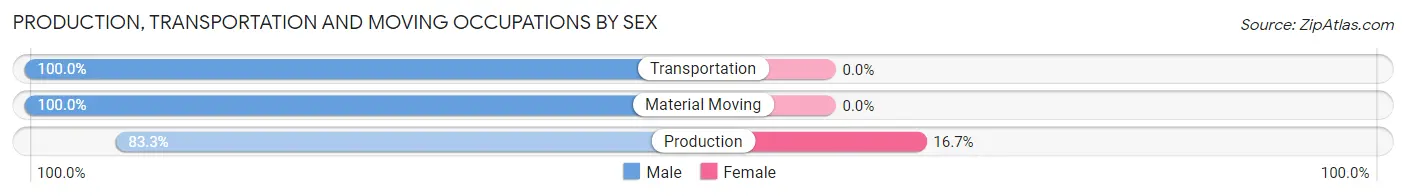
| Occupation | Male | Female |
| Production | 5 (83.3%) | 1 (16.7%) |
| Transportation | 1 (100.0%) | 0 (0.0%) |
| Material Moving | 1 (100.0%) | 0 (0.0%) |
| Total (Category) | 7 (87.5%) | 1 (12.5%) |
| Total (Overall) | 9 (81.8%) | 2 (18.2%) |
Employment Industries by Sex in Alfordsville
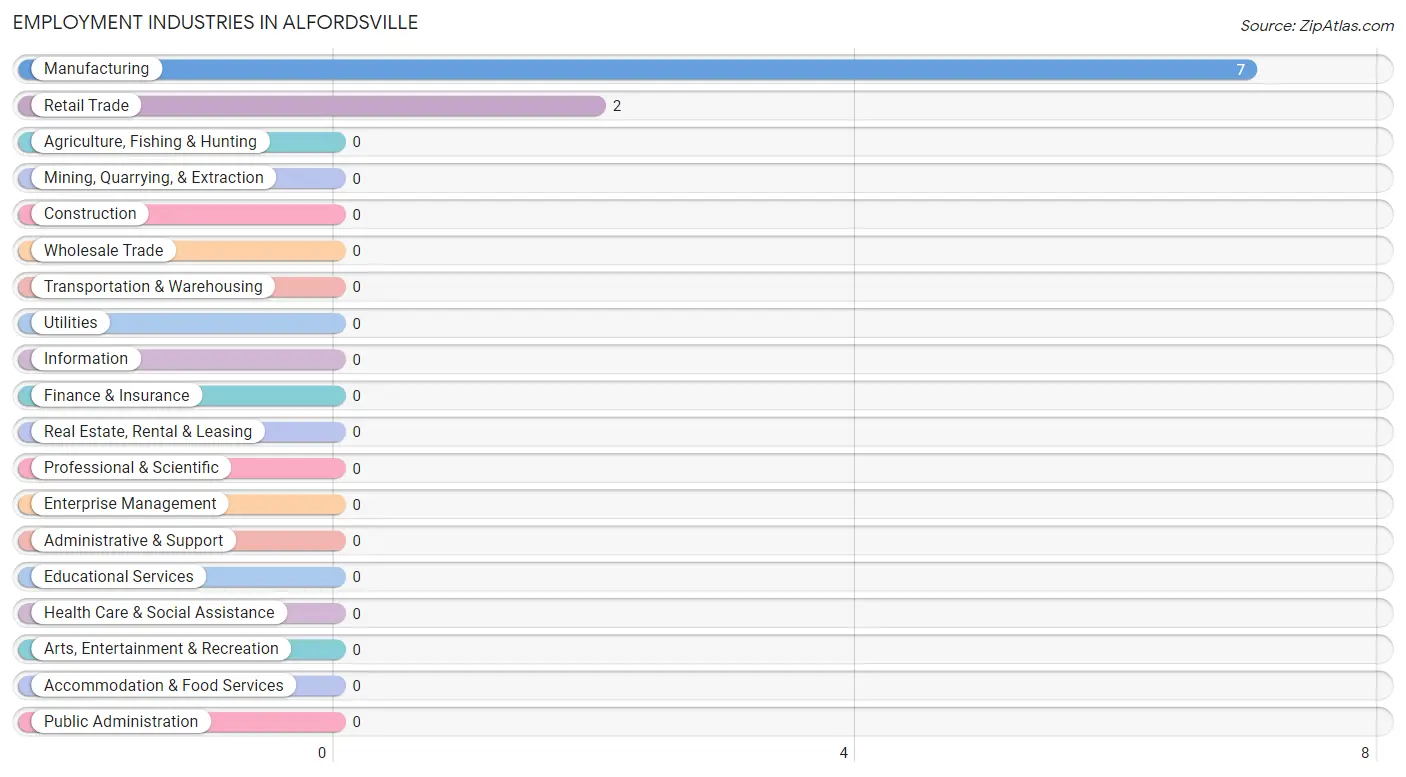
Employment Industries in Alfordsville
The major employment industries in Alfordsville include Manufacturing (7 | 63.6%), and Retail Trade (2 | 18.2%).
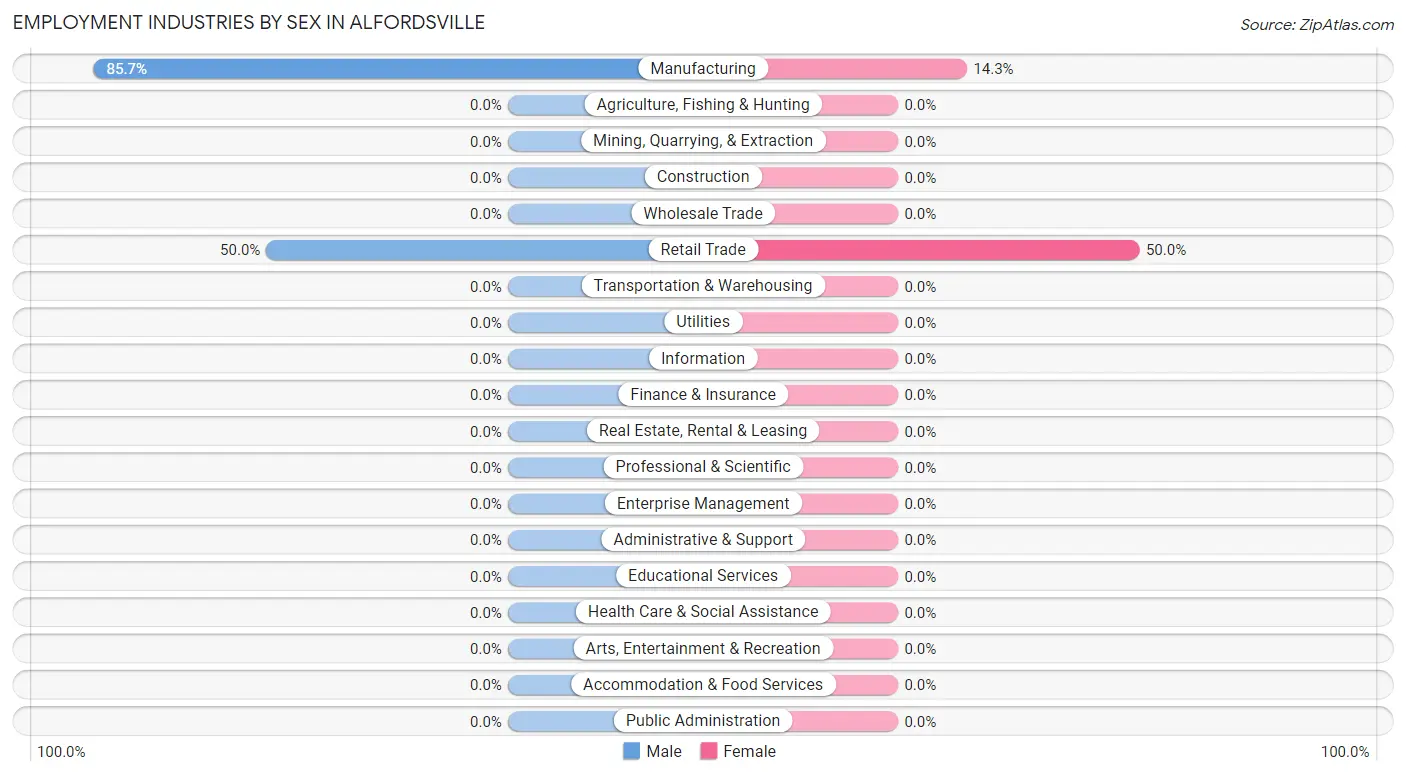
Employment Industries by Sex in Alfordsville
The Alfordsville industries that see more men than women are Manufacturing (85.7%), and Retail Trade (50.0%), whereas the industries that tend to have a higher number of women are Retail Trade (50.0%), and Manufacturing (14.3%).
| Industry | Male | Female |
| Agriculture, Fishing & Hunting | 0 (0.0%) | 0 (0.0%) |
| Mining, Quarrying, & Extraction | 0 (0.0%) | 0 (0.0%) |
| Construction | 0 (0.0%) | 0 (0.0%) |
| Manufacturing | 6 (85.7%) | 1 (14.3%) |
| Wholesale Trade | 0 (0.0%) | 0 (0.0%) |
| Retail Trade | 1 (50.0%) | 1 (50.0%) |
| Transportation & Warehousing | 0 (0.0%) | 0 (0.0%) |
| Utilities | 0 (0.0%) | 0 (0.0%) |
| Information | 0 (0.0%) | 0 (0.0%) |
| Finance & Insurance | 0 (0.0%) | 0 (0.0%) |
| Real Estate, Rental & Leasing | 0 (0.0%) | 0 (0.0%) |
| Professional & Scientific | 0 (0.0%) | 0 (0.0%) |
| Enterprise Management | 0 (0.0%) | 0 (0.0%) |
| Administrative & Support | 0 (0.0%) | 0 (0.0%) |
| Educational Services | 0 (0.0%) | 0 (0.0%) |
| Health Care & Social Assistance | 0 (0.0%) | 0 (0.0%) |
| Arts, Entertainment & Recreation | 0 (0.0%) | 0 (0.0%) |
| Accommodation & Food Services | 0 (0.0%) | 0 (0.0%) |
| Public Administration | 0 (0.0%) | 0 (0.0%) |
| Total | 9 (81.8%) | 2 (18.2%) |
Education in Alfordsville
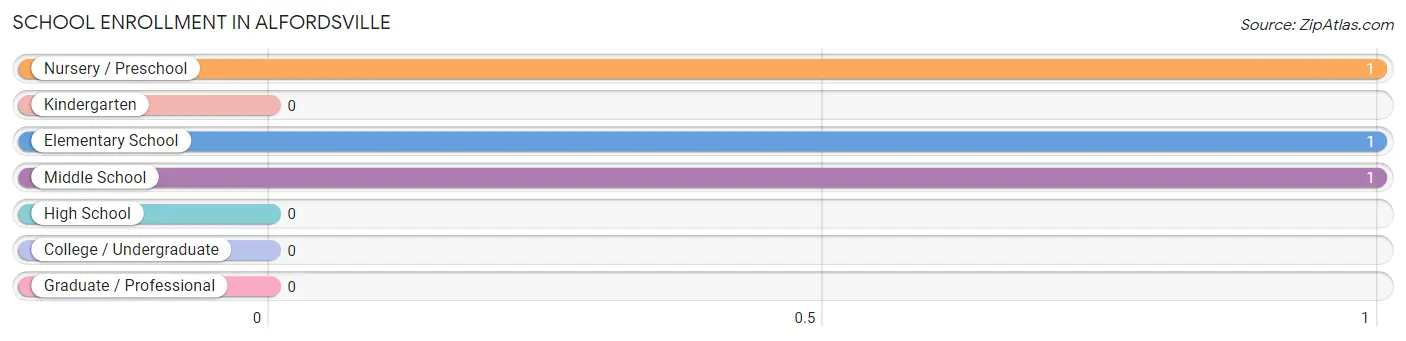
School Enrollment in Alfordsville
The most common levels of schooling among the 3 students in Alfordsville are nursery / preschool (1 | 33.3%), elementary school (1 | 33.3%), and middle school (1 | 33.3%).
| School Level | # Students | % Students |
| Nursery / Preschool | 1 | 33.3% |
| Kindergarten | 0 | 0.0% |
| Elementary School | 1 | 33.3% |
| Middle School | 1 | 33.3% |
| High School | 0 | 0.0% |
| College / Undergraduate | 0 | 0.0% |
| Graduate / Professional | 0 | 0.0% |
| Total | 3 | 100.0% |
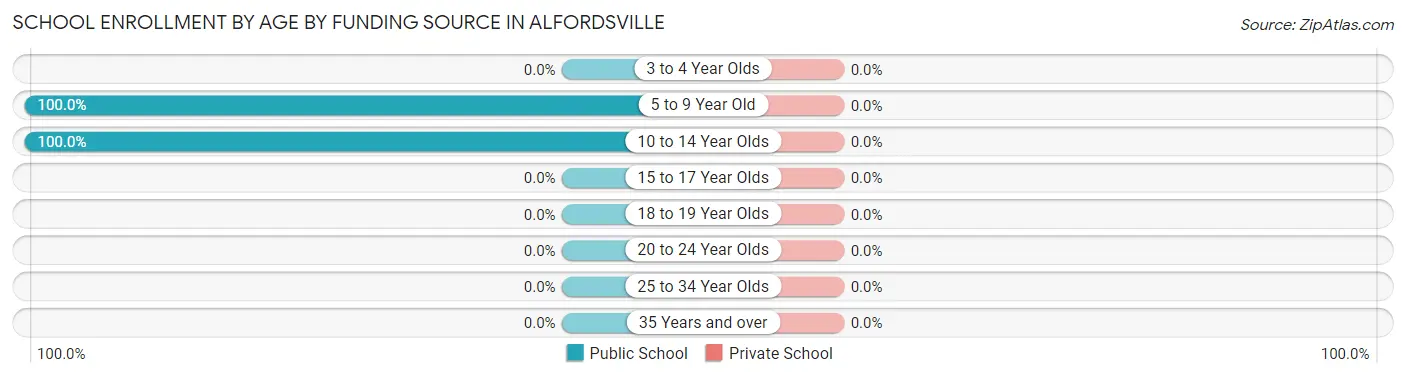
School Enrollment by Age by Funding Source in Alfordsville
| Age Bracket | Public School | Private School |
| 3 to 4 Year Olds | 0 (0.0%) | 0 (0.0%) |
| 5 to 9 Year Old | 2 (100.0%) | 0 (0.0%) |
| 10 to 14 Year Olds | 1 (100.0%) | 0 (0.0%) |
| 15 to 17 Year Olds | 0 (0.0%) | 0 (0.0%) |
| 18 to 19 Year Olds | 0 (0.0%) | 0 (0.0%) |
| 20 to 24 Year Olds | 0 (0.0%) | 0 (0.0%) |
| 25 to 34 Year Olds | 0 (0.0%) | 0 (0.0%) |
| 35 Years and over | 0 (0.0%) | 0 (0.0%) |
| Total | 3 (100.0%) | 0 (0.0%) |
Educational Attainment by Field of Study in Alfordsville
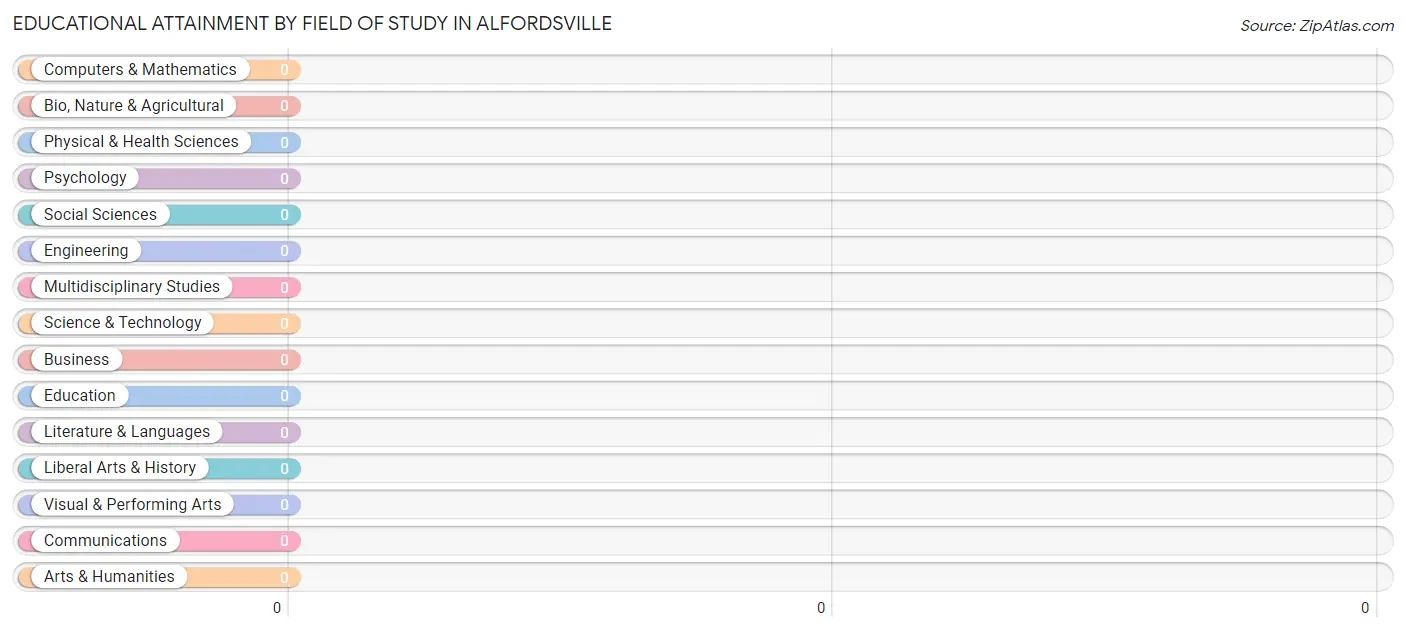
| Field of Study | # Graduates | % Graduates |
| Computers & Mathematics | 0 | 0.0% |
| Bio, Nature & Agricultural | 0 | 0.0% |
| Physical & Health Sciences | 0 | 0.0% |
| Psychology | 0 | 0.0% |
| Social Sciences | 0 | 0.0% |
| Engineering | 0 | 0.0% |
| Multidisciplinary Studies | 0 | 0.0% |
| Science & Technology | 0 | 0.0% |
| Business | 0 | 0.0% |
| Education | 0 | 0.0% |
| Literature & Languages | 0 | 0.0% |
| Liberal Arts & History | 0 | 0.0% |
| Visual & Performing Arts | 0 | 0.0% |
| Communications | 0 | 0.0% |
| Arts & Humanities | 0 | 0.0% |
| Total | 0 | 0.0% |
Transportation & Commute in Alfordsville
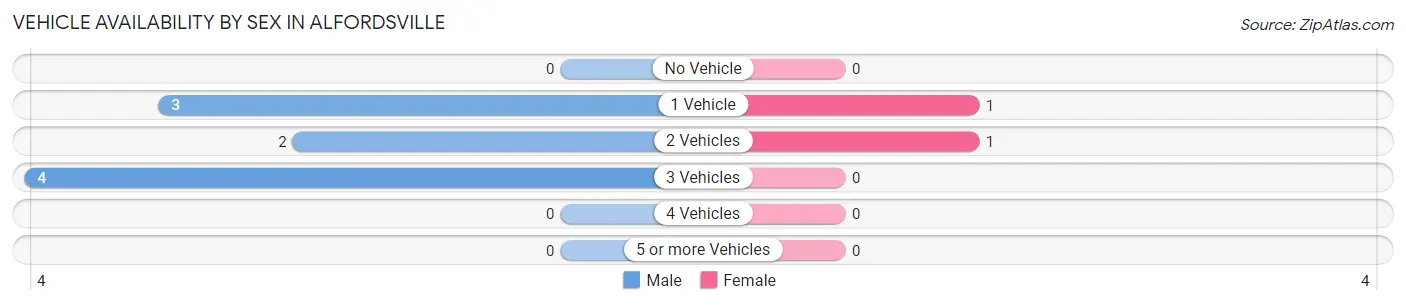
Vehicle Availability by Sex in Alfordsville
The most prevalent vehicle ownership categories in Alfordsville are males with 3 vehicles (4, accounting for 44.4%) and females with 3 vehicles (0, making up 200.0%).
| Vehicles Available | Male | Female |
| No Vehicle | 0 (0.0%) | 0 (0.0%) |
| 1 Vehicle | 3 (33.3%) | 1 (50.0%) |
| 2 Vehicles | 2 (22.2%) | 1 (50.0%) |
| 3 Vehicles | 4 (44.4%) | 0 (0.0%) |
| 4 Vehicles | 0 (0.0%) | 0 (0.0%) |
| 5 or more Vehicles | 0 (0.0%) | 0 (0.0%) |
| Total | 9 (100.0%) | 2 (100.0%) |
Commute Time in Alfordsville
The most frequently occuring commute durations in Alfordsville are 25 to 29 minutes (2 commuters, 18.2%), 30 to 34 minutes (2 commuters, 18.2%), and 40 to 44 minutes (2 commuters, 18.2%).
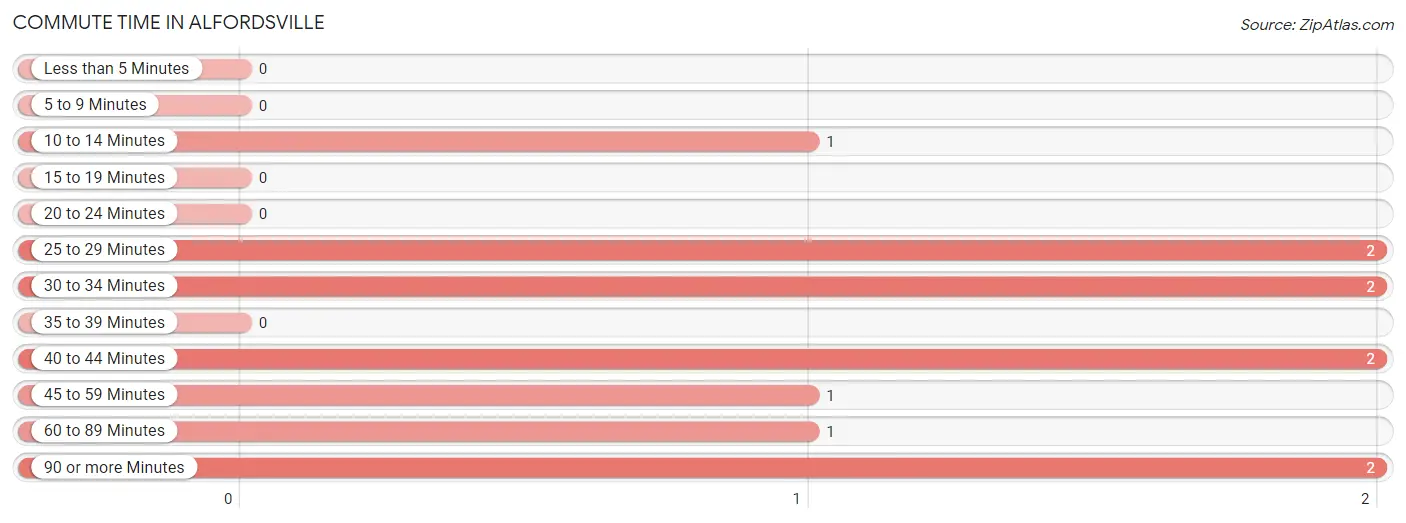
| Commute Time | # Commuters | % Commuters |
| Less than 5 Minutes | 0 | 0.0% |
| 5 to 9 Minutes | 0 | 0.0% |
| 10 to 14 Minutes | 1 | 9.1% |
| 15 to 19 Minutes | 0 | 0.0% |
| 20 to 24 Minutes | 0 | 0.0% |
| 25 to 29 Minutes | 2 | 18.2% |
| 30 to 34 Minutes | 2 | 18.2% |
| 35 to 39 Minutes | 0 | 0.0% |
| 40 to 44 Minutes | 2 | 18.2% |
| 45 to 59 Minutes | 1 | 9.1% |
| 60 to 89 Minutes | 1 | 9.1% |
| 90 or more Minutes | 2 | 18.2% |
Commute Time by Sex in Alfordsville
The most common commute times in Alfordsville are 25 to 29 minutes (2 commuters, 22.2%) for males and 10 to 14 minutes (1 commuters, 50.0%) for females.
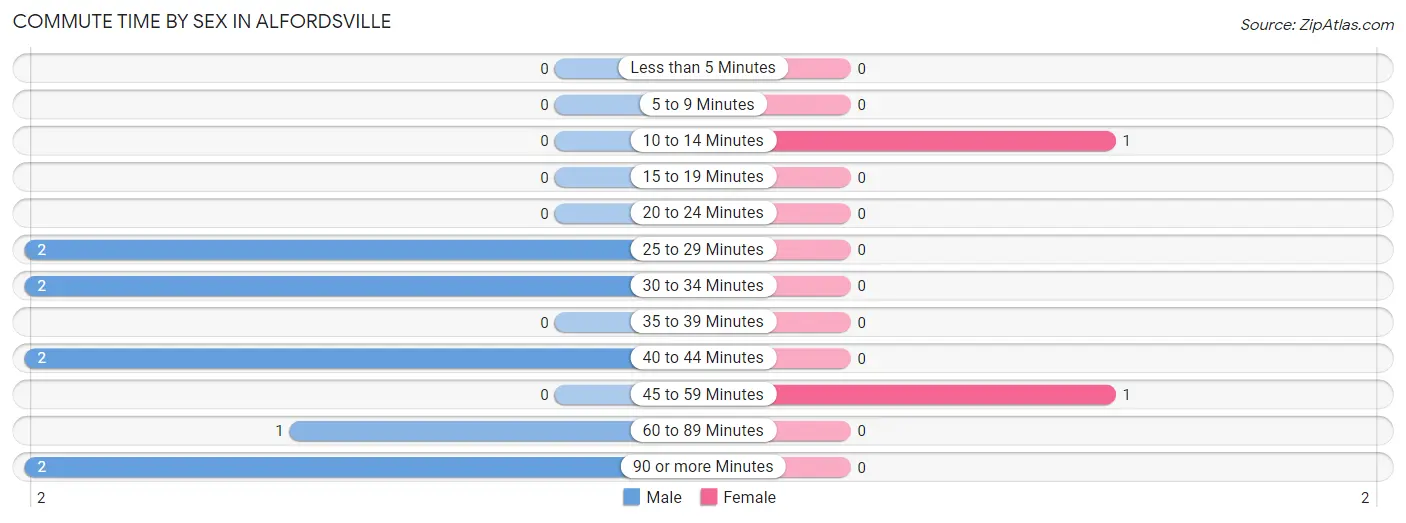
| Commute Time | Male | Female |
| Less than 5 Minutes | 0 (0.0%) | 0 (0.0%) |
| 5 to 9 Minutes | 0 (0.0%) | 0 (0.0%) |
| 10 to 14 Minutes | 0 (0.0%) | 1 (50.0%) |
| 15 to 19 Minutes | 0 (0.0%) | 0 (0.0%) |
| 20 to 24 Minutes | 0 (0.0%) | 0 (0.0%) |
| 25 to 29 Minutes | 2 (22.2%) | 0 (0.0%) |
| 30 to 34 Minutes | 2 (22.2%) | 0 (0.0%) |
| 35 to 39 Minutes | 0 (0.0%) | 0 (0.0%) |
| 40 to 44 Minutes | 2 (22.2%) | 0 (0.0%) |
| 45 to 59 Minutes | 0 (0.0%) | 1 (50.0%) |
| 60 to 89 Minutes | 1 (11.1%) | 0 (0.0%) |
| 90 or more Minutes | 2 (22.2%) | 0 (0.0%) |
Time of Departure to Work by Sex in Alfordsville
The most frequent times of departure to work in Alfordsville are 12:00 AM to 4:59 AM (3, 33.3%) for males and 7:30 AM to 7:59 AM (1, 50.0%) for females.
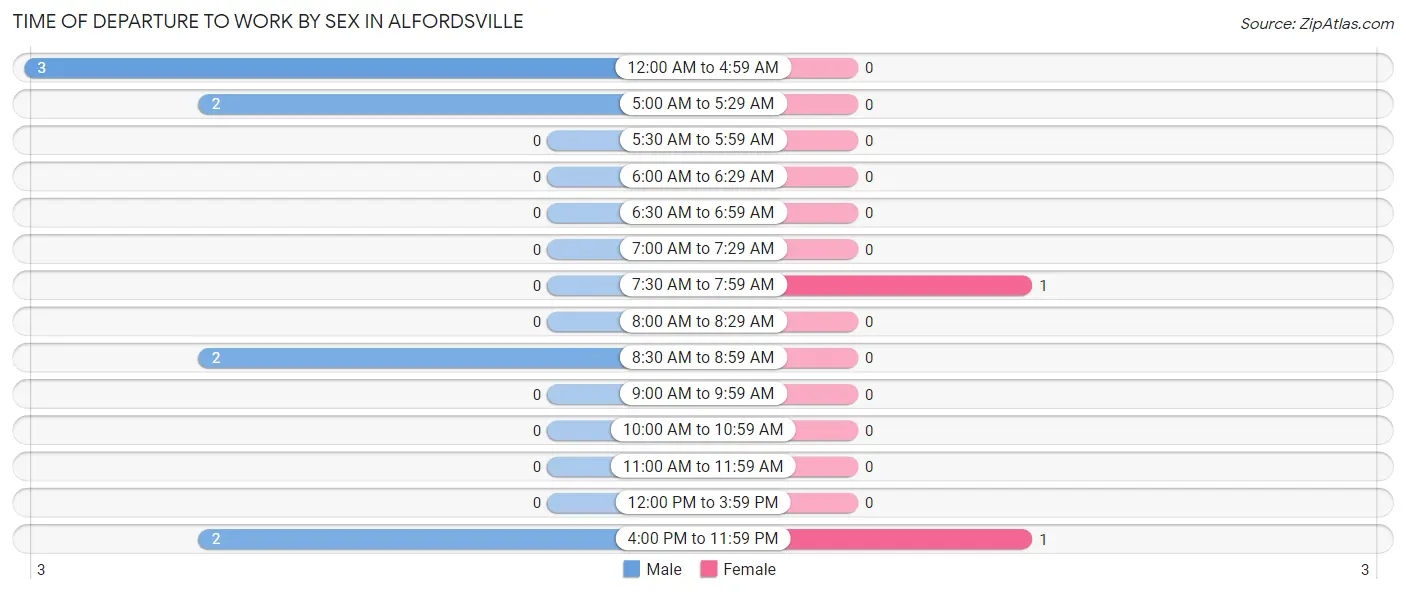
| Time of Departure | Male | Female |
| 12:00 AM to 4:59 AM | 3 (33.3%) | 0 (0.0%) |
| 5:00 AM to 5:29 AM | 2 (22.2%) | 0 (0.0%) |
| 5:30 AM to 5:59 AM | 0 (0.0%) | 0 (0.0%) |
| 6:00 AM to 6:29 AM | 0 (0.0%) | 0 (0.0%) |
| 6:30 AM to 6:59 AM | 0 (0.0%) | 0 (0.0%) |
| 7:00 AM to 7:29 AM | 0 (0.0%) | 0 (0.0%) |
| 7:30 AM to 7:59 AM | 0 (0.0%) | 1 (50.0%) |
| 8:00 AM to 8:29 AM | 0 (0.0%) | 0 (0.0%) |
| 8:30 AM to 8:59 AM | 2 (22.2%) | 0 (0.0%) |
| 9:00 AM to 9:59 AM | 0 (0.0%) | 0 (0.0%) |
| 10:00 AM to 10:59 AM | 0 (0.0%) | 0 (0.0%) |
| 11:00 AM to 11:59 AM | 0 (0.0%) | 0 (0.0%) |
| 12:00 PM to 3:59 PM | 0 (0.0%) | 0 (0.0%) |
| 4:00 PM to 11:59 PM | 2 (22.2%) | 1 (50.0%) |
| Total | 9 (100.0%) | 2 (100.0%) |
Housing Occupancy in Alfordsville
Occupancy by Ownership in Alfordsville
Of the total 21 dwellings in Alfordsville, owner-occupied units account for 20 (95.2%), while renter-occupied units make up 1 (4.8%).
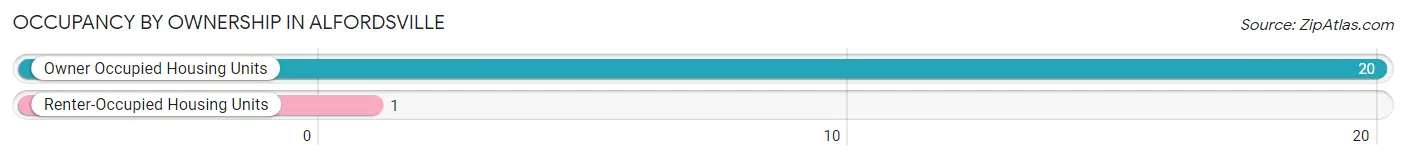
| Occupancy | # Housing Units | % Housing Units |
| Owner Occupied Housing Units | 20 | 95.2% |
| Renter-Occupied Housing Units | 1 | 4.8% |
| Total Occupied Housing Units | 21 | 100.0% |
Occupancy by Household Size in Alfordsville
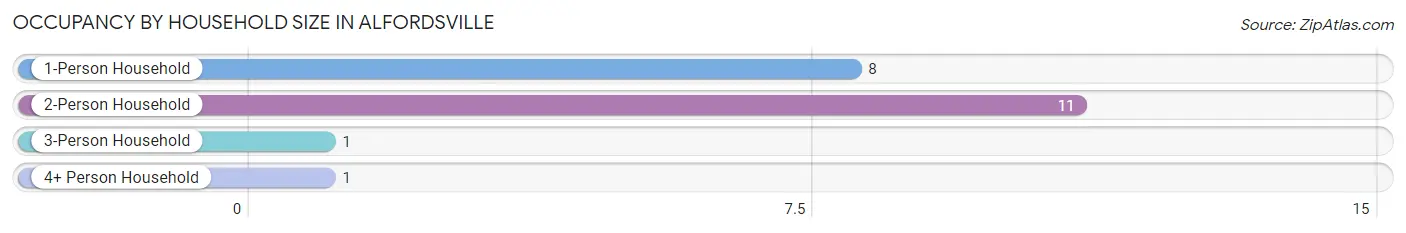
| Household Size | # Housing Units | % Housing Units |
| 1-Person Household | 8 | 38.1% |
| 2-Person Household | 11 | 52.4% |
| 3-Person Household | 1 | 4.8% |
| 4+ Person Household | 1 | 4.8% |
| Total Housing Units | 21 | 100.0% |
Occupancy by Ownership by Household Size in Alfordsville
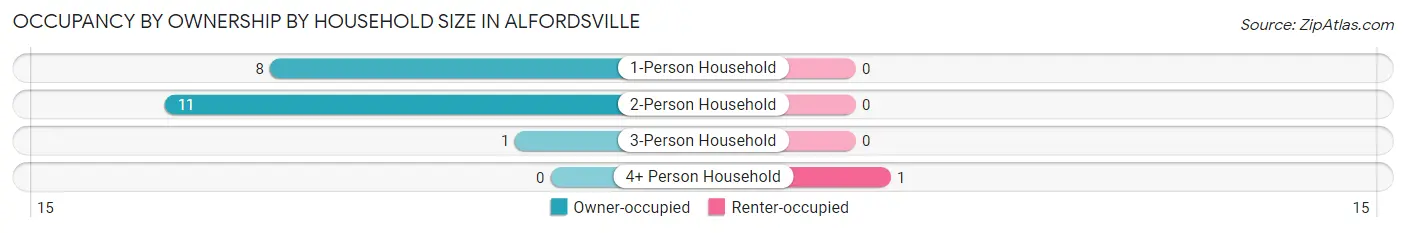
| Household Size | Owner-occupied | Renter-occupied |
| 1-Person Household | 8 (100.0%) | 0 (0.0%) |
| 2-Person Household | 11 (100.0%) | 0 (0.0%) |
| 3-Person Household | 1 (100.0%) | 0 (0.0%) |
| 4+ Person Household | 0 (0.0%) | 1 (100.0%) |
| Total Housing Units | 20 (95.2%) | 1 (4.8%) |
Occupancy by Educational Attainment in Alfordsville
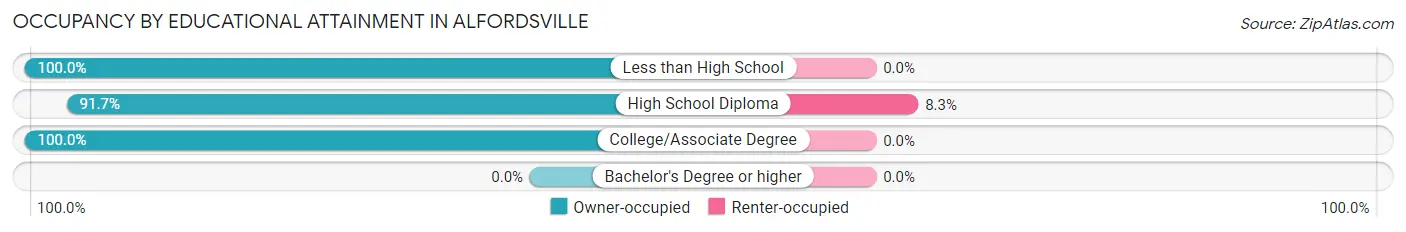
| Household Size | Owner-occupied | Renter-occupied |
| Less than High School | 5 (100.0%) | 0 (0.0%) |
| High School Diploma | 11 (91.7%) | 1 (8.3%) |
| College/Associate Degree | 4 (100.0%) | 0 (0.0%) |
| Bachelor's Degree or higher | 0 (0.0%) | 0 (0.0%) |
Occupancy by Age of Householder in Alfordsville
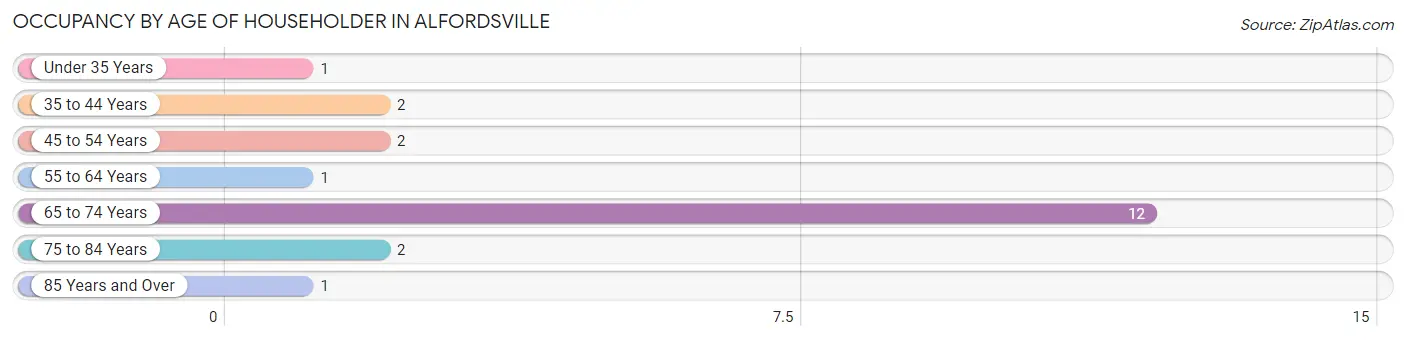
| Age Bracket | # Households | % Households |
| Under 35 Years | 1 | 4.8% |
| 35 to 44 Years | 2 | 9.5% |
| 45 to 54 Years | 2 | 9.5% |
| 55 to 64 Years | 1 | 4.8% |
| 65 to 74 Years | 12 | 57.1% |
| 75 to 84 Years | 2 | 9.5% |
| 85 Years and Over | 1 | 4.8% |
| Total | 21 | 100.0% |
Housing Finances in Alfordsville
Median Income by Occupancy in Alfordsville
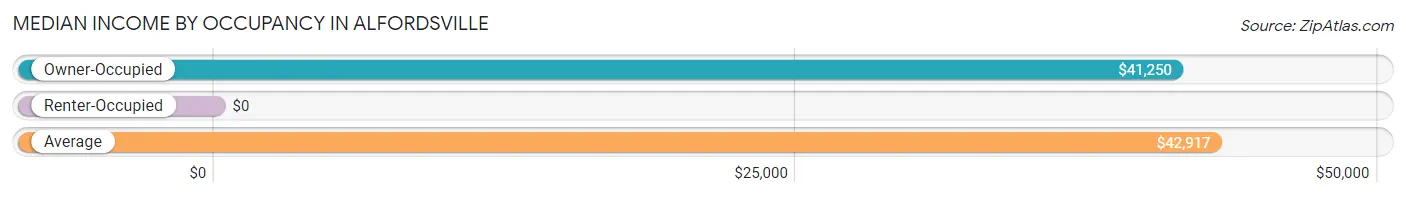
| Occupancy Type | # Households | Median Income |
| Owner-Occupied | 20 (95.2%) | $41,250 |
| Renter-Occupied | 1 (4.8%) | $0 |
| Average | 21 (100.0%) | $42,917 |
Occupancy by Householder Income Bracket in Alfordsville
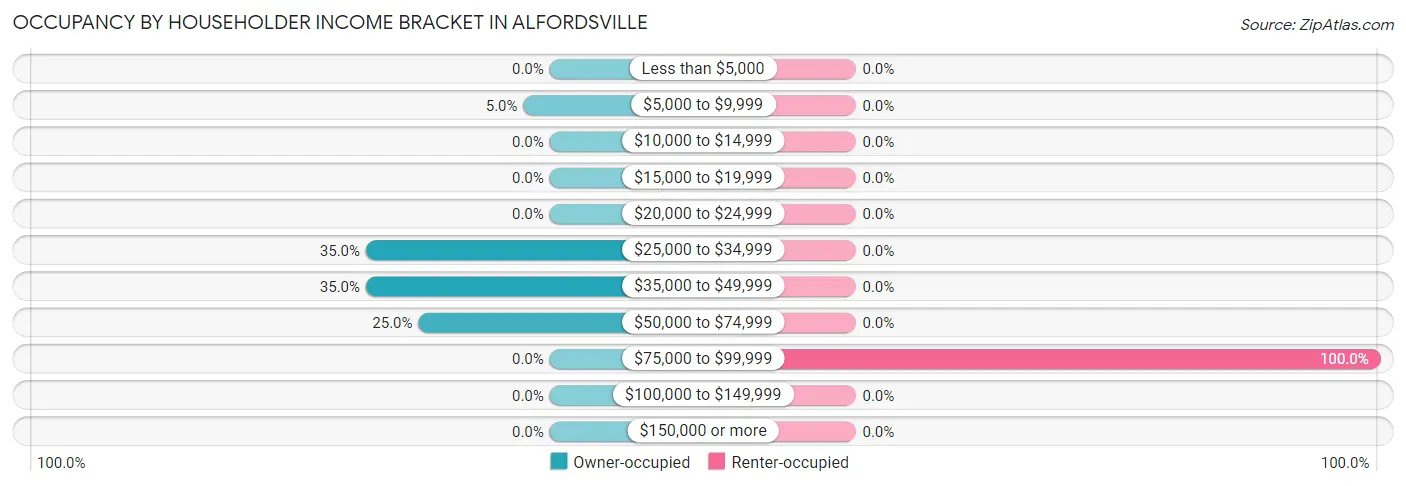
| Income Bracket | Owner-occupied | Renter-occupied |
| Less than $5,000 | 0 (0.0%) | 0 (0.0%) |
| $5,000 to $9,999 | 1 (5.0%) | 0 (0.0%) |
| $10,000 to $14,999 | 0 (0.0%) | 0 (0.0%) |
| $15,000 to $19,999 | 0 (0.0%) | 0 (0.0%) |
| $20,000 to $24,999 | 0 (0.0%) | 0 (0.0%) |
| $25,000 to $34,999 | 7 (35.0%) | 0 (0.0%) |
| $35,000 to $49,999 | 7 (35.0%) | 0 (0.0%) |
| $50,000 to $74,999 | 5 (25.0%) | 0 (0.0%) |
| $75,000 to $99,999 | 0 (0.0%) | 1 (100.0%) |
| $100,000 to $149,999 | 0 (0.0%) | 0 (0.0%) |
| $150,000 or more | 0 (0.0%) | 0 (0.0%) |
| Total | 20 (100.0%) | 1 (100.0%) |
Monthly Housing Cost Tiers in Alfordsville
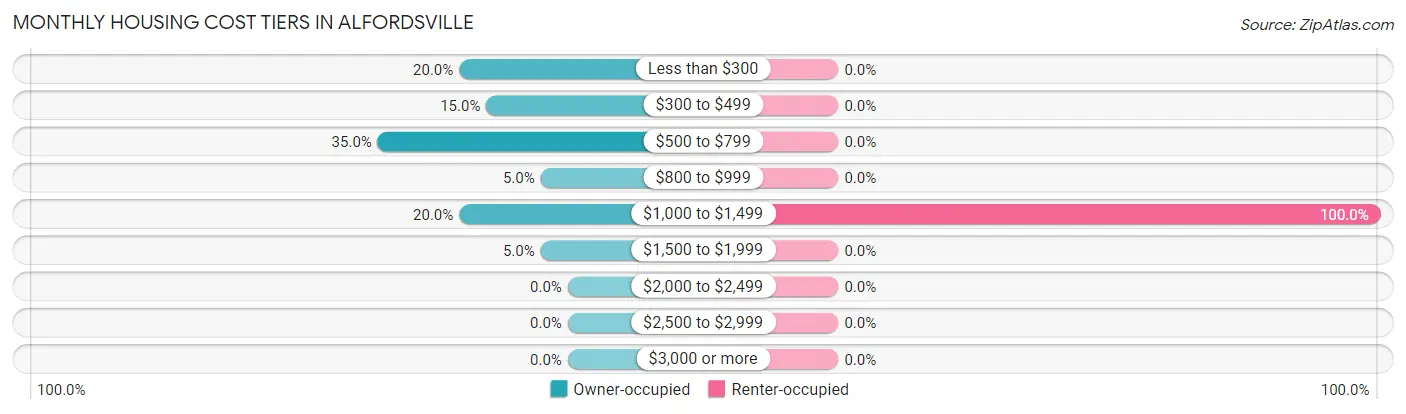
| Monthly Cost | Owner-occupied | Renter-occupied |
| Less than $300 | 4 (20.0%) | 0 (0.0%) |
| $300 to $499 | 3 (15.0%) | 0 (0.0%) |
| $500 to $799 | 7 (35.0%) | 0 (0.0%) |
| $800 to $999 | 1 (5.0%) | 0 (0.0%) |
| $1,000 to $1,499 | 4 (20.0%) | 1 (100.0%) |
| $1,500 to $1,999 | 1 (5.0%) | 0 (0.0%) |
| $2,000 to $2,499 | 0 (0.0%) | 0 (0.0%) |
| $2,500 to $2,999 | 0 (0.0%) | 0 (0.0%) |
| $3,000 or more | 0 (0.0%) | 0 (0.0%) |
| Total | 20 (100.0%) | 1 (100.0%) |
Physical Housing Characteristics in Alfordsville
Housing Structures in Alfordsville
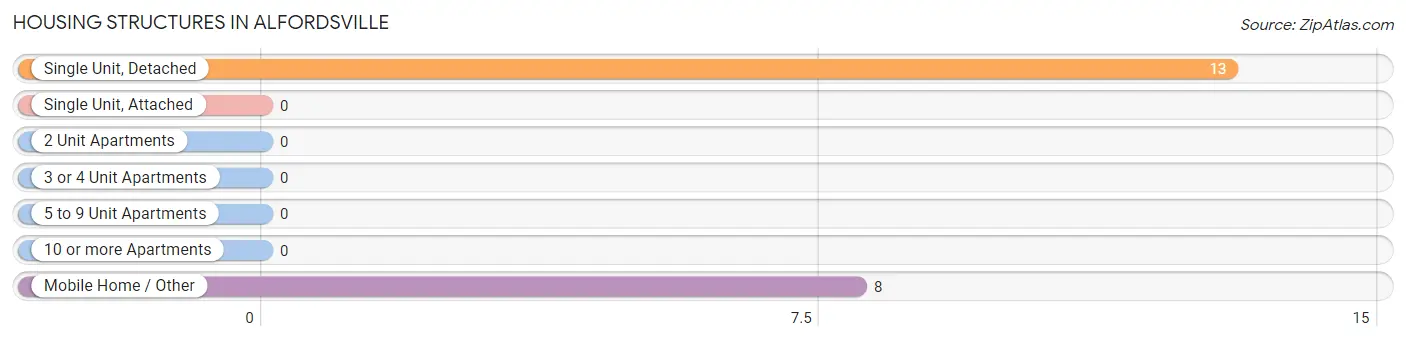
| Structure Type | # Housing Units | % Housing Units |
| Single Unit, Detached | 13 | 61.9% |
| Single Unit, Attached | 0 | 0.0% |
| 2 Unit Apartments | 0 | 0.0% |
| 3 or 4 Unit Apartments | 0 | 0.0% |
| 5 to 9 Unit Apartments | 0 | 0.0% |
| 10 or more Apartments | 0 | 0.0% |
| Mobile Home / Other | 8 | 38.1% |
| Total | 21 | 100.0% |
Housing Structures by Occupancy in Alfordsville
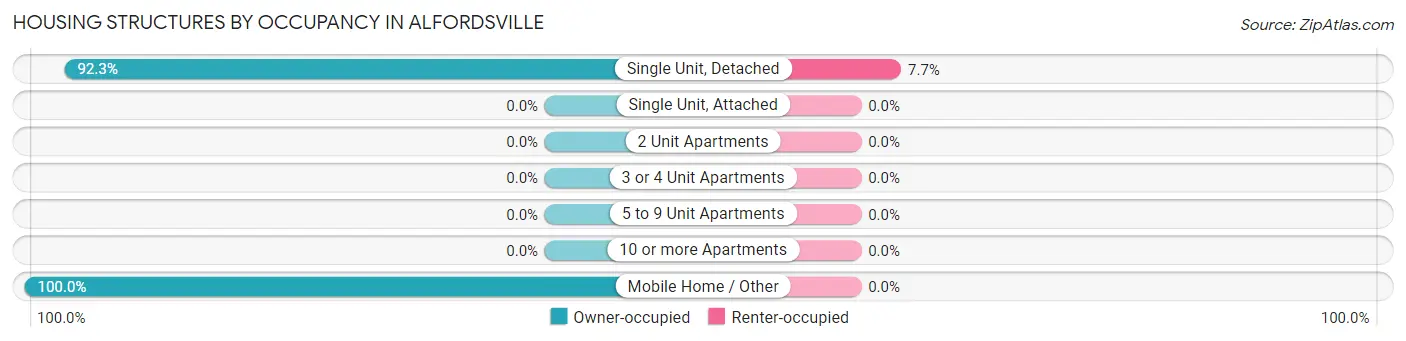
| Structure Type | Owner-occupied | Renter-occupied |
| Single Unit, Detached | 12 (92.3%) | 1 (7.7%) |
| Single Unit, Attached | 0 (0.0%) | 0 (0.0%) |
| 2 Unit Apartments | 0 (0.0%) | 0 (0.0%) |
| 3 or 4 Unit Apartments | 0 (0.0%) | 0 (0.0%) |
| 5 to 9 Unit Apartments | 0 (0.0%) | 0 (0.0%) |
| 10 or more Apartments | 0 (0.0%) | 0 (0.0%) |
| Mobile Home / Other | 8 (100.0%) | 0 (0.0%) |
| Total | 20 (95.2%) | 1 (4.8%) |
Housing Structures by Number of Rooms in Alfordsville
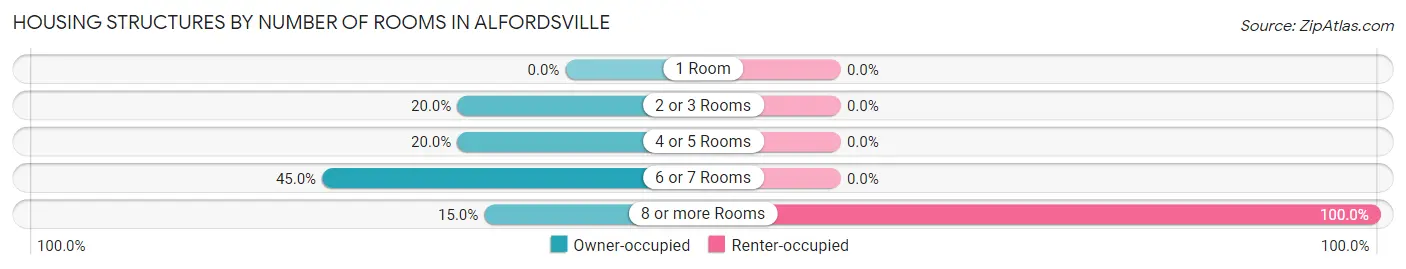
| Number of Rooms | Owner-occupied | Renter-occupied |
| 1 Room | 0 (0.0%) | 0 (0.0%) |
| 2 or 3 Rooms | 4 (20.0%) | 0 (0.0%) |
| 4 or 5 Rooms | 4 (20.0%) | 0 (0.0%) |
| 6 or 7 Rooms | 9 (45.0%) | 0 (0.0%) |
| 8 or more Rooms | 3 (15.0%) | 1 (100.0%) |
| Total | 20 (100.0%) | 1 (100.0%) |
Housing Structure by Heating Type in Alfordsville
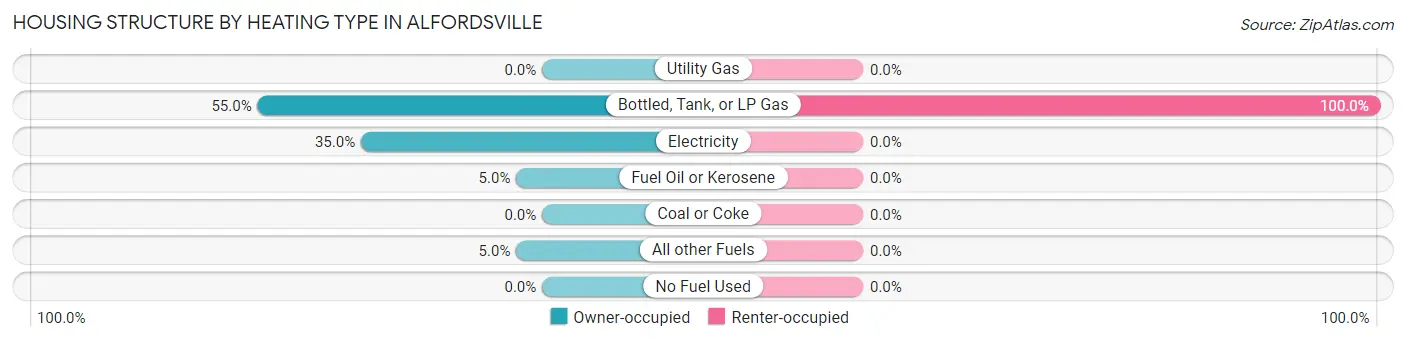
| Heating Type | Owner-occupied | Renter-occupied |
| Utility Gas | 0 (0.0%) | 0 (0.0%) |
| Bottled, Tank, or LP Gas | 11 (55.0%) | 1 (100.0%) |
| Electricity | 7 (35.0%) | 0 (0.0%) |
| Fuel Oil or Kerosene | 1 (5.0%) | 0 (0.0%) |
| Coal or Coke | 0 (0.0%) | 0 (0.0%) |
| All other Fuels | 1 (5.0%) | 0 (0.0%) |
| No Fuel Used | 0 (0.0%) | 0 (0.0%) |
| Total | 20 (100.0%) | 1 (100.0%) |
Household Vehicle Usage in Alfordsville
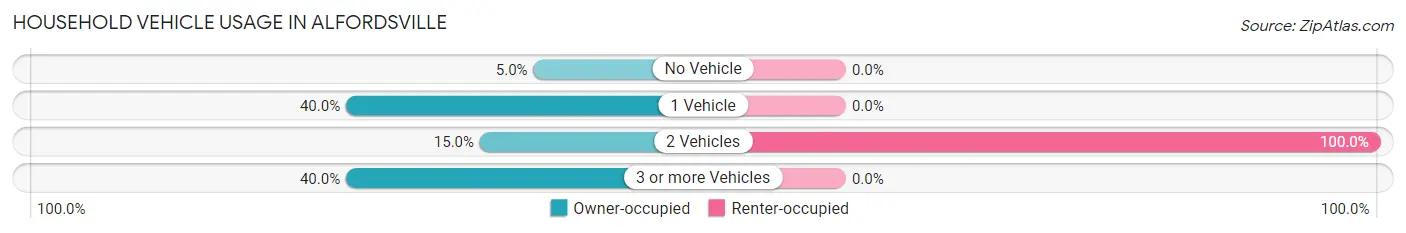
| Vehicles per Household | Owner-occupied | Renter-occupied |
| No Vehicle | 1 (5.0%) | 0 (0.0%) |
| 1 Vehicle | 8 (40.0%) | 0 (0.0%) |
| 2 Vehicles | 3 (15.0%) | 1 (100.0%) |
| 3 or more Vehicles | 8 (40.0%) | 0 (0.0%) |
| Total | 20 (100.0%) | 1 (100.0%) |
Real Estate & Mortgages in Alfordsville
Real Estate and Mortgage Overview in Alfordsville
| Characteristic | Without Mortgage | With Mortgage |
| Housing Units | 12 | 8 |
| Median Property Value | - | - |
| Median Household Income | $36,250 | $0 |
| Monthly Housing Costs | - | - |
| Real Estate Taxes | - | - |
Property Value by Mortgage Status in Alfordsville
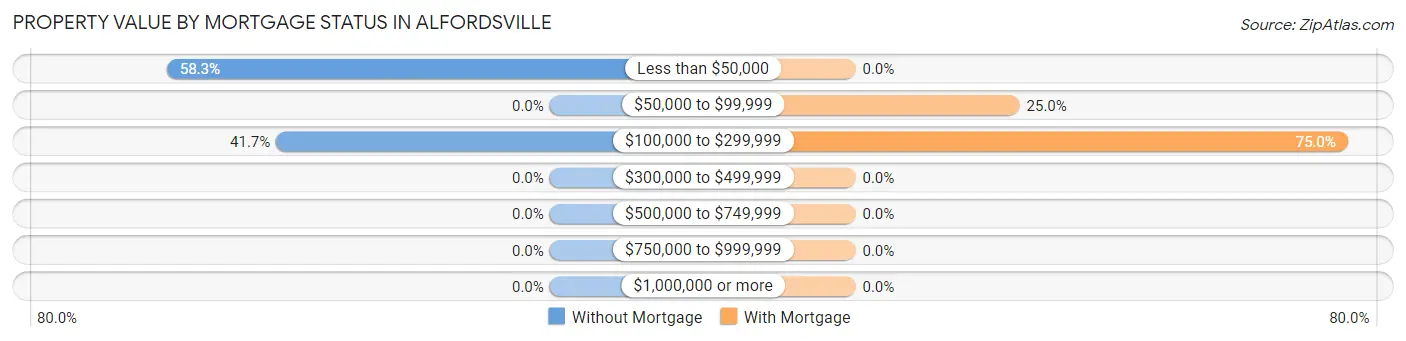
| Property Value | Without Mortgage | With Mortgage |
| Less than $50,000 | 7 (58.3%) | 0 (0.0%) |
| $50,000 to $99,999 | 0 (0.0%) | 2 (25.0%) |
| $100,000 to $299,999 | 5 (41.7%) | 6 (75.0%) |
| $300,000 to $499,999 | 0 (0.0%) | 0 (0.0%) |
| $500,000 to $749,999 | 0 (0.0%) | 0 (0.0%) |
| $750,000 to $999,999 | 0 (0.0%) | 0 (0.0%) |
| $1,000,000 or more | 0 (0.0%) | 0 (0.0%) |
| Total | 12 (100.0%) | 8 (100.0%) |
Household Income by Mortgage Status in Alfordsville
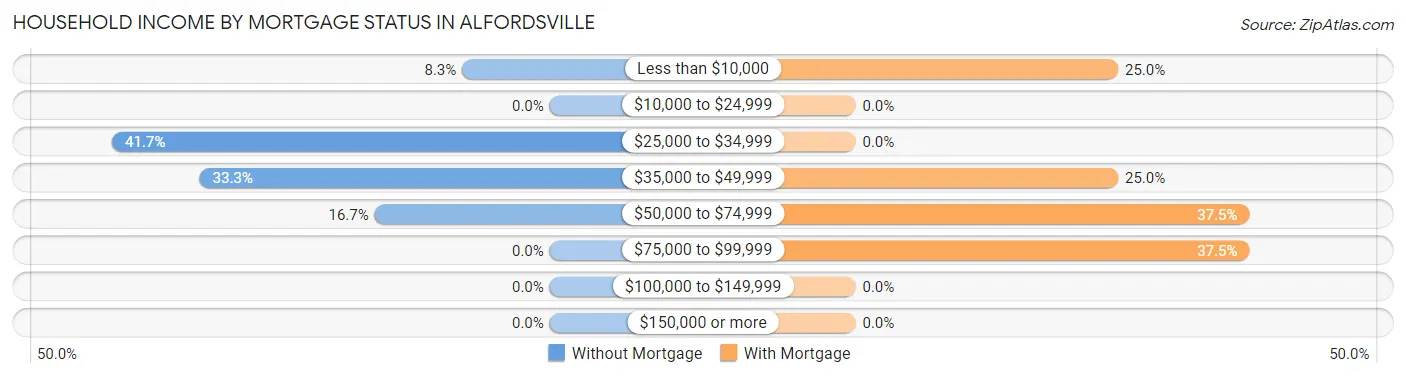
| Household Income | Without Mortgage | With Mortgage |
| Less than $10,000 | 1 (8.3%) | 2 (25.0%) |
| $10,000 to $24,999 | 0 (0.0%) | 0 (0.0%) |
| $25,000 to $34,999 | 5 (41.7%) | 0 (0.0%) |
| $35,000 to $49,999 | 4 (33.3%) | 2 (25.0%) |
| $50,000 to $74,999 | 2 (16.7%) | 3 (37.5%) |
| $75,000 to $99,999 | 0 (0.0%) | 3 (37.5%) |
| $100,000 to $149,999 | 0 (0.0%) | 0 (0.0%) |
| $150,000 or more | 0 (0.0%) | 0 (0.0%) |
| Total | 12 (100.0%) | 8 (100.0%) |
Property Value to Household Income Ratio in Alfordsville
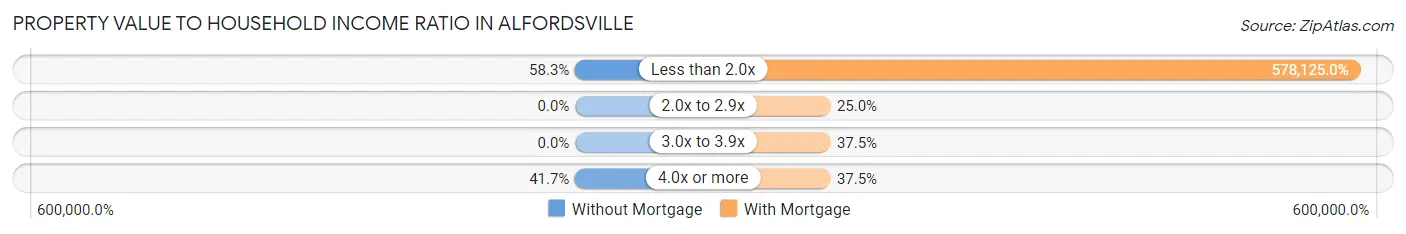
| Value-to-Income Ratio | Without Mortgage | With Mortgage |
| Less than 2.0x | 7 (58.3%) | 46,250 (578,125.0%) |
| 2.0x to 2.9x | 0 (0.0%) | 2 (25.0%) |
| 3.0x to 3.9x | 0 (0.0%) | 3 (37.5%) |
| 4.0x or more | 5 (41.7%) | 3 (37.5%) |
| Total | 12 (100.0%) | 8 (100.0%) |
Real Estate Taxes by Mortgage Status in Alfordsville
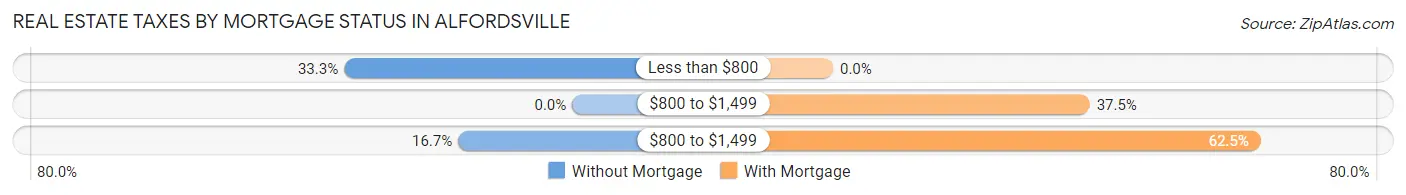
| Property Taxes | Without Mortgage | With Mortgage |
| Less than $800 | 4 (33.3%) | 0 (0.0%) |
| $800 to $1,499 | 0 (0.0%) | 3 (37.5%) |
| $800 to $1,499 | 2 (16.7%) | 5 (62.5%) |
| Total | 12 (100.0%) | 8 (100.0%) |
Health & Disability in Alfordsville
Health Insurance Coverage by Age in Alfordsville
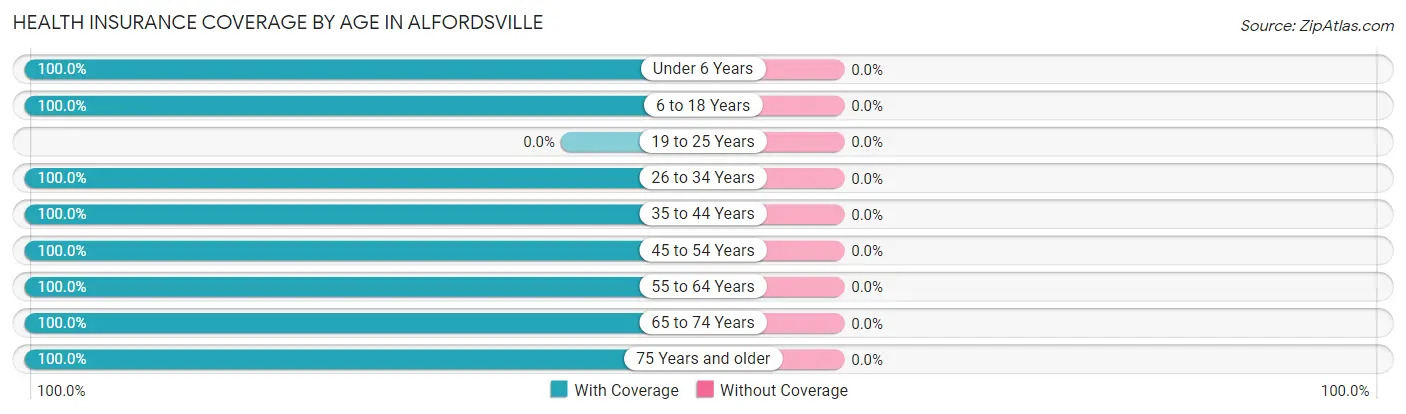
| Age Bracket | With Coverage | Without Coverage |
| Under 6 Years | 2 (100.0%) | 0 (0.0%) |
| 6 to 18 Years | 2 (100.0%) | 0 (0.0%) |
| 19 to 25 Years | 0 (0.0%) | 0 (0.0%) |
| 26 to 34 Years | 2 (100.0%) | 0 (0.0%) |
| 35 to 44 Years | 2 (100.0%) | 0 (0.0%) |
| 45 to 54 Years | 2 (100.0%) | 0 (0.0%) |
| 55 to 64 Years | 6 (100.0%) | 0 (0.0%) |
| 65 to 74 Years | 18 (100.0%) | 0 (0.0%) |
| 75 Years and older | 5 (100.0%) | 0 (0.0%) |
| Total | 39 (100.0%) | 0 (0.0%) |
Health Insurance Coverage by Citizenship Status in Alfordsville
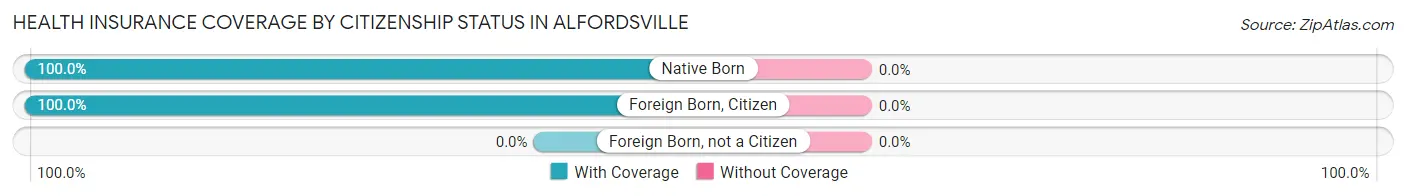
| Citizenship Status | With Coverage | Without Coverage |
| Native Born | 2 (100.0%) | 0 (0.0%) |
| Foreign Born, Citizen | 2 (100.0%) | 0 (0.0%) |
| Foreign Born, not a Citizen | 0 (0.0%) | 0 (0.0%) |
Health Insurance Coverage by Household Income in Alfordsville
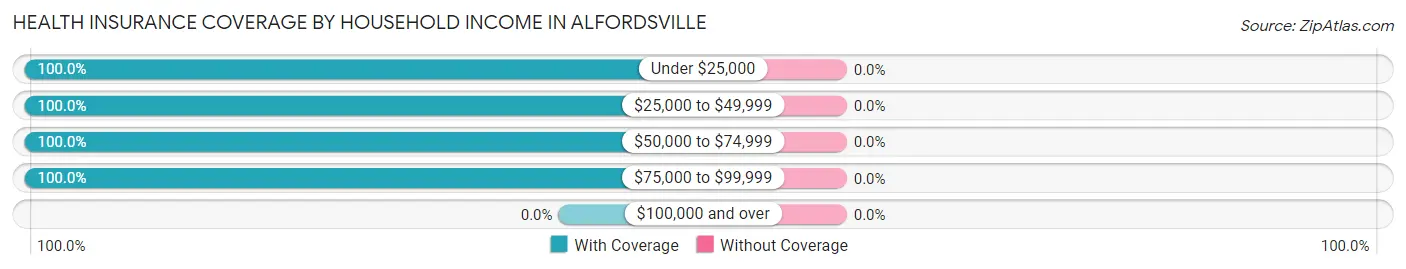
| Household Income | With Coverage | Without Coverage |
| Under $25,000 | 1 (100.0%) | 0 (0.0%) |
| $25,000 to $49,999 | 23 (100.0%) | 0 (0.0%) |
| $50,000 to $74,999 | 10 (100.0%) | 0 (0.0%) |
| $75,000 to $99,999 | 5 (100.0%) | 0 (0.0%) |
| $100,000 and over | 0 (0.0%) | 0 (0.0%) |
Public vs Private Health Insurance Coverage by Age in Alfordsville
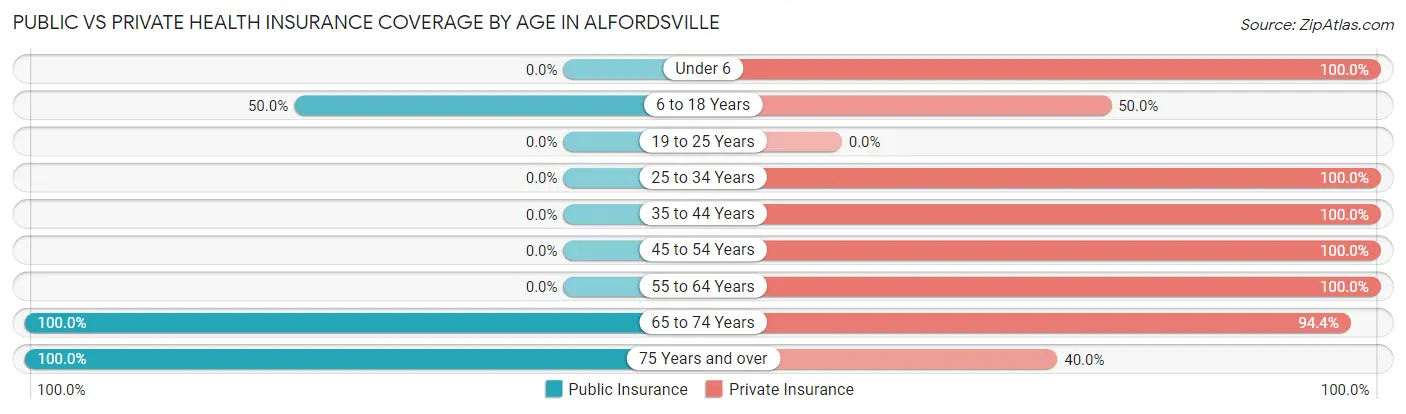
| Age Bracket | Public Insurance | Private Insurance |
| Under 6 | 0 (0.0%) | 2 (100.0%) |
| 6 to 18 Years | 1 (50.0%) | 1 (50.0%) |
| 19 to 25 Years | 0 (0.0%) | 0 (0.0%) |
| 25 to 34 Years | 0 (0.0%) | 2 (100.0%) |
| 35 to 44 Years | 0 (0.0%) | 2 (100.0%) |
| 45 to 54 Years | 0 (0.0%) | 2 (100.0%) |
| 55 to 64 Years | 0 (0.0%) | 6 (100.0%) |
| 65 to 74 Years | 18 (100.0%) | 17 (94.4%) |
| 75 Years and over | 5 (100.0%) | 2 (40.0%) |
| Total | 24 (61.5%) | 34 (87.2%) |
Disability Status by Sex by Age in Alfordsville
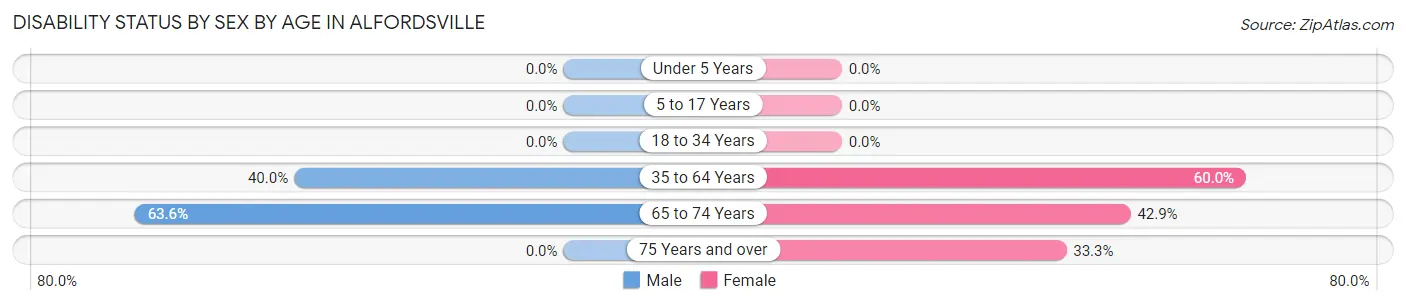
| Age Bracket | Male | Female |
| Under 5 Years | 0 (0.0%) | 0 (0.0%) |
| 5 to 17 Years | 0 (0.0%) | 0 (0.0%) |
| 18 to 34 Years | 0 (0.0%) | 0 (0.0%) |
| 35 to 64 Years | 2 (40.0%) | 3 (60.0%) |
| 65 to 74 Years | 7 (63.6%) | 3 (42.9%) |
| 75 Years and over | 0 (0.0%) | 1 (33.3%) |
Disability Class by Sex by Age in Alfordsville
Disability Class: Hearing Difficulty
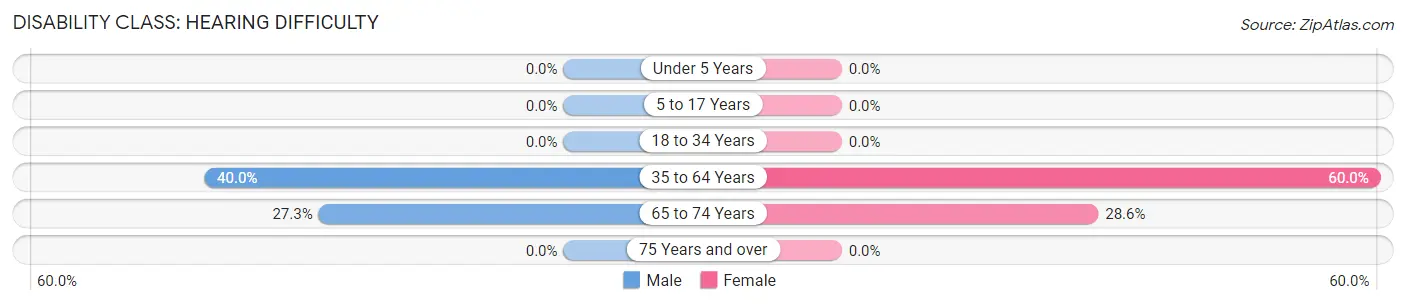
| Age Bracket | Male | Female |
| Under 5 Years | 0 (0.0%) | 0 (0.0%) |
| 5 to 17 Years | 0 (0.0%) | 0 (0.0%) |
| 18 to 34 Years | 0 (0.0%) | 0 (0.0%) |
| 35 to 64 Years | 2 (40.0%) | 3 (60.0%) |
| 65 to 74 Years | 3 (27.3%) | 2 (28.6%) |
| 75 Years and over | 0 (0.0%) | 0 (0.0%) |
Disability Class: Vision Difficulty
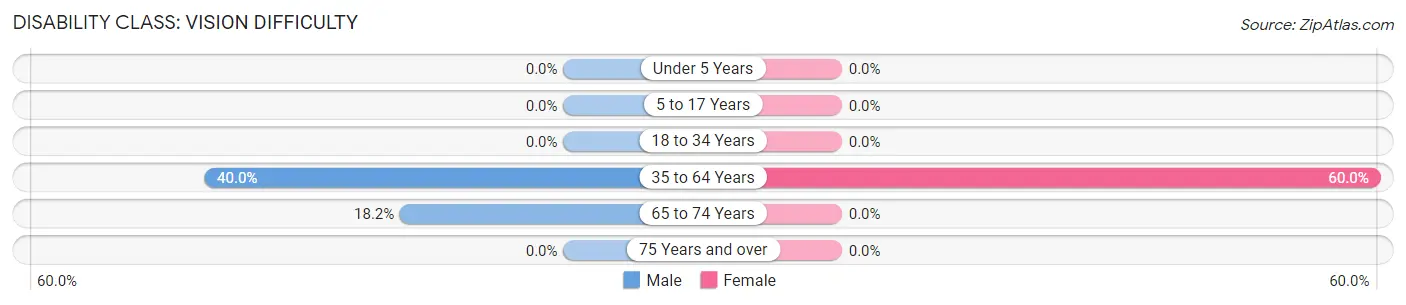
| Age Bracket | Male | Female |
| Under 5 Years | 0 (0.0%) | 0 (0.0%) |
| 5 to 17 Years | 0 (0.0%) | 0 (0.0%) |
| 18 to 34 Years | 0 (0.0%) | 0 (0.0%) |
| 35 to 64 Years | 2 (40.0%) | 3 (60.0%) |
| 65 to 74 Years | 2 (18.2%) | 0 (0.0%) |
| 75 Years and over | 0 (0.0%) | 0 (0.0%) |
Disability Class: Cognitive Difficulty
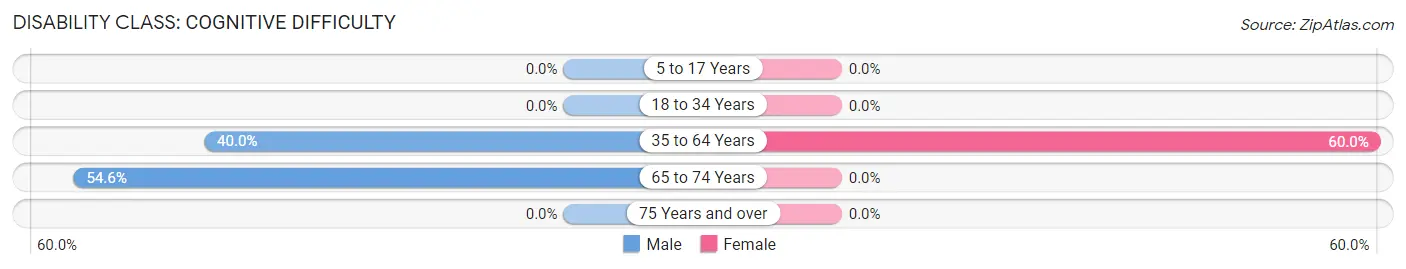
| Age Bracket | Male | Female |
| 5 to 17 Years | 0 (0.0%) | 0 (0.0%) |
| 18 to 34 Years | 0 (0.0%) | 0 (0.0%) |
| 35 to 64 Years | 2 (40.0%) | 3 (60.0%) |
| 65 to 74 Years | 6 (54.5%) | 0 (0.0%) |
| 75 Years and over | 0 (0.0%) | 0 (0.0%) |
Disability Class: Ambulatory Difficulty
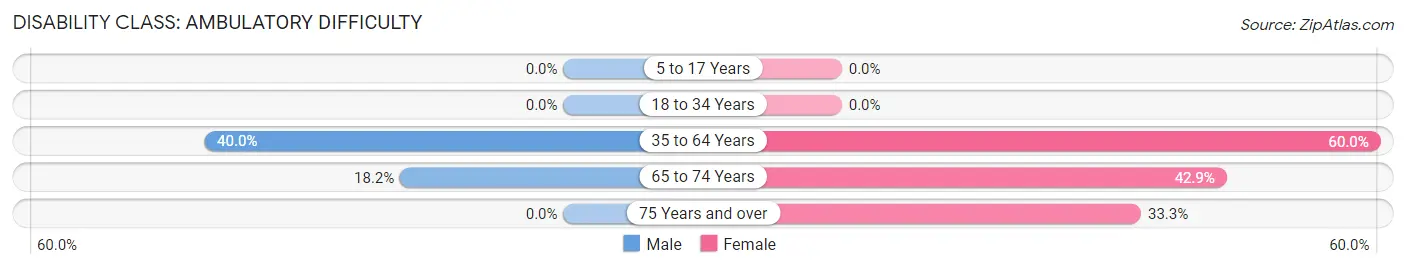
| Age Bracket | Male | Female |
| 5 to 17 Years | 0 (0.0%) | 0 (0.0%) |
| 18 to 34 Years | 0 (0.0%) | 0 (0.0%) |
| 35 to 64 Years | 2 (40.0%) | 3 (60.0%) |
| 65 to 74 Years | 2 (18.2%) | 3 (42.9%) |
| 75 Years and over | 0 (0.0%) | 1 (33.3%) |
Disability Class: Self-Care Difficulty
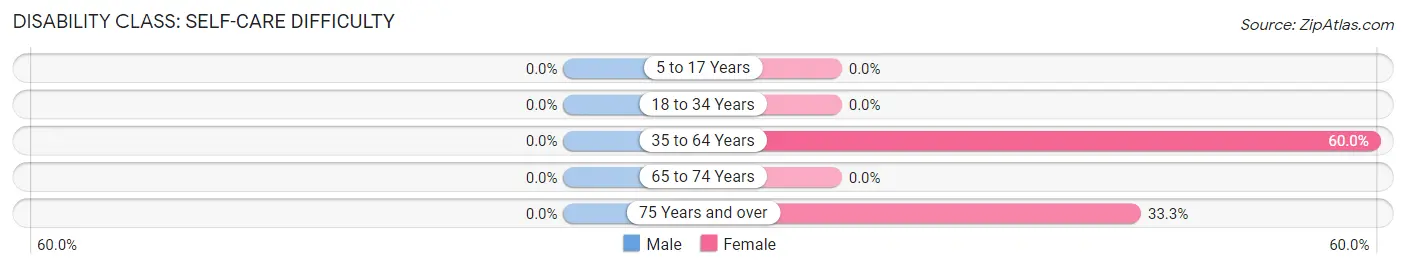
| Age Bracket | Male | Female |
| 5 to 17 Years | 0 (0.0%) | 0 (0.0%) |
| 18 to 34 Years | 0 (0.0%) | 0 (0.0%) |
| 35 to 64 Years | 0 (0.0%) | 3 (60.0%) |
| 65 to 74 Years | 0 (0.0%) | 0 (0.0%) |
| 75 Years and over | 0 (0.0%) | 1 (33.3%) |
Technology Access in Alfordsville
Computing Device Access in Alfordsville
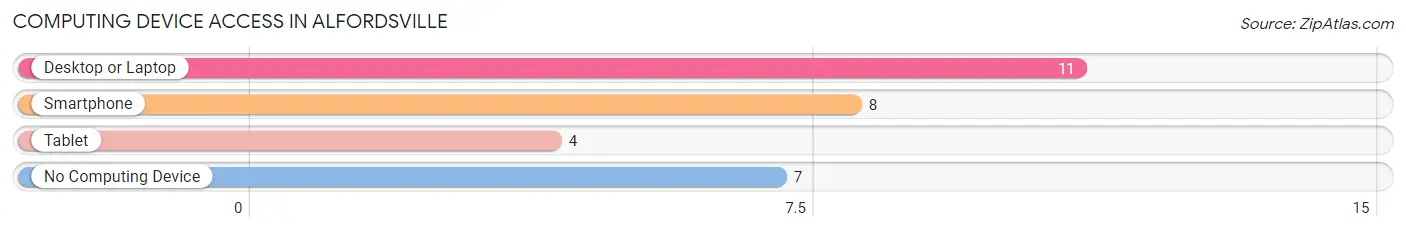
| Device Type | # Households | % Households |
| Desktop or Laptop | 11 | 52.4% |
| Smartphone | 8 | 38.1% |
| Tablet | 4 | 19.1% |
| No Computing Device | 7 | 33.3% |
| Total | 21 | 100.0% |
Internet Access in Alfordsville
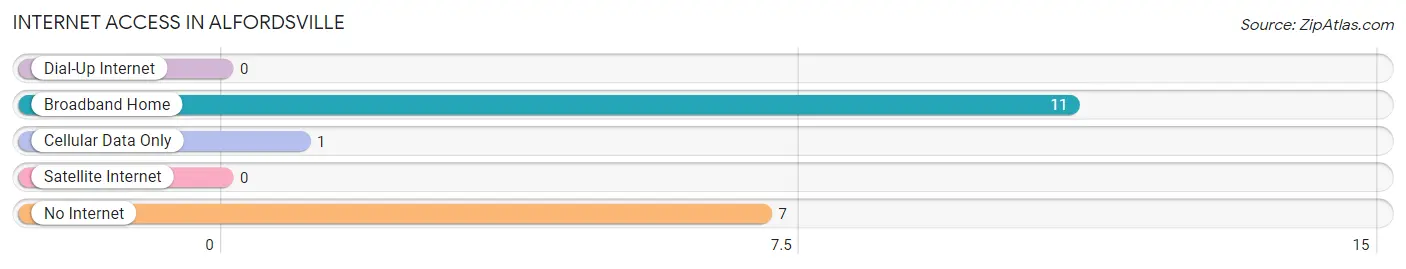
| Internet Type | # Households | % Households |
| Dial-Up Internet | 0 | 0.0% |
| Broadband Home | 11 | 52.4% |
| Cellular Data Only | 1 | 4.8% |
| Satellite Internet | 0 | 0.0% |
| No Internet | 7 | 33.3% |
| Total | 21 | 100.0% |
Alfordsville Summary
Alfordsville is a small town located in Daviess County, Indiana. It is situated in the southwestern part of the state, about 25 miles from the city of Evansville. The town was founded in 1837 and was named after the Alford family, who were among the first settlers in the area. The population of Alfordsville was estimated to be around 500 in 2020.
Geography
Alfordsville is located in the southwestern part of Indiana, in Daviess County. It is situated on the banks of the Patoka River, which flows through the town. The town is surrounded by rolling hills and farmland, and is located about 25 miles from the city of Evansville. The climate in Alfordsville is humid continental, with hot summers and cold winters.
Economy
Alfordsville is a small, rural town with a limited economy. The main industries in the town are agriculture and tourism. The town is home to several small farms, which produce a variety of crops, including corn, soybeans, and wheat. The town also has a few small businesses, including a grocery store, a hardware store, and a few restaurants.
Demographics
As of the 2020 census, the population of Alfordsville was estimated to be around 500. The racial makeup of the town was 97.2% White, 0.8% African American, 0.4% Native American, 0.2% Asian, and 1.4% from other races. The median household income in Alfordsville was $41,250, and the median home value was $90,000.
History
Alfordsville was founded in 1837 by the Alford family, who were among the first settlers in the area. The town was originally known as Alfordville, but the name was changed to Alfordsville in 1845. The town grew slowly over the years, and by the early 1900s, it had become a thriving agricultural community. The town was home to several small businesses, including a grocery store, a hardware store, and a few restaurants.
In the late 20th century, Alfordsville began to decline as many of its residents moved away in search of better economic opportunities. The town's population has remained relatively stable since then, and it continues to be a small, rural community.
Alfordsville is a small town with a rich history and a unique culture. It is a great place to visit and explore, and it offers a variety of activities for visitors to enjoy. From its scenic views to its friendly people, Alfordsville is a great place to call home.
Common Questions
What is Per Capita Income in Alfordsville?
Per Capita income in Alfordsville is $22,695.
What is the Median Family Income in Alfordsville?
Median Family Income in Alfordsville is $44,375.
What is the Median Household income in Alfordsville?
Median Household Income in Alfordsville is $42,917.
What is Inequality or Gini Index in Alfordsville?
Inequality or Gini Index in Alfordsville is 0.19.
What is the Total Population of Alfordsville?
Total Population of Alfordsville is 39.
What is the Total Male Population of Alfordsville?
Total Male Population of Alfordsville is 20.
What is the Total Female Population of Alfordsville?
Total Female Population of Alfordsville is 19.
What is the Ratio of Males per 100 Females in Alfordsville?
There are 105.26 Males per 100 Females in Alfordsville.
What is the Ratio of Females per 100 Males in Alfordsville?
There are 95.00 Females per 100 Males in Alfordsville.
What is the Median Population Age in Alfordsville?
Median Population Age in Alfordsville is 67.2 Years.
What is the Average Family Size in Alfordsville
Average Family Size in Alfordsville is 2.3 People.
What is the Average Household Size in Alfordsville
Average Household Size in Alfordsville is 1.9 People.
How Large is the Labor Force in Alfordsville?
There are 11 People in the Labor Forcein in Alfordsville.
What is the Percentage of People in the Labor Force in Alfordsville?
31.4% of People are in the Labor Force in Alfordsville.