Neylandville, TX Map & Demographics
Neylandville Map
Neylandville Overview
$11,928
PER CAPITA INCOME
$55,595
AVG FAMILY INCOME
$46,250
AVG HOUSEHOLD INCOME
0.16
INEQUALITY / GINI INDEX
207
TOTAL POPULATION
79
MALE POPULATION
128
FEMALE POPULATION
61.72
MALES / 100 FEMALES
162.03
FEMALES / 100 MALES
12.8
MEDIAN AGE
5.3
AVG FAMILY SIZE
4.1
AVG HOUSEHOLD SIZE
56
LABOR FORCE [ PEOPLE ]
57.1%
PERCENT IN LABOR FORCE
Income in Neylandville
Income Overview in Neylandville
Per Capita Income in Neylandville is $11,928, while median incomes of families and households are $55,595 and $46,250 respectively.
| Characteristic | Number | Measure |
| Per Capita Income | 207 | $11,928 |
| Median Family Income | 36 | $55,595 |
| Mean Family Income | 36 | $48,006 |
| Median Household Income | 50 | $46,250 |
| Mean Household Income | 50 | $43,792 |
| Income Deficit | 36 | $0 |
| Wage / Income Gap (%) | 207 | 0.00% |
| Wage / Income Gap ($) | 207 | 100.00¢ per $1 |
| Gini / Inequality Index | 207 | 0.16 |
Earnings by Sex in Neylandville
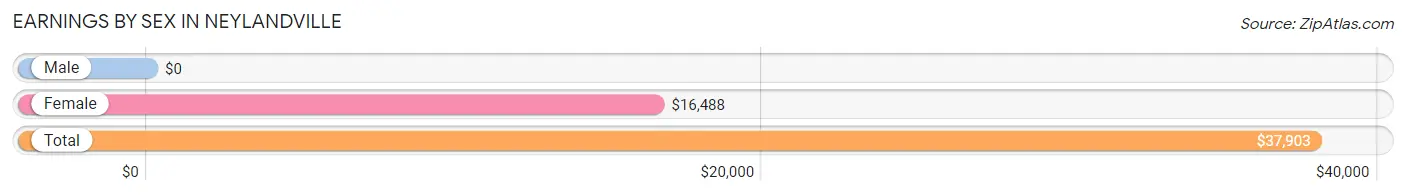
| Sex | Number | Average Earnings |
| Male | 31 (55.4%) | $0 |
| Female | 25 (44.6%) | $16,488 |
| Total | 56 (100.0%) | $37,903 |
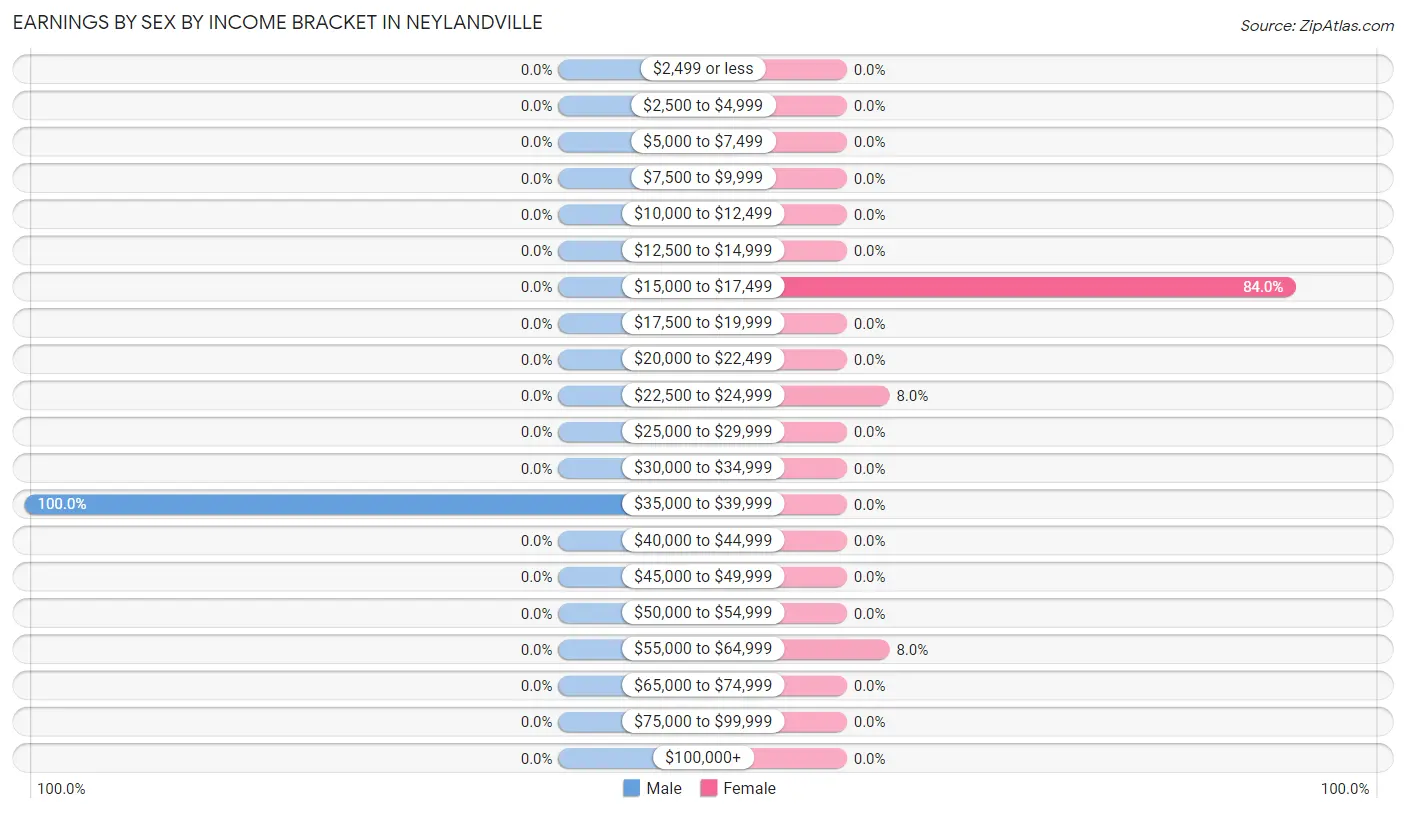
Earnings by Sex by Income Bracket in Neylandville
The most common earnings brackets in Neylandville are $35,000 to $39,999 for men (31 | 100.0%) and $15,000 to $17,499 for women (21 | 84.0%).
| Income | Male | Female |
| $2,499 or less | 0 (0.0%) | 0 (0.0%) |
| $2,500 to $4,999 | 0 (0.0%) | 0 (0.0%) |
| $5,000 to $7,499 | 0 (0.0%) | 0 (0.0%) |
| $7,500 to $9,999 | 0 (0.0%) | 0 (0.0%) |
| $10,000 to $12,499 | 0 (0.0%) | 0 (0.0%) |
| $12,500 to $14,999 | 0 (0.0%) | 0 (0.0%) |
| $15,000 to $17,499 | 0 (0.0%) | 21 (84.0%) |
| $17,500 to $19,999 | 0 (0.0%) | 0 (0.0%) |
| $20,000 to $22,499 | 0 (0.0%) | 0 (0.0%) |
| $22,500 to $24,999 | 0 (0.0%) | 2 (8.0%) |
| $25,000 to $29,999 | 0 (0.0%) | 0 (0.0%) |
| $30,000 to $34,999 | 0 (0.0%) | 0 (0.0%) |
| $35,000 to $39,999 | 31 (100.0%) | 0 (0.0%) |
| $40,000 to $44,999 | 0 (0.0%) | 0 (0.0%) |
| $45,000 to $49,999 | 0 (0.0%) | 0 (0.0%) |
| $50,000 to $54,999 | 0 (0.0%) | 0 (0.0%) |
| $55,000 to $64,999 | 0 (0.0%) | 2 (8.0%) |
| $65,000 to $74,999 | 0 (0.0%) | 0 (0.0%) |
| $75,000 to $99,999 | 0 (0.0%) | 0 (0.0%) |
| $100,000+ | 0 (0.0%) | 0 (0.0%) |
| Total | 31 (100.0%) | 25 (100.0%) |
Earnings by Sex by Educational Attainment in Neylandville
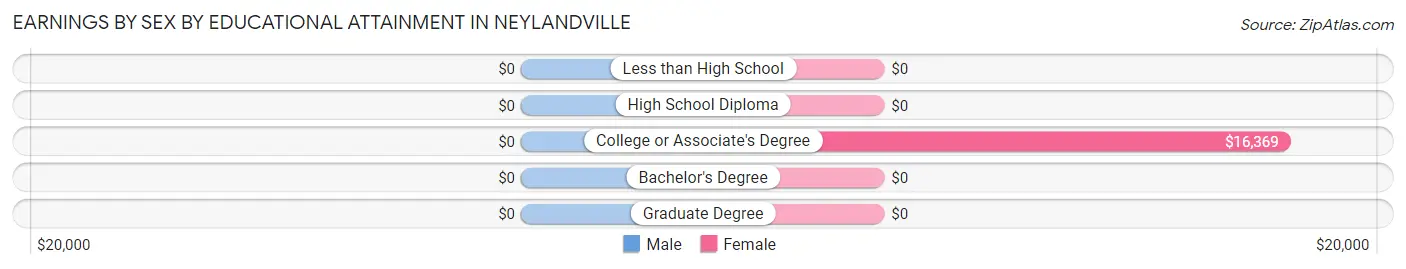
| Educational Attainment | Male Income | Female Income |
| Less than High School | - | - |
| High School Diploma | - | - |
| College or Associate's Degree | - | - |
| Bachelor's Degree | - | - |
| Graduate Degree | - | - |
| Total | - | - |
Family Income in Neylandville
Family Income Brackets in Neylandville
According to the Neylandville family income data, there are 23 families falling into the $50,000 to $74,999 income range, which is the most common income bracket and makes up 63.9% of all families.
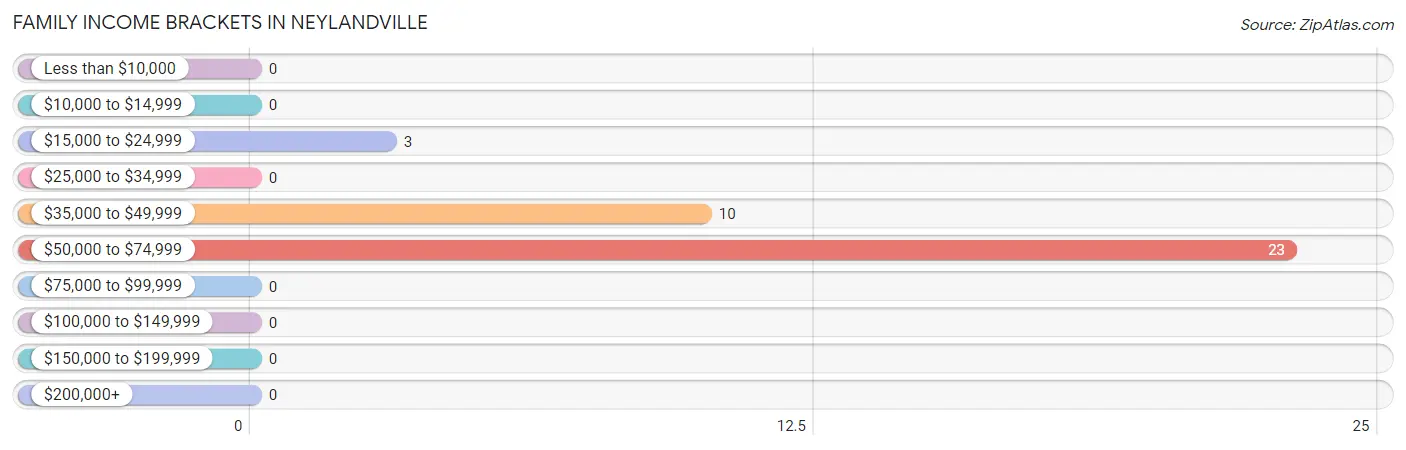
| Income Bracket | # Families | % Families |
| Less than $10,000 | 0 | 0.0% |
| $10,000 to $14,999 | 0 | 0.0% |
| $15,000 to $24,999 | 3 | 8.3% |
| $25,000 to $34,999 | 0 | 0.0% |
| $35,000 to $49,999 | 10 | 27.8% |
| $50,000 to $74,999 | 23 | 63.9% |
| $75,000 to $99,999 | 0 | 0.0% |
| $100,000 to $149,999 | 0 | 0.0% |
| $150,000 to $199,999 | 0 | 0.0% |
| $200,000+ | 0 | 0.0% |
Family Income by Famaliy Size in Neylandville
2-person families (14 | 38.9%) account for the highest median family income in Neylandville with $36,250 per family, while 2-person families (14 | 38.9%) have the highest median income of $18,125 per family member.
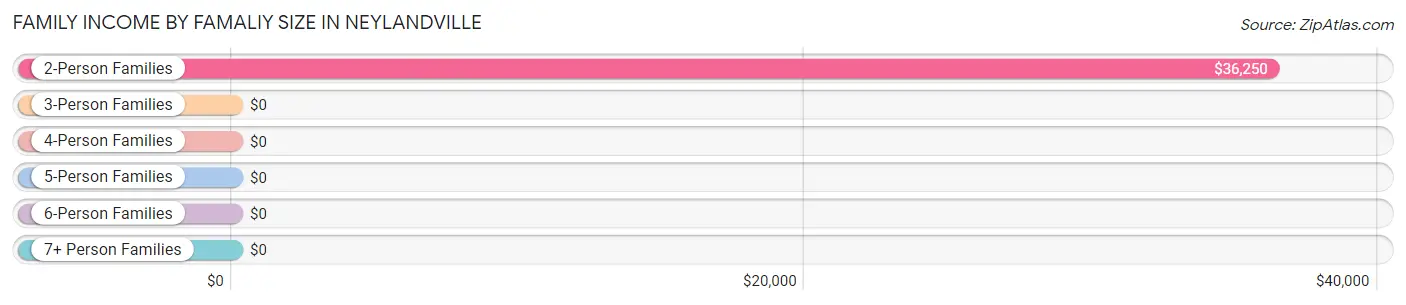
| Income Bracket | # Families | Median Income |
| 2-Person Families | 14 (38.9%) | $36,250 |
| 3-Person Families | 0 (0.0%) | $0 |
| 4-Person Families | 0 (0.0%) | $0 |
| 5-Person Families | 2 (5.6%) | $0 |
| 6-Person Families | 20 (55.6%) | $0 |
| 7+ Person Families | 0 (0.0%) | $0 |
| Total | 36 (100.0%) | $55,595 |
Family Income by Number of Earners in Neylandville
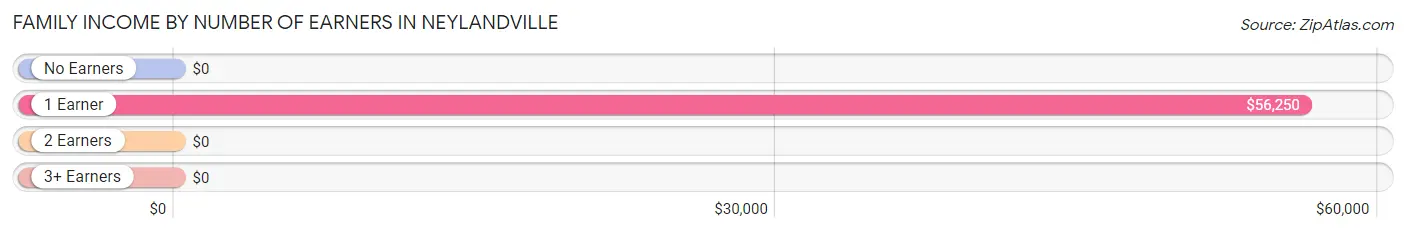
| Number of Earners | # Families | Median Income |
| No Earners | 11 (30.6%) | $0 |
| 1 Earner | 5 (13.9%) | $56,250 |
| 2 Earners | 20 (55.6%) | $0 |
| 3+ Earners | 0 (0.0%) | $0 |
| Total | 36 (100.0%) | $55,595 |
Household Income in Neylandville
Household Income Brackets in Neylandville
With 25 households falling in the category, the $50,000 to $74,999 income range is the most frequent in Neylandville, accounting for 50.0% of all households.
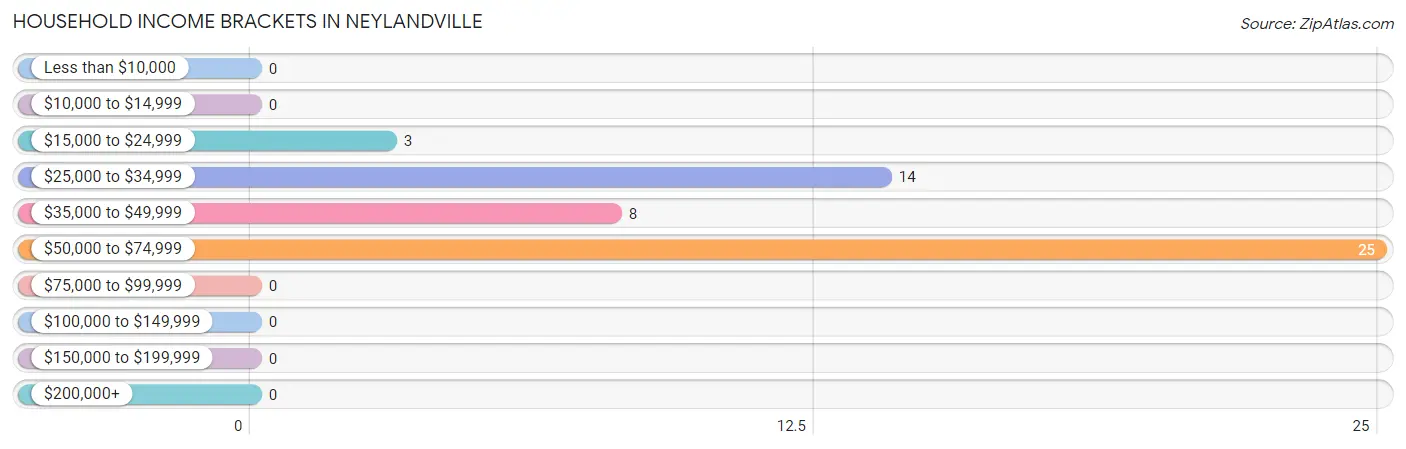
| Income Bracket | # Households | % Households |
| Less than $10,000 | 0 | 0.0% |
| $10,000 to $14,999 | 0 | 0.0% |
| $15,000 to $24,999 | 3 | 6.0% |
| $25,000 to $34,999 | 14 | 28.0% |
| $35,000 to $49,999 | 8 | 16.0% |
| $50,000 to $74,999 | 25 | 50.0% |
| $75,000 to $99,999 | 0 | 0.0% |
| $100,000 to $149,999 | 0 | 0.0% |
| $150,000 to $199,999 | 0 | 0.0% |
| $200,000+ | 0 | 0.0% |
Household Income by Householder Age in Neylandville
The median household income in Neylandville is $46,250, with the highest median household income of $30,625 found in the 65+ years age bracket for the primary householder. A total of 25 households (50.0%) fall into this category.
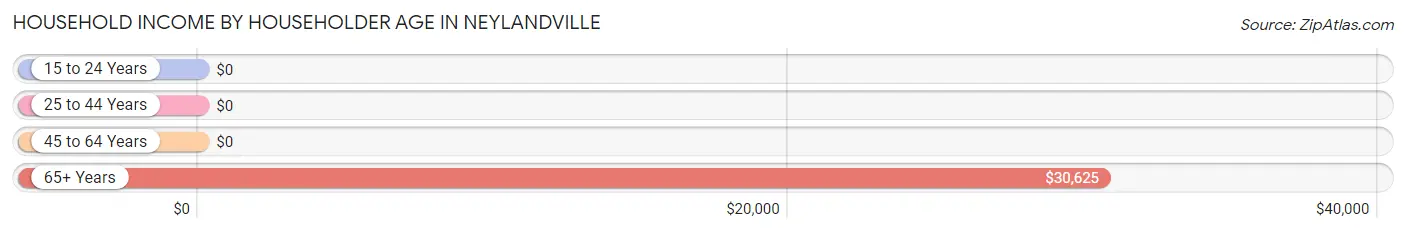
| Income Bracket | # Households | Median Income |
| 15 to 24 Years | 0 (0.0%) | $0 |
| 25 to 44 Years | 22 (44.0%) | $0 |
| 45 to 64 Years | 3 (6.0%) | $0 |
| 65+ Years | 25 (50.0%) | $30,625 |
| Total | 50 (100.0%) | $46,250 |
Poverty in Neylandville
Income Below Poverty by Sex and Age in Neylandville
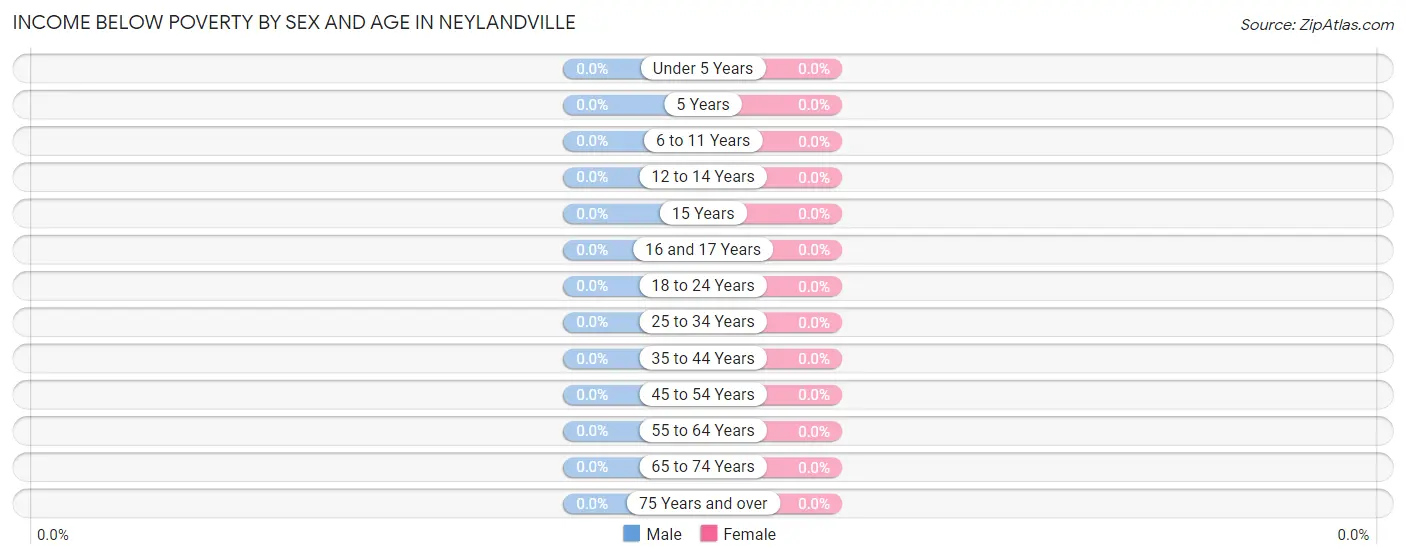
| Age Bracket | Male | Female |
| Under 5 Years | 0 (0.0%) | 0 (0.0%) |
| 5 Years | 0 (0.0%) | 0 (0.0%) |
| 6 to 11 Years | 0 (0.0%) | 0 (0.0%) |
| 12 to 14 Years | 0 (0.0%) | 0 (0.0%) |
| 15 Years | 0 (0.0%) | 0 (0.0%) |
| 16 and 17 Years | 0 (0.0%) | 0 (0.0%) |
| 18 to 24 Years | 0 (0.0%) | 0 (0.0%) |
| 25 to 34 Years | 0 (0.0%) | 0 (0.0%) |
| 35 to 44 Years | 0 (0.0%) | 0 (0.0%) |
| 45 to 54 Years | 0 (0.0%) | 0 (0.0%) |
| 55 to 64 Years | 0 (0.0%) | 0 (0.0%) |
| 65 to 74 Years | 0 (0.0%) | 0 (0.0%) |
| 75 Years and over | 0 (0.0%) | 0 (0.0%) |
| Total | 0 (0.0%) | 0 (0.0%) |
Income Above Poverty by Sex and Age in Neylandville
According to the poverty statistics in Neylandville, males aged 6 to 11 years and females aged under 5 years are the age groups that are most secure financially, with 100.0% of males and 100.0% of females in these age groups living above the poverty line.
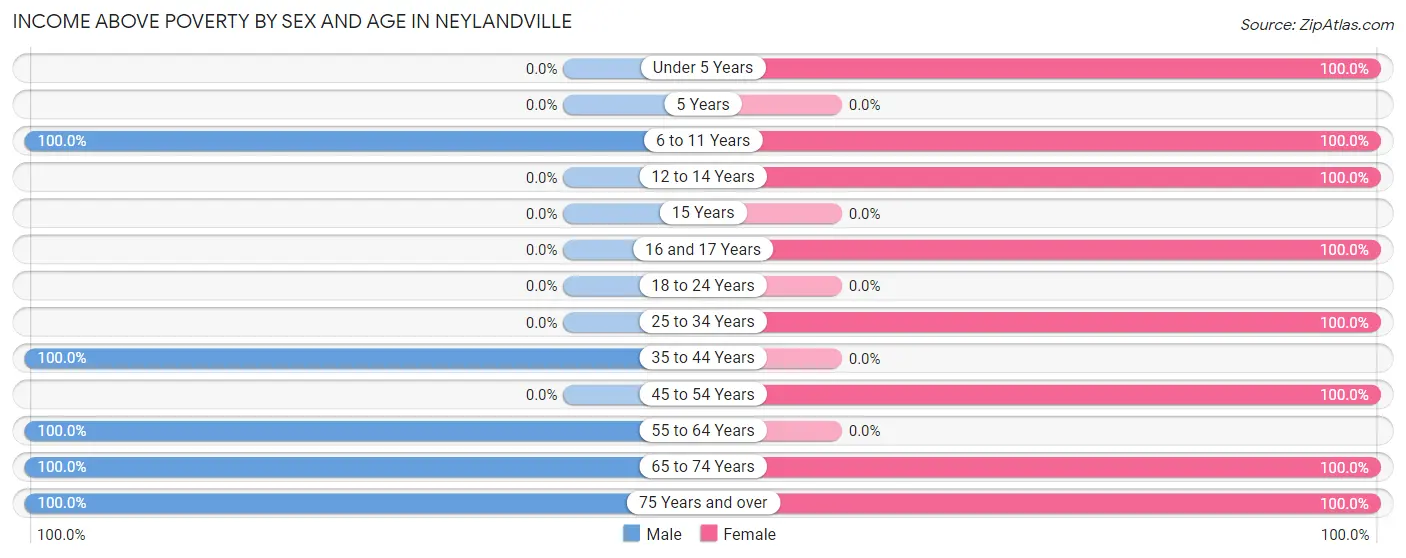
| Age Bracket | Male | Female |
| Under 5 Years | 0 (0.0%) | 41 (100.0%) |
| 5 Years | 0 (0.0%) | 0 (0.0%) |
| 6 to 11 Years | 26 (100.0%) | 6 (100.0%) |
| 12 to 14 Years | 0 (0.0%) | 36 (100.0%) |
| 15 Years | 0 (0.0%) | 0 (0.0%) |
| 16 and 17 Years | 0 (0.0%) | 3 (100.0%) |
| 18 to 24 Years | 0 (0.0%) | 0 (0.0%) |
| 25 to 34 Years | 0 (0.0%) | 24 (100.0%) |
| 35 to 44 Years | 31 (100.0%) | 0 (0.0%) |
| 45 to 54 Years | 0 (0.0%) | 5 (100.0%) |
| 55 to 64 Years | 5 (100.0%) | 0 (0.0%) |
| 65 to 74 Years | 1 (100.0%) | 11 (100.0%) |
| 75 Years and over | 16 (100.0%) | 2 (100.0%) |
| Total | 79 (100.0%) | 128 (100.0%) |
Income Below Poverty Among Married-Couple Families in Neylandville
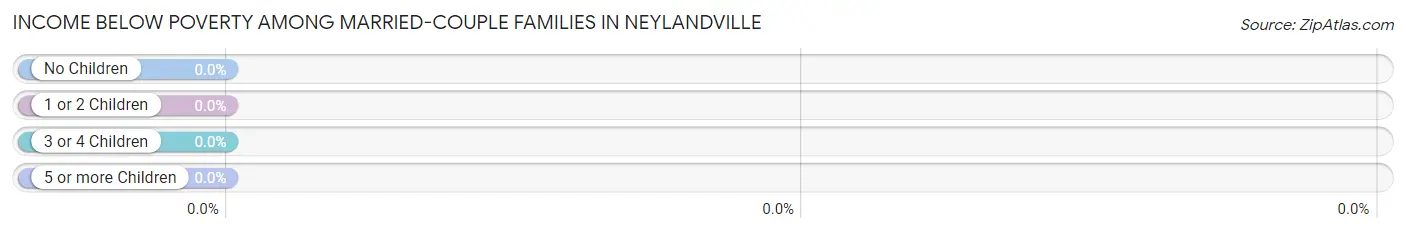
| Children | Above Poverty | Below Poverty |
| No Children | 9 (100.0%) | 0 (0.0%) |
| 1 or 2 Children | 0 (0.0%) | 0 (0.0%) |
| 3 or 4 Children | 20 (100.0%) | 0 (0.0%) |
| 5 or more Children | 0 (0.0%) | 0 (0.0%) |
| Total | 29 (100.0%) | 0 (0.0%) |
Income Below Poverty Among Single-Parent Households in Neylandville
| Children | Single Father | Single Mother |
| No Children | 0 (0.0%) | 0 (0.0%) |
| 1 or 2 Children | 0 (0.0%) | 0 (0.0%) |
| 3 or 4 Children | 0 (0.0%) | 0 (0.0%) |
| 5 or more Children | 0 (0.0%) | 0 (0.0%) |
| Total | 0 (0.0%) | 0 (0.0%) |
Income Below Poverty Among Married-Couple vs Single-Parent Households in Neylandville
| Children | Married-Couple Families | Single-Parent Households |
| No Children | 0 (0.0%) | 0 (0.0%) |
| 1 or 2 Children | 0 (0.0%) | 0 (0.0%) |
| 3 or 4 Children | 0 (0.0%) | 0 (0.0%) |
| 5 or more Children | 0 (0.0%) | 0 (0.0%) |
| Total | 0 (0.0%) | 0 (0.0%) |
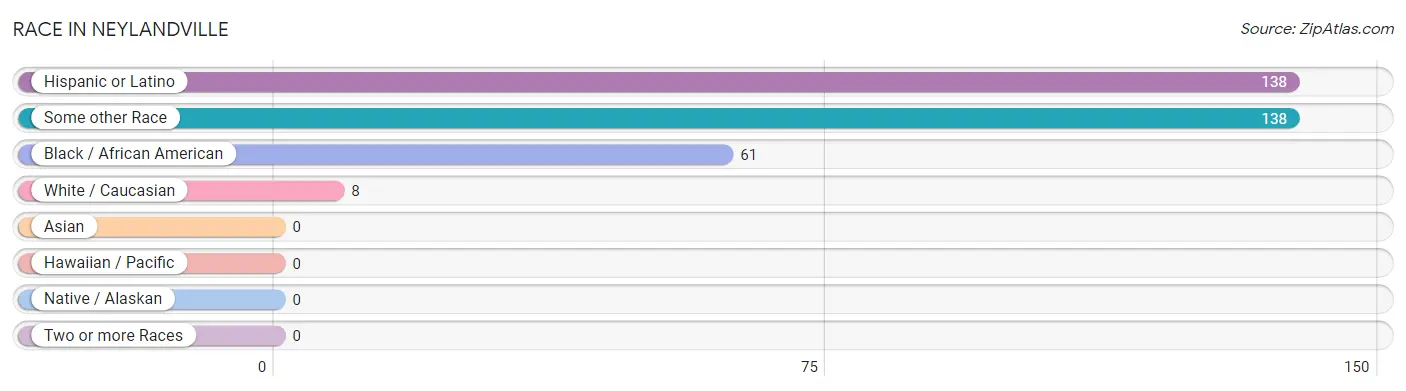
Race in Neylandville
The most populous races in Neylandville are Hispanic or Latino (138 | 66.7%), Some other Race (138 | 66.7%), and Black / African American (61 | 29.5%).
| Race | # Population | % Population |
| Asian | 0 | 0.0% |
| Black / African American | 61 | 29.5% |
| Hawaiian / Pacific | 0 | 0.0% |
| Hispanic or Latino | 138 | 66.7% |
| Native / Alaskan | 0 | 0.0% |
| White / Caucasian | 8 | 3.9% |
| Two or more Races | 0 | 0.0% |
| Some other Race | 138 | 66.7% |
| Total | 207 | 100.0% |
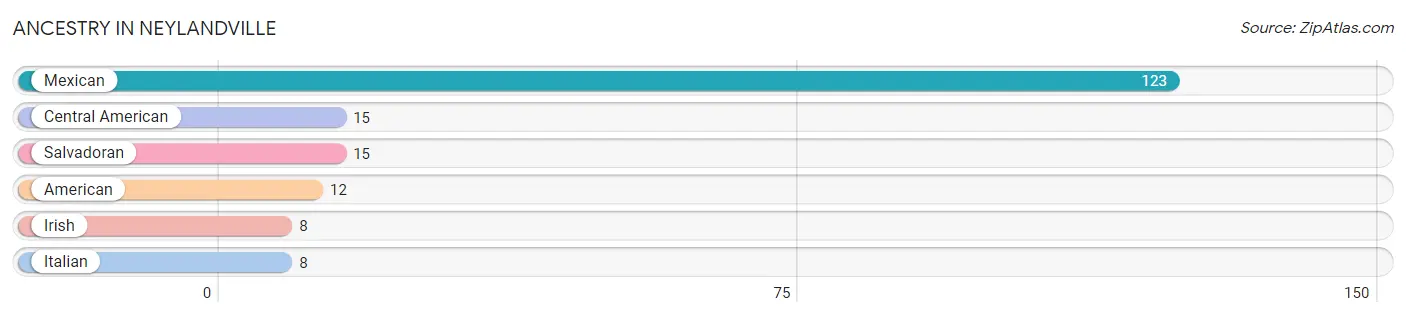
Ancestry in Neylandville
The most populous ancestries reported in Neylandville are Mexican (123 | 59.4%), Central American (15 | 7.2%), Salvadoran (15 | 7.2%), American (12 | 5.8%), and Irish (8 | 3.9%), together accounting for 83.6% of all Neylandville residents.
| Ancestry | # Population | % Population |
| American | 12 | 5.8% |
| Central American | 15 | 7.2% |
| Irish | 8 | 3.9% |
| Italian | 8 | 3.9% |
| Mexican | 123 | 59.4% |
| Salvadoran | 15 | 7.2% | View All 6 Rows |
Immigrants in Neylandville
The most numerous immigrant groups reported in Neylandville came from Central America (15 | 7.2%), El Salvador (15 | 7.2%), and Latin America (15 | 7.2%), together accounting for 21.7% of all Neylandville residents.
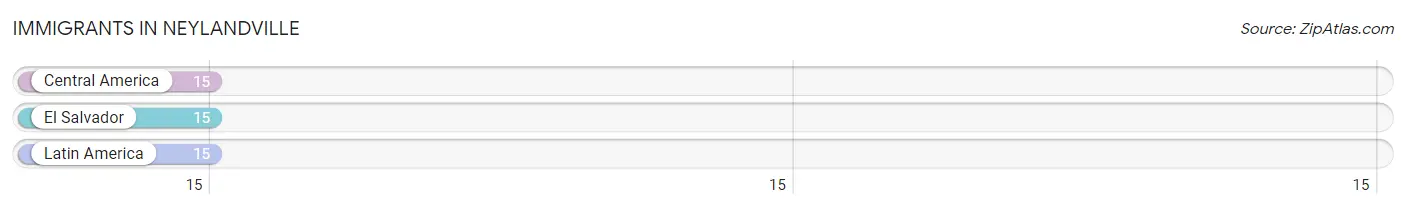
| Immigration Origin | # Population | % Population |
| Central America | 15 | 7.2% |
| El Salvador | 15 | 7.2% |
| Latin America | 15 | 7.2% | View All 3 Rows |
Sex and Age in Neylandville
Sex and Age in Neylandville
The most populous age groups in Neylandville are 35 to 39 Years (29 | 36.7%) for men and 10 to 14 Years (42 | 32.8%) for women.
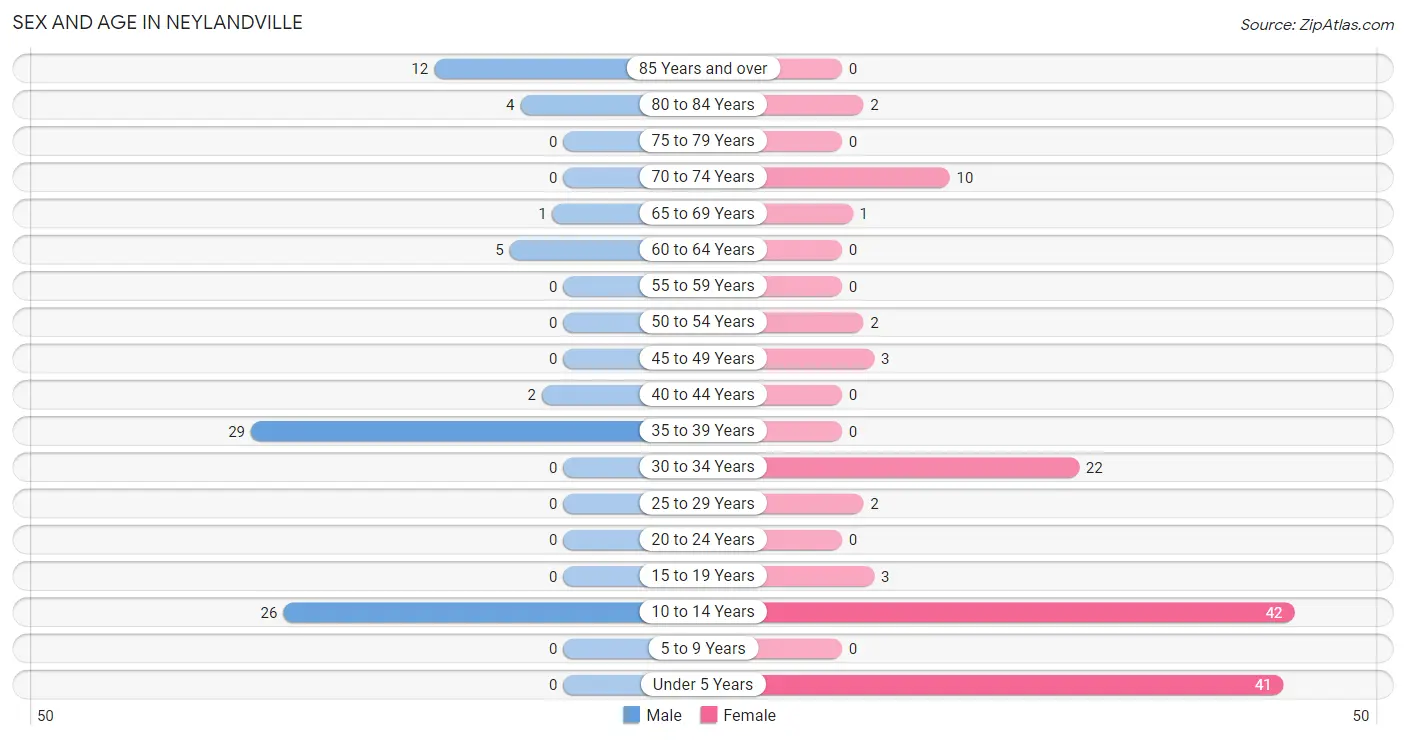
| Age Bracket | Male | Female |
| Under 5 Years | 0 (0.0%) | 41 (32.0%) |
| 5 to 9 Years | 0 (0.0%) | 0 (0.0%) |
| 10 to 14 Years | 26 (32.9%) | 42 (32.8%) |
| 15 to 19 Years | 0 (0.0%) | 3 (2.3%) |
| 20 to 24 Years | 0 (0.0%) | 0 (0.0%) |
| 25 to 29 Years | 0 (0.0%) | 2 (1.6%) |
| 30 to 34 Years | 0 (0.0%) | 22 (17.2%) |
| 35 to 39 Years | 29 (36.7%) | 0 (0.0%) |
| 40 to 44 Years | 2 (2.5%) | 0 (0.0%) |
| 45 to 49 Years | 0 (0.0%) | 3 (2.3%) |
| 50 to 54 Years | 0 (0.0%) | 2 (1.6%) |
| 55 to 59 Years | 0 (0.0%) | 0 (0.0%) |
| 60 to 64 Years | 5 (6.3%) | 0 (0.0%) |
| 65 to 69 Years | 1 (1.3%) | 1 (0.8%) |
| 70 to 74 Years | 0 (0.0%) | 10 (7.8%) |
| 75 to 79 Years | 0 (0.0%) | 0 (0.0%) |
| 80 to 84 Years | 4 (5.1%) | 2 (1.6%) |
| 85 Years and over | 12 (15.2%) | 0 (0.0%) |
| Total | 79 (100.0%) | 128 (100.0%) |
Families and Households in Neylandville
Median Family Size in Neylandville
The median family size in Neylandville is 5.31 persons per family, with single male/father families (2 | 5.6%) accounting for the largest median family size of 6.5 persons per family. On the other hand, single female/mother families (5 | 13.9%) represent the smallest median family size with 2.40 persons per family.
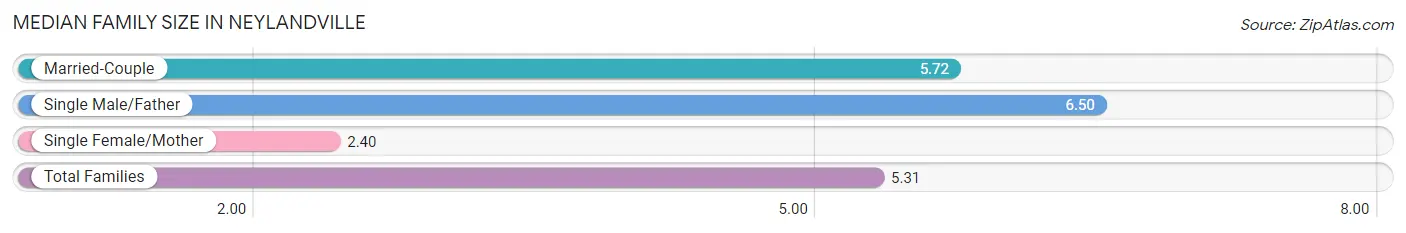
| Family Type | # Families | Family Size |
| Married-Couple | 29 (80.6%) | 5.72 |
| Single Male/Father | 2 (5.6%) | 6.50 |
| Single Female/Mother | 5 (13.9%) | 2.40 |
| Total Families | 36 (100.0%) | 5.31 |
Median Household Size in Neylandville
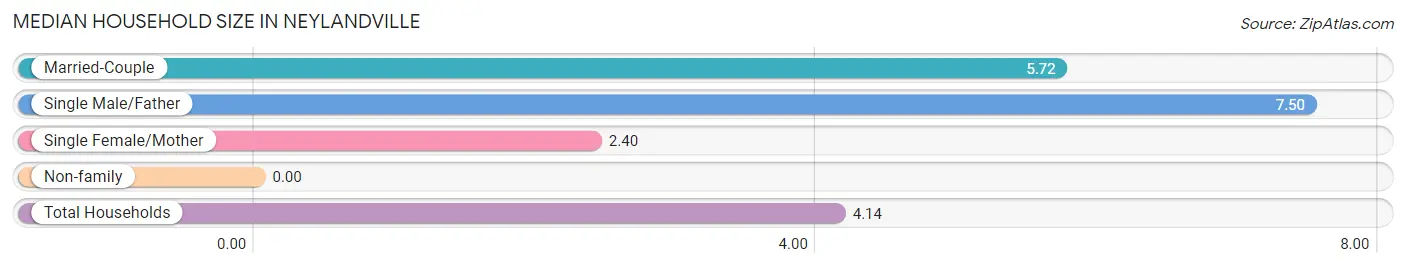
| Household Type | # Households | Household Size |
| Married-Couple | 29 (58.0%) | 5.72 |
| Single Male/Father | 2 (4.0%) | 7.50 |
| Single Female/Mother | 5 (10.0%) | 2.40 |
| Non-family | 14 (28.0%) | - |
| Total Households | 50 (100.0%) | 4.14 |
Household Size by Marriage Status in Neylandville
Out of a total of 50 households in Neylandville, 36 (72.0%) are family households, while 14 (28.0%) are nonfamily households. The most numerous type of family households are 6-person households, comprising 22, and the most common type of nonfamily households are 1-person households, comprising 14.
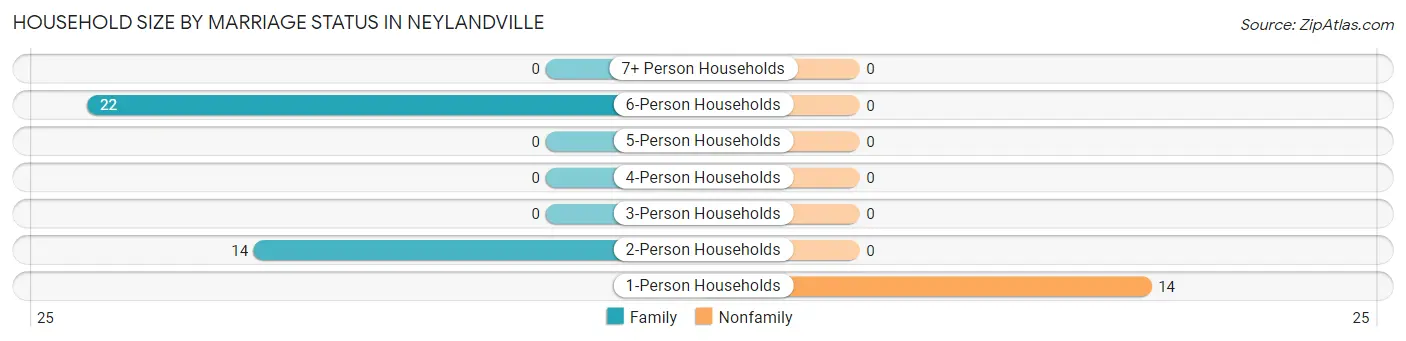
| Household Size | Family Households | Nonfamily Households |
| 1-Person Households | - | 14 (28.0%) |
| 2-Person Households | 14 (28.0%) | 0 (0.0%) |
| 3-Person Households | 0 (0.0%) | 0 (0.0%) |
| 4-Person Households | 0 (0.0%) | 0 (0.0%) |
| 5-Person Households | 0 (0.0%) | 0 (0.0%) |
| 6-Person Households | 22 (44.0%) | 0 (0.0%) |
| 7+ Person Households | 0 (0.0%) | 0 (0.0%) |
| Total | 36 (72.0%) | 14 (28.0%) |
Female Fertility in Neylandville
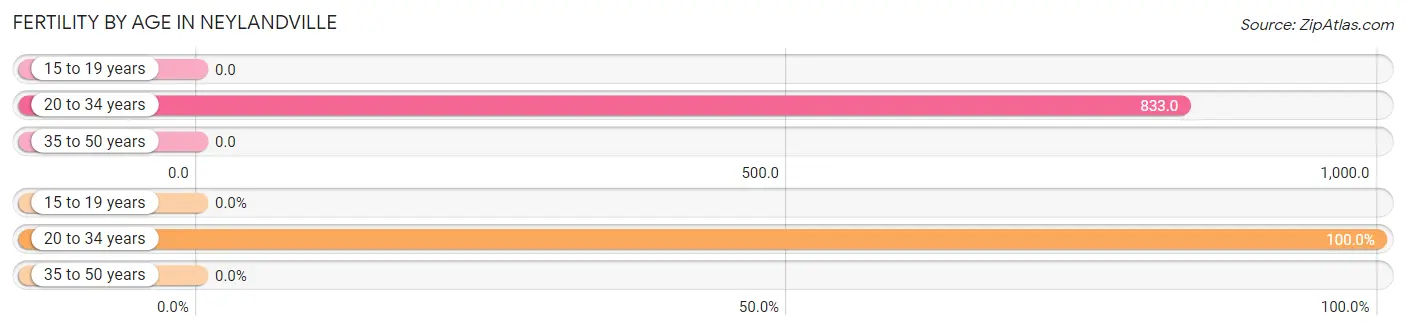
Fertility by Age in Neylandville
Average fertility rate in Neylandville is 667.0 births per 1,000 women. Women in the age bracket of 20 to 34 years have the highest fertility rate with 833.0 births per 1,000 women. Women in the age bracket of 20 to 34 years acount for 100.0% of all women with births.
| Age Bracket | Women with Births | Births / 1,000 Women |
| 15 to 19 years | 0 (0.0%) | 0.0 |
| 20 to 34 years | 20 (100.0%) | 833.0 |
| 35 to 50 years | 0 (0.0%) | 0.0 |
| Total | 20 (100.0%) | 667.0 |
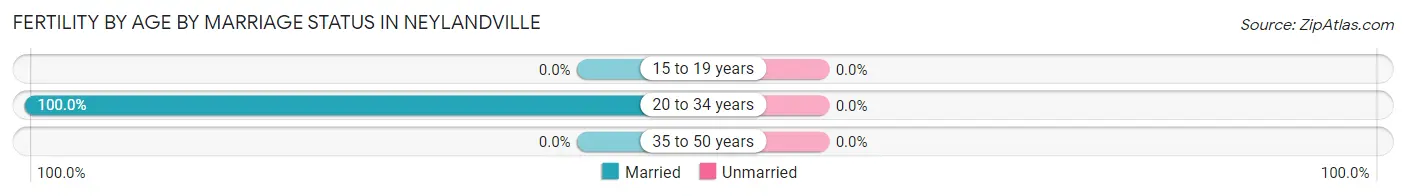
Fertility by Age by Marriage Status in Neylandville
| Age Bracket | Married | Unmarried |
| 15 to 19 years | 0 (0.0%) | 0 (0.0%) |
| 20 to 34 years | 20 (100.0%) | 0 (0.0%) |
| 35 to 50 years | 0 (0.0%) | 0 (0.0%) |
| Total | 20 (100.0%) | 0 (0.0%) |
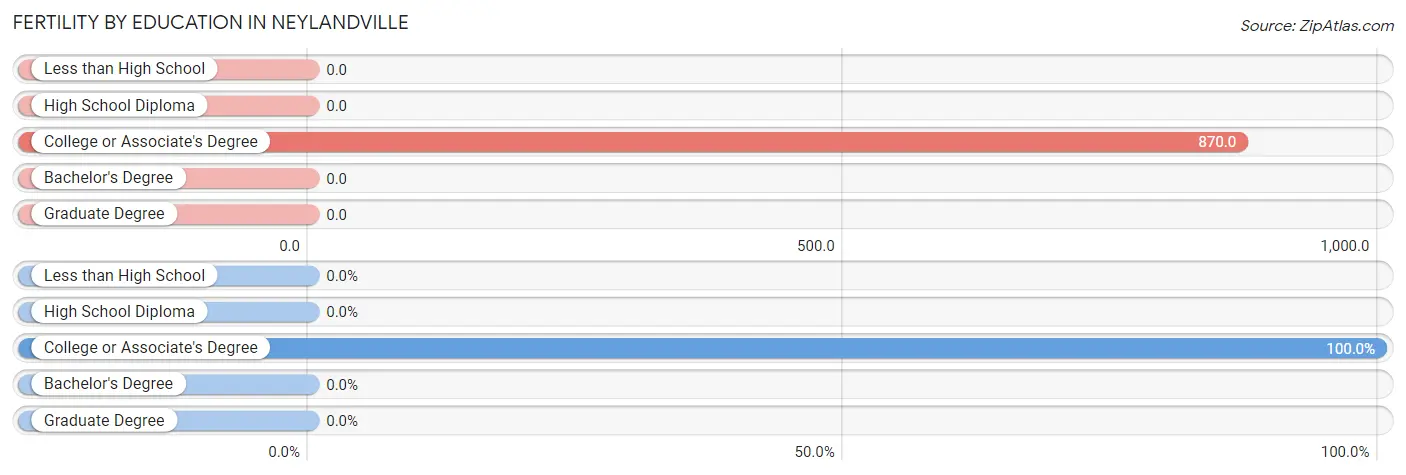
Fertility by Education in Neylandville
| Educational Attainment | Women with Births | Births / 1,000 Women |
| Less than High School | 0 (0.0%) | 0.0 |
| High School Diploma | 0 (0.0%) | 0.0 |
| College or Associate's Degree | 20 (100.0%) | 870.0 |
| Bachelor's Degree | 0 (0.0%) | 0.0 |
| Graduate Degree | 0 (0.0%) | 0.0 |
| Total | 20 (100.0%) | 667.0 |
Fertility by Education by Marriage Status in Neylandville
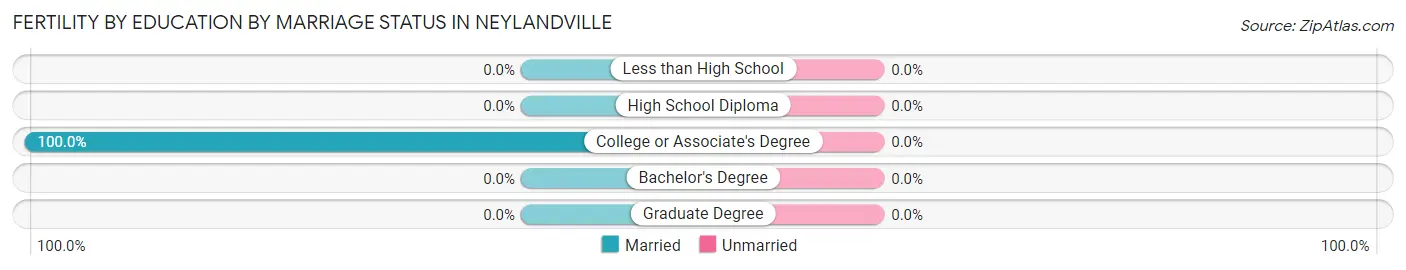
| Educational Attainment | Married | Unmarried |
| Less than High School | 0 (0.0%) | 0 (0.0%) |
| High School Diploma | 0 (0.0%) | 0 (0.0%) |
| College or Associate's Degree | 20 (100.0%) | 0 (0.0%) |
| Bachelor's Degree | 0 (0.0%) | 0 (0.0%) |
| Graduate Degree | 0 (0.0%) | 0 (0.0%) |
| Total | 20 (100.0%) | 0 (0.0%) |
Employment Characteristics in Neylandville
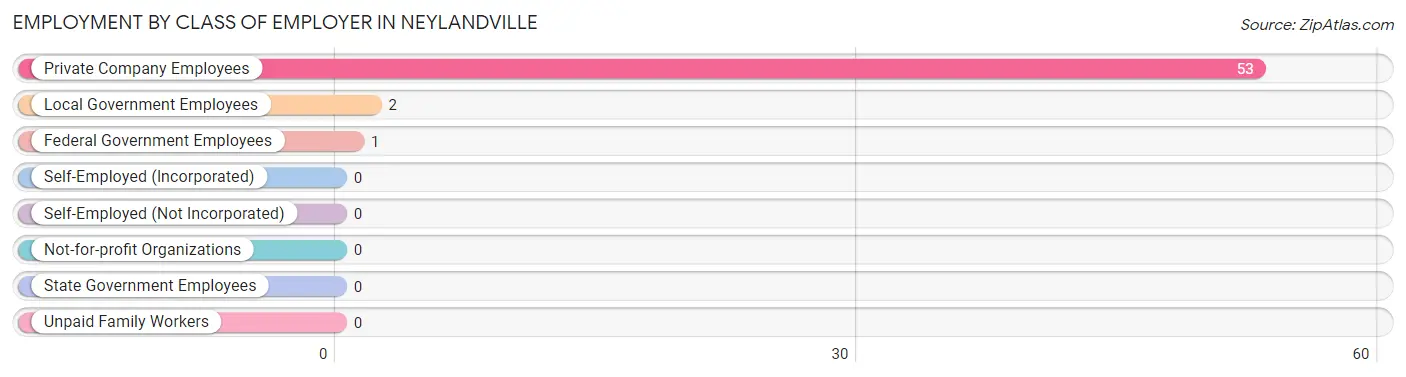
Employment by Class of Employer in Neylandville
Among the 56 employed individuals in Neylandville, private company employees (53 | 94.6%), local government employees (2 | 3.6%), and federal government employees (1 | 1.8%) make up the most common classes of employment.
| Employer Class | # Employees | % Employees |
| Private Company Employees | 53 | 94.6% |
| Self-Employed (Incorporated) | 0 | 0.0% |
| Self-Employed (Not Incorporated) | 0 | 0.0% |
| Not-for-profit Organizations | 0 | 0.0% |
| Local Government Employees | 2 | 3.6% |
| State Government Employees | 0 | 0.0% |
| Federal Government Employees | 1 | 1.8% |
| Unpaid Family Workers | 0 | 0.0% |
| Total | 56 | 100.0% |
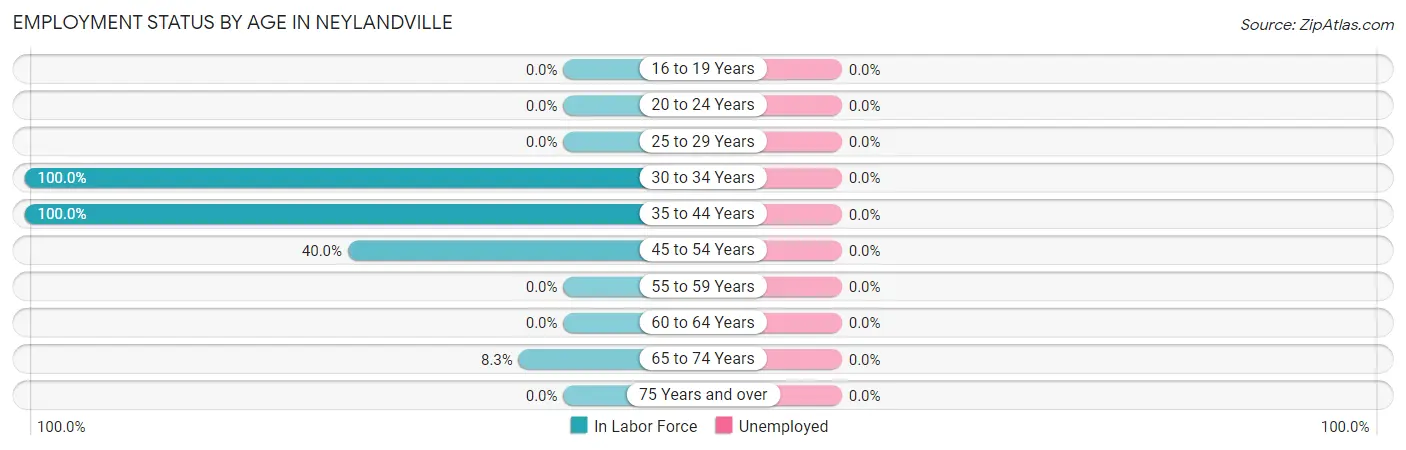
Employment Status by Age in Neylandville
| Age Bracket | In Labor Force | Unemployed |
| 16 to 19 Years | 0 (0.0%) | 0 (0.0%) |
| 20 to 24 Years | 0 (0.0%) | 0 (0.0%) |
| 25 to 29 Years | 0 (0.0%) | 0 (0.0%) |
| 30 to 34 Years | 22 (100.0%) | 0 (0.0%) |
| 35 to 44 Years | 31 (100.0%) | 0 (0.0%) |
| 45 to 54 Years | 2 (40.0%) | 0 (0.0%) |
| 55 to 59 Years | 0 (0.0%) | 0 (0.0%) |
| 60 to 64 Years | 0 (0.0%) | 0 (0.0%) |
| 65 to 74 Years | 1 (8.3%) | 0 (0.0%) |
| 75 Years and over | 0 (0.0%) | 0 (0.0%) |
| Total | 56 (57.1%) | 0 (0.0%) |
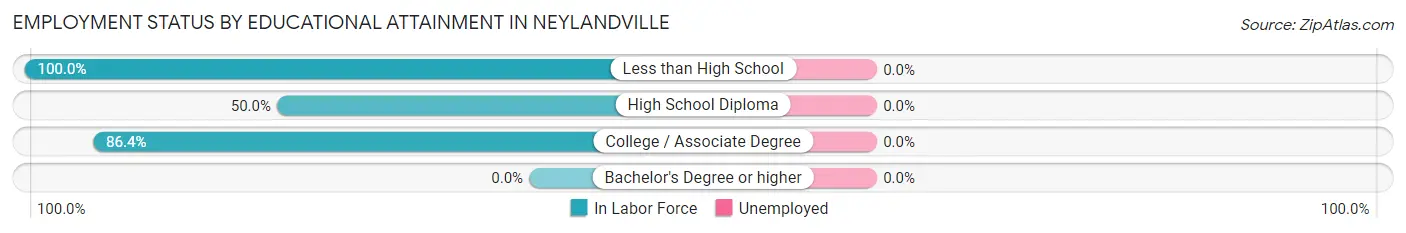
Employment Status by Educational Attainment in Neylandville
| Educational Attainment | In Labor Force | Unemployed |
| Less than High School | 2 (100.0%) | 0 (0.0%) |
| High School Diploma | 2 (50.0%) | 0 (0.0%) |
| College / Associate Degree | 51 (86.4%) | 0 (0.0%) |
| Bachelor's Degree or higher | 0 (0.0%) | 0 (0.0%) |
| Total | 55 (84.6%) | 0 (0.0%) |
Employment Occupations by Sex in Neylandville
Management, Business, Science and Arts Occupations
The most common Management, Business, Science and Arts occupations in Neylandville are Health Diagnosing & Treating (20 | 35.7%), and Management (2 | 3.6%).
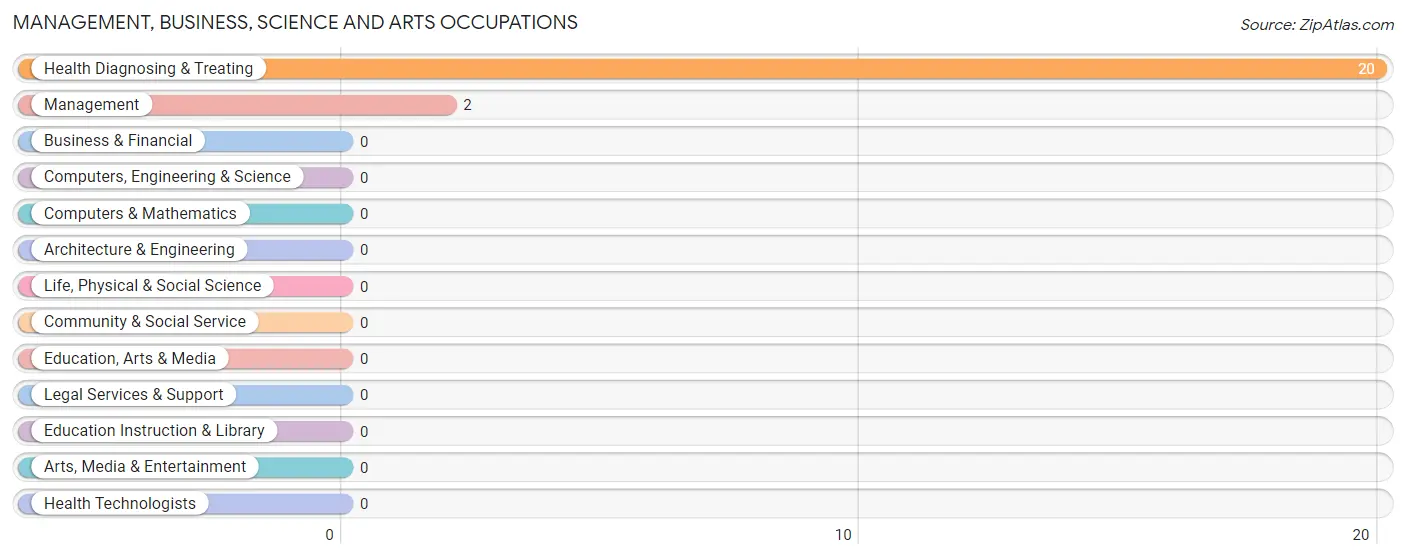
Management, Business, Science and Arts Occupations by Sex
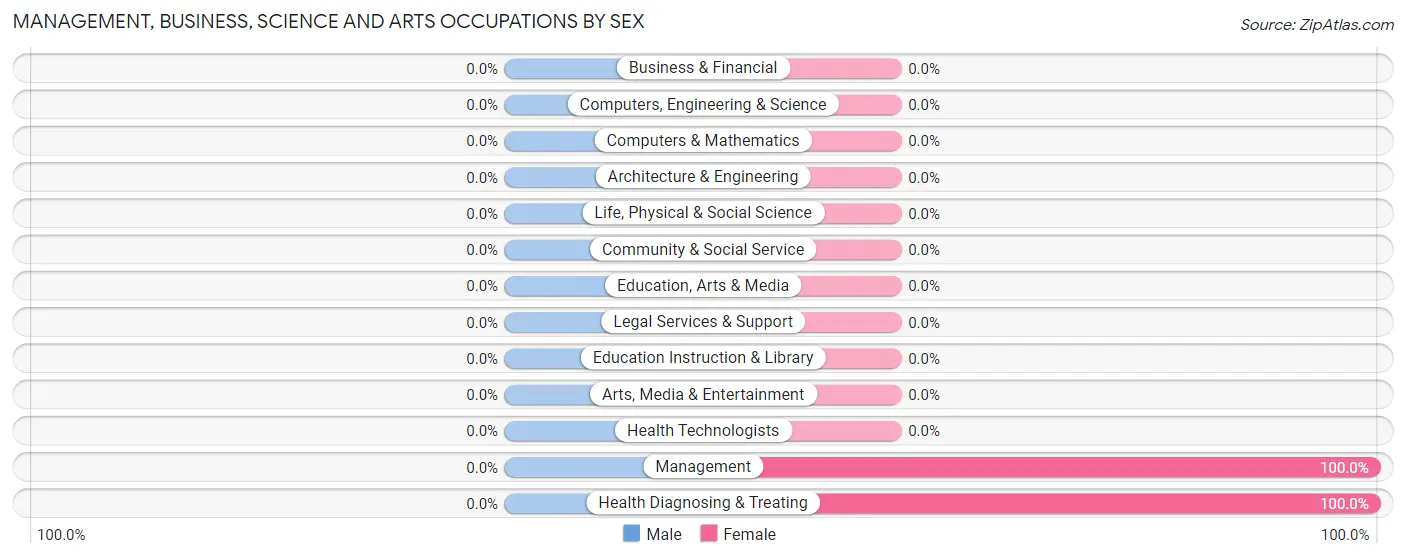
| Occupation | Male | Female |
| Management | 0 (0.0%) | 2 (100.0%) |
| Business & Financial | 0 (0.0%) | 0 (0.0%) |
| Computers, Engineering & Science | 0 (0.0%) | 0 (0.0%) |
| Computers & Mathematics | 0 (0.0%) | 0 (0.0%) |
| Architecture & Engineering | 0 (0.0%) | 0 (0.0%) |
| Life, Physical & Social Science | 0 (0.0%) | 0 (0.0%) |
| Community & Social Service | 0 (0.0%) | 0 (0.0%) |
| Education, Arts & Media | 0 (0.0%) | 0 (0.0%) |
| Legal Services & Support | 0 (0.0%) | 0 (0.0%) |
| Education Instruction & Library | 0 (0.0%) | 0 (0.0%) |
| Arts, Media & Entertainment | 0 (0.0%) | 0 (0.0%) |
| Health Diagnosing & Treating | 0 (0.0%) | 20 (100.0%) |
| Health Technologists | 0 (0.0%) | 0 (0.0%) |
| Total (Category) | 0 (0.0%) | 22 (100.0%) |
| Total (Overall) | 31 (55.4%) | 25 (44.6%) |
Services Occupations
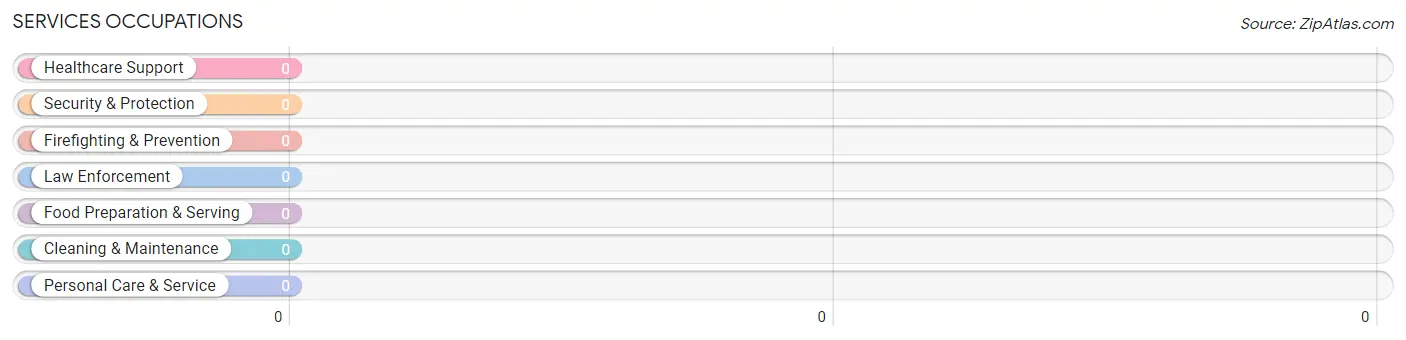
Services Occupations by Sex
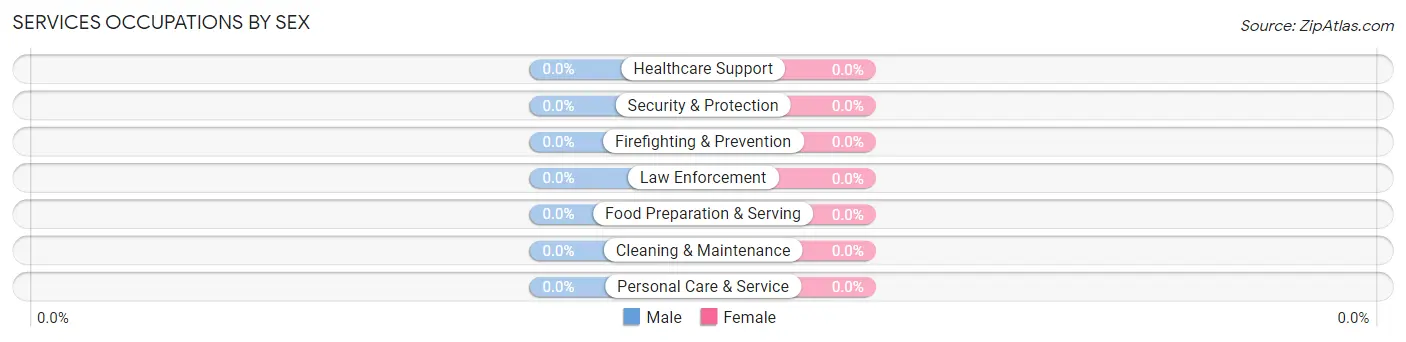
| Occupation | Male | Female |
| Healthcare Support | 0 (0.0%) | 0 (0.0%) |
| Security & Protection | 0 (0.0%) | 0 (0.0%) |
| Firefighting & Prevention | 0 (0.0%) | 0 (0.0%) |
| Law Enforcement | 0 (0.0%) | 0 (0.0%) |
| Food Preparation & Serving | 0 (0.0%) | 0 (0.0%) |
| Cleaning & Maintenance | 0 (0.0%) | 0 (0.0%) |
| Personal Care & Service | 0 (0.0%) | 0 (0.0%) |
| Total (Category) | 0 (0.0%) | 0 (0.0%) |
| Total (Overall) | 31 (55.4%) | 25 (44.6%) |
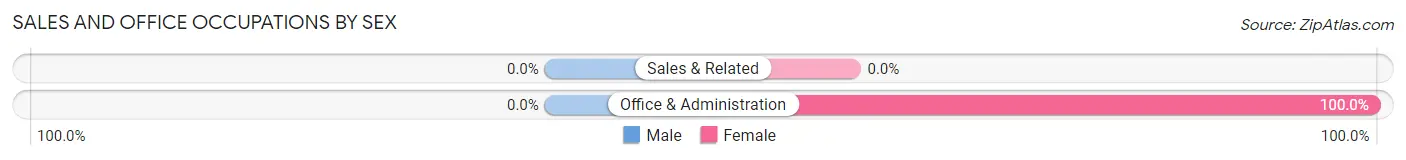
Sales and Office Occupations
The most common Sales and Office occupations in Neylandville are , and Office & Administration (1 | 1.8%).
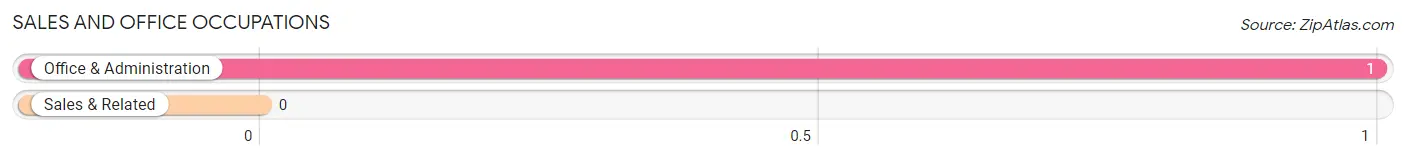
Sales and Office Occupations by Sex
| Occupation | Male | Female |
| Sales & Related | 0 (0.0%) | 0 (0.0%) |
| Office & Administration | 0 (0.0%) | 1 (100.0%) |
| Total (Category) | 0 (0.0%) | 1 (100.0%) |
| Total (Overall) | 31 (55.4%) | 25 (44.6%) |
Natural Resources, Construction and Maintenance Occupations
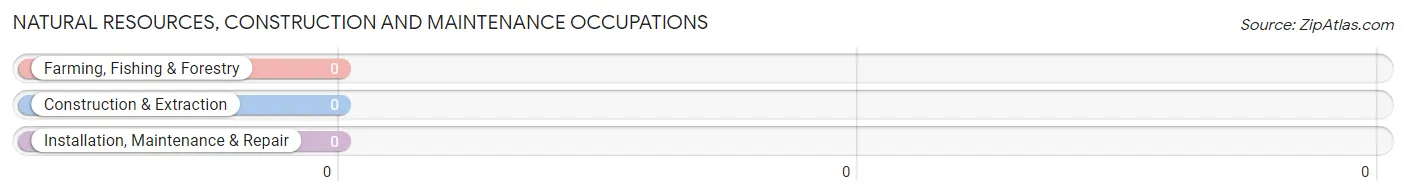
Natural Resources, Construction and Maintenance Occupations by Sex

| Occupation | Male | Female |
| Farming, Fishing & Forestry | 0 (0.0%) | 0 (0.0%) |
| Construction & Extraction | 0 (0.0%) | 0 (0.0%) |
| Installation, Maintenance & Repair | 0 (0.0%) | 0 (0.0%) |
| Total (Category) | 0 (0.0%) | 0 (0.0%) |
| Total (Overall) | 31 (55.4%) | 25 (44.6%) |
Production, Transportation and Moving Occupations
The most common Production, Transportation and Moving occupations in Neylandville are Transportation (29 | 51.8%), Production (2 | 3.6%), and Material Moving (2 | 3.6%).
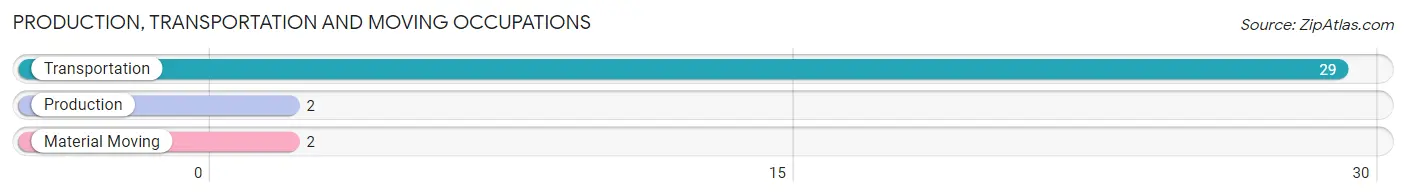
Production, Transportation and Moving Occupations by Sex
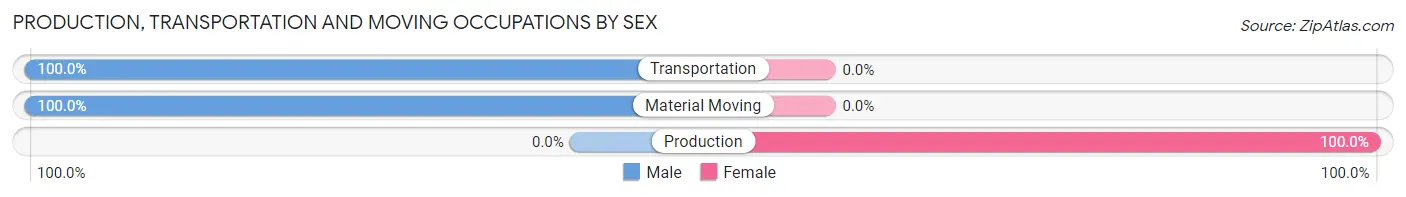
| Occupation | Male | Female |
| Production | 0 (0.0%) | 2 (100.0%) |
| Transportation | 29 (100.0%) | 0 (0.0%) |
| Material Moving | 2 (100.0%) | 0 (0.0%) |
| Total (Category) | 31 (93.9%) | 2 (6.1%) |
| Total (Overall) | 31 (55.4%) | 25 (44.6%) |
Employment Industries by Sex in Neylandville
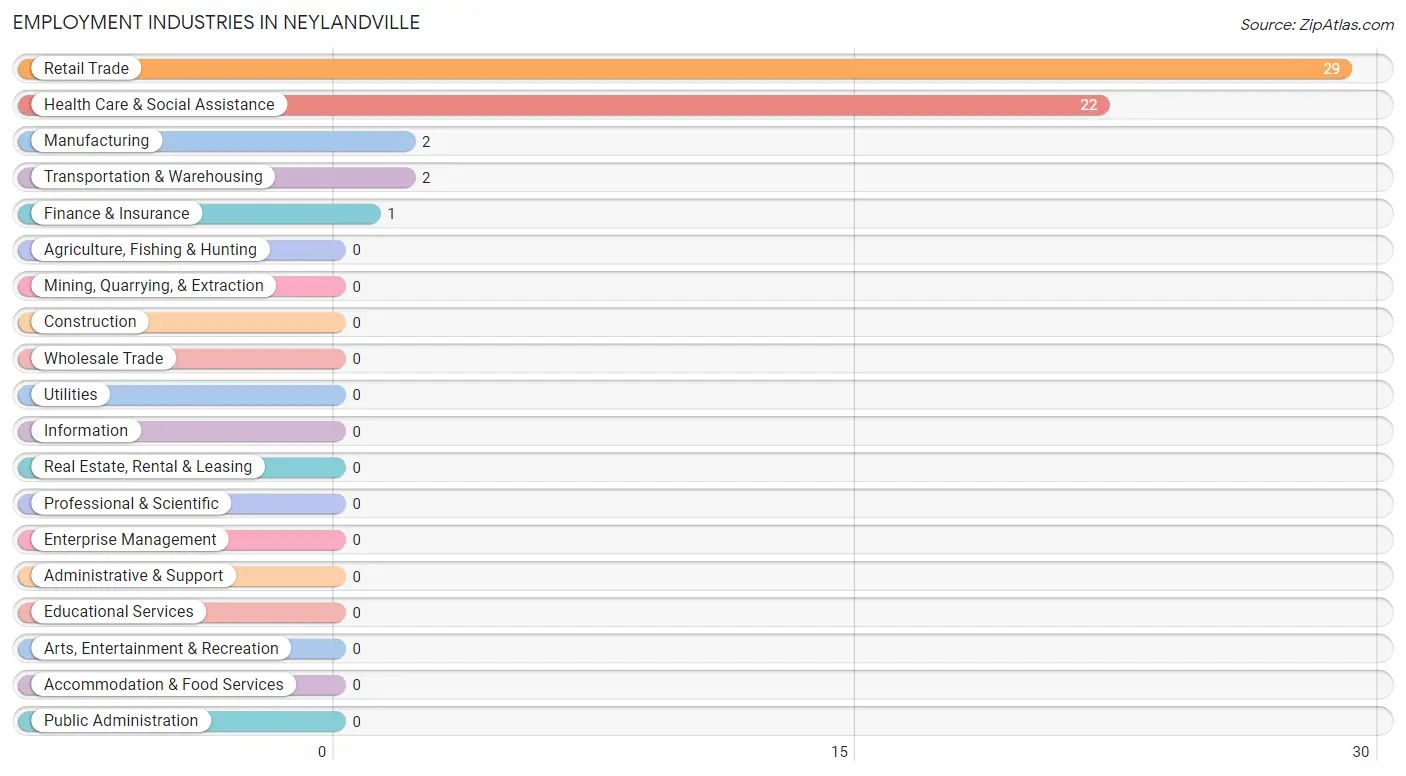
Employment Industries in Neylandville
The major employment industries in Neylandville include Retail Trade (29 | 51.8%), Health Care & Social Assistance (22 | 39.3%), Manufacturing (2 | 3.6%), Transportation & Warehousing (2 | 3.6%), and Finance & Insurance (1 | 1.8%).
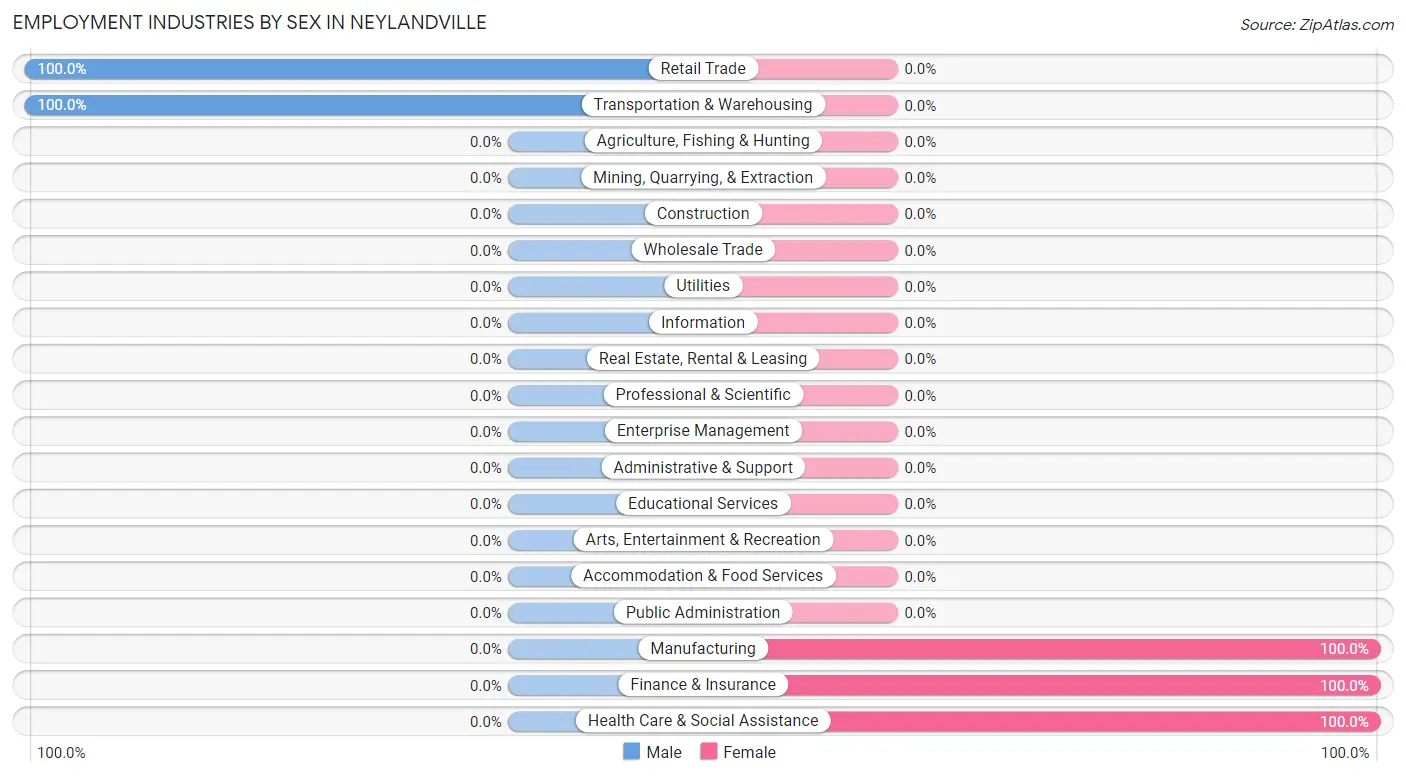
Employment Industries by Sex in Neylandville
The Neylandville industries that see more men than women are Retail Trade (100.0%), and Transportation & Warehousing (100.0%), whereas the industries that tend to have a higher number of women are Manufacturing (100.0%), Finance & Insurance (100.0%), and Health Care & Social Assistance (100.0%).
| Industry | Male | Female |
| Agriculture, Fishing & Hunting | 0 (0.0%) | 0 (0.0%) |
| Mining, Quarrying, & Extraction | 0 (0.0%) | 0 (0.0%) |
| Construction | 0 (0.0%) | 0 (0.0%) |
| Manufacturing | 0 (0.0%) | 2 (100.0%) |
| Wholesale Trade | 0 (0.0%) | 0 (0.0%) |
| Retail Trade | 29 (100.0%) | 0 (0.0%) |
| Transportation & Warehousing | 2 (100.0%) | 0 (0.0%) |
| Utilities | 0 (0.0%) | 0 (0.0%) |
| Information | 0 (0.0%) | 0 (0.0%) |
| Finance & Insurance | 0 (0.0%) | 1 (100.0%) |
| Real Estate, Rental & Leasing | 0 (0.0%) | 0 (0.0%) |
| Professional & Scientific | 0 (0.0%) | 0 (0.0%) |
| Enterprise Management | 0 (0.0%) | 0 (0.0%) |
| Administrative & Support | 0 (0.0%) | 0 (0.0%) |
| Educational Services | 0 (0.0%) | 0 (0.0%) |
| Health Care & Social Assistance | 0 (0.0%) | 22 (100.0%) |
| Arts, Entertainment & Recreation | 0 (0.0%) | 0 (0.0%) |
| Accommodation & Food Services | 0 (0.0%) | 0 (0.0%) |
| Public Administration | 0 (0.0%) | 0 (0.0%) |
| Total | 31 (55.4%) | 25 (44.6%) |
Education in Neylandville
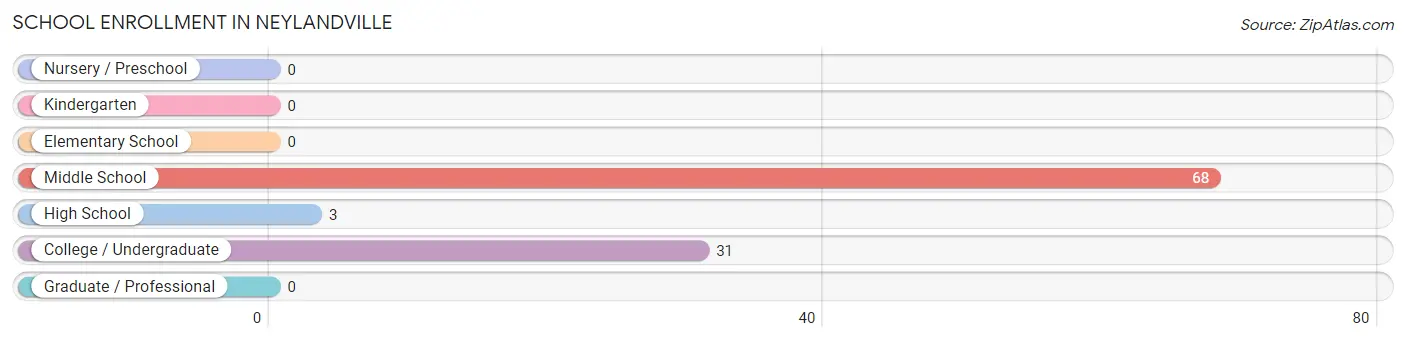
School Enrollment in Neylandville
The most common levels of schooling among the 102 students in Neylandville are middle school (68 | 66.7%), college / undergraduate (31 | 30.4%), and high school (3 | 2.9%).
| School Level | # Students | % Students |
| Nursery / Preschool | 0 | 0.0% |
| Kindergarten | 0 | 0.0% |
| Elementary School | 0 | 0.0% |
| Middle School | 68 | 66.7% |
| High School | 3 | 2.9% |
| College / Undergraduate | 31 | 30.4% |
| Graduate / Professional | 0 | 0.0% |
| Total | 102 | 100.0% |
School Enrollment by Age by Funding Source in Neylandville
Out of a total of 102 students who are enrolled in schools in Neylandville, 31 (30.4%) attend a private institution, while the remaining 71 (69.6%) are enrolled in public schools. The age group of 25 to 34 year olds has the highest likelihood of being enrolled in private schools, with 2 (100.0% in the age bracket) enrolled. Conversely, the age group of 10 to 14 year olds has the lowest likelihood of being enrolled in a private school, with 68 (100.0% in the age bracket) attending a public institution.
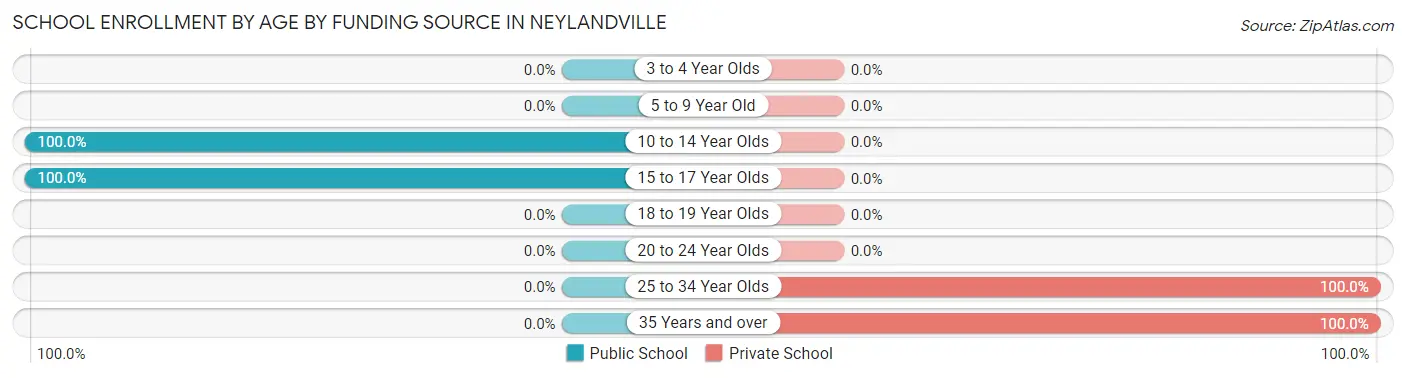
| Age Bracket | Public School | Private School |
| 3 to 4 Year Olds | 0 (0.0%) | 0 (0.0%) |
| 5 to 9 Year Old | 0 (0.0%) | 0 (0.0%) |
| 10 to 14 Year Olds | 68 (100.0%) | 0 (0.0%) |
| 15 to 17 Year Olds | 3 (100.0%) | 0 (0.0%) |
| 18 to 19 Year Olds | 0 (0.0%) | 0 (0.0%) |
| 20 to 24 Year Olds | 0 (0.0%) | 0 (0.0%) |
| 25 to 34 Year Olds | 0 (0.0%) | 2 (100.0%) |
| 35 Years and over | 0 (0.0%) | 29 (100.0%) |
| Total | 71 (69.6%) | 31 (30.4%) |
Educational Attainment by Field of Study in Neylandville
, and education (2 | 100.0%) are the most common fields of study among 2 individuals in Neylandville who have obtained a bachelor's degree or higher.
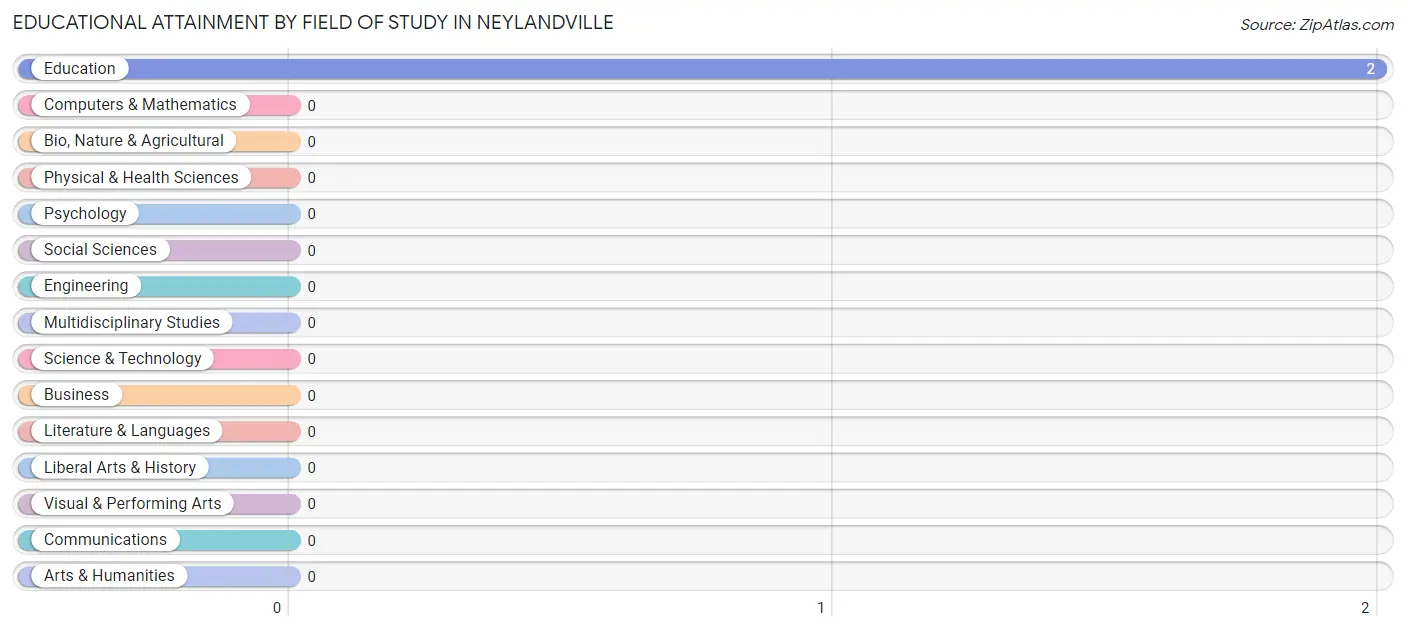
| Field of Study | # Graduates | % Graduates |
| Computers & Mathematics | 0 | 0.0% |
| Bio, Nature & Agricultural | 0 | 0.0% |
| Physical & Health Sciences | 0 | 0.0% |
| Psychology | 0 | 0.0% |
| Social Sciences | 0 | 0.0% |
| Engineering | 0 | 0.0% |
| Multidisciplinary Studies | 0 | 0.0% |
| Science & Technology | 0 | 0.0% |
| Business | 0 | 0.0% |
| Education | 2 | 100.0% |
| Literature & Languages | 0 | 0.0% |
| Liberal Arts & History | 0 | 0.0% |
| Visual & Performing Arts | 0 | 0.0% |
| Communications | 0 | 0.0% |
| Arts & Humanities | 0 | 0.0% |
| Total | 2 | 100.0% |
Transportation & Commute in Neylandville
Vehicle Availability by Sex in Neylandville
The most prevalent vehicle ownership categories in Neylandville are males with 2 vehicles (29, accounting for 93.5%) and females with 2 vehicles (23, making up 116.0%).
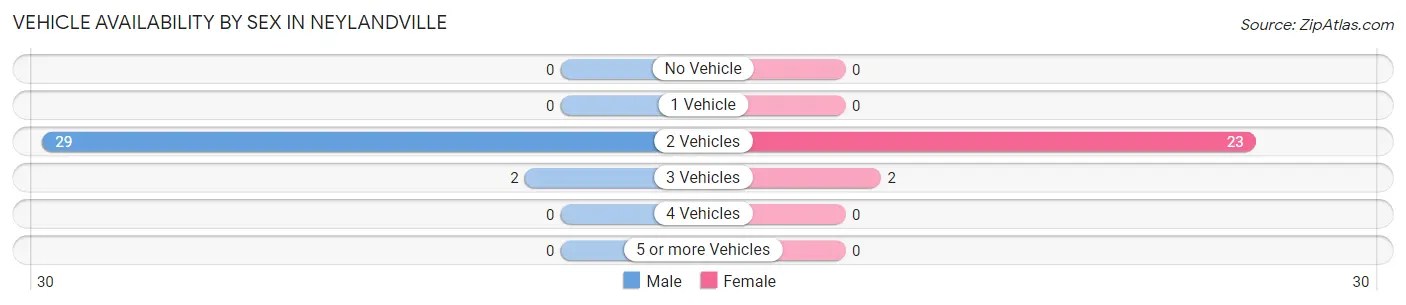
| Vehicles Available | Male | Female |
| No Vehicle | 0 (0.0%) | 0 (0.0%) |
| 1 Vehicle | 0 (0.0%) | 0 (0.0%) |
| 2 Vehicles | 29 (93.5%) | 23 (92.0%) |
| 3 Vehicles | 2 (6.5%) | 2 (8.0%) |
| 4 Vehicles | 0 (0.0%) | 0 (0.0%) |
| 5 or more Vehicles | 0 (0.0%) | 0 (0.0%) |
| Total | 31 (100.0%) | 25 (100.0%) |
Commute Time in Neylandville
The most frequently occuring commute durations in Neylandville are 90 or more minutes (29 commuters, 51.8%), 10 to 14 minutes (20 commuters, 35.7%), and 45 to 59 minutes (6 commuters, 10.7%).
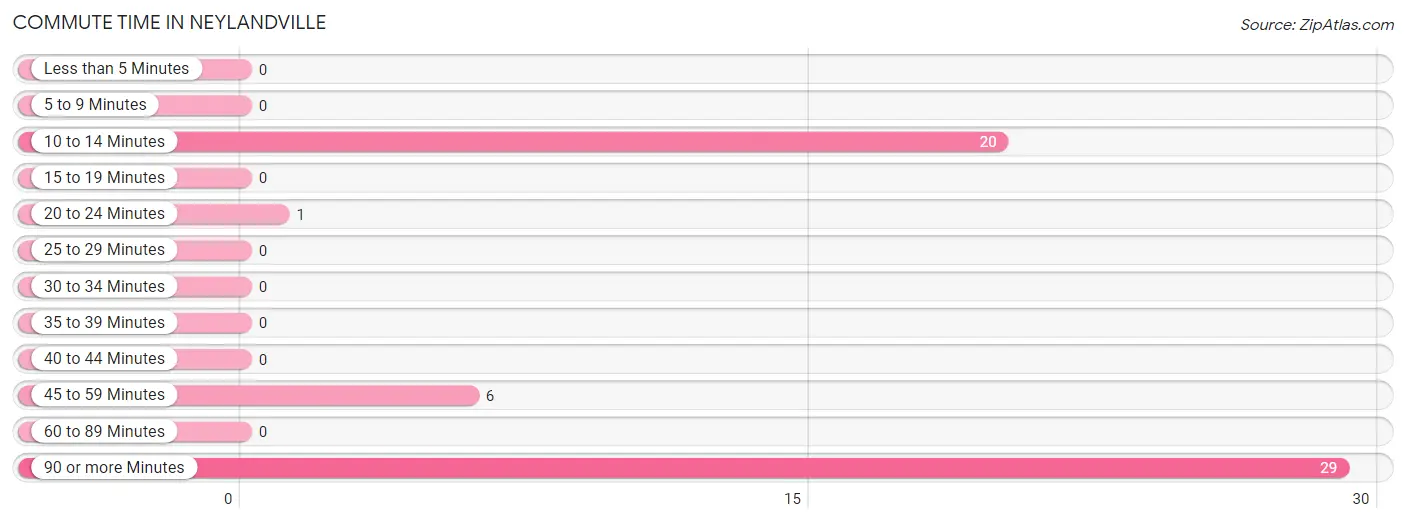
| Commute Time | # Commuters | % Commuters |
| Less than 5 Minutes | 0 | 0.0% |
| 5 to 9 Minutes | 0 | 0.0% |
| 10 to 14 Minutes | 20 | 35.7% |
| 15 to 19 Minutes | 0 | 0.0% |
| 20 to 24 Minutes | 1 | 1.8% |
| 25 to 29 Minutes | 0 | 0.0% |
| 30 to 34 Minutes | 0 | 0.0% |
| 35 to 39 Minutes | 0 | 0.0% |
| 40 to 44 Minutes | 0 | 0.0% |
| 45 to 59 Minutes | 6 | 10.7% |
| 60 to 89 Minutes | 0 | 0.0% |
| 90 or more Minutes | 29 | 51.8% |
Commute Time by Sex in Neylandville
The most common commute times in Neylandville are 90 or more minutes (29 commuters, 93.5%) for males and 10 to 14 minutes (20 commuters, 80.0%) for females.
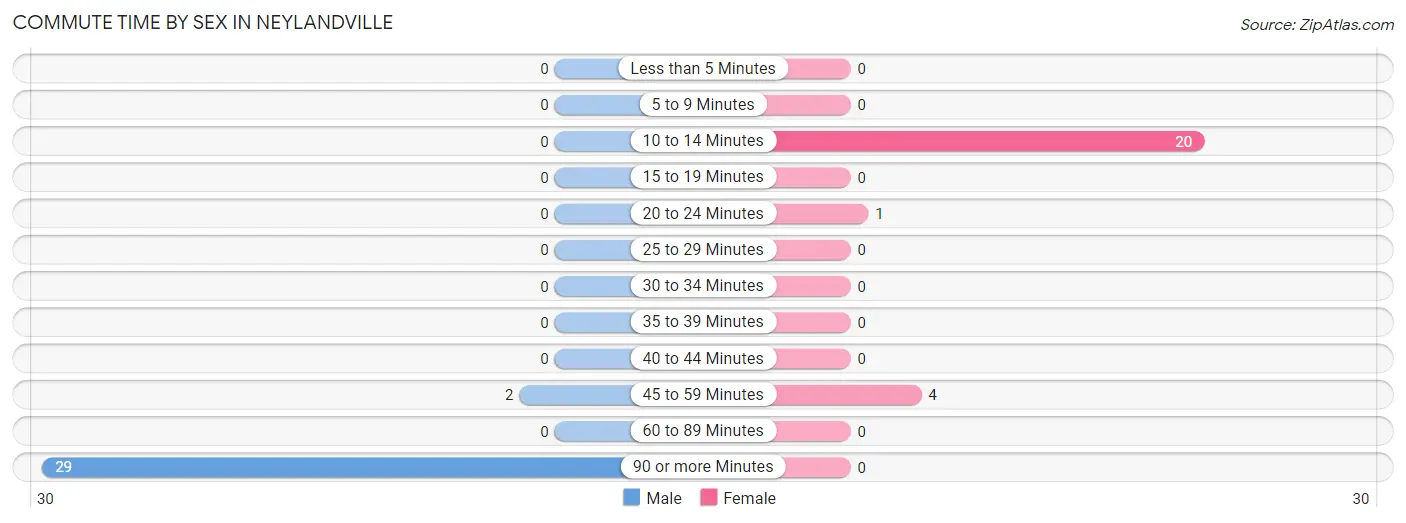
| Commute Time | Male | Female |
| Less than 5 Minutes | 0 (0.0%) | 0 (0.0%) |
| 5 to 9 Minutes | 0 (0.0%) | 0 (0.0%) |
| 10 to 14 Minutes | 0 (0.0%) | 20 (80.0%) |
| 15 to 19 Minutes | 0 (0.0%) | 0 (0.0%) |
| 20 to 24 Minutes | 0 (0.0%) | 1 (4.0%) |
| 25 to 29 Minutes | 0 (0.0%) | 0 (0.0%) |
| 30 to 34 Minutes | 0 (0.0%) | 0 (0.0%) |
| 35 to 39 Minutes | 0 (0.0%) | 0 (0.0%) |
| 40 to 44 Minutes | 0 (0.0%) | 0 (0.0%) |
| 45 to 59 Minutes | 2 (6.5%) | 4 (16.0%) |
| 60 to 89 Minutes | 0 (0.0%) | 0 (0.0%) |
| 90 or more Minutes | 29 (93.5%) | 0 (0.0%) |
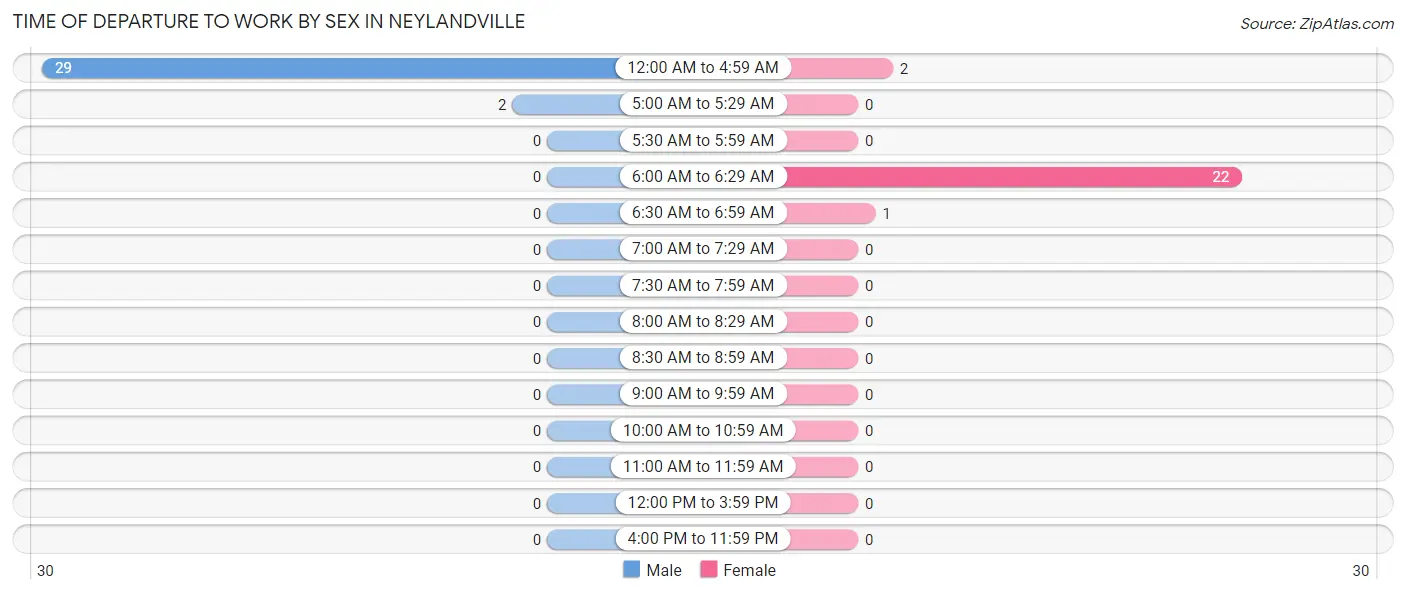
Time of Departure to Work by Sex in Neylandville
The most frequent times of departure to work in Neylandville are 12:00 AM to 4:59 AM (29, 93.5%) for males and 6:00 AM to 6:29 AM (22, 88.0%) for females.
| Time of Departure | Male | Female |
| 12:00 AM to 4:59 AM | 29 (93.5%) | 2 (8.0%) |
| 5:00 AM to 5:29 AM | 2 (6.5%) | 0 (0.0%) |
| 5:30 AM to 5:59 AM | 0 (0.0%) | 0 (0.0%) |
| 6:00 AM to 6:29 AM | 0 (0.0%) | 22 (88.0%) |
| 6:30 AM to 6:59 AM | 0 (0.0%) | 1 (4.0%) |
| 7:00 AM to 7:29 AM | 0 (0.0%) | 0 (0.0%) |
| 7:30 AM to 7:59 AM | 0 (0.0%) | 0 (0.0%) |
| 8:00 AM to 8:29 AM | 0 (0.0%) | 0 (0.0%) |
| 8:30 AM to 8:59 AM | 0 (0.0%) | 0 (0.0%) |
| 9:00 AM to 9:59 AM | 0 (0.0%) | 0 (0.0%) |
| 10:00 AM to 10:59 AM | 0 (0.0%) | 0 (0.0%) |
| 11:00 AM to 11:59 AM | 0 (0.0%) | 0 (0.0%) |
| 12:00 PM to 3:59 PM | 0 (0.0%) | 0 (0.0%) |
| 4:00 PM to 11:59 PM | 0 (0.0%) | 0 (0.0%) |
| Total | 31 (100.0%) | 25 (100.0%) |
Housing Occupancy in Neylandville
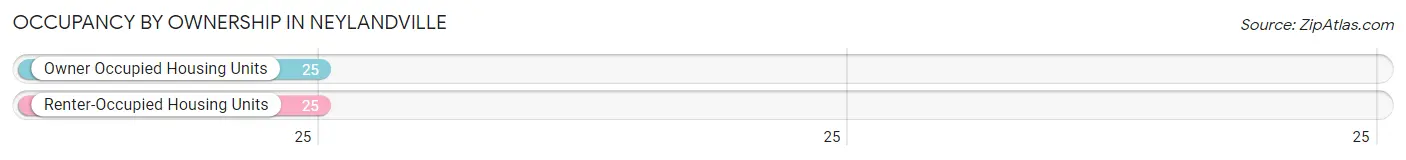
Occupancy by Ownership in Neylandville
Of the total 50 dwellings in Neylandville, owner-occupied units account for 25 (50.0%), while renter-occupied units make up 25 (50.0%).
| Occupancy | # Housing Units | % Housing Units |
| Owner Occupied Housing Units | 25 | 50.0% |
| Renter-Occupied Housing Units | 25 | 50.0% |
| Total Occupied Housing Units | 50 | 100.0% |
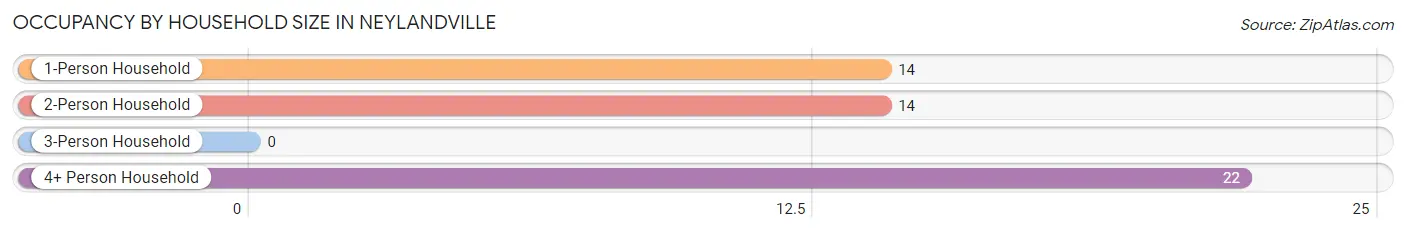
Occupancy by Household Size in Neylandville
| Household Size | # Housing Units | % Housing Units |
| 1-Person Household | 14 | 28.0% |
| 2-Person Household | 14 | 28.0% |
| 3-Person Household | 0 | 0.0% |
| 4+ Person Household | 22 | 44.0% |
| Total Housing Units | 50 | 100.0% |
Occupancy by Ownership by Household Size in Neylandville
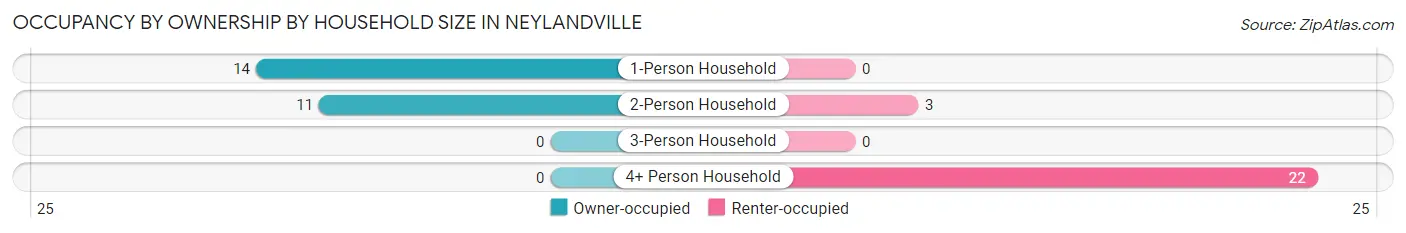
| Household Size | Owner-occupied | Renter-occupied |
| 1-Person Household | 14 (100.0%) | 0 (0.0%) |
| 2-Person Household | 11 (78.6%) | 3 (21.4%) |
| 3-Person Household | 0 (0.0%) | 0 (0.0%) |
| 4+ Person Household | 0 (0.0%) | 22 (100.0%) |
| Total Housing Units | 25 (50.0%) | 25 (50.0%) |
Occupancy by Educational Attainment in Neylandville
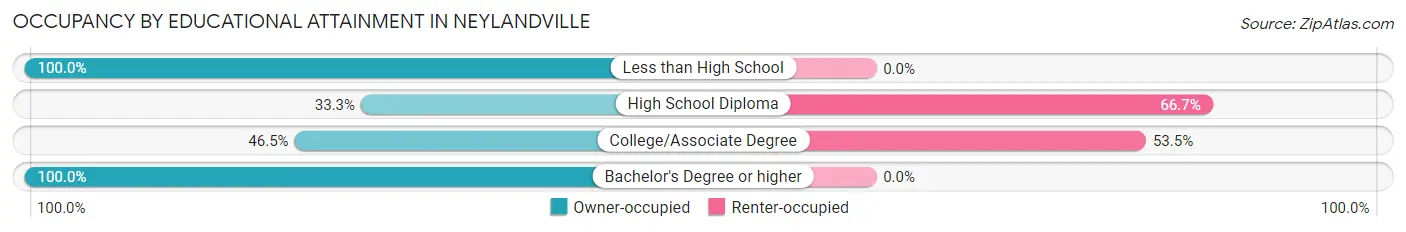
| Household Size | Owner-occupied | Renter-occupied |
| Less than High School | 2 (100.0%) | 0 (0.0%) |
| High School Diploma | 1 (33.3%) | 2 (66.7%) |
| College/Associate Degree | 20 (46.5%) | 23 (53.5%) |
| Bachelor's Degree or higher | 2 (100.0%) | 0 (0.0%) |
Occupancy by Age of Householder in Neylandville
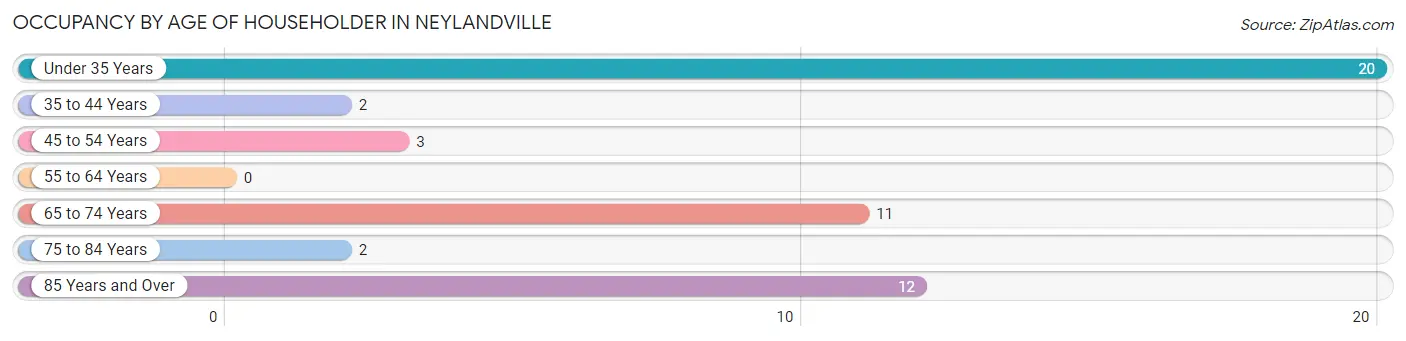
| Age Bracket | # Households | % Households |
| Under 35 Years | 20 | 40.0% |
| 35 to 44 Years | 2 | 4.0% |
| 45 to 54 Years | 3 | 6.0% |
| 55 to 64 Years | 0 | 0.0% |
| 65 to 74 Years | 11 | 22.0% |
| 75 to 84 Years | 2 | 4.0% |
| 85 Years and Over | 12 | 24.0% |
| Total | 50 | 100.0% |
Housing Finances in Neylandville
Median Income by Occupancy in Neylandville
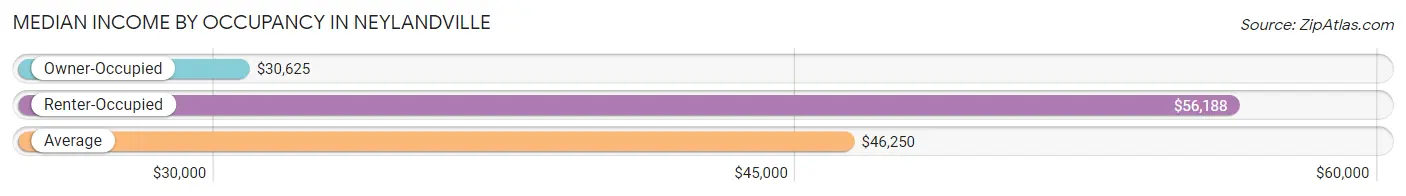
| Occupancy Type | # Households | Median Income |
| Owner-Occupied | 25 (50.0%) | $30,625 |
| Renter-Occupied | 25 (50.0%) | $56,188 |
| Average | 50 (100.0%) | $46,250 |
Occupancy by Householder Income Bracket in Neylandville
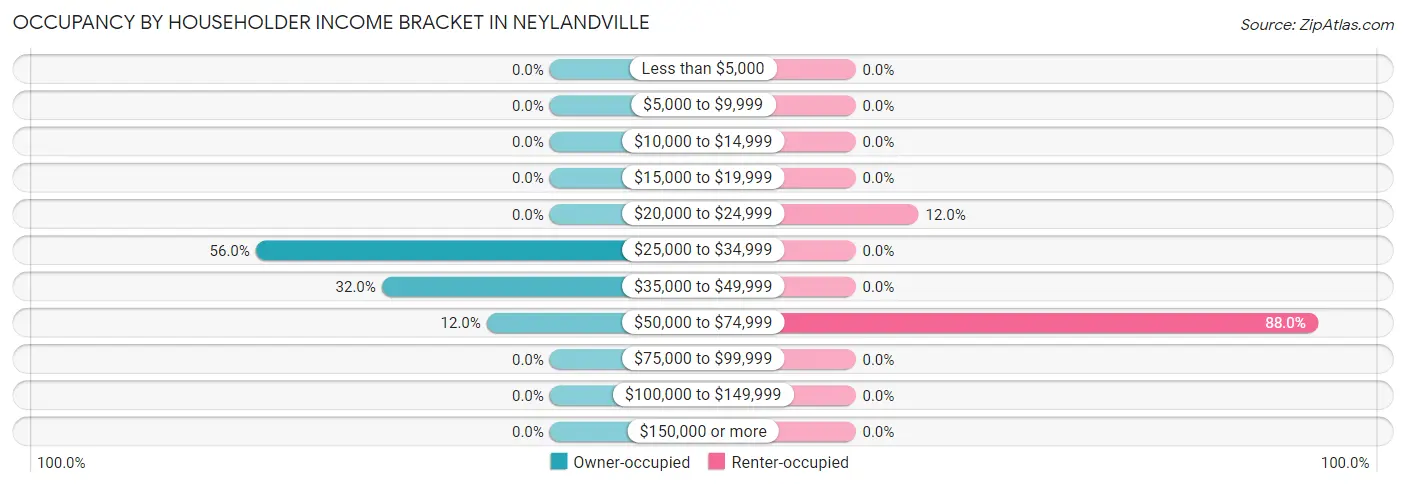
| Income Bracket | Owner-occupied | Renter-occupied |
| Less than $5,000 | 0 (0.0%) | 0 (0.0%) |
| $5,000 to $9,999 | 0 (0.0%) | 0 (0.0%) |
| $10,000 to $14,999 | 0 (0.0%) | 0 (0.0%) |
| $15,000 to $19,999 | 0 (0.0%) | 0 (0.0%) |
| $20,000 to $24,999 | 0 (0.0%) | 3 (12.0%) |
| $25,000 to $34,999 | 14 (56.0%) | 0 (0.0%) |
| $35,000 to $49,999 | 8 (32.0%) | 0 (0.0%) |
| $50,000 to $74,999 | 3 (12.0%) | 22 (88.0%) |
| $75,000 to $99,999 | 0 (0.0%) | 0 (0.0%) |
| $100,000 to $149,999 | 0 (0.0%) | 0 (0.0%) |
| $150,000 or more | 0 (0.0%) | 0 (0.0%) |
| Total | 25 (100.0%) | 25 (100.0%) |
Monthly Housing Cost Tiers in Neylandville
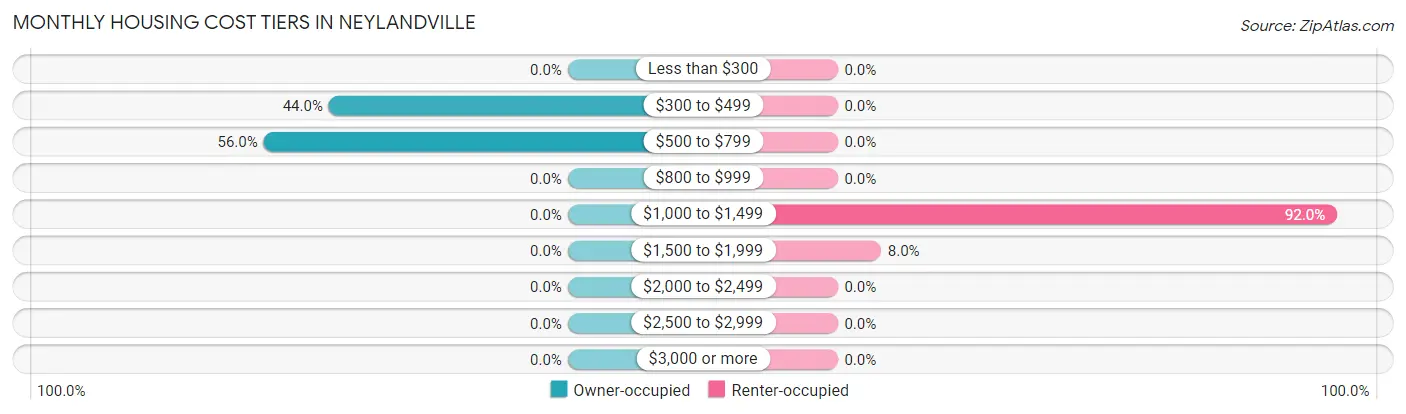
| Monthly Cost | Owner-occupied | Renter-occupied |
| Less than $300 | 0 (0.0%) | 0 (0.0%) |
| $300 to $499 | 11 (44.0%) | 0 (0.0%) |
| $500 to $799 | 14 (56.0%) | 0 (0.0%) |
| $800 to $999 | 0 (0.0%) | 0 (0.0%) |
| $1,000 to $1,499 | 0 (0.0%) | 23 (92.0%) |
| $1,500 to $1,999 | 0 (0.0%) | 2 (8.0%) |
| $2,000 to $2,499 | 0 (0.0%) | 0 (0.0%) |
| $2,500 to $2,999 | 0 (0.0%) | 0 (0.0%) |
| $3,000 or more | 0 (0.0%) | 0 (0.0%) |
| Total | 25 (100.0%) | 25 (100.0%) |
Physical Housing Characteristics in Neylandville
Housing Structures in Neylandville
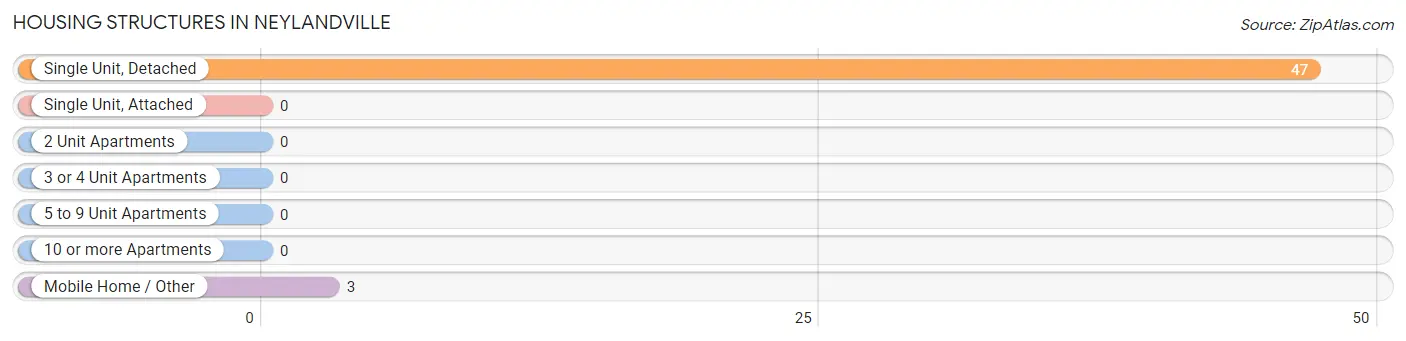
| Structure Type | # Housing Units | % Housing Units |
| Single Unit, Detached | 47 | 94.0% |
| Single Unit, Attached | 0 | 0.0% |
| 2 Unit Apartments | 0 | 0.0% |
| 3 or 4 Unit Apartments | 0 | 0.0% |
| 5 to 9 Unit Apartments | 0 | 0.0% |
| 10 or more Apartments | 0 | 0.0% |
| Mobile Home / Other | 3 | 6.0% |
| Total | 50 | 100.0% |
Housing Structures by Occupancy in Neylandville
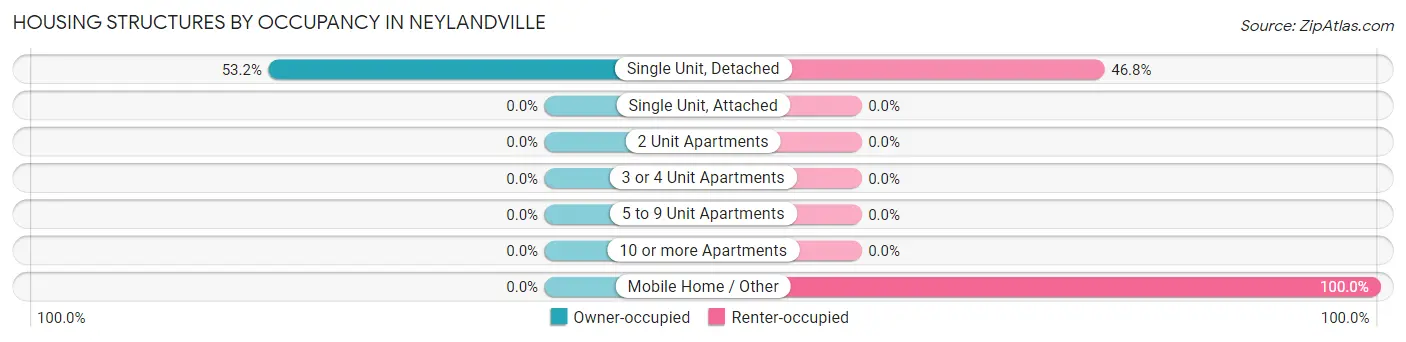
| Structure Type | Owner-occupied | Renter-occupied |
| Single Unit, Detached | 25 (53.2%) | 22 (46.8%) |
| Single Unit, Attached | 0 (0.0%) | 0 (0.0%) |
| 2 Unit Apartments | 0 (0.0%) | 0 (0.0%) |
| 3 or 4 Unit Apartments | 0 (0.0%) | 0 (0.0%) |
| 5 to 9 Unit Apartments | 0 (0.0%) | 0 (0.0%) |
| 10 or more Apartments | 0 (0.0%) | 0 (0.0%) |
| Mobile Home / Other | 0 (0.0%) | 3 (100.0%) |
| Total | 25 (50.0%) | 25 (50.0%) |
Housing Structures by Number of Rooms in Neylandville
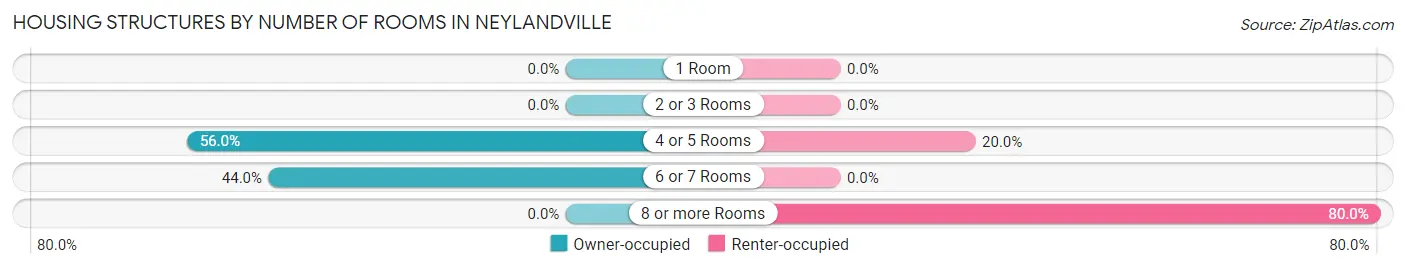
| Number of Rooms | Owner-occupied | Renter-occupied |
| 1 Room | 0 (0.0%) | 0 (0.0%) |
| 2 or 3 Rooms | 0 (0.0%) | 0 (0.0%) |
| 4 or 5 Rooms | 14 (56.0%) | 5 (20.0%) |
| 6 or 7 Rooms | 11 (44.0%) | 0 (0.0%) |
| 8 or more Rooms | 0 (0.0%) | 20 (80.0%) |
| Total | 25 (100.0%) | 25 (100.0%) |
Housing Structure by Heating Type in Neylandville
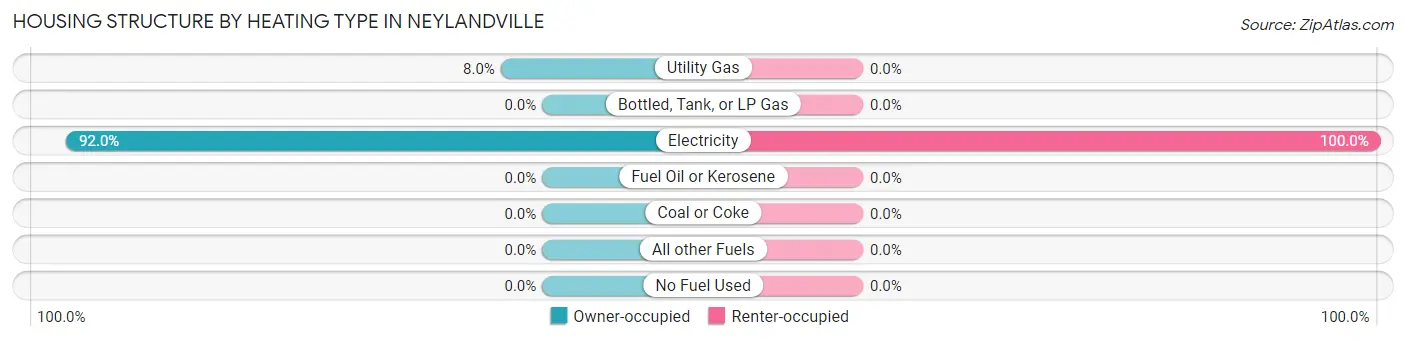
| Heating Type | Owner-occupied | Renter-occupied |
| Utility Gas | 2 (8.0%) | 0 (0.0%) |
| Bottled, Tank, or LP Gas | 0 (0.0%) | 0 (0.0%) |
| Electricity | 23 (92.0%) | 25 (100.0%) |
| Fuel Oil or Kerosene | 0 (0.0%) | 0 (0.0%) |
| Coal or Coke | 0 (0.0%) | 0 (0.0%) |
| All other Fuels | 0 (0.0%) | 0 (0.0%) |
| No Fuel Used | 0 (0.0%) | 0 (0.0%) |
| Total | 25 (100.0%) | 25 (100.0%) |
Household Vehicle Usage in Neylandville
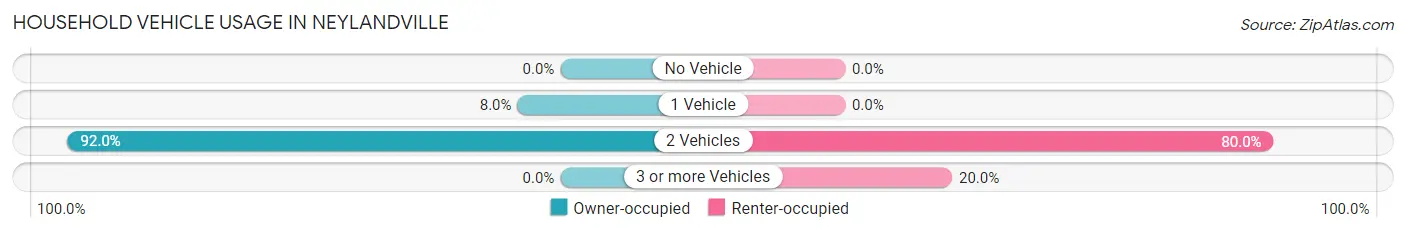
| Vehicles per Household | Owner-occupied | Renter-occupied |
| No Vehicle | 0 (0.0%) | 0 (0.0%) |
| 1 Vehicle | 2 (8.0%) | 0 (0.0%) |
| 2 Vehicles | 23 (92.0%) | 20 (80.0%) |
| 3 or more Vehicles | 0 (0.0%) | 5 (20.0%) |
| Total | 25 (100.0%) | 25 (100.0%) |
Real Estate & Mortgages in Neylandville
Real Estate and Mortgage Overview in Neylandville
| Characteristic | Without Mortgage | With Mortgage |
| Housing Units | 25 | 0 |
| Median Property Value | - | - |
| Median Household Income | $30,625 | $0 |
| Monthly Housing Costs | $675 | $0 |
| Real Estate Taxes | - | - |
Property Value by Mortgage Status in Neylandville
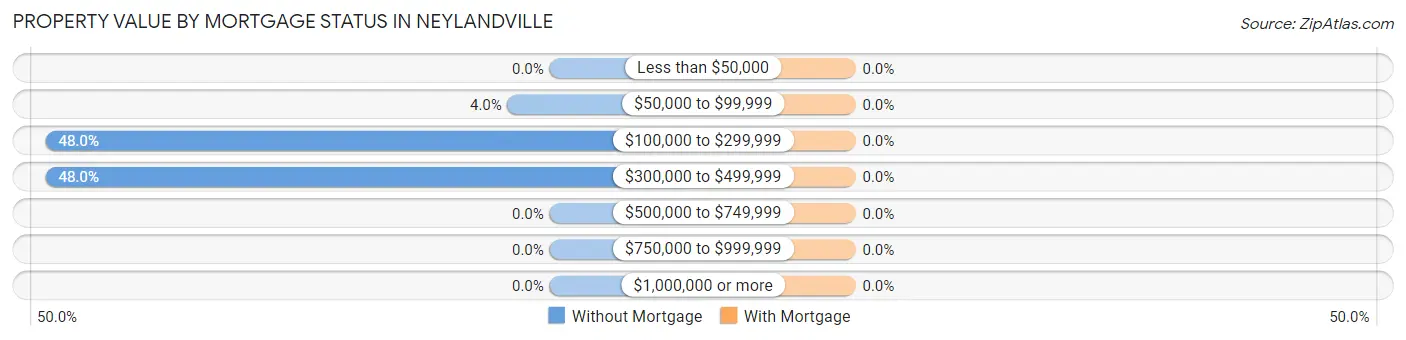
| Property Value | Without Mortgage | With Mortgage |
| Less than $50,000 | 0 (0.0%) | 0 (0.0%) |
| $50,000 to $99,999 | 1 (4.0%) | 0 (0.0%) |
| $100,000 to $299,999 | 12 (48.0%) | 0 (0.0%) |
| $300,000 to $499,999 | 12 (48.0%) | 0 (0.0%) |
| $500,000 to $749,999 | 0 (0.0%) | 0 (0.0%) |
| $750,000 to $999,999 | 0 (0.0%) | 0 (0.0%) |
| $1,000,000 or more | 0 (0.0%) | 0 (0.0%) |
| Total | 25 (100.0%) | 0 (0.0%) |
Household Income by Mortgage Status in Neylandville
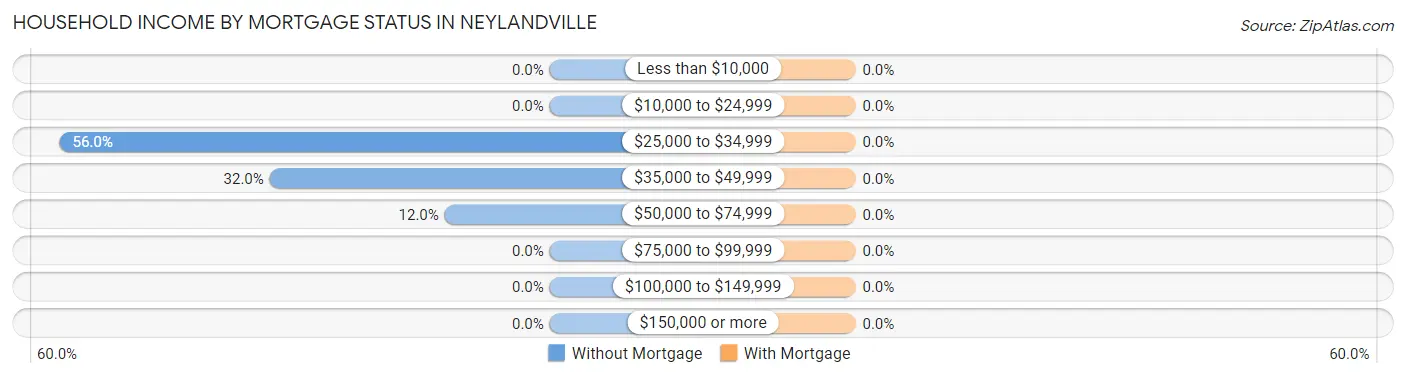
| Household Income | Without Mortgage | With Mortgage |
| Less than $10,000 | 0 (0.0%) | 0 (0.0%) |
| $10,000 to $24,999 | 0 (0.0%) | 0 (0.0%) |
| $25,000 to $34,999 | 14 (56.0%) | 0 (0.0%) |
| $35,000 to $49,999 | 8 (32.0%) | 0 (0.0%) |
| $50,000 to $74,999 | 3 (12.0%) | 0 (0.0%) |
| $75,000 to $99,999 | 0 (0.0%) | 0 (0.0%) |
| $100,000 to $149,999 | 0 (0.0%) | 0 (0.0%) |
| $150,000 or more | 0 (0.0%) | 0 (0.0%) |
| Total | 25 (100.0%) | 0 (0.0%) |
Property Value to Household Income Ratio in Neylandville
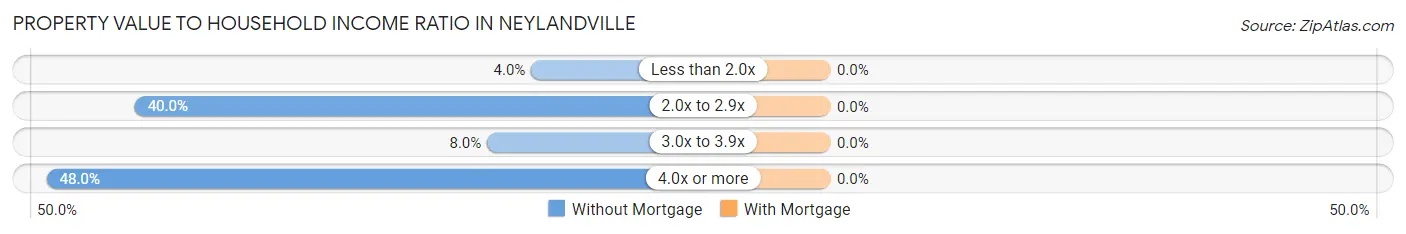
| Value-to-Income Ratio | Without Mortgage | With Mortgage |
| Less than 2.0x | 1 (4.0%) | 0 (0.0%) |
| 2.0x to 2.9x | 10 (40.0%) | 0 (0.0%) |
| 3.0x to 3.9x | 2 (8.0%) | 0 (0.0%) |
| 4.0x or more | 12 (48.0%) | 0 (0.0%) |
| Total | 25 (100.0%) | 0 (0.0%) |
Real Estate Taxes by Mortgage Status in Neylandville
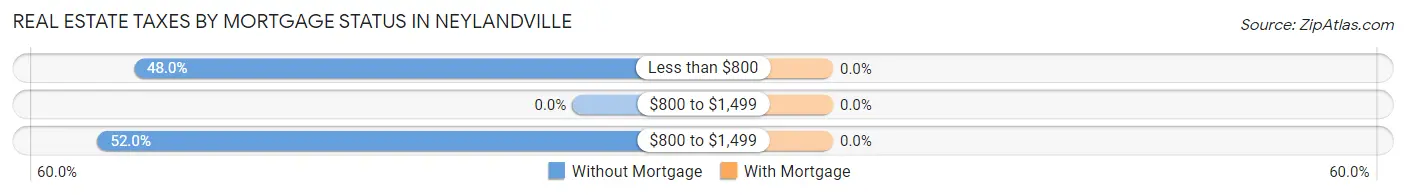
| Property Taxes | Without Mortgage | With Mortgage |
| Less than $800 | 12 (48.0%) | 0 (0.0%) |
| $800 to $1,499 | 0 (0.0%) | 0 (0.0%) |
| $800 to $1,499 | 13 (52.0%) | 0 (0.0%) |
| Total | 25 (100.0%) | 0 (0.0%) |
Health & Disability in Neylandville
Health Insurance Coverage by Age in Neylandville
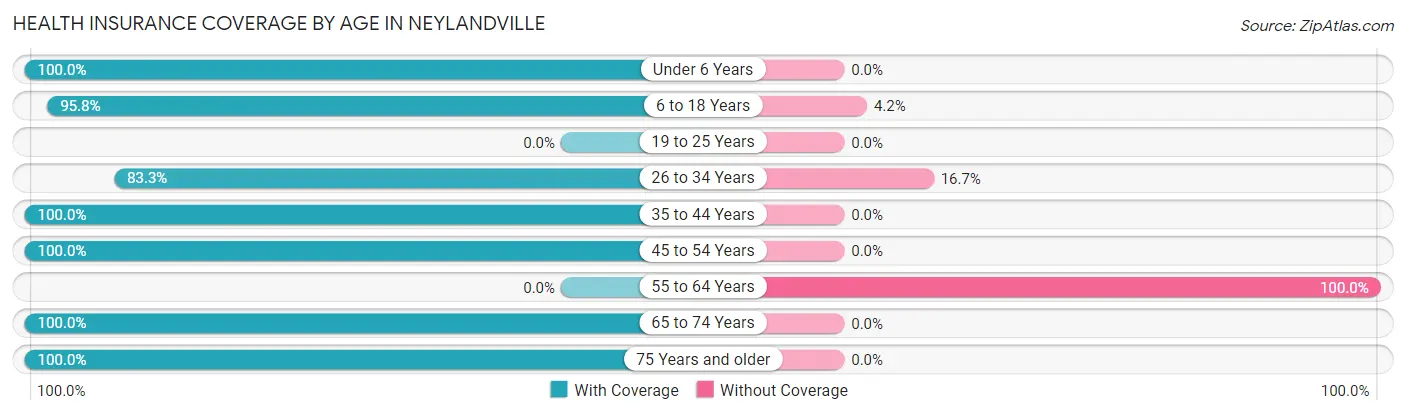
| Age Bracket | With Coverage | Without Coverage |
| Under 6 Years | 41 (100.0%) | 0 (0.0%) |
| 6 to 18 Years | 68 (95.8%) | 3 (4.2%) |
| 19 to 25 Years | 0 (0.0%) | 0 (0.0%) |
| 26 to 34 Years | 20 (83.3%) | 4 (16.7%) |
| 35 to 44 Years | 31 (100.0%) | 0 (0.0%) |
| 45 to 54 Years | 5 (100.0%) | 0 (0.0%) |
| 55 to 64 Years | 0 (0.0%) | 5 (100.0%) |
| 65 to 74 Years | 12 (100.0%) | 0 (0.0%) |
| 75 Years and older | 18 (100.0%) | 0 (0.0%) |
| Total | 195 (94.2%) | 12 (5.8%) |
Health Insurance Coverage by Citizenship Status in Neylandville
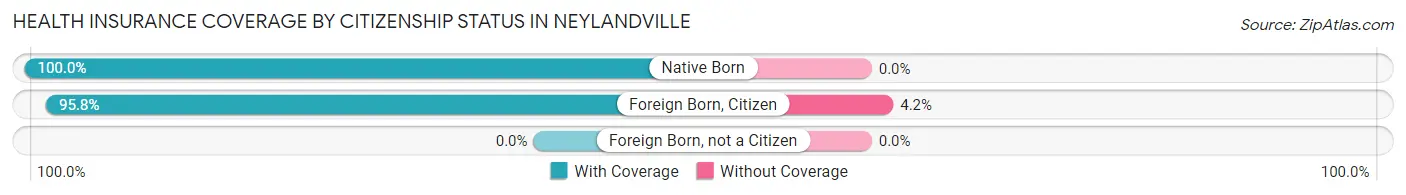
| Citizenship Status | With Coverage | Without Coverage |
| Native Born | 41 (100.0%) | 0 (0.0%) |
| Foreign Born, Citizen | 68 (95.8%) | 3 (4.2%) |
| Foreign Born, not a Citizen | 0 (0.0%) | 0 (0.0%) |
Health Insurance Coverage by Household Income in Neylandville
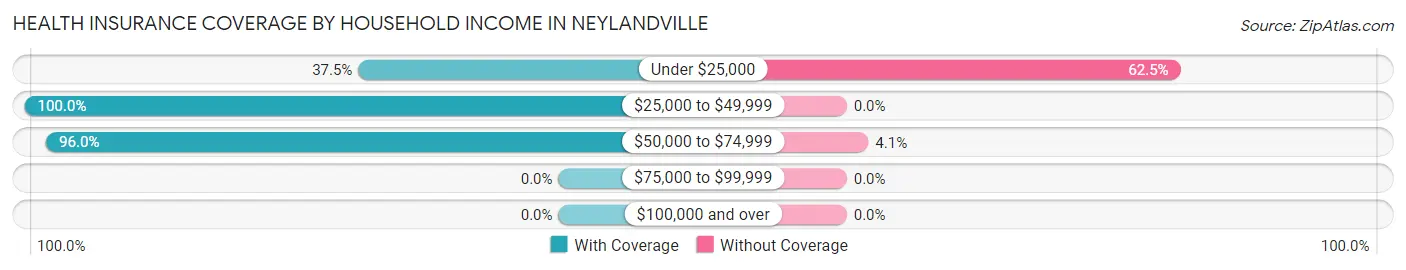
| Household Income | With Coverage | Without Coverage |
| Under $25,000 | 3 (37.5%) | 5 (62.5%) |
| $25,000 to $49,999 | 26 (100.0%) | 0 (0.0%) |
| $50,000 to $74,999 | 166 (96.0%) | 7 (4.1%) |
| $75,000 to $99,999 | 0 (0.0%) | 0 (0.0%) |
| $100,000 and over | 0 (0.0%) | 0 (0.0%) |
Public vs Private Health Insurance Coverage by Age in Neylandville
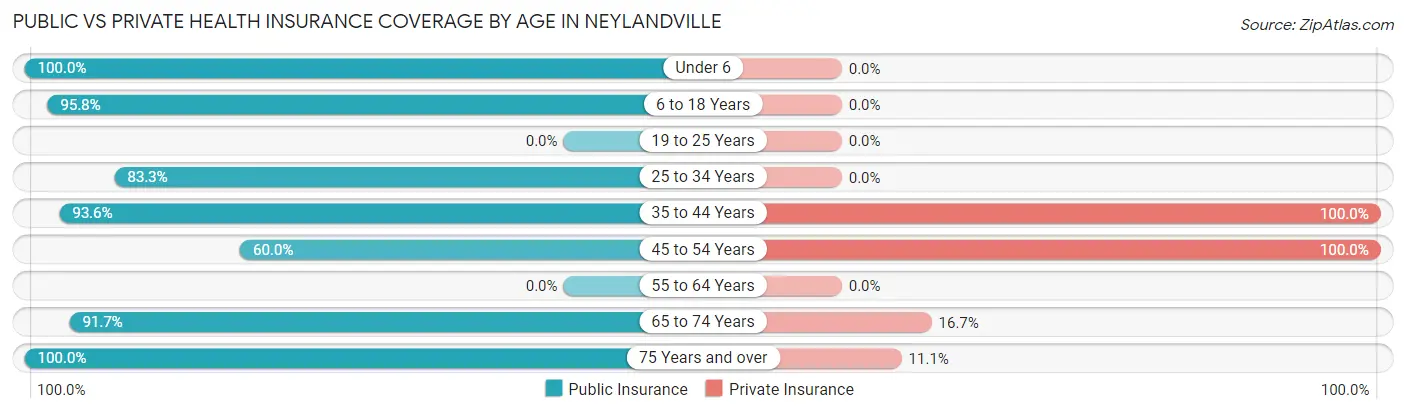
| Age Bracket | Public Insurance | Private Insurance |
| Under 6 | 41 (100.0%) | 0 (0.0%) |
| 6 to 18 Years | 68 (95.8%) | 0 (0.0%) |
| 19 to 25 Years | 0 (0.0%) | 0 (0.0%) |
| 25 to 34 Years | 20 (83.3%) | 0 (0.0%) |
| 35 to 44 Years | 29 (93.5%) | 31 (100.0%) |
| 45 to 54 Years | 3 (60.0%) | 5 (100.0%) |
| 55 to 64 Years | 0 (0.0%) | 0 (0.0%) |
| 65 to 74 Years | 11 (91.7%) | 2 (16.7%) |
| 75 Years and over | 18 (100.0%) | 2 (11.1%) |
| Total | 190 (91.8%) | 40 (19.3%) |
Disability Status by Sex by Age in Neylandville
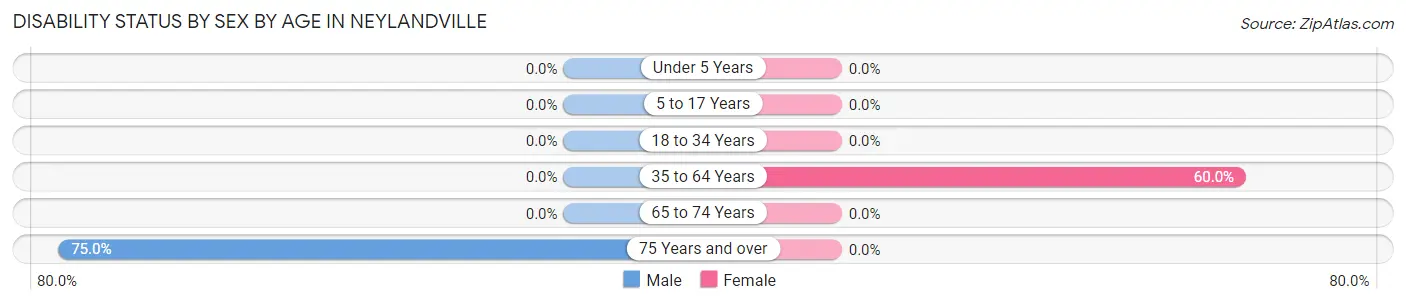
| Age Bracket | Male | Female |
| Under 5 Years | 0 (0.0%) | 0 (0.0%) |
| 5 to 17 Years | 0 (0.0%) | 0 (0.0%) |
| 18 to 34 Years | 0 (0.0%) | 0 (0.0%) |
| 35 to 64 Years | 0 (0.0%) | 3 (60.0%) |
| 65 to 74 Years | 0 (0.0%) | 0 (0.0%) |
| 75 Years and over | 12 (75.0%) | 0 (0.0%) |
Disability Class by Sex by Age in Neylandville
Disability Class: Hearing Difficulty
| Age Bracket | Male | Female |
| Under 5 Years | 0 (0.0%) | 0 (0.0%) |
| 5 to 17 Years | 0 (0.0%) | 0 (0.0%) |
| 18 to 34 Years | 0 (0.0%) | 0 (0.0%) |
| 35 to 64 Years | 0 (0.0%) | 0 (0.0%) |
| 65 to 74 Years | 0 (0.0%) | 0 (0.0%) |
| 75 Years and over | 0 (0.0%) | 0 (0.0%) |
Disability Class: Vision Difficulty
| Age Bracket | Male | Female |
| Under 5 Years | 0 (0.0%) | 0 (0.0%) |
| 5 to 17 Years | 0 (0.0%) | 0 (0.0%) |
| 18 to 34 Years | 0 (0.0%) | 0 (0.0%) |
| 35 to 64 Years | 0 (0.0%) | 0 (0.0%) |
| 65 to 74 Years | 0 (0.0%) | 0 (0.0%) |
| 75 Years and over | 0 (0.0%) | 0 (0.0%) |
Disability Class: Cognitive Difficulty
| Age Bracket | Male | Female |
| 5 to 17 Years | 0 (0.0%) | 0 (0.0%) |
| 18 to 34 Years | 0 (0.0%) | 0 (0.0%) |
| 35 to 64 Years | 0 (0.0%) | 0 (0.0%) |
| 65 to 74 Years | 0 (0.0%) | 0 (0.0%) |
| 75 Years and over | 0 (0.0%) | 0 (0.0%) |
Disability Class: Ambulatory Difficulty
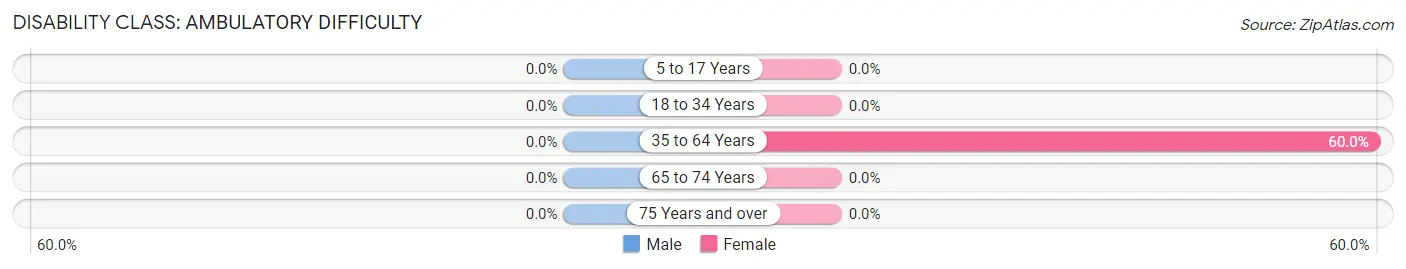
| Age Bracket | Male | Female |
| 5 to 17 Years | 0 (0.0%) | 0 (0.0%) |
| 18 to 34 Years | 0 (0.0%) | 0 (0.0%) |
| 35 to 64 Years | 0 (0.0%) | 3 (60.0%) |
| 65 to 74 Years | 0 (0.0%) | 0 (0.0%) |
| 75 Years and over | 0 (0.0%) | 0 (0.0%) |
Disability Class: Self-Care Difficulty
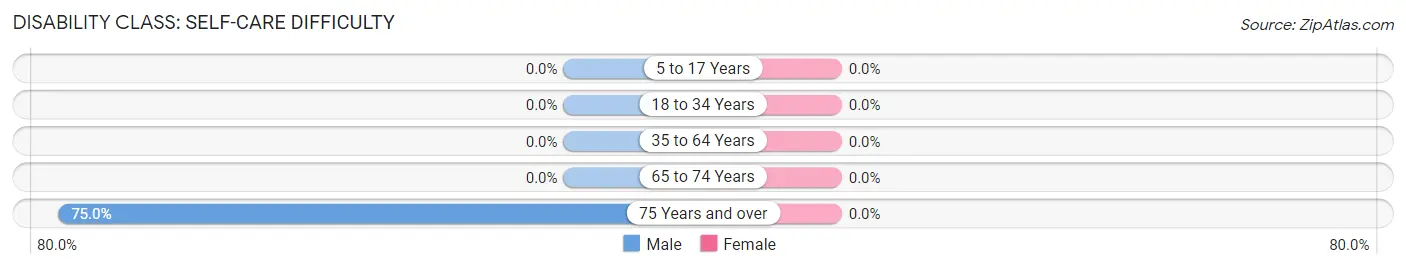
| Age Bracket | Male | Female |
| 5 to 17 Years | 0 (0.0%) | 0 (0.0%) |
| 18 to 34 Years | 0 (0.0%) | 0 (0.0%) |
| 35 to 64 Years | 0 (0.0%) | 0 (0.0%) |
| 65 to 74 Years | 0 (0.0%) | 0 (0.0%) |
| 75 Years and over | 12 (75.0%) | 0 (0.0%) |
Technology Access in Neylandville
Computing Device Access in Neylandville
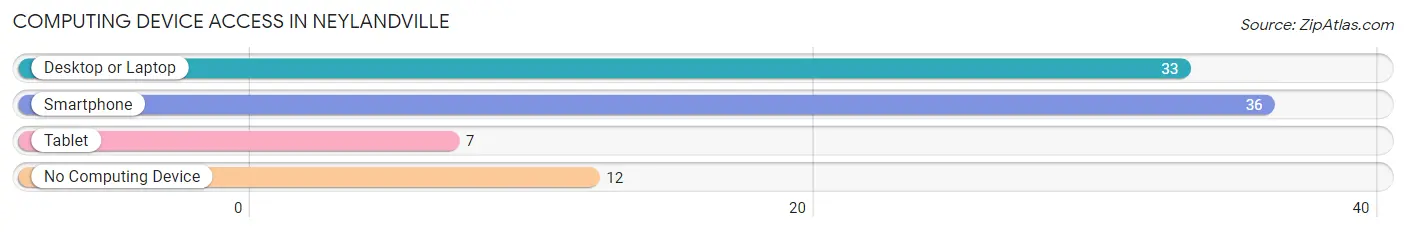
| Device Type | # Households | % Households |
| Desktop or Laptop | 33 | 66.0% |
| Smartphone | 36 | 72.0% |
| Tablet | 7 | 14.0% |
| No Computing Device | 12 | 24.0% |
| Total | 50 | 100.0% |
Internet Access in Neylandville
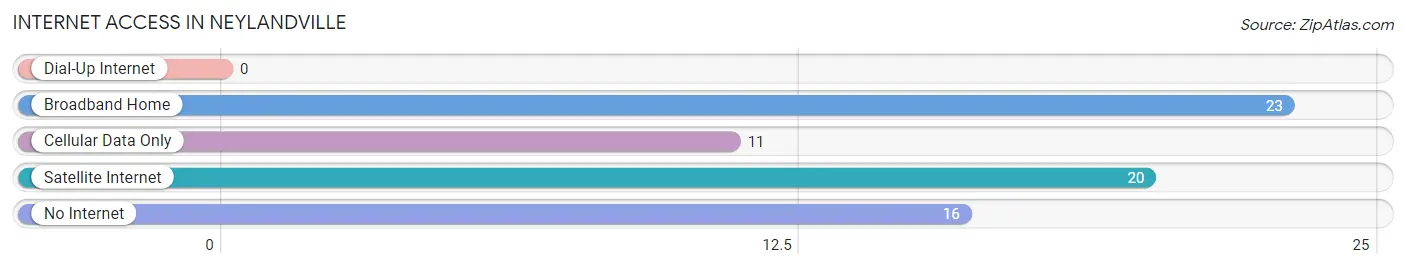
| Internet Type | # Households | % Households |
| Dial-Up Internet | 0 | 0.0% |
| Broadband Home | 23 | 46.0% |
| Cellular Data Only | 11 | 22.0% |
| Satellite Internet | 20 | 40.0% |
| No Internet | 16 | 32.0% |
| Total | 50 | 100.0% |
Neylandville Summary
Neylandville is a small town located in the northeast corner of Texas, in the county of Hunt. It is situated on the banks of the Sulphur River, and is part of the larger Texoma region. The town has a population of just over 500 people, and is known for its rural charm and small-town atmosphere.
History
Neylandville was founded in 1873 by a group of settlers from the nearby town of Sulphur Springs. The town was named after the first settler, William Neyland, who had purchased the land from the local Native American tribes. The town quickly grew, and by the early 1900s it had become a thriving agricultural community. The town was home to several cotton gins, a sawmill, and a general store.
In the early 1900s, the town was also home to a large African-American population. The town was home to several churches, a school, and a post office. The town was also home to a number of businesses, including a blacksmith shop, a livery stable, and a hotel.
Geography
Neylandville is located in the northeast corner of Texas, in the county of Hunt. It is situated on the banks of the Sulphur River, and is part of the larger Texoma region. The town is located approximately 30 miles east of Dallas, and is part of the Dallas-Fort Worth metropolitan area. The town is located in a rural area, and is surrounded by rolling hills and farmland.
Economy
Neylandville is a small, rural town, and the economy is largely based on agriculture. The town is home to several farms, and the main crops grown in the area are cotton, corn, and soybeans. The town is also home to several small businesses, including a general store, a gas station, and a few restaurants.
Demographics
As of the 2010 census, the population of Neylandville was 514 people. The racial makeup of the town was 94.3% White, 0.6% African American, 0.2% Native American, 0.2% Asian, 0.2% from other races, and 4.7% from two or more races. The median household income was $37,500, and the median family income was $41,250. The per capita income was $17,845.
Conclusion
Neylandville is a small, rural town located in the northeast corner of Texas. The town has a population of just over 500 people, and is known for its rural charm and small-town atmosphere. The economy is largely based on agriculture, and the town is home to several small businesses. The population is predominantly White, with a small African-American population. The town is part of the larger Texoma region, and is located approximately 30 miles east of Dallas.
Common Questions
What is Per Capita Income in Neylandville?
Per Capita income in Neylandville is $11,928.
What is the Median Family Income in Neylandville?
Median Family Income in Neylandville is $55,595.
What is the Median Household income in Neylandville?
Median Household Income in Neylandville is $46,250.
What is Inequality or Gini Index in Neylandville?
Inequality or Gini Index in Neylandville is 0.16.
What is the Total Population of Neylandville?
Total Population of Neylandville is 207.
What is the Total Male Population of Neylandville?
Total Male Population of Neylandville is 79.
What is the Total Female Population of Neylandville?
Total Female Population of Neylandville is 128.
What is the Ratio of Males per 100 Females in Neylandville?
There are 61.72 Males per 100 Females in Neylandville.
What is the Ratio of Females per 100 Males in Neylandville?
There are 162.03 Females per 100 Males in Neylandville.
What is the Median Population Age in Neylandville?
Median Population Age in Neylandville is 12.8 Years.
What is the Average Family Size in Neylandville
Average Family Size in Neylandville is 5.3 People.
What is the Average Household Size in Neylandville
Average Household Size in Neylandville is 4.1 People.
How Large is the Labor Force in Neylandville?
There are 56 People in the Labor Forcein in Neylandville.
What is the Percentage of People in the Labor Force in Neylandville?
57.1% of People are in the Labor Force in Neylandville.