Olmito and Olmito, TX Map & Demographics
Olmito and Olmito Map
Olmito and Olmito Overview
$12,124
PER CAPITA INCOME
$41,944
AVG FAMILY INCOME
$41,944
AVG HOUSEHOLD INCOME
0.06
INEQUALITY / GINI INDEX
284
TOTAL POPULATION
103
MALE POPULATION
181
FEMALE POPULATION
56.91
MALES / 100 FEMALES
175.73
FEMALES / 100 MALES
9.8
MEDIAN AGE
3.7
AVG FAMILY SIZE
3.7
AVG HOUSEHOLD SIZE
86
LABOR FORCE [ PEOPLE ]
65.2%
PERCENT IN LABOR FORCE
Income in Olmito and Olmito
Income Overview in Olmito and Olmito
Per Capita Income in Olmito and Olmito is $12,124, while median incomes of families and households are $41,944 and $41,944 respectively.
| Characteristic | Number | Measure |
| Per Capita Income | 284 | $12,124 |
| Median Family Income | 76 | $41,944 |
| Mean Family Income | 76 | $39,818 |
| Median Household Income | 76 | $41,944 |
| Mean Household Income | 76 | $39,818 |
| Income Deficit | 76 | $0 |
| Wage / Income Gap (%) | 284 | 0.00% |
| Wage / Income Gap ($) | 284 | 100.00¢ per $1 |
| Gini / Inequality Index | 284 | 0.06 |
Earnings by Sex in Olmito and Olmito
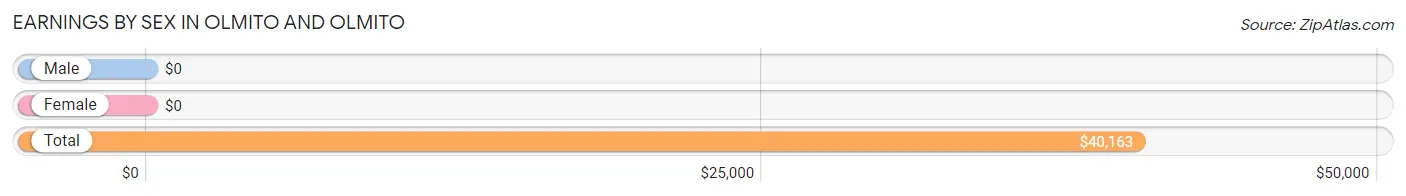
| Sex | Number | Average Earnings |
| Male | 46 (53.5%) | $0 |
| Female | 40 (46.5%) | $0 |
| Total | 86 (100.0%) | $40,163 |
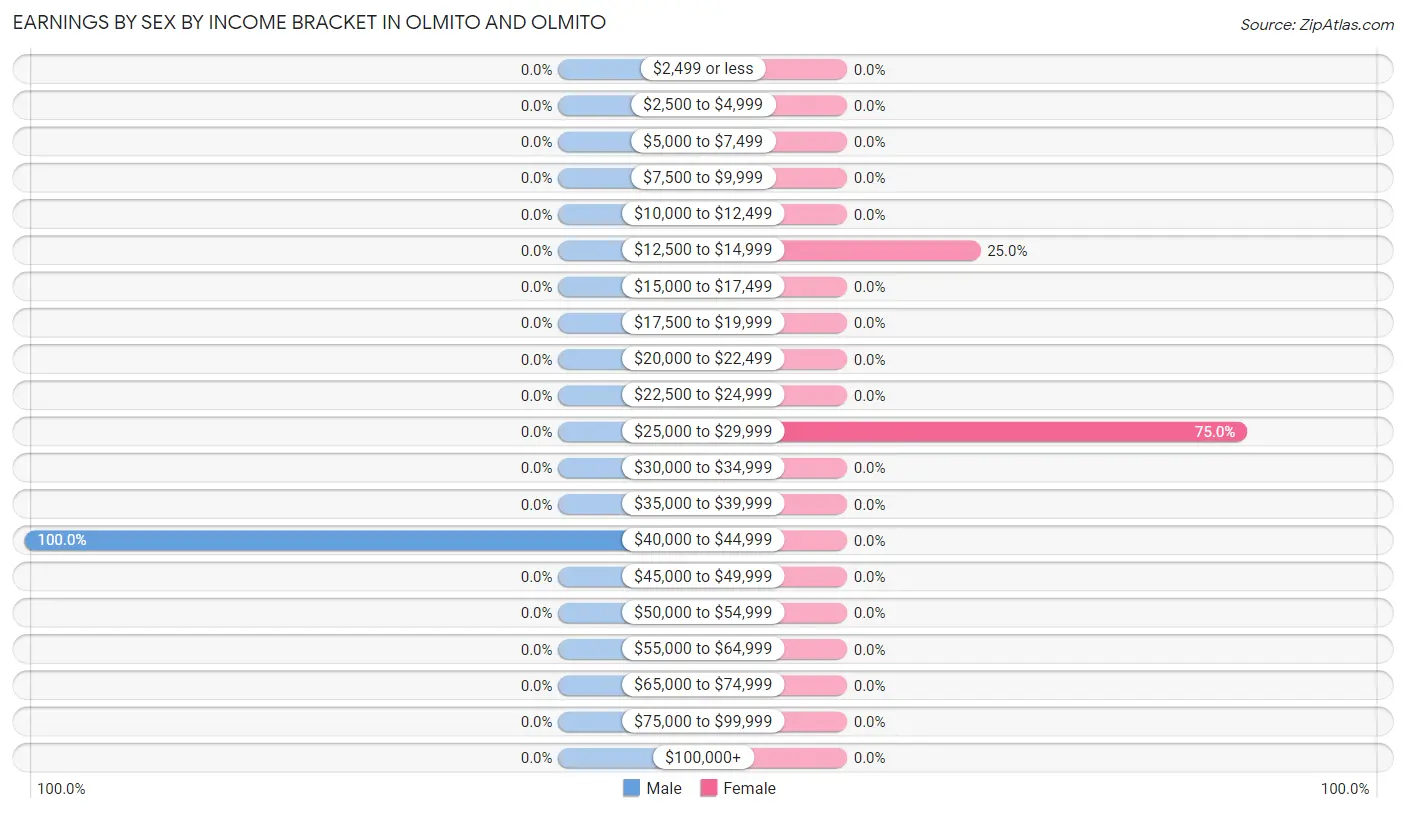
Earnings by Sex by Income Bracket in Olmito and Olmito
The most common earnings brackets in Olmito and Olmito are $40,000 to $44,999 for men (46 | 100.0%) and $25,000 to $29,999 for women (30 | 75.0%).
| Income | Male | Female |
| $2,499 or less | 0 (0.0%) | 0 (0.0%) |
| $2,500 to $4,999 | 0 (0.0%) | 0 (0.0%) |
| $5,000 to $7,499 | 0 (0.0%) | 0 (0.0%) |
| $7,500 to $9,999 | 0 (0.0%) | 0 (0.0%) |
| $10,000 to $12,499 | 0 (0.0%) | 0 (0.0%) |
| $12,500 to $14,999 | 0 (0.0%) | 10 (25.0%) |
| $15,000 to $17,499 | 0 (0.0%) | 0 (0.0%) |
| $17,500 to $19,999 | 0 (0.0%) | 0 (0.0%) |
| $20,000 to $22,499 | 0 (0.0%) | 0 (0.0%) |
| $22,500 to $24,999 | 0 (0.0%) | 0 (0.0%) |
| $25,000 to $29,999 | 0 (0.0%) | 30 (75.0%) |
| $30,000 to $34,999 | 0 (0.0%) | 0 (0.0%) |
| $35,000 to $39,999 | 0 (0.0%) | 0 (0.0%) |
| $40,000 to $44,999 | 46 (100.0%) | 0 (0.0%) |
| $45,000 to $49,999 | 0 (0.0%) | 0 (0.0%) |
| $50,000 to $54,999 | 0 (0.0%) | 0 (0.0%) |
| $55,000 to $64,999 | 0 (0.0%) | 0 (0.0%) |
| $65,000 to $74,999 | 0 (0.0%) | 0 (0.0%) |
| $75,000 to $99,999 | 0 (0.0%) | 0 (0.0%) |
| $100,000+ | 0 (0.0%) | 0 (0.0%) |
| Total | 46 (100.0%) | 40 (100.0%) |
Earnings by Sex by Educational Attainment in Olmito and Olmito
| Educational Attainment | Male Income | Female Income |
| Less than High School | - | - |
| High School Diploma | - | - |
| College or Associate's Degree | - | - |
| Bachelor's Degree | - | - |
| Graduate Degree | - | - |
| Total | - | - |
Family Income in Olmito and Olmito
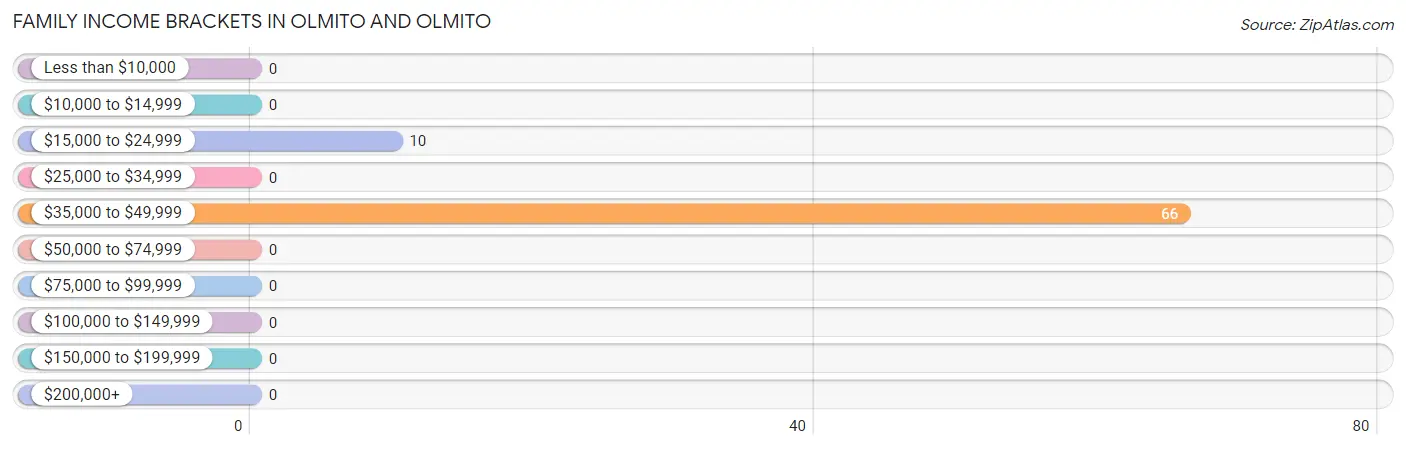
Family Income Brackets in Olmito and Olmito
According to the Olmito and Olmito family income data, there are 66 families falling into the $35,000 to $49,999 income range, which is the most common income bracket and makes up 86.8% of all families.
| Income Bracket | # Families | % Families |
| Less than $10,000 | 0 | 0.0% |
| $10,000 to $14,999 | 0 | 0.0% |
| $15,000 to $24,999 | 10 | 13.2% |
| $25,000 to $34,999 | 0 | 0.0% |
| $35,000 to $49,999 | 66 | 86.8% |
| $50,000 to $74,999 | 0 | 0.0% |
| $75,000 to $99,999 | 0 | 0.0% |
| $100,000 to $149,999 | 0 | 0.0% |
| $150,000 to $199,999 | 0 | 0.0% |
| $200,000+ | 0 | 0.0% |
Family Income by Famaliy Size in Olmito and Olmito
| Income Bracket | # Families | Median Income |
| 2-Person Families | 40 (52.6%) | $0 |
| 3-Person Families | 0 (0.0%) | $0 |
| 4-Person Families | 0 (0.0%) | $0 |
| 5-Person Families | 36 (47.4%) | $0 |
| 6-Person Families | 0 (0.0%) | $0 |
| 7+ Person Families | 0 (0.0%) | $0 |
| Total | 76 (100.0%) | $41,944 |
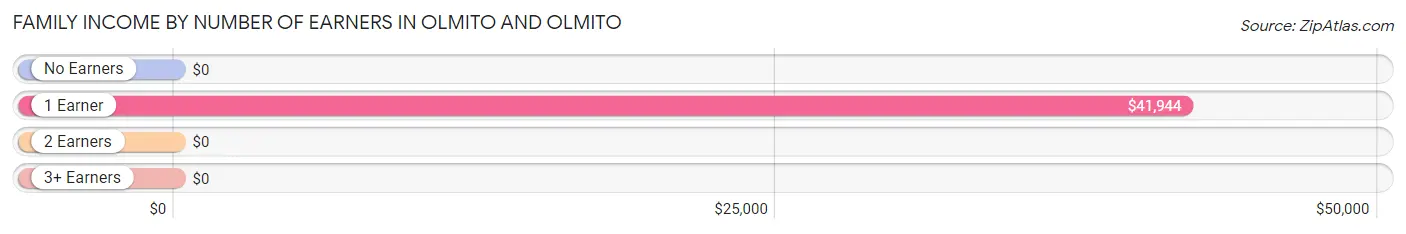
Family Income by Number of Earners in Olmito and Olmito
| Number of Earners | # Families | Median Income |
| No Earners | 0 (0.0%) | $0 |
| 1 Earner | 76 (100.0%) | $41,944 |
| 2 Earners | 0 (0.0%) | $0 |
| 3+ Earners | 0 (0.0%) | $0 |
| Total | 76 (100.0%) | $41,944 |
Household Income in Olmito and Olmito
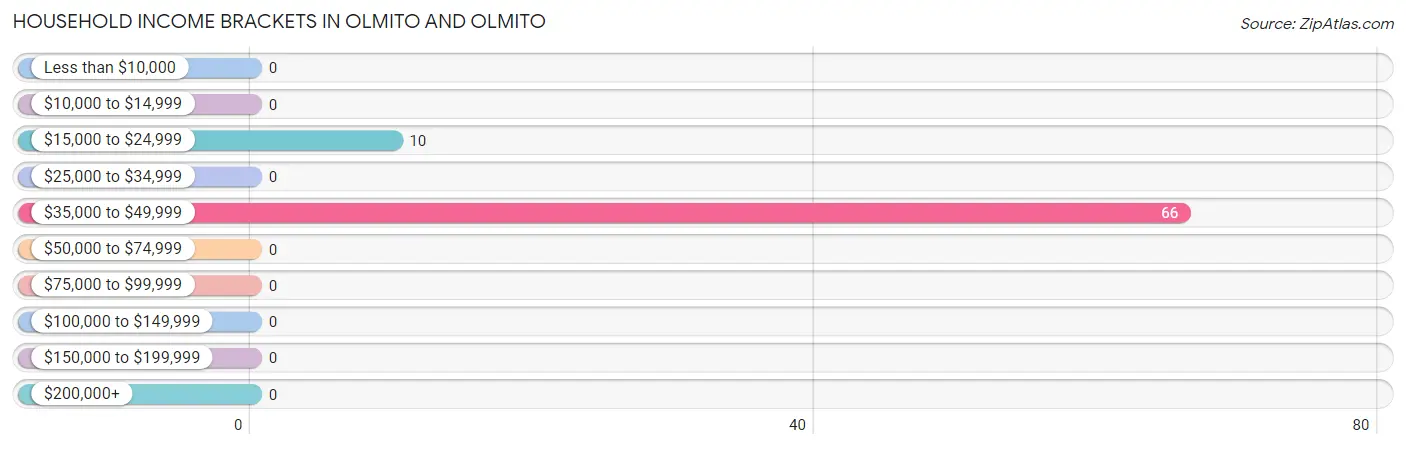
Household Income Brackets in Olmito and Olmito
With 66 households falling in the category, the $35,000 to $49,999 income range is the most frequent in Olmito and Olmito, accounting for 86.8% of all households.
| Income Bracket | # Households | % Households |
| Less than $10,000 | 0 | 0.0% |
| $10,000 to $14,999 | 0 | 0.0% |
| $15,000 to $24,999 | 10 | 13.2% |
| $25,000 to $34,999 | 0 | 0.0% |
| $35,000 to $49,999 | 66 | 86.8% |
| $50,000 to $74,999 | 0 | 0.0% |
| $75,000 to $99,999 | 0 | 0.0% |
| $100,000 to $149,999 | 0 | 0.0% |
| $150,000 to $199,999 | 0 | 0.0% |
| $200,000+ | 0 | 0.0% |
Household Income by Householder Age in Olmito and Olmito
| Income Bracket | # Households | Median Income |
| 15 to 24 Years | 30 (39.5%) | $0 |
| 25 to 44 Years | 36 (47.4%) | $0 |
| 45 to 64 Years | 10 (13.2%) | $0 |
| 65+ Years | 0 (0.0%) | $0 |
| Total | 76 (100.0%) | $41,944 |
Poverty in Olmito and Olmito
Income Below Poverty by Sex and Age in Olmito and Olmito
| Age Bracket | Male | Female |
| Under 5 Years | 0 (0.0%) | 0 (0.0%) |
| 5 Years | 0 (0.0%) | 0 (0.0%) |
| 6 to 11 Years | 0 (0.0%) | 0 (0.0%) |
| 12 to 14 Years | 0 (0.0%) | 0 (0.0%) |
| 15 Years | 0 (0.0%) | 0 (0.0%) |
| 16 and 17 Years | 0 (0.0%) | 0 (0.0%) |
| 18 to 24 Years | 0 (0.0%) | 0 (0.0%) |
| 25 to 34 Years | 0 (0.0%) | 0 (0.0%) |
| 35 to 44 Years | 0 (0.0%) | 0 (0.0%) |
| 45 to 54 Years | 0 (0.0%) | 0 (0.0%) |
| 55 to 64 Years | 0 (0.0%) | 0 (0.0%) |
| 65 to 74 Years | 0 (0.0%) | 0 (0.0%) |
| 75 Years and over | 0 (0.0%) | 0 (0.0%) |
| Total | 0 (0.0%) | 0 (0.0%) |
Income Above Poverty by Sex and Age in Olmito and Olmito
According to the poverty statistics in Olmito and Olmito, males aged under 5 years and females aged under 5 years are the age groups that are most secure financially, with 100.0% of males and 100.0% of females in these age groups living above the poverty line.
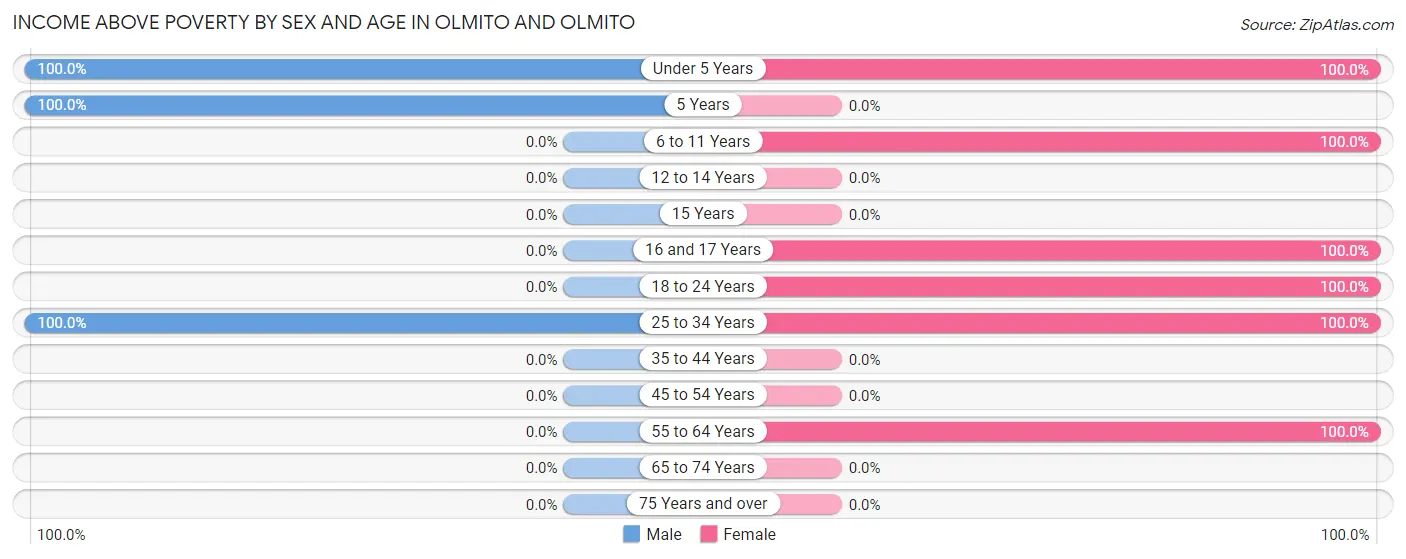
| Age Bracket | Male | Female |
| Under 5 Years | 10 (100.0%) | 54 (100.0%) |
| 5 Years | 47 (100.0%) | 0 (0.0%) |
| 6 to 11 Years | 0 (0.0%) | 41 (100.0%) |
| 12 to 14 Years | 0 (0.0%) | 0 (0.0%) |
| 15 Years | 0 (0.0%) | 0 (0.0%) |
| 16 and 17 Years | 0 (0.0%) | 10 (100.0%) |
| 18 to 24 Years | 0 (0.0%) | 30 (100.0%) |
| 25 to 34 Years | 46 (100.0%) | 36 (100.0%) |
| 35 to 44 Years | 0 (0.0%) | 0 (0.0%) |
| 45 to 54 Years | 0 (0.0%) | 0 (0.0%) |
| 55 to 64 Years | 0 (0.0%) | 10 (100.0%) |
| 65 to 74 Years | 0 (0.0%) | 0 (0.0%) |
| 75 Years and over | 0 (0.0%) | 0 (0.0%) |
| Total | 103 (100.0%) | 181 (100.0%) |
Income Below Poverty Among Married-Couple Families in Olmito and Olmito
| Children | Above Poverty | Below Poverty |
| No Children | 0 (0.0%) | 0 (0.0%) |
| 1 or 2 Children | 0 (0.0%) | 0 (0.0%) |
| 3 or 4 Children | 36 (100.0%) | 0 (0.0%) |
| 5 or more Children | 0 (0.0%) | 0 (0.0%) |
| Total | 36 (100.0%) | 0 (0.0%) |
Income Below Poverty Among Single-Parent Households in Olmito and Olmito
| Children | Single Father | Single Mother |
| No Children | 0 (0.0%) | 0 (0.0%) |
| 1 or 2 Children | 0 (0.0%) | 0 (0.0%) |
| 3 or 4 Children | 0 (0.0%) | 0 (0.0%) |
| 5 or more Children | 0 (0.0%) | 0 (0.0%) |
| Total | 0 (0.0%) | 0 (0.0%) |
Income Below Poverty Among Married-Couple vs Single-Parent Households in Olmito and Olmito
| Children | Married-Couple Families | Single-Parent Households |
| No Children | 0 (0.0%) | 0 (0.0%) |
| 1 or 2 Children | 0 (0.0%) | 0 (0.0%) |
| 3 or 4 Children | 0 (0.0%) | 0 (0.0%) |
| 5 or more Children | 0 (0.0%) | 0 (0.0%) |
| Total | 0 (0.0%) | 0 (0.0%) |
Race in Olmito and Olmito
The most populous races in Olmito and Olmito are Hispanic or Latino (284 | 100.0%), White / Caucasian (244 | 85.9%), and Two or more Races (40 | 14.1%).

| Race | # Population | % Population |
| Asian | 0 | 0.0% |
| Black / African American | 0 | 0.0% |
| Hawaiian / Pacific | 0 | 0.0% |
| Hispanic or Latino | 284 | 100.0% |
| Native / Alaskan | 0 | 0.0% |
| White / Caucasian | 244 | 85.9% |
| Two or more Races | 40 | 14.1% |
| Some other Race | 0 | 0.0% |
| Total | 284 | 100.0% |
Ancestry in Olmito and Olmito
The most populous ancestries reported in Olmito and Olmito are , and Mexican (284 | 100.0%), together accounting for 100.0% of all Olmito and Olmito residents.

| Ancestry | # Population | % Population |
| Mexican | 284 | 100.0% | View All 1 Rows |
Immigrants in Olmito and Olmito
The most numerous immigrant groups reported in Olmito and Olmito came from Central America (56 | 19.7%), Latin America (56 | 19.7%), and Mexico (56 | 19.7%), together accounting for 59.2% of all Olmito and Olmito residents.
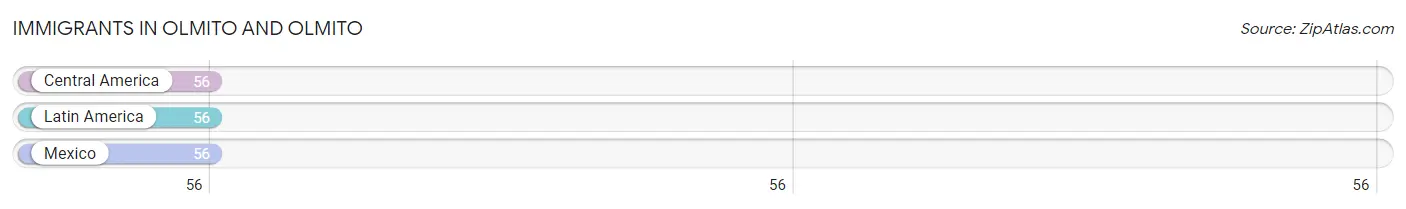
| Immigration Origin | # Population | % Population |
| Central America | 56 | 19.7% |
| Latin America | 56 | 19.7% |
| Mexico | 56 | 19.7% | View All 3 Rows |
Sex and Age in Olmito and Olmito
Sex and Age in Olmito and Olmito
The most populous age groups in Olmito and Olmito are 5 to 9 Years (47 | 45.6%) for men and Under 5 Years (54 | 29.8%) for women.
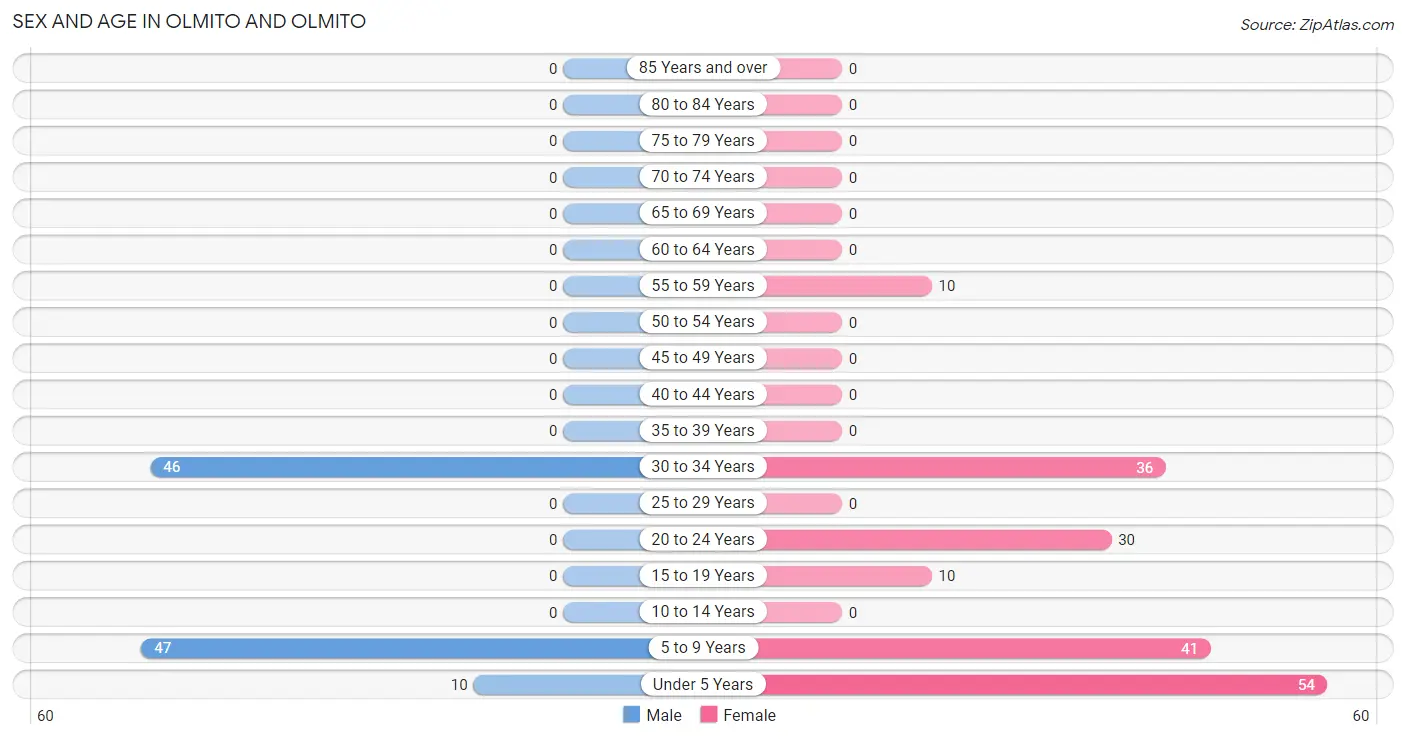
| Age Bracket | Male | Female |
| Under 5 Years | 10 (9.7%) | 54 (29.8%) |
| 5 to 9 Years | 47 (45.6%) | 41 (22.7%) |
| 10 to 14 Years | 0 (0.0%) | 0 (0.0%) |
| 15 to 19 Years | 0 (0.0%) | 10 (5.5%) |
| 20 to 24 Years | 0 (0.0%) | 30 (16.6%) |
| 25 to 29 Years | 0 (0.0%) | 0 (0.0%) |
| 30 to 34 Years | 46 (44.7%) | 36 (19.9%) |
| 35 to 39 Years | 0 (0.0%) | 0 (0.0%) |
| 40 to 44 Years | 0 (0.0%) | 0 (0.0%) |
| 45 to 49 Years | 0 (0.0%) | 0 (0.0%) |
| 50 to 54 Years | 0 (0.0%) | 0 (0.0%) |
| 55 to 59 Years | 0 (0.0%) | 10 (5.5%) |
| 60 to 64 Years | 0 (0.0%) | 0 (0.0%) |
| 65 to 69 Years | 0 (0.0%) | 0 (0.0%) |
| 70 to 74 Years | 0 (0.0%) | 0 (0.0%) |
| 75 to 79 Years | 0 (0.0%) | 0 (0.0%) |
| 80 to 84 Years | 0 (0.0%) | 0 (0.0%) |
| 85 Years and over | 0 (0.0%) | 0 (0.0%) |
| Total | 103 (100.0%) | 181 (100.0%) |
Families and Households in Olmito and Olmito
Median Family Size in Olmito and Olmito
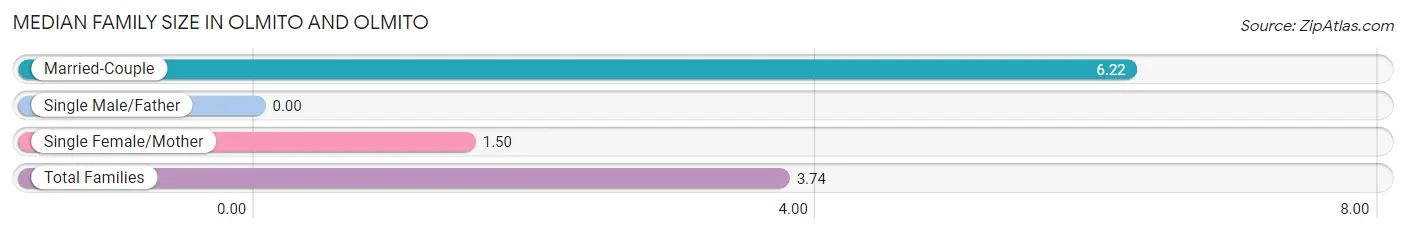
| Family Type | # Families | Family Size |
| Married-Couple | 36 (47.4%) | 6.22 |
| Single Male/Father | 0 (0.0%) | - |
| Single Female/Mother | 40 (52.6%) | 1.50 |
| Total Families | 76 (100.0%) | 3.74 |
Median Household Size in Olmito and Olmito
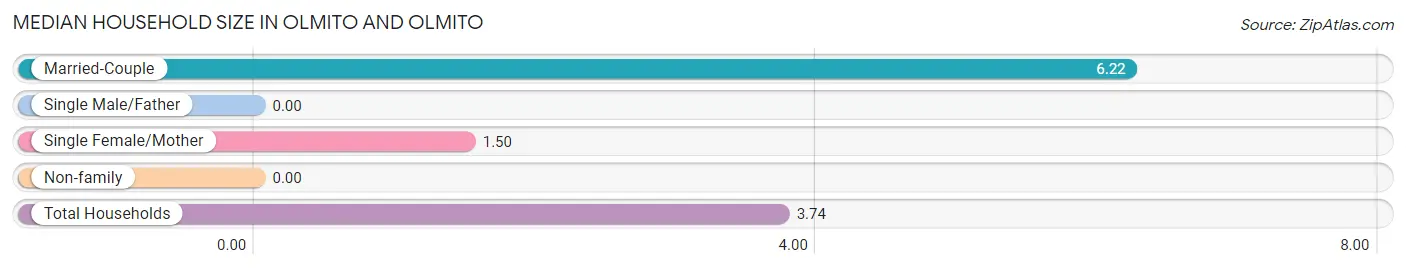
| Household Type | # Households | Household Size |
| Married-Couple | 36 (47.4%) | 6.22 |
| Single Male/Father | 0 (0.0%) | - |
| Single Female/Mother | 40 (52.6%) | 1.50 |
| Non-family | 0 (0.0%) | - |
| Total Households | 76 (100.0%) | 3.74 |
Household Size by Marriage Status in Olmito and Olmito
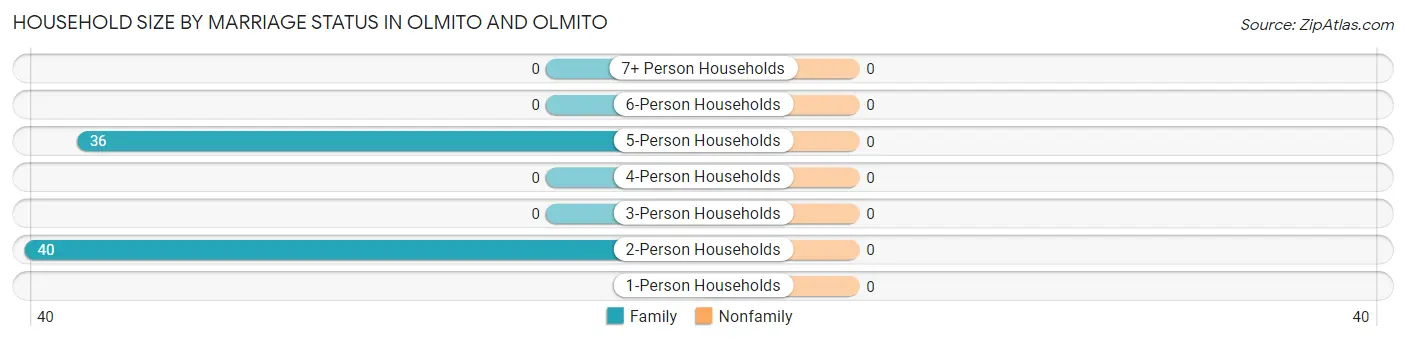
| Household Size | Family Households | Nonfamily Households |
| 1-Person Households | - | 0 (0.0%) |
| 2-Person Households | 40 (52.6%) | 0 (0.0%) |
| 3-Person Households | 0 (0.0%) | 0 (0.0%) |
| 4-Person Households | 0 (0.0%) | 0 (0.0%) |
| 5-Person Households | 36 (47.4%) | 0 (0.0%) |
| 6-Person Households | 0 (0.0%) | 0 (0.0%) |
| 7+ Person Households | 0 (0.0%) | 0 (0.0%) |
| Total | 76 (100.0%) | 0 (0.0%) |
Female Fertility in Olmito and Olmito
Fertility by Age in Olmito and Olmito
Average fertility rate in Olmito and Olmito is 474.0 births per 1,000 women. Women in the age bracket of 20 to 34 years have the highest fertility rate with 545.0 births per 1,000 women. Women in the age bracket of 20 to 34 years acount for 100.0% of all women with births.
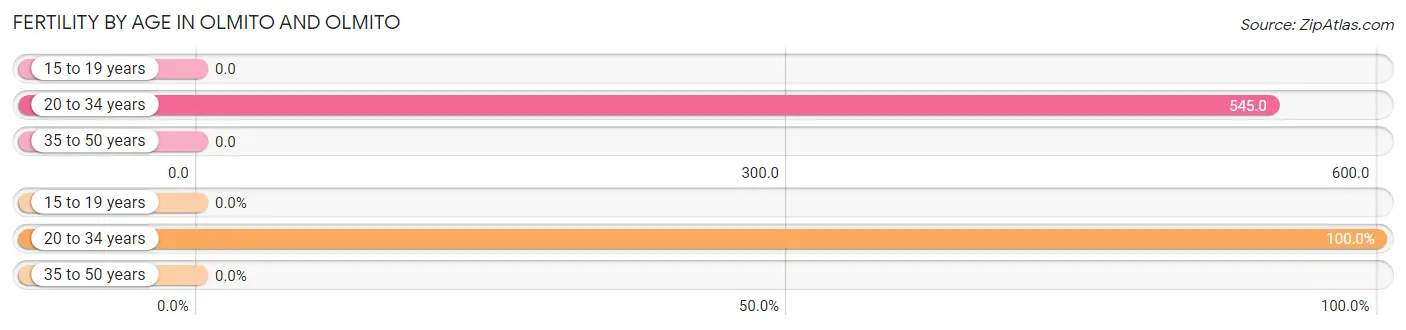
| Age Bracket | Women with Births | Births / 1,000 Women |
| 15 to 19 years | 0 (0.0%) | 0.0 |
| 20 to 34 years | 36 (100.0%) | 545.0 |
| 35 to 50 years | 0 (0.0%) | 0.0 |
| Total | 36 (100.0%) | 474.0 |
Fertility by Age by Marriage Status in Olmito and Olmito
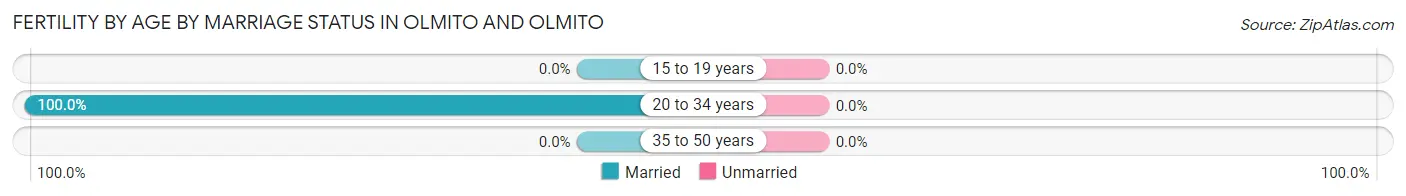
| Age Bracket | Married | Unmarried |
| 15 to 19 years | 0 (0.0%) | 0 (0.0%) |
| 20 to 34 years | 36 (100.0%) | 0 (0.0%) |
| 35 to 50 years | 0 (0.0%) | 0 (0.0%) |
| Total | 36 (100.0%) | 0 (0.0%) |
Fertility by Education in Olmito and Olmito
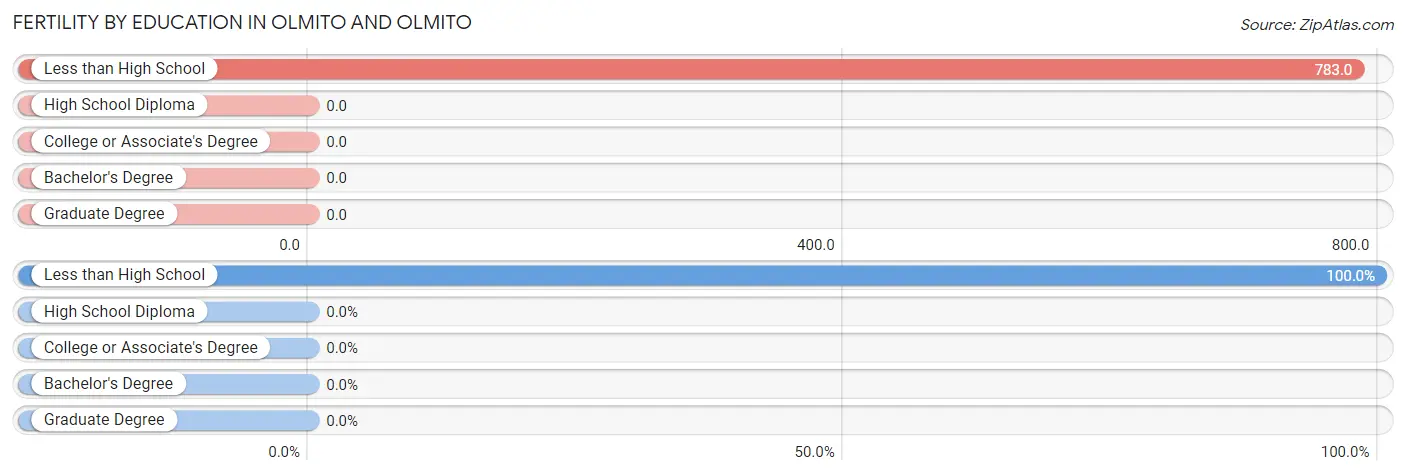
| Educational Attainment | Women with Births | Births / 1,000 Women |
| Less than High School | 36 (100.0%) | 783.0 |
| High School Diploma | 0 (0.0%) | 0.0 |
| College or Associate's Degree | 0 (0.0%) | 0.0 |
| Bachelor's Degree | 0 (0.0%) | 0.0 |
| Graduate Degree | 0 (0.0%) | 0.0 |
| Total | 36 (100.0%) | 474.0 |
Fertility by Education by Marriage Status in Olmito and Olmito
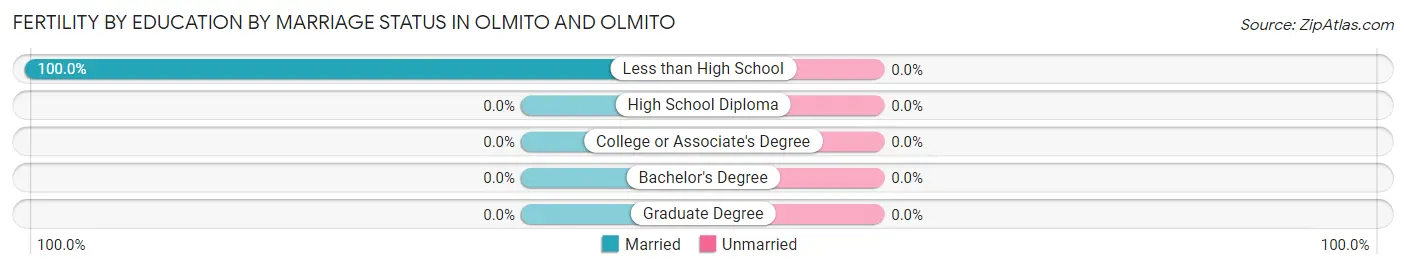
| Educational Attainment | Married | Unmarried |
| Less than High School | 36 (100.0%) | 0 (0.0%) |
| High School Diploma | 0 (0.0%) | 0 (0.0%) |
| College or Associate's Degree | 0 (0.0%) | 0 (0.0%) |
| Bachelor's Degree | 0 (0.0%) | 0 (0.0%) |
| Graduate Degree | 0 (0.0%) | 0 (0.0%) |
| Total | 36 (100.0%) | 0 (0.0%) |
Employment Characteristics in Olmito and Olmito
Employment by Class of Employer in Olmito and Olmito
Among the 86 employed individuals in Olmito and Olmito, , and private company employees (86 | 100.0%) make up the most common classes of employment.
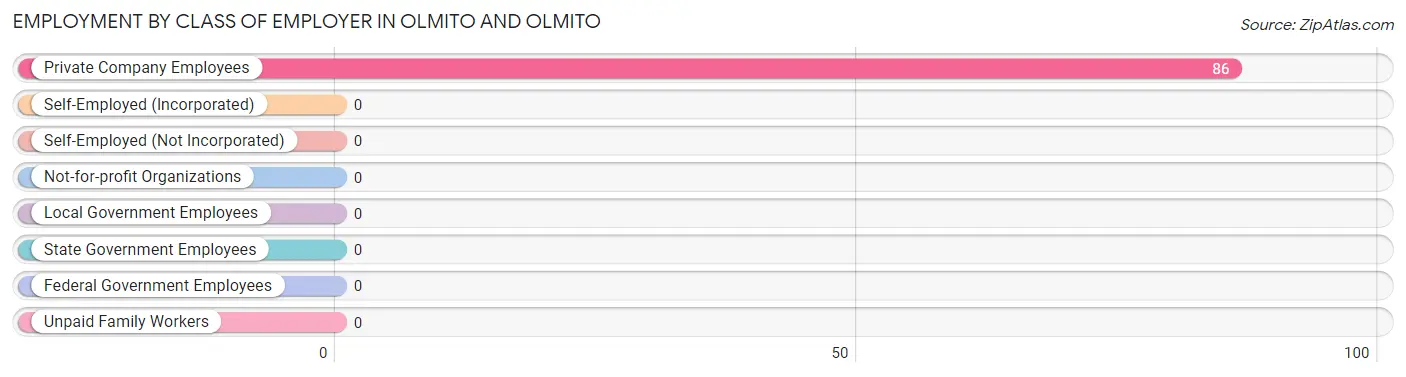
| Employer Class | # Employees | % Employees |
| Private Company Employees | 86 | 100.0% |
| Self-Employed (Incorporated) | 0 | 0.0% |
| Self-Employed (Not Incorporated) | 0 | 0.0% |
| Not-for-profit Organizations | 0 | 0.0% |
| Local Government Employees | 0 | 0.0% |
| State Government Employees | 0 | 0.0% |
| Federal Government Employees | 0 | 0.0% |
| Unpaid Family Workers | 0 | 0.0% |
| Total | 86 | 100.0% |
Employment Status by Age in Olmito and Olmito
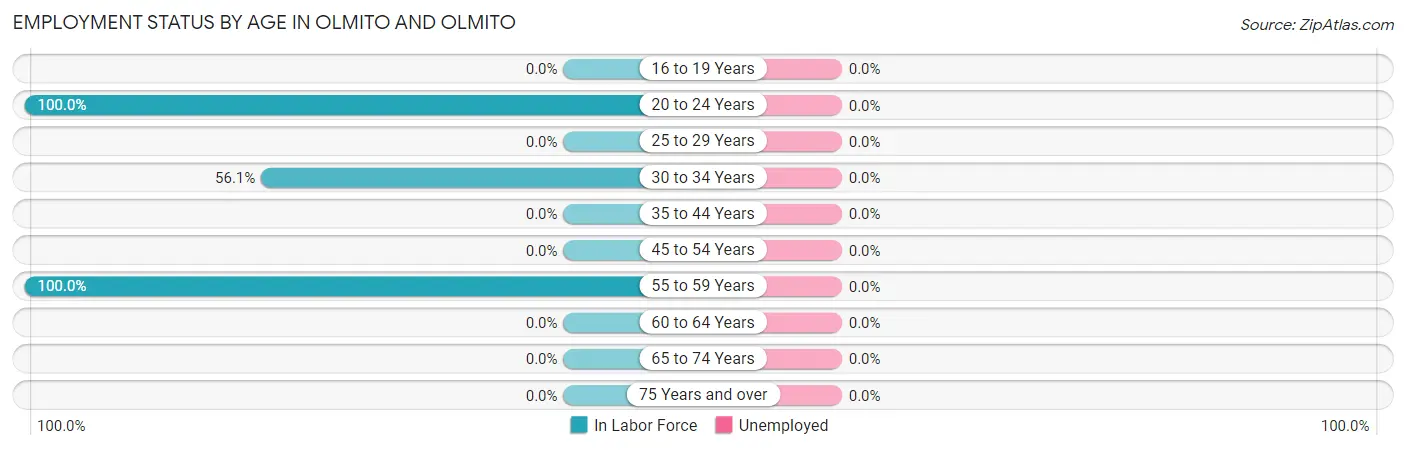
| Age Bracket | In Labor Force | Unemployed |
| 16 to 19 Years | 0 (0.0%) | 0 (0.0%) |
| 20 to 24 Years | 30 (100.0%) | 0 (0.0%) |
| 25 to 29 Years | 0 (0.0%) | 0 (0.0%) |
| 30 to 34 Years | 46 (56.1%) | 0 (0.0%) |
| 35 to 44 Years | 0 (0.0%) | 0 (0.0%) |
| 45 to 54 Years | 0 (0.0%) | 0 (0.0%) |
| 55 to 59 Years | 10 (100.0%) | 0 (0.0%) |
| 60 to 64 Years | 0 (0.0%) | 0 (0.0%) |
| 65 to 74 Years | 0 (0.0%) | 0 (0.0%) |
| 75 Years and over | 0 (0.0%) | 0 (0.0%) |
| Total | 86 (65.2%) | 0 (0.0%) |
Employment Status by Educational Attainment in Olmito and Olmito
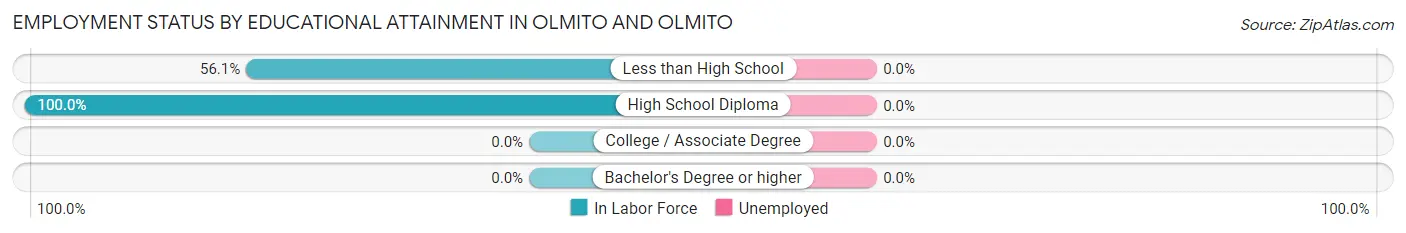
| Educational Attainment | In Labor Force | Unemployed |
| Less than High School | 46 (56.1%) | 0 (0.0%) |
| High School Diploma | 10 (100.0%) | 0 (0.0%) |
| College / Associate Degree | 0 (0.0%) | 0 (0.0%) |
| Bachelor's Degree or higher | 0 (0.0%) | 0 (0.0%) |
| Total | 56 (60.9%) | 0 (0.0%) |
Employment Occupations by Sex in Olmito and Olmito
Management, Business, Science and Arts Occupations
Management, Business, Science and Arts Occupations by Sex
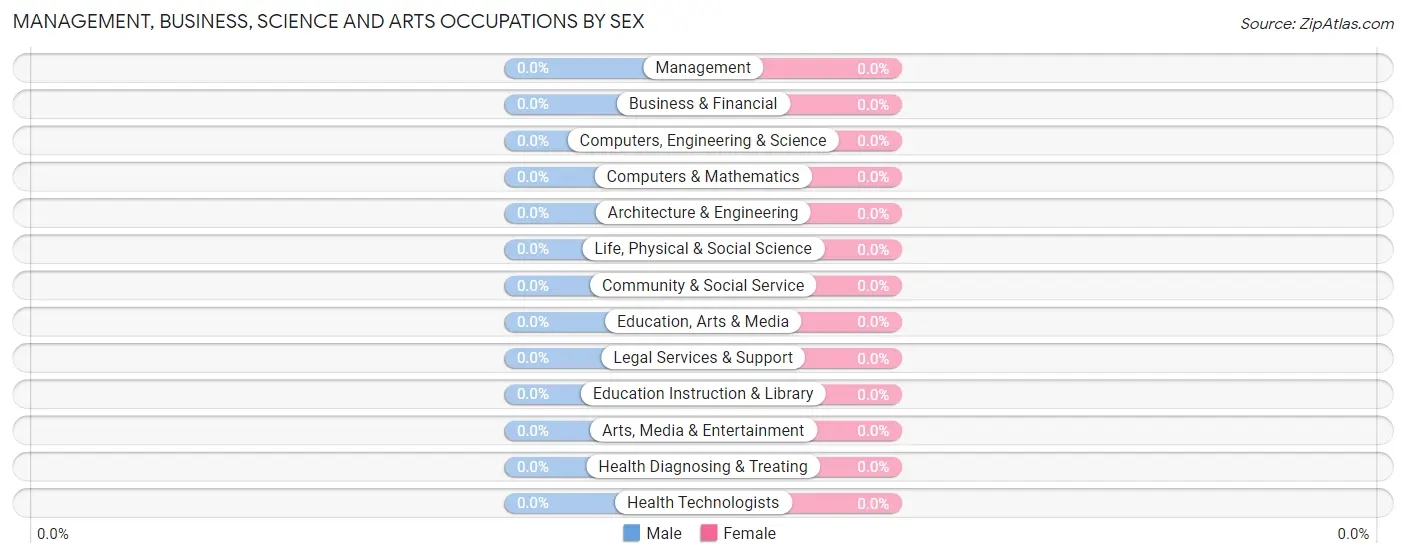
| Occupation | Male | Female |
| Management | 0 (0.0%) | 0 (0.0%) |
| Business & Financial | 0 (0.0%) | 0 (0.0%) |
| Computers, Engineering & Science | 0 (0.0%) | 0 (0.0%) |
| Computers & Mathematics | 0 (0.0%) | 0 (0.0%) |
| Architecture & Engineering | 0 (0.0%) | 0 (0.0%) |
| Life, Physical & Social Science | 0 (0.0%) | 0 (0.0%) |
| Community & Social Service | 0 (0.0%) | 0 (0.0%) |
| Education, Arts & Media | 0 (0.0%) | 0 (0.0%) |
| Legal Services & Support | 0 (0.0%) | 0 (0.0%) |
| Education Instruction & Library | 0 (0.0%) | 0 (0.0%) |
| Arts, Media & Entertainment | 0 (0.0%) | 0 (0.0%) |
| Health Diagnosing & Treating | 0 (0.0%) | 0 (0.0%) |
| Health Technologists | 0 (0.0%) | 0 (0.0%) |
| Total (Category) | 0 (0.0%) | 0 (0.0%) |
| Total (Overall) | 46 (53.5%) | 40 (46.5%) |
Services Occupations
The most common Services occupations in Olmito and Olmito are Personal Care & Service (30 | 34.9%), and Healthcare Support (10 | 11.6%).
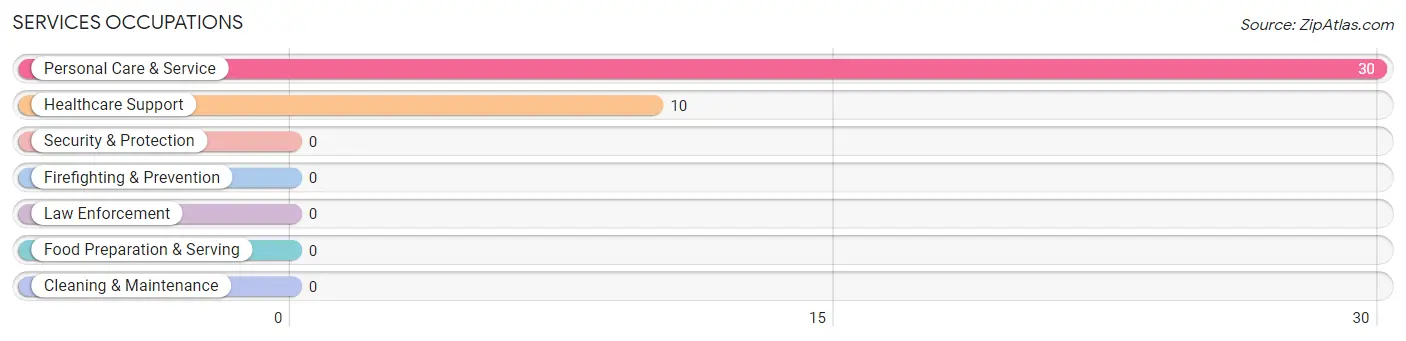
Services Occupations by Sex
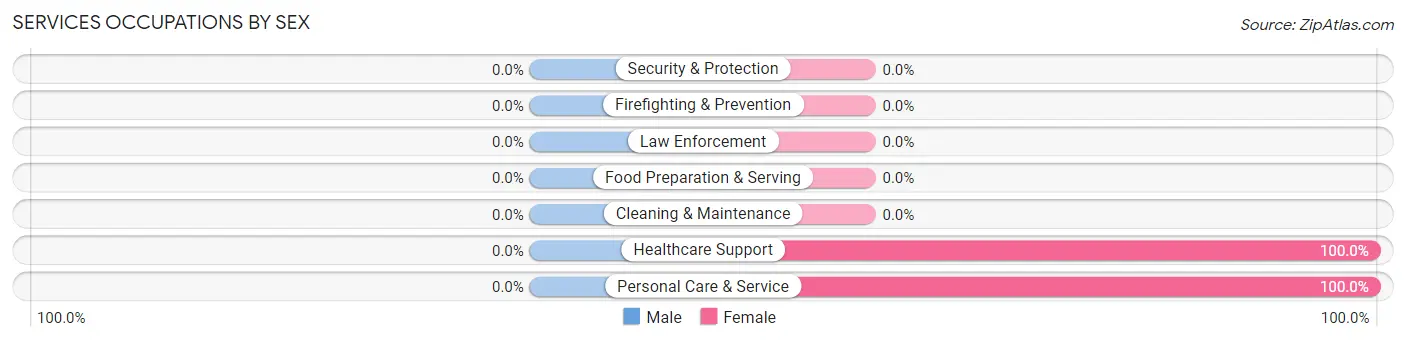
| Occupation | Male | Female |
| Healthcare Support | 0 (0.0%) | 10 (100.0%) |
| Security & Protection | 0 (0.0%) | 0 (0.0%) |
| Firefighting & Prevention | 0 (0.0%) | 0 (0.0%) |
| Law Enforcement | 0 (0.0%) | 0 (0.0%) |
| Food Preparation & Serving | 0 (0.0%) | 0 (0.0%) |
| Cleaning & Maintenance | 0 (0.0%) | 0 (0.0%) |
| Personal Care & Service | 0 (0.0%) | 30 (100.0%) |
| Total (Category) | 0 (0.0%) | 40 (100.0%) |
| Total (Overall) | 46 (53.5%) | 40 (46.5%) |
Sales and Office Occupations
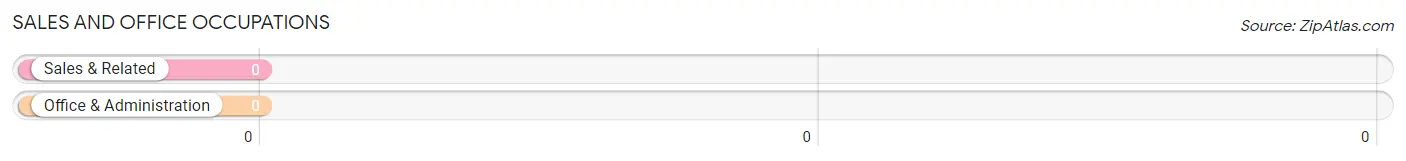
Sales and Office Occupations by Sex
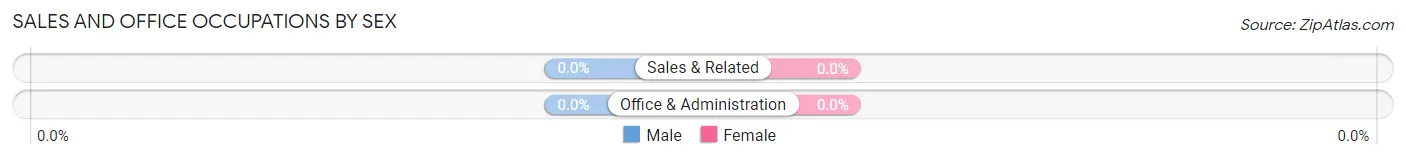
| Occupation | Male | Female |
| Sales & Related | 0 (0.0%) | 0 (0.0%) |
| Office & Administration | 0 (0.0%) | 0 (0.0%) |
| Total (Category) | 0 (0.0%) | 0 (0.0%) |
| Total (Overall) | 46 (53.5%) | 40 (46.5%) |
Natural Resources, Construction and Maintenance Occupations
The most common Natural Resources, Construction and Maintenance occupations in Olmito and Olmito are , and Construction & Extraction (46 | 53.5%).
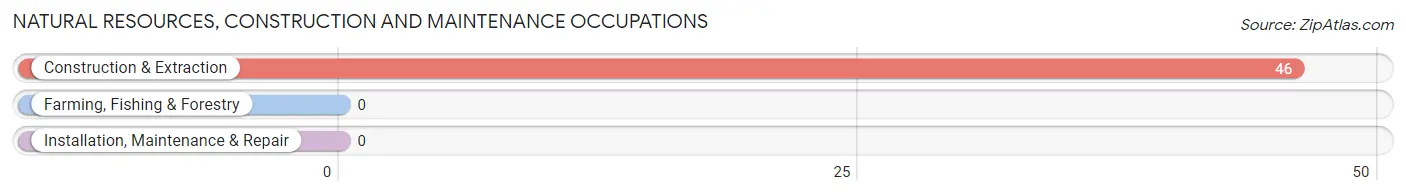
Natural Resources, Construction and Maintenance Occupations by Sex
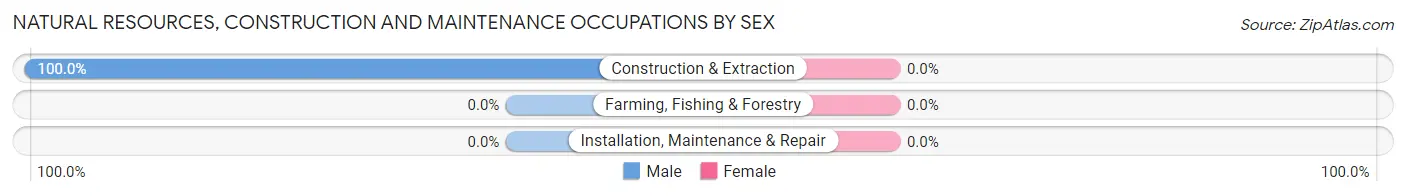
| Occupation | Male | Female |
| Farming, Fishing & Forestry | 0 (0.0%) | 0 (0.0%) |
| Construction & Extraction | 46 (100.0%) | 0 (0.0%) |
| Installation, Maintenance & Repair | 0 (0.0%) | 0 (0.0%) |
| Total (Category) | 46 (100.0%) | 0 (0.0%) |
| Total (Overall) | 46 (53.5%) | 40 (46.5%) |
Production, Transportation and Moving Occupations
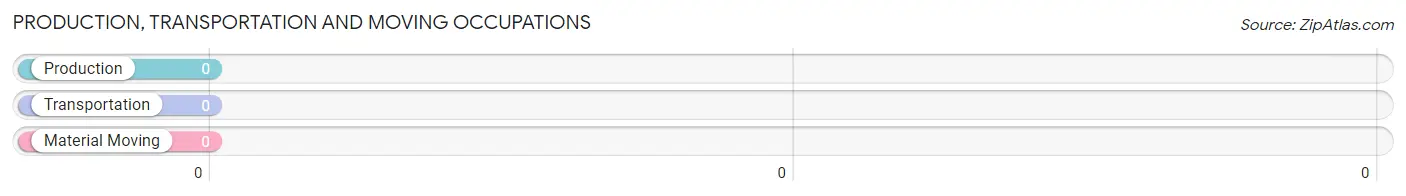
Production, Transportation and Moving Occupations by Sex
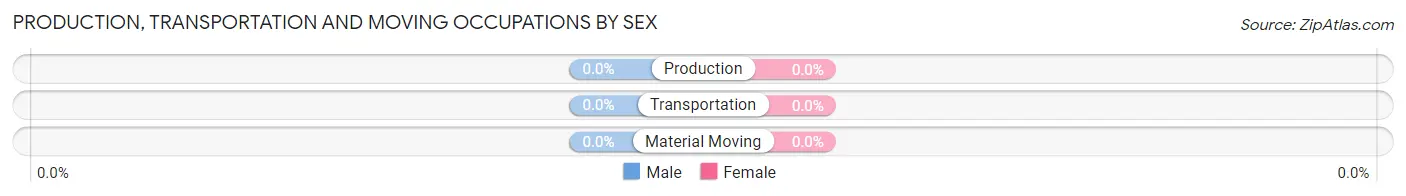
| Occupation | Male | Female |
| Production | 0 (0.0%) | 0 (0.0%) |
| Transportation | 0 (0.0%) | 0 (0.0%) |
| Material Moving | 0 (0.0%) | 0 (0.0%) |
| Total (Category) | 0 (0.0%) | 0 (0.0%) |
| Total (Overall) | 46 (53.5%) | 40 (46.5%) |
Employment Industries by Sex in Olmito and Olmito
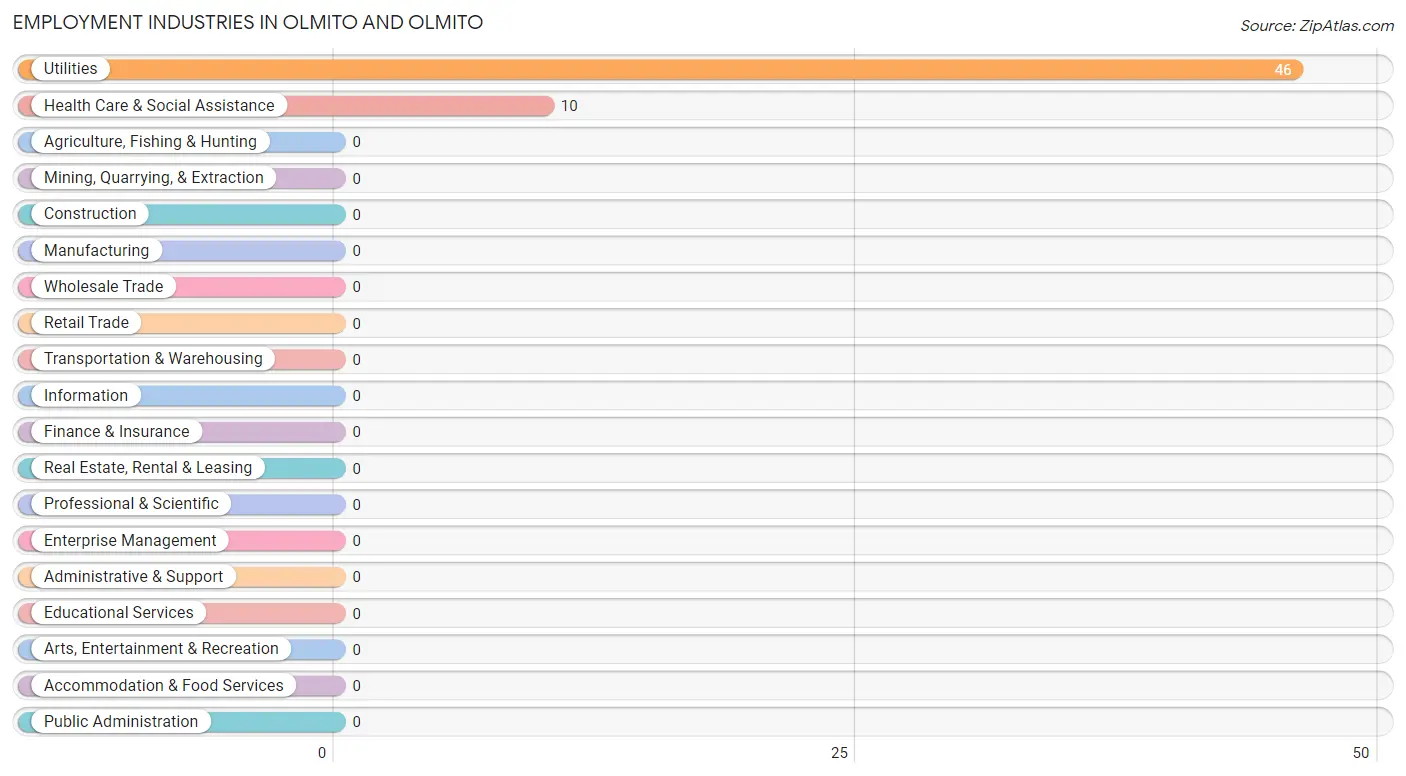
Employment Industries in Olmito and Olmito
The major employment industries in Olmito and Olmito include Utilities (46 | 53.5%), and Health Care & Social Assistance (10 | 11.6%).
Employment Industries by Sex in Olmito and Olmito
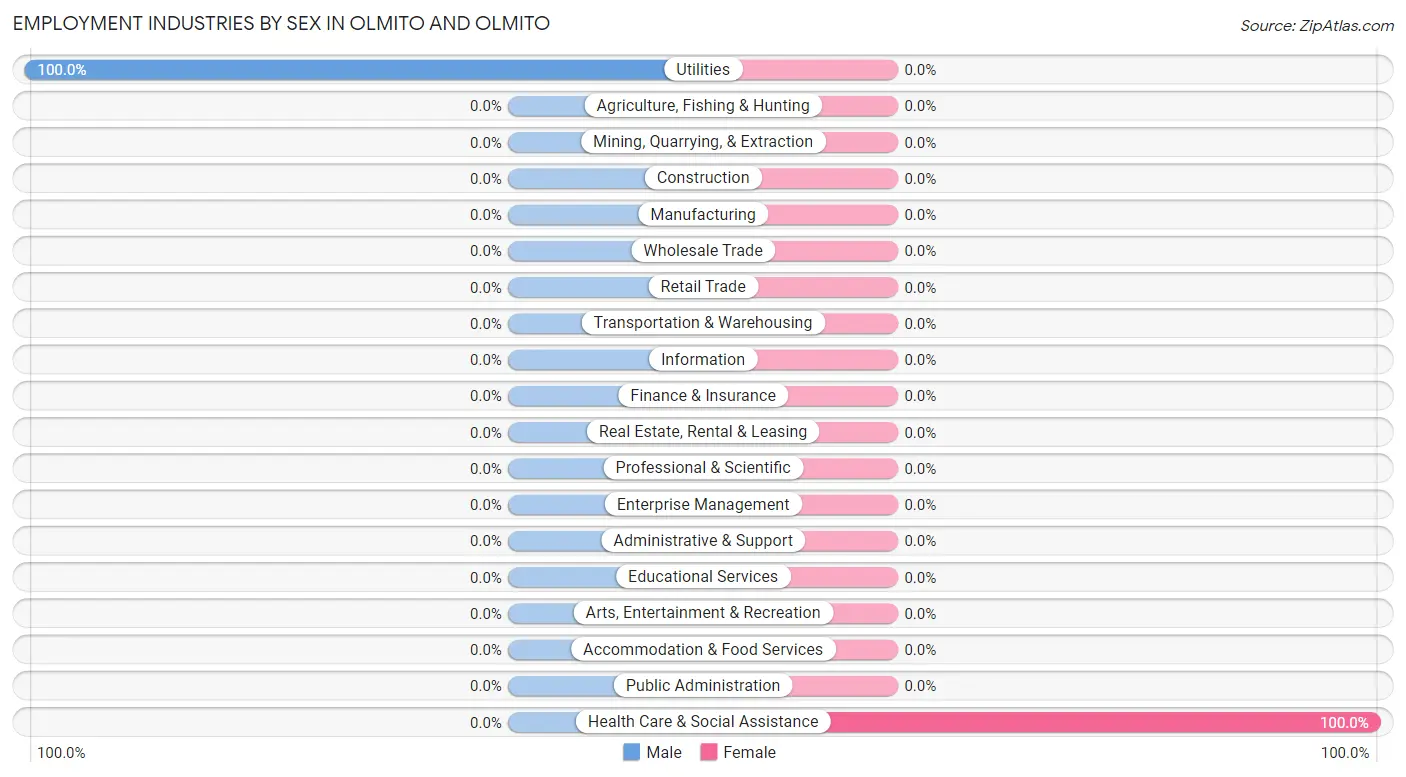
| Industry | Male | Female |
| Agriculture, Fishing & Hunting | 0 (0.0%) | 0 (0.0%) |
| Mining, Quarrying, & Extraction | 0 (0.0%) | 0 (0.0%) |
| Construction | 0 (0.0%) | 0 (0.0%) |
| Manufacturing | 0 (0.0%) | 0 (0.0%) |
| Wholesale Trade | 0 (0.0%) | 0 (0.0%) |
| Retail Trade | 0 (0.0%) | 0 (0.0%) |
| Transportation & Warehousing | 0 (0.0%) | 0 (0.0%) |
| Utilities | 46 (100.0%) | 0 (0.0%) |
| Information | 0 (0.0%) | 0 (0.0%) |
| Finance & Insurance | 0 (0.0%) | 0 (0.0%) |
| Real Estate, Rental & Leasing | 0 (0.0%) | 0 (0.0%) |
| Professional & Scientific | 0 (0.0%) | 0 (0.0%) |
| Enterprise Management | 0 (0.0%) | 0 (0.0%) |
| Administrative & Support | 0 (0.0%) | 0 (0.0%) |
| Educational Services | 0 (0.0%) | 0 (0.0%) |
| Health Care & Social Assistance | 0 (0.0%) | 10 (100.0%) |
| Arts, Entertainment & Recreation | 0 (0.0%) | 0 (0.0%) |
| Accommodation & Food Services | 0 (0.0%) | 0 (0.0%) |
| Public Administration | 0 (0.0%) | 0 (0.0%) |
| Total | 46 (53.5%) | 40 (46.5%) |
Education in Olmito and Olmito
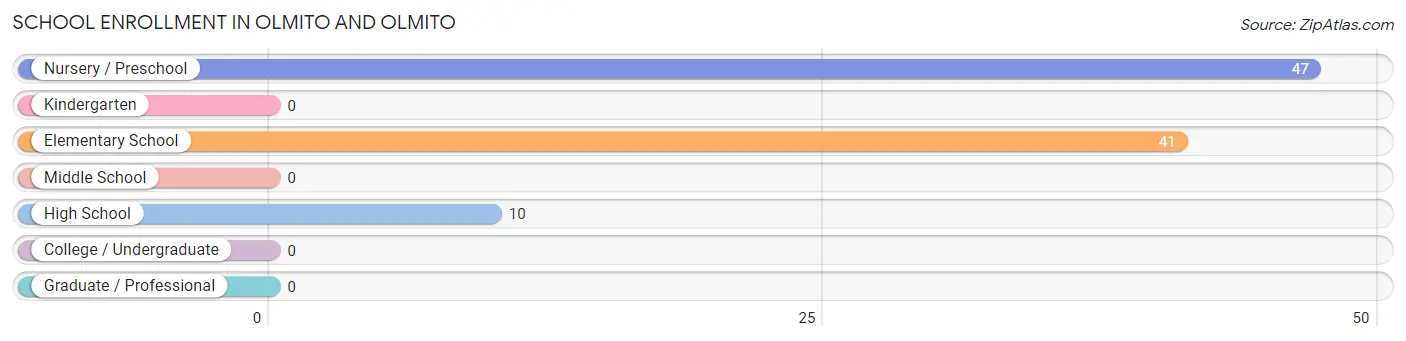
School Enrollment in Olmito and Olmito
The most common levels of schooling among the 98 students in Olmito and Olmito are nursery / preschool (47 | 48.0%), elementary school (41 | 41.8%), and high school (10 | 10.2%).
| School Level | # Students | % Students |
| Nursery / Preschool | 47 | 48.0% |
| Kindergarten | 0 | 0.0% |
| Elementary School | 41 | 41.8% |
| Middle School | 0 | 0.0% |
| High School | 10 | 10.2% |
| College / Undergraduate | 0 | 0.0% |
| Graduate / Professional | 0 | 0.0% |
| Total | 98 | 100.0% |
School Enrollment by Age by Funding Source in Olmito and Olmito
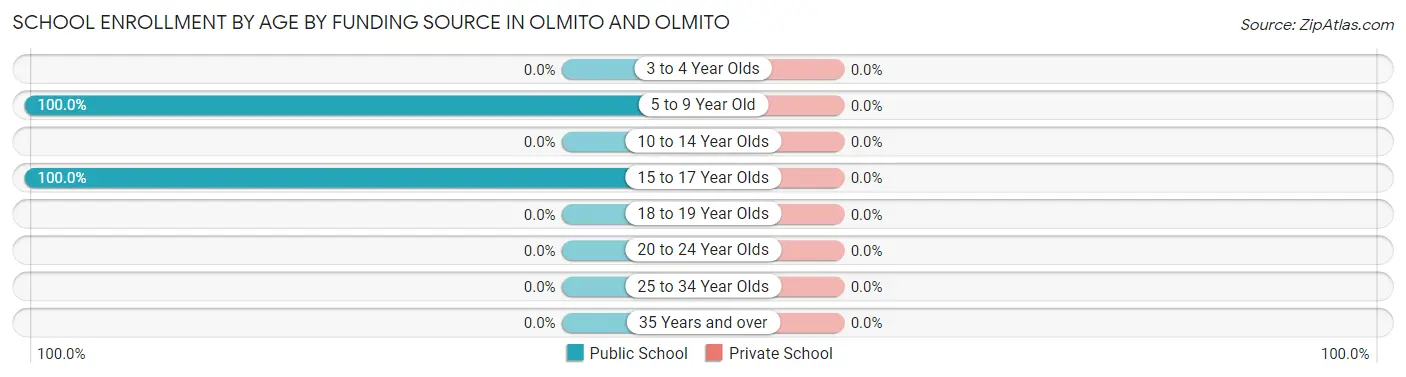
| Age Bracket | Public School | Private School |
| 3 to 4 Year Olds | 0 (0.0%) | 0 (0.0%) |
| 5 to 9 Year Old | 88 (100.0%) | 0 (0.0%) |
| 10 to 14 Year Olds | 0 (0.0%) | 0 (0.0%) |
| 15 to 17 Year Olds | 10 (100.0%) | 0 (0.0%) |
| 18 to 19 Year Olds | 0 (0.0%) | 0 (0.0%) |
| 20 to 24 Year Olds | 0 (0.0%) | 0 (0.0%) |
| 25 to 34 Year Olds | 0 (0.0%) | 0 (0.0%) |
| 35 Years and over | 0 (0.0%) | 0 (0.0%) |
| Total | 98 (100.0%) | 0 (0.0%) |
Educational Attainment by Field of Study in Olmito and Olmito
| Field of Study | # Graduates | % Graduates |
| Computers & Mathematics | 0 | 0.0% |
| Bio, Nature & Agricultural | 0 | 0.0% |
| Physical & Health Sciences | 0 | 0.0% |
| Psychology | 0 | 0.0% |
| Social Sciences | 0 | 0.0% |
| Engineering | 0 | 0.0% |
| Multidisciplinary Studies | 0 | 0.0% |
| Science & Technology | 0 | 0.0% |
| Business | 0 | 0.0% |
| Education | 0 | 0.0% |
| Literature & Languages | 0 | 0.0% |
| Liberal Arts & History | 0 | 0.0% |
| Visual & Performing Arts | 0 | 0.0% |
| Communications | 0 | 0.0% |
| Arts & Humanities | 0 | 0.0% |
| Total | 0 | 0.0% |
Transportation & Commute in Olmito and Olmito
Vehicle Availability by Sex in Olmito and Olmito
The most prevalent vehicle ownership categories in Olmito and Olmito are males with 1 vehicle (46, accounting for 100.0%) and females with 1 vehicle (30, making up 115.0%).
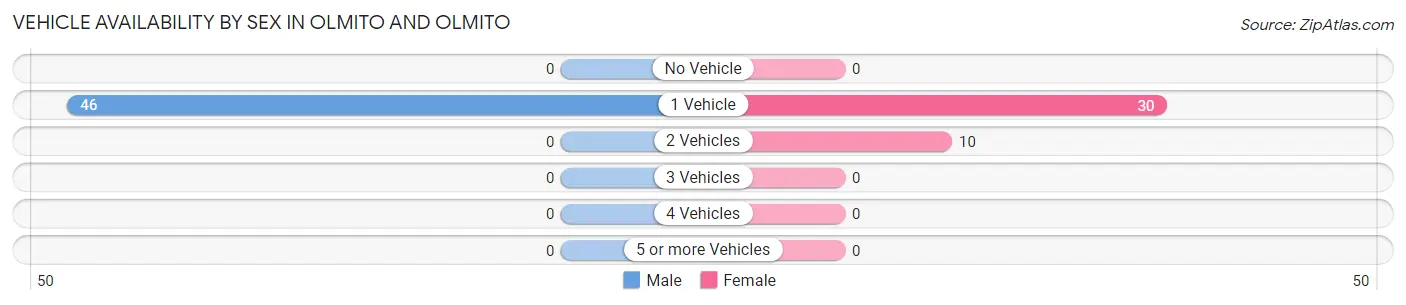
| Vehicles Available | Male | Female |
| No Vehicle | 0 (0.0%) | 0 (0.0%) |
| 1 Vehicle | 46 (100.0%) | 30 (75.0%) |
| 2 Vehicles | 0 (0.0%) | 10 (25.0%) |
| 3 Vehicles | 0 (0.0%) | 0 (0.0%) |
| 4 Vehicles | 0 (0.0%) | 0 (0.0%) |
| 5 or more Vehicles | 0 (0.0%) | 0 (0.0%) |
| Total | 46 (100.0%) | 40 (100.0%) |
Commute Time in Olmito and Olmito
The most frequently occuring commute durations in Olmito and Olmito are 5 to 9 minutes (46 commuters, 53.5%), 25 to 29 minutes (30 commuters, 34.9%), and 60 to 89 minutes (10 commuters, 11.6%).
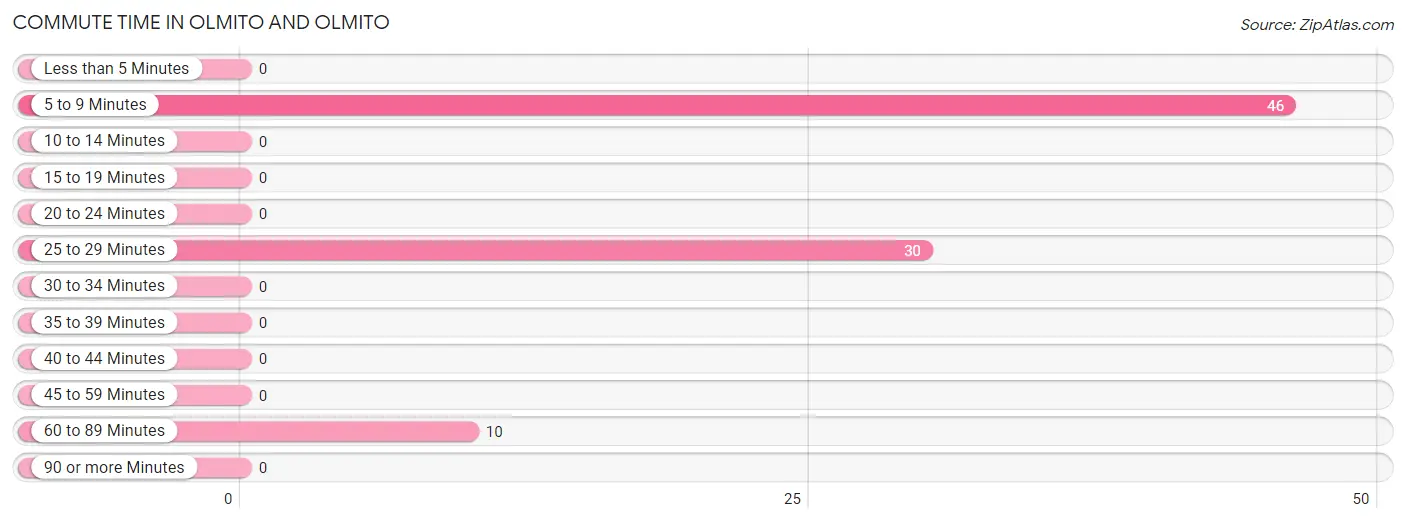
| Commute Time | # Commuters | % Commuters |
| Less than 5 Minutes | 0 | 0.0% |
| 5 to 9 Minutes | 46 | 53.5% |
| 10 to 14 Minutes | 0 | 0.0% |
| 15 to 19 Minutes | 0 | 0.0% |
| 20 to 24 Minutes | 0 | 0.0% |
| 25 to 29 Minutes | 30 | 34.9% |
| 30 to 34 Minutes | 0 | 0.0% |
| 35 to 39 Minutes | 0 | 0.0% |
| 40 to 44 Minutes | 0 | 0.0% |
| 45 to 59 Minutes | 0 | 0.0% |
| 60 to 89 Minutes | 10 | 11.6% |
| 90 or more Minutes | 0 | 0.0% |
Commute Time by Sex in Olmito and Olmito
The most common commute times in Olmito and Olmito are 5 to 9 minutes (46 commuters, 100.0%) for males and 25 to 29 minutes (30 commuters, 75.0%) for females.
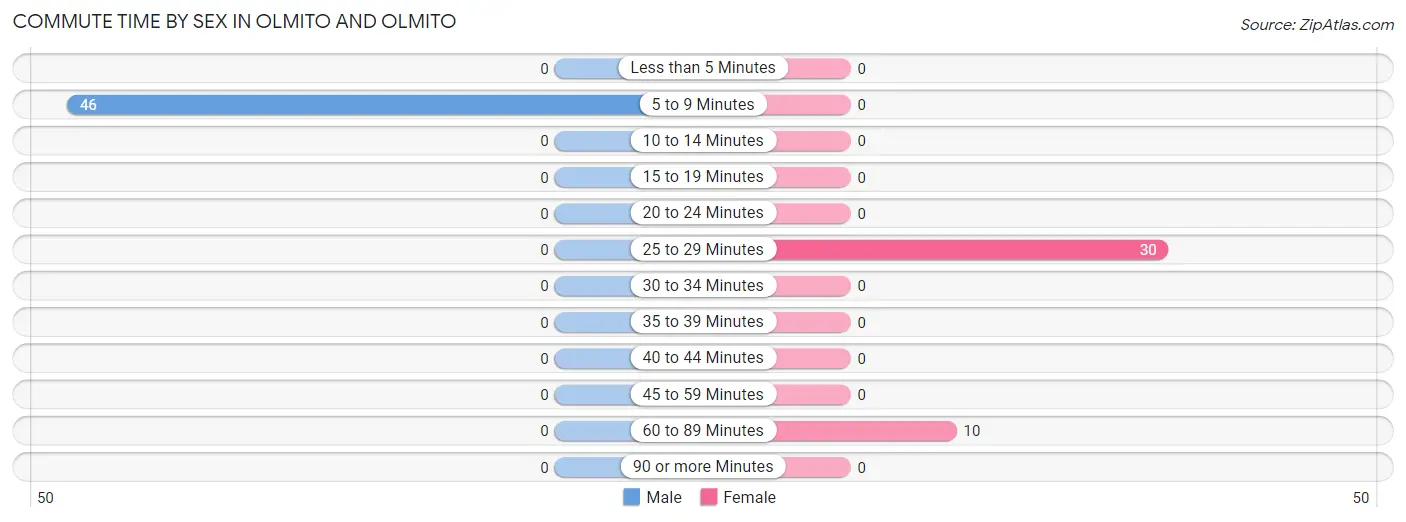
| Commute Time | Male | Female |
| Less than 5 Minutes | 0 (0.0%) | 0 (0.0%) |
| 5 to 9 Minutes | 46 (100.0%) | 0 (0.0%) |
| 10 to 14 Minutes | 0 (0.0%) | 0 (0.0%) |
| 15 to 19 Minutes | 0 (0.0%) | 0 (0.0%) |
| 20 to 24 Minutes | 0 (0.0%) | 0 (0.0%) |
| 25 to 29 Minutes | 0 (0.0%) | 30 (75.0%) |
| 30 to 34 Minutes | 0 (0.0%) | 0 (0.0%) |
| 35 to 39 Minutes | 0 (0.0%) | 0 (0.0%) |
| 40 to 44 Minutes | 0 (0.0%) | 0 (0.0%) |
| 45 to 59 Minutes | 0 (0.0%) | 0 (0.0%) |
| 60 to 89 Minutes | 0 (0.0%) | 10 (25.0%) |
| 90 or more Minutes | 0 (0.0%) | 0 (0.0%) |
Time of Departure to Work by Sex in Olmito and Olmito
The most frequent times of departure to work in Olmito and Olmito are 11:00 AM to 11:59 AM (46, 100.0%) for males and 7:30 AM to 7:59 AM (30, 75.0%) for females.
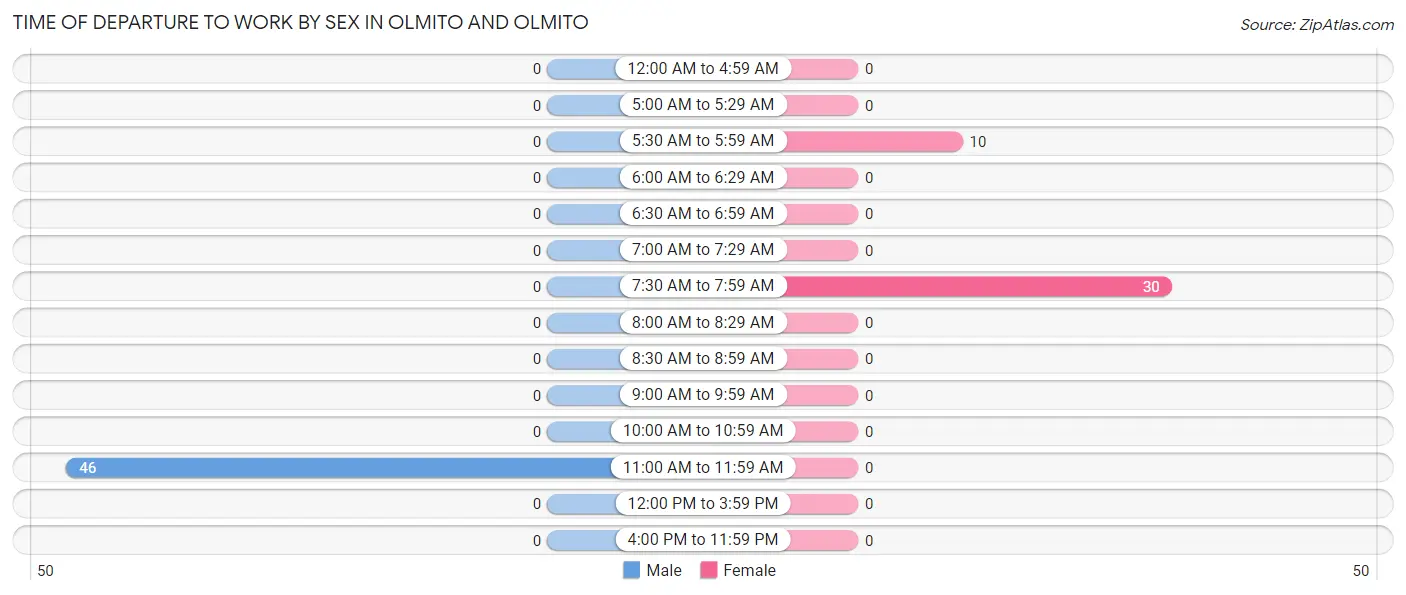
| Time of Departure | Male | Female |
| 12:00 AM to 4:59 AM | 0 (0.0%) | 0 (0.0%) |
| 5:00 AM to 5:29 AM | 0 (0.0%) | 0 (0.0%) |
| 5:30 AM to 5:59 AM | 0 (0.0%) | 10 (25.0%) |
| 6:00 AM to 6:29 AM | 0 (0.0%) | 0 (0.0%) |
| 6:30 AM to 6:59 AM | 0 (0.0%) | 0 (0.0%) |
| 7:00 AM to 7:29 AM | 0 (0.0%) | 0 (0.0%) |
| 7:30 AM to 7:59 AM | 0 (0.0%) | 30 (75.0%) |
| 8:00 AM to 8:29 AM | 0 (0.0%) | 0 (0.0%) |
| 8:30 AM to 8:59 AM | 0 (0.0%) | 0 (0.0%) |
| 9:00 AM to 9:59 AM | 0 (0.0%) | 0 (0.0%) |
| 10:00 AM to 10:59 AM | 0 (0.0%) | 0 (0.0%) |
| 11:00 AM to 11:59 AM | 46 (100.0%) | 0 (0.0%) |
| 12:00 PM to 3:59 PM | 0 (0.0%) | 0 (0.0%) |
| 4:00 PM to 11:59 PM | 0 (0.0%) | 0 (0.0%) |
| Total | 46 (100.0%) | 40 (100.0%) |
Housing Occupancy in Olmito and Olmito
Occupancy by Ownership in Olmito and Olmito
Of the total 76 dwellings in Olmito and Olmito, owner-occupied units account for 76 (100.0%), while renter-occupied units make up 0 (0.0%).
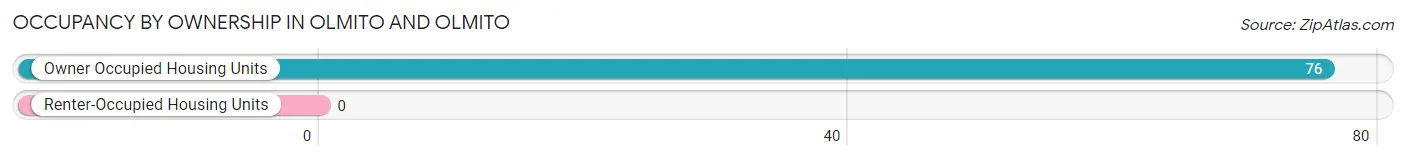
| Occupancy | # Housing Units | % Housing Units |
| Owner Occupied Housing Units | 76 | 100.0% |
| Renter-Occupied Housing Units | 0 | 0.0% |
| Total Occupied Housing Units | 76 | 100.0% |
Occupancy by Household Size in Olmito and Olmito
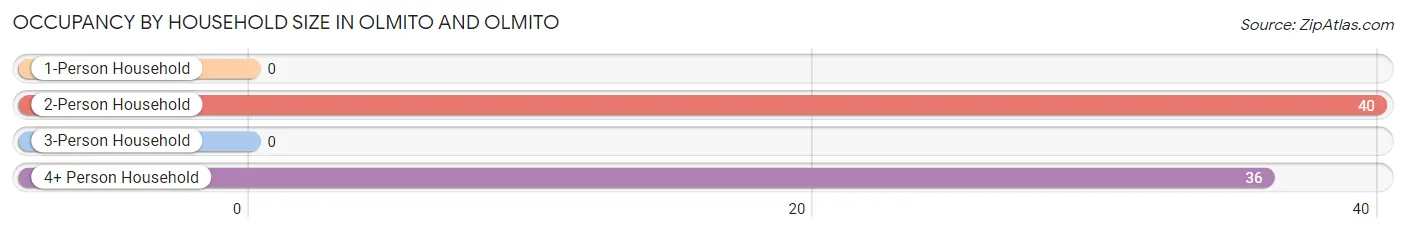
| Household Size | # Housing Units | % Housing Units |
| 1-Person Household | 0 | 0.0% |
| 2-Person Household | 40 | 52.6% |
| 3-Person Household | 0 | 0.0% |
| 4+ Person Household | 36 | 47.4% |
| Total Housing Units | 76 | 100.0% |
Occupancy by Ownership by Household Size in Olmito and Olmito
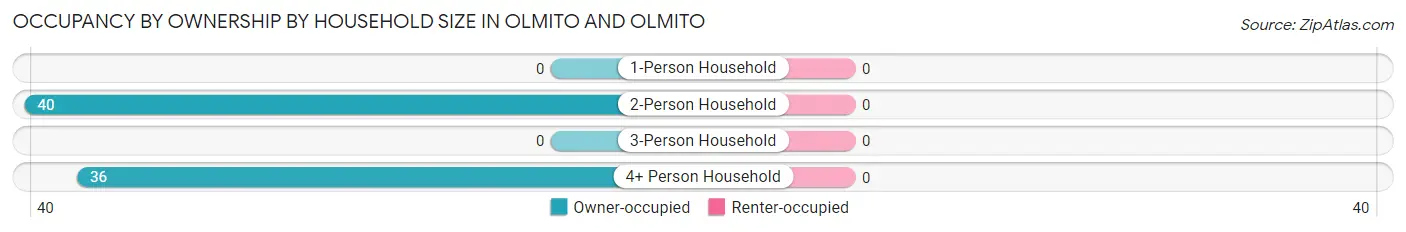
| Household Size | Owner-occupied | Renter-occupied |
| 1-Person Household | 0 (0.0%) | 0 (0.0%) |
| 2-Person Household | 40 (100.0%) | 0 (0.0%) |
| 3-Person Household | 0 (0.0%) | 0 (0.0%) |
| 4+ Person Household | 36 (100.0%) | 0 (0.0%) |
| Total Housing Units | 76 (100.0%) | 0 (0.0%) |
Occupancy by Educational Attainment in Olmito and Olmito
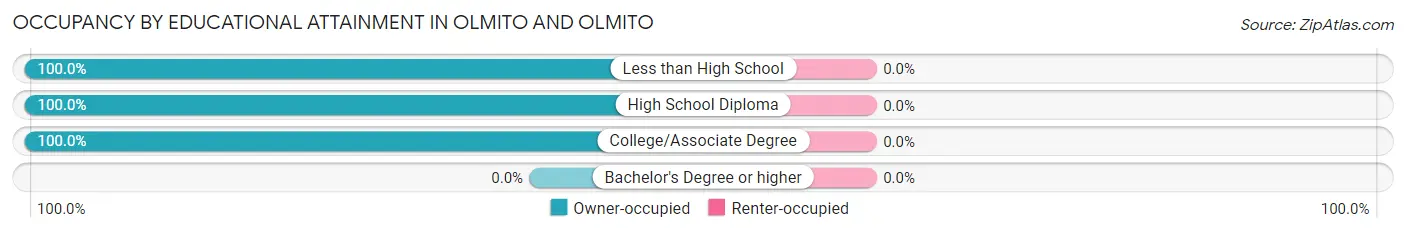
| Household Size | Owner-occupied | Renter-occupied |
| Less than High School | 36 (100.0%) | 0 (0.0%) |
| High School Diploma | 10 (100.0%) | 0 (0.0%) |
| College/Associate Degree | 30 (100.0%) | 0 (0.0%) |
| Bachelor's Degree or higher | 0 (0.0%) | 0 (0.0%) |
Occupancy by Age of Householder in Olmito and Olmito
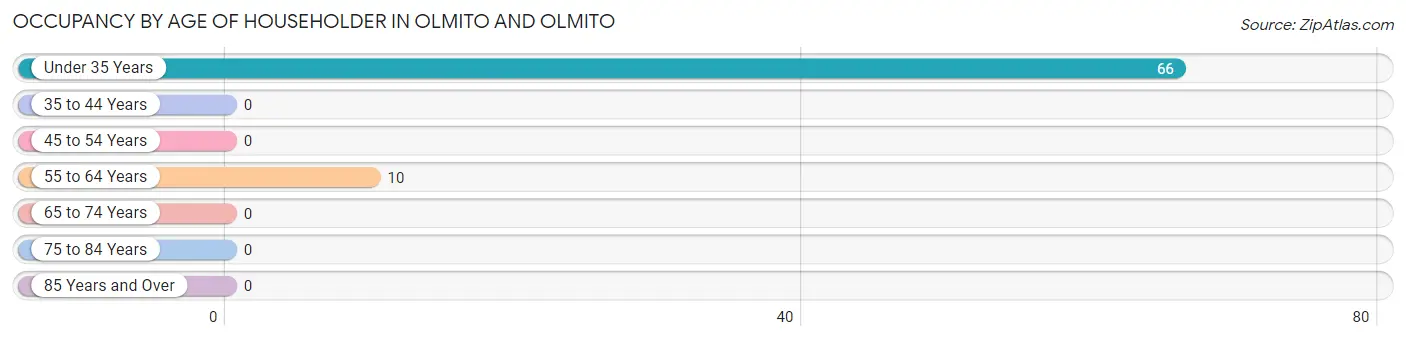
| Age Bracket | # Households | % Households |
| Under 35 Years | 66 | 86.8% |
| 35 to 44 Years | 0 | 0.0% |
| 45 to 54 Years | 0 | 0.0% |
| 55 to 64 Years | 10 | 13.2% |
| 65 to 74 Years | 0 | 0.0% |
| 75 to 84 Years | 0 | 0.0% |
| 85 Years and Over | 0 | 0.0% |
| Total | 76 | 100.0% |
Housing Finances in Olmito and Olmito
Median Income by Occupancy in Olmito and Olmito
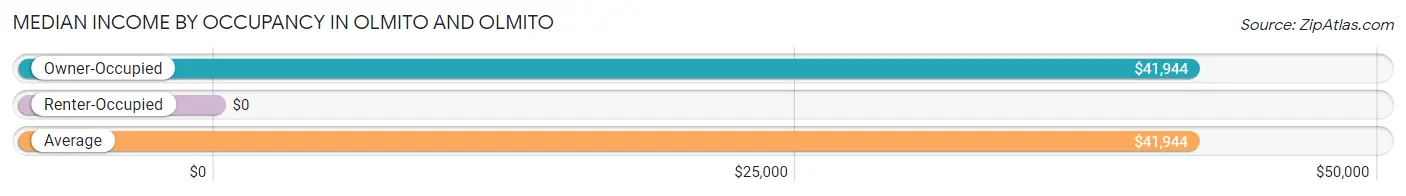
| Occupancy Type | # Households | Median Income |
| Owner-Occupied | 76 (100.0%) | $41,944 |
| Renter-Occupied | 0 (0.0%) | $0 |
| Average | 76 (100.0%) | $41,944 |
Occupancy by Householder Income Bracket in Olmito and Olmito
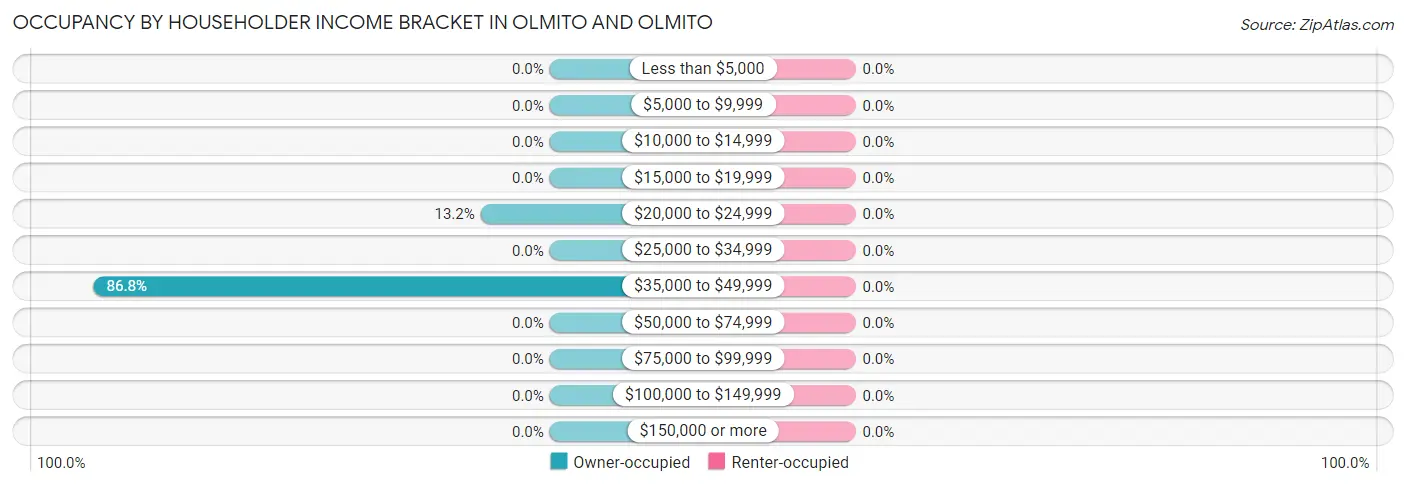
| Income Bracket | Owner-occupied | Renter-occupied |
| Less than $5,000 | 0 (0.0%) | 0 (0.0%) |
| $5,000 to $9,999 | 0 (0.0%) | 0 (0.0%) |
| $10,000 to $14,999 | 0 (0.0%) | 0 (0.0%) |
| $15,000 to $19,999 | 0 (0.0%) | 0 (0.0%) |
| $20,000 to $24,999 | 10 (13.2%) | 0 (0.0%) |
| $25,000 to $34,999 | 0 (0.0%) | 0 (0.0%) |
| $35,000 to $49,999 | 66 (86.8%) | 0 (0.0%) |
| $50,000 to $74,999 | 0 (0.0%) | 0 (0.0%) |
| $75,000 to $99,999 | 0 (0.0%) | 0 (0.0%) |
| $100,000 to $149,999 | 0 (0.0%) | 0 (0.0%) |
| $150,000 or more | 0 (0.0%) | 0 (0.0%) |
| Total | 76 (100.0%) | 0 (0.0%) |
Monthly Housing Cost Tiers in Olmito and Olmito
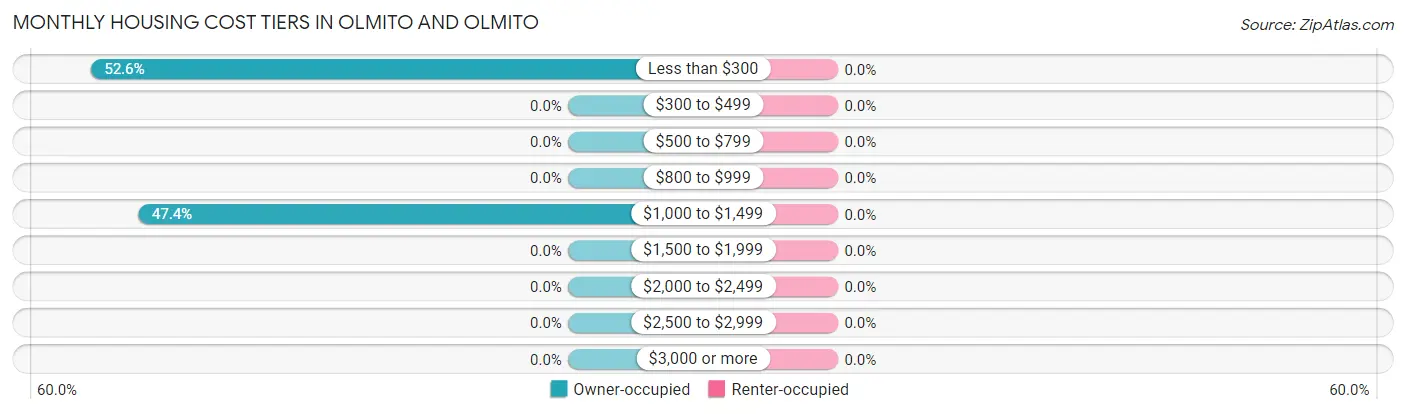
| Monthly Cost | Owner-occupied | Renter-occupied |
| Less than $300 | 40 (52.6%) | 0 (0.0%) |
| $300 to $499 | 0 (0.0%) | 0 (0.0%) |
| $500 to $799 | 0 (0.0%) | 0 (0.0%) |
| $800 to $999 | 0 (0.0%) | 0 (0.0%) |
| $1,000 to $1,499 | 36 (47.4%) | 0 (0.0%) |
| $1,500 to $1,999 | 0 (0.0%) | 0 (0.0%) |
| $2,000 to $2,499 | 0 (0.0%) | 0 (0.0%) |
| $2,500 to $2,999 | 0 (0.0%) | 0 (0.0%) |
| $3,000 or more | 0 (0.0%) | 0 (0.0%) |
| Total | 76 (100.0%) | 0 (0.0%) |
Physical Housing Characteristics in Olmito and Olmito
Housing Structures in Olmito and Olmito
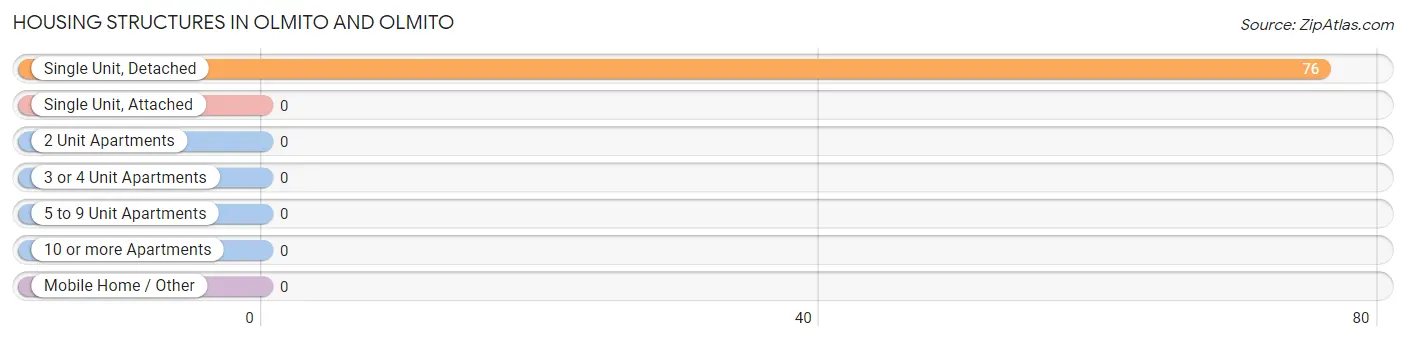
| Structure Type | # Housing Units | % Housing Units |
| Single Unit, Detached | 76 | 100.0% |
| Single Unit, Attached | 0 | 0.0% |
| 2 Unit Apartments | 0 | 0.0% |
| 3 or 4 Unit Apartments | 0 | 0.0% |
| 5 to 9 Unit Apartments | 0 | 0.0% |
| 10 or more Apartments | 0 | 0.0% |
| Mobile Home / Other | 0 | 0.0% |
| Total | 76 | 100.0% |
Housing Structures by Occupancy in Olmito and Olmito
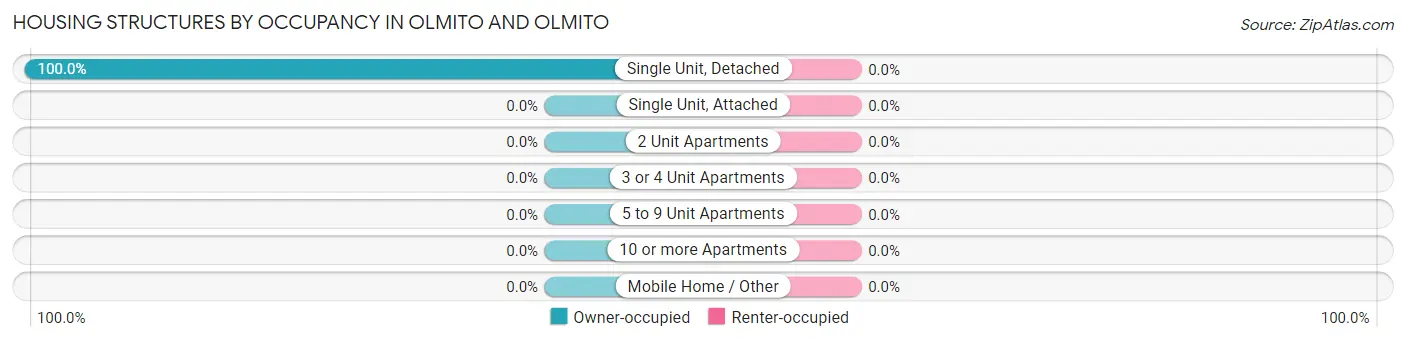
| Structure Type | Owner-occupied | Renter-occupied |
| Single Unit, Detached | 76 (100.0%) | 0 (0.0%) |
| Single Unit, Attached | 0 (0.0%) | 0 (0.0%) |
| 2 Unit Apartments | 0 (0.0%) | 0 (0.0%) |
| 3 or 4 Unit Apartments | 0 (0.0%) | 0 (0.0%) |
| 5 to 9 Unit Apartments | 0 (0.0%) | 0 (0.0%) |
| 10 or more Apartments | 0 (0.0%) | 0 (0.0%) |
| Mobile Home / Other | 0 (0.0%) | 0 (0.0%) |
| Total | 76 (100.0%) | 0 (0.0%) |
Housing Structures by Number of Rooms in Olmito and Olmito
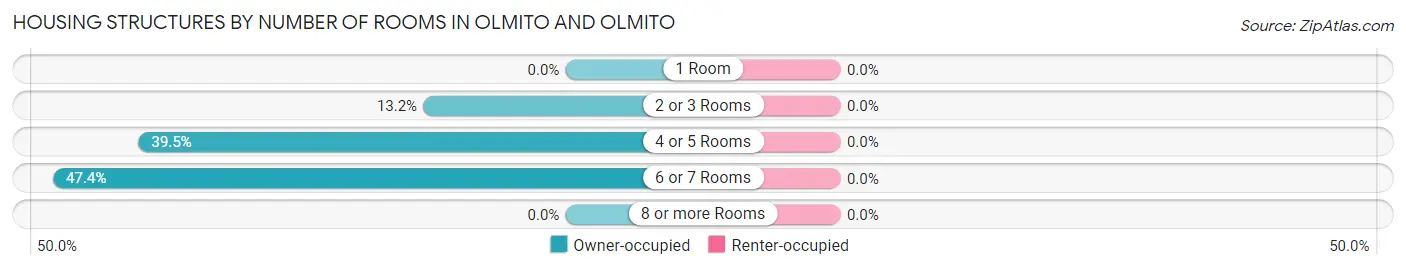
| Number of Rooms | Owner-occupied | Renter-occupied |
| 1 Room | 0 (0.0%) | 0 (0.0%) |
| 2 or 3 Rooms | 10 (13.2%) | 0 (0.0%) |
| 4 or 5 Rooms | 30 (39.5%) | 0 (0.0%) |
| 6 or 7 Rooms | 36 (47.4%) | 0 (0.0%) |
| 8 or more Rooms | 0 (0.0%) | 0 (0.0%) |
| Total | 76 (100.0%) | 0 (0.0%) |
Housing Structure by Heating Type in Olmito and Olmito
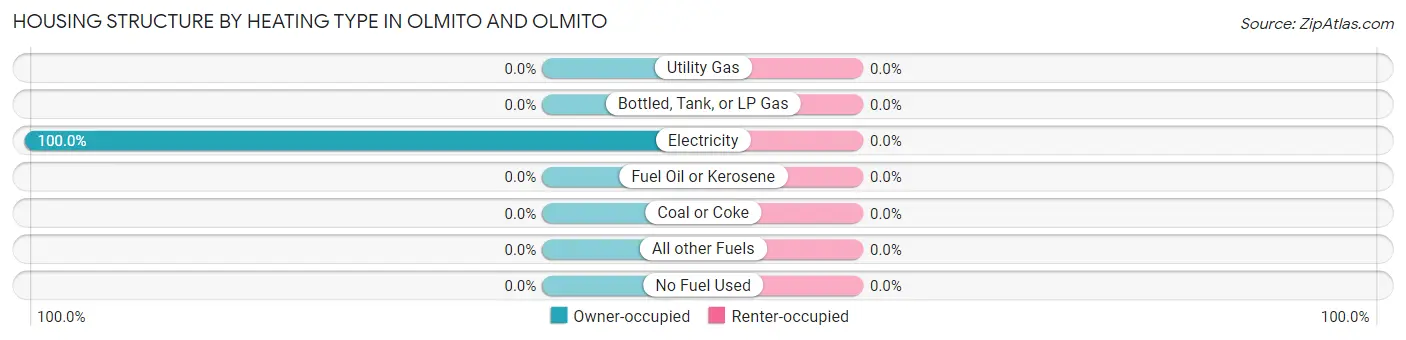
| Heating Type | Owner-occupied | Renter-occupied |
| Utility Gas | 0 (0.0%) | 0 (0.0%) |
| Bottled, Tank, or LP Gas | 0 (0.0%) | 0 (0.0%) |
| Electricity | 76 (100.0%) | 0 (0.0%) |
| Fuel Oil or Kerosene | 0 (0.0%) | 0 (0.0%) |
| Coal or Coke | 0 (0.0%) | 0 (0.0%) |
| All other Fuels | 0 (0.0%) | 0 (0.0%) |
| No Fuel Used | 0 (0.0%) | 0 (0.0%) |
| Total | 76 (100.0%) | 0 (0.0%) |
Household Vehicle Usage in Olmito and Olmito
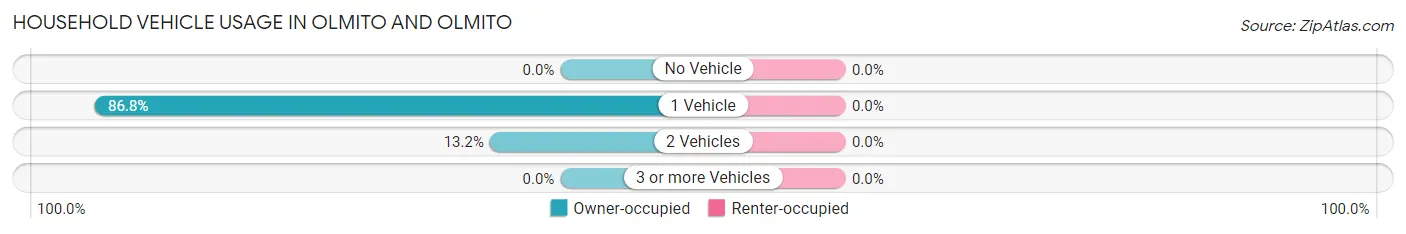
| Vehicles per Household | Owner-occupied | Renter-occupied |
| No Vehicle | 0 (0.0%) | 0 (0.0%) |
| 1 Vehicle | 66 (86.8%) | 0 (0.0%) |
| 2 Vehicles | 10 (13.2%) | 0 (0.0%) |
| 3 or more Vehicles | 0 (0.0%) | 0 (0.0%) |
| Total | 76 (100.0%) | 0 (0.0%) |
Real Estate & Mortgages in Olmito and Olmito
Real Estate and Mortgage Overview in Olmito and Olmito
| Characteristic | Without Mortgage | With Mortgage |
| Housing Units | 40 | 36 |
| Median Property Value | - | - |
| Median Household Income | - | - |
| Monthly Housing Costs | - | - |
| Real Estate Taxes | - | - |
Property Value by Mortgage Status in Olmito and Olmito
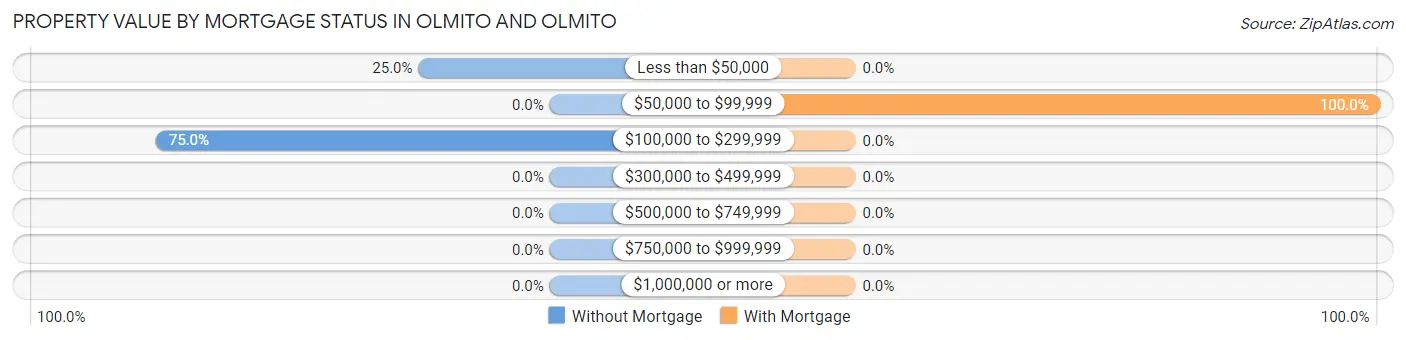
| Property Value | Without Mortgage | With Mortgage |
| Less than $50,000 | 10 (25.0%) | 0 (0.0%) |
| $50,000 to $99,999 | 0 (0.0%) | 36 (100.0%) |
| $100,000 to $299,999 | 30 (75.0%) | 0 (0.0%) |
| $300,000 to $499,999 | 0 (0.0%) | 0 (0.0%) |
| $500,000 to $749,999 | 0 (0.0%) | 0 (0.0%) |
| $750,000 to $999,999 | 0 (0.0%) | 0 (0.0%) |
| $1,000,000 or more | 0 (0.0%) | 0 (0.0%) |
| Total | 40 (100.0%) | 36 (100.0%) |
Household Income by Mortgage Status in Olmito and Olmito
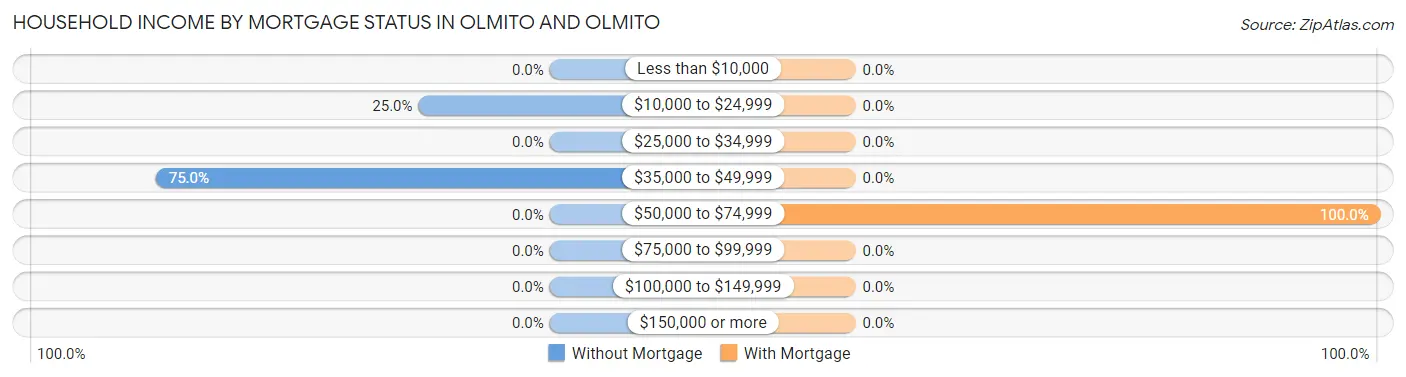
| Household Income | Without Mortgage | With Mortgage |
| Less than $10,000 | 0 (0.0%) | 0 (0.0%) |
| $10,000 to $24,999 | 10 (25.0%) | 0 (0.0%) |
| $25,000 to $34,999 | 0 (0.0%) | 0 (0.0%) |
| $35,000 to $49,999 | 30 (75.0%) | 0 (0.0%) |
| $50,000 to $74,999 | 0 (0.0%) | 36 (100.0%) |
| $75,000 to $99,999 | 0 (0.0%) | 0 (0.0%) |
| $100,000 to $149,999 | 0 (0.0%) | 0 (0.0%) |
| $150,000 or more | 0 (0.0%) | 0 (0.0%) |
| Total | 40 (100.0%) | 36 (100.0%) |
Property Value to Household Income Ratio in Olmito and Olmito
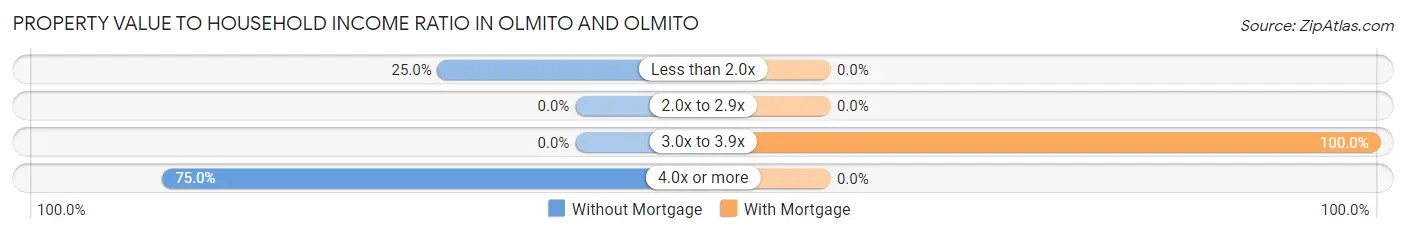
| Value-to-Income Ratio | Without Mortgage | With Mortgage |
| Less than 2.0x | 10 (25.0%) | 0 (0.0%) |
| 2.0x to 2.9x | 0 (0.0%) | 0 (0.0%) |
| 3.0x to 3.9x | 0 (0.0%) | 36 (100.0%) |
| 4.0x or more | 30 (75.0%) | 0 (0.0%) |
| Total | 40 (100.0%) | 36 (100.0%) |
Real Estate Taxes by Mortgage Status in Olmito and Olmito
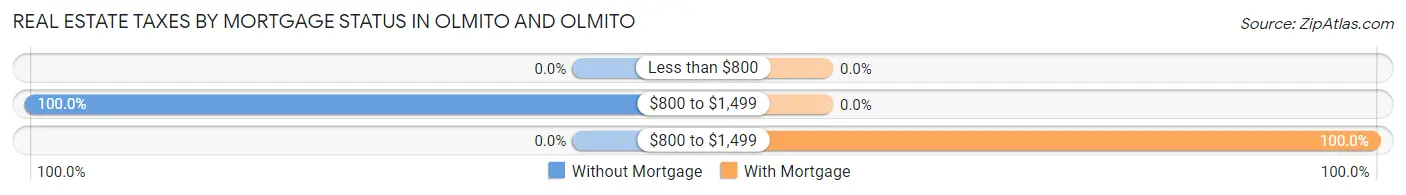
| Property Taxes | Without Mortgage | With Mortgage |
| Less than $800 | 0 (0.0%) | 0 (0.0%) |
| $800 to $1,499 | 40 (100.0%) | 0 (0.0%) |
| $800 to $1,499 | 0 (0.0%) | 36 (100.0%) |
| Total | 40 (100.0%) | 36 (100.0%) |
Health & Disability in Olmito and Olmito
Health Insurance Coverage by Age in Olmito and Olmito
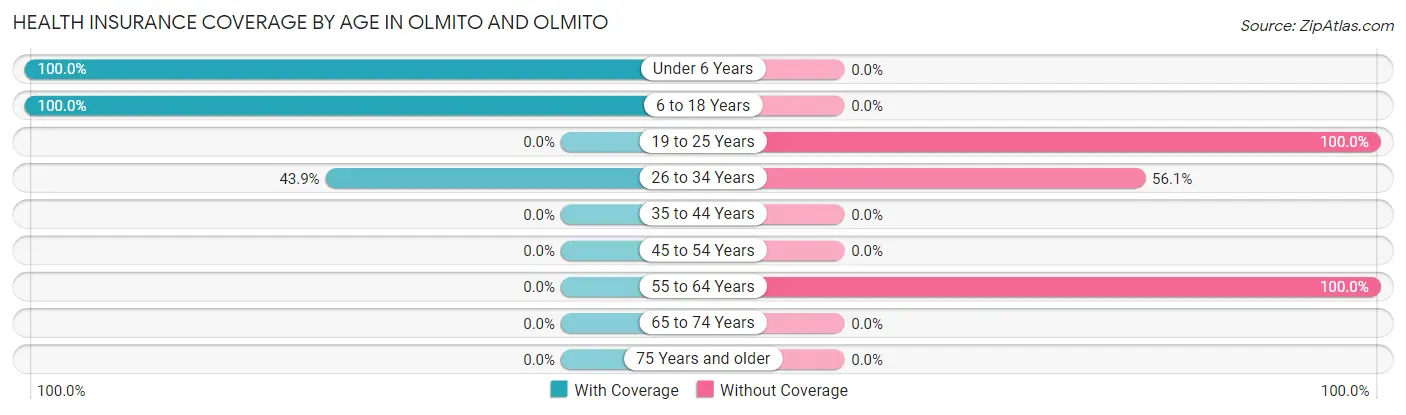
| Age Bracket | With Coverage | Without Coverage |
| Under 6 Years | 111 (100.0%) | 0 (0.0%) |
| 6 to 18 Years | 51 (100.0%) | 0 (0.0%) |
| 19 to 25 Years | 0 (0.0%) | 30 (100.0%) |
| 26 to 34 Years | 36 (43.9%) | 46 (56.1%) |
| 35 to 44 Years | 0 (0.0%) | 0 (0.0%) |
| 45 to 54 Years | 0 (0.0%) | 0 (0.0%) |
| 55 to 64 Years | 0 (0.0%) | 10 (100.0%) |
| 65 to 74 Years | 0 (0.0%) | 0 (0.0%) |
| 75 Years and older | 0 (0.0%) | 0 (0.0%) |
| Total | 198 (69.7%) | 86 (30.3%) |
Health Insurance Coverage by Citizenship Status in Olmito and Olmito
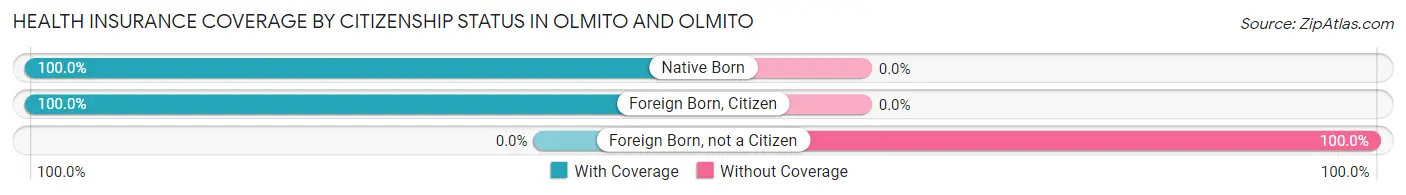
| Citizenship Status | With Coverage | Without Coverage |
| Native Born | 111 (100.0%) | 0 (0.0%) |
| Foreign Born, Citizen | 51 (100.0%) | 0 (0.0%) |
| Foreign Born, not a Citizen | 0 (0.0%) | 30 (100.0%) |
Health Insurance Coverage by Household Income in Olmito and Olmito
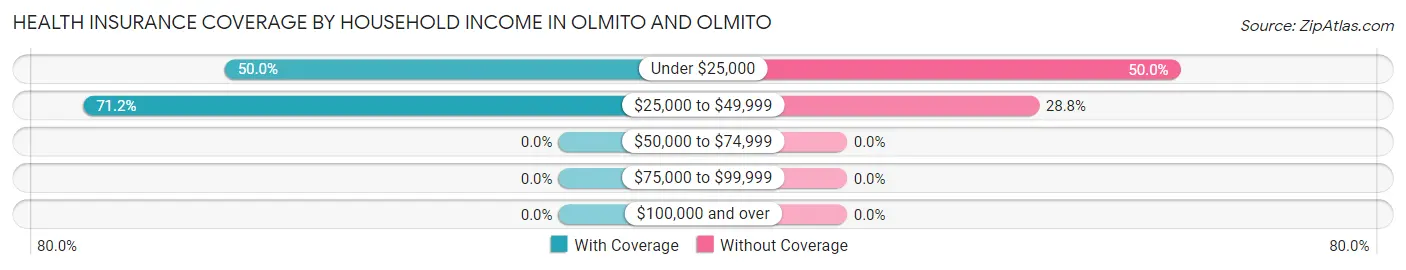
| Household Income | With Coverage | Without Coverage |
| Under $25,000 | 10 (50.0%) | 10 (50.0%) |
| $25,000 to $49,999 | 188 (71.2%) | 76 (28.8%) |
| $50,000 to $74,999 | 0 (0.0%) | 0 (0.0%) |
| $75,000 to $99,999 | 0 (0.0%) | 0 (0.0%) |
| $100,000 and over | 0 (0.0%) | 0 (0.0%) |
Public vs Private Health Insurance Coverage by Age in Olmito and Olmito
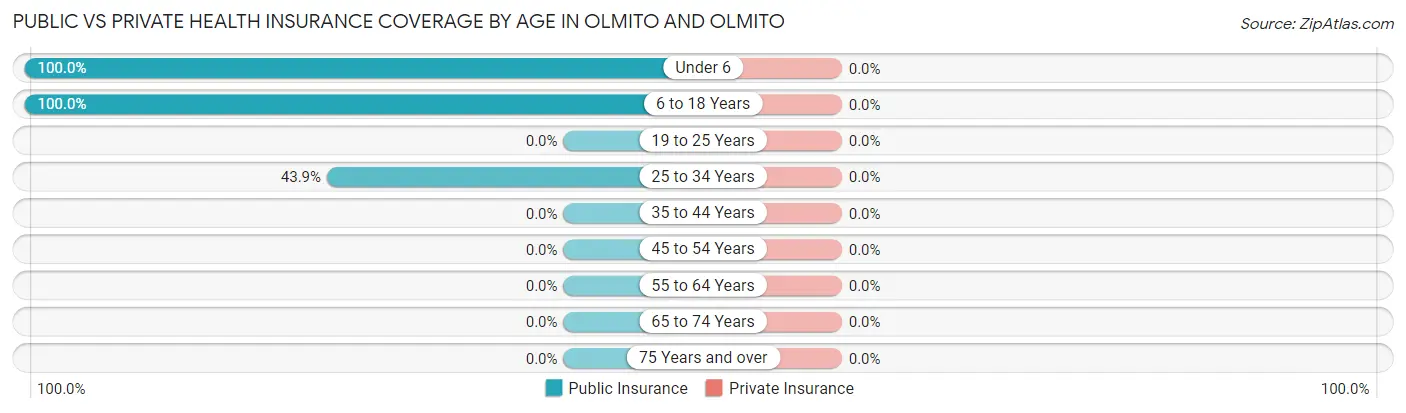
| Age Bracket | Public Insurance | Private Insurance |
| Under 6 | 111 (100.0%) | 0 (0.0%) |
| 6 to 18 Years | 51 (100.0%) | 0 (0.0%) |
| 19 to 25 Years | 0 (0.0%) | 0 (0.0%) |
| 25 to 34 Years | 36 (43.9%) | 0 (0.0%) |
| 35 to 44 Years | 0 (0.0%) | 0 (0.0%) |
| 45 to 54 Years | 0 (0.0%) | 0 (0.0%) |
| 55 to 64 Years | 0 (0.0%) | 0 (0.0%) |
| 65 to 74 Years | 0 (0.0%) | 0 (0.0%) |
| 75 Years and over | 0 (0.0%) | 0 (0.0%) |
| Total | 198 (69.7%) | 0 (0.0%) |
Disability Status by Sex by Age in Olmito and Olmito
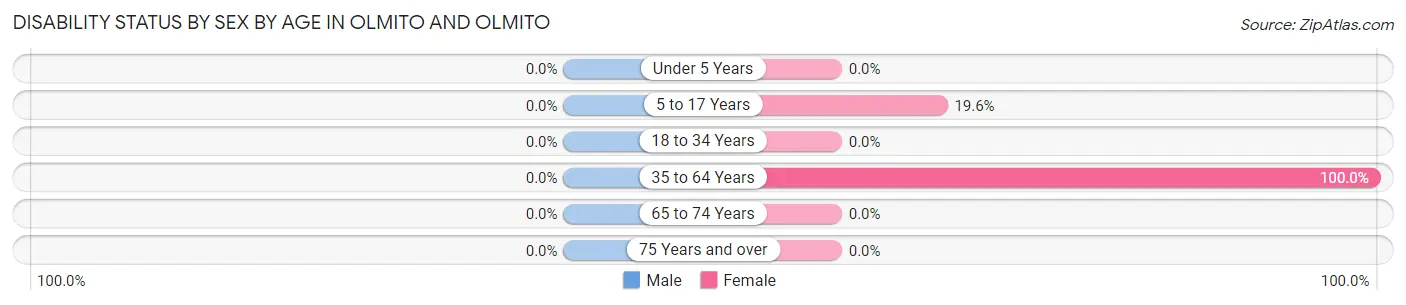
| Age Bracket | Male | Female |
| Under 5 Years | 0 (0.0%) | 0 (0.0%) |
| 5 to 17 Years | 0 (0.0%) | 10 (19.6%) |
| 18 to 34 Years | 0 (0.0%) | 0 (0.0%) |
| 35 to 64 Years | 0 (0.0%) | 10 (100.0%) |
| 65 to 74 Years | 0 (0.0%) | 0 (0.0%) |
| 75 Years and over | 0 (0.0%) | 0 (0.0%) |
Disability Class by Sex by Age in Olmito and Olmito
Disability Class: Hearing Difficulty
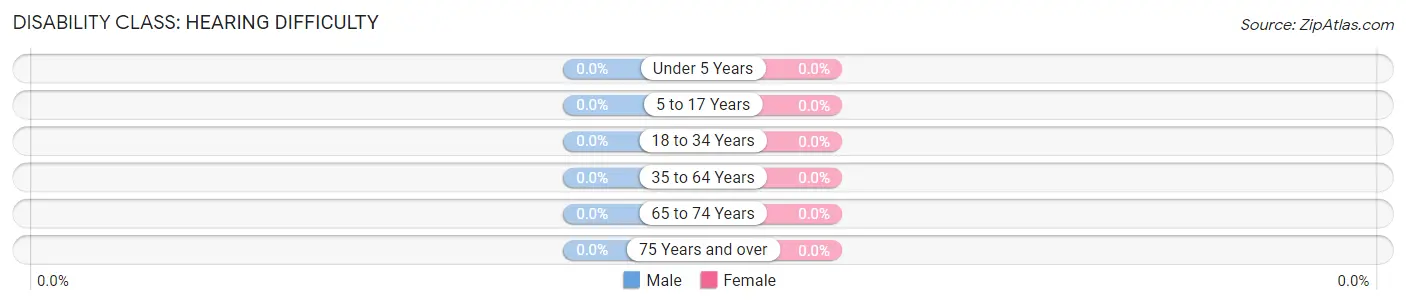
| Age Bracket | Male | Female |
| Under 5 Years | 0 (0.0%) | 0 (0.0%) |
| 5 to 17 Years | 0 (0.0%) | 0 (0.0%) |
| 18 to 34 Years | 0 (0.0%) | 0 (0.0%) |
| 35 to 64 Years | 0 (0.0%) | 0 (0.0%) |
| 65 to 74 Years | 0 (0.0%) | 0 (0.0%) |
| 75 Years and over | 0 (0.0%) | 0 (0.0%) |
Disability Class: Vision Difficulty
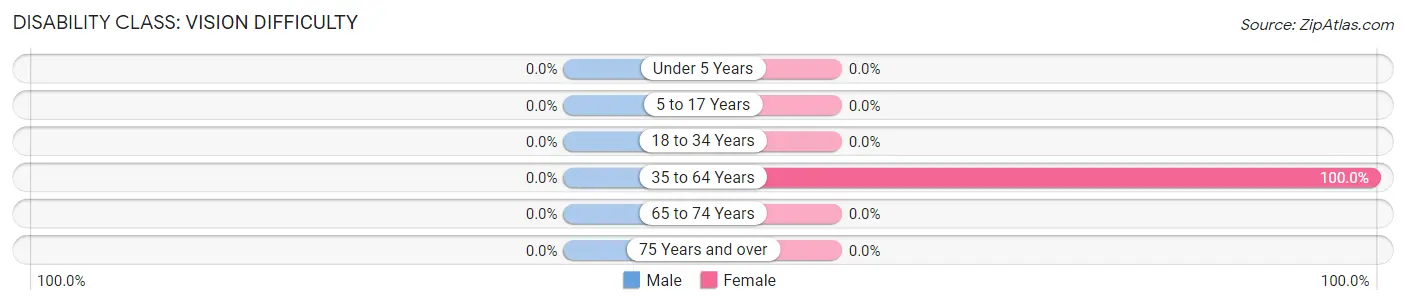
| Age Bracket | Male | Female |
| Under 5 Years | 0 (0.0%) | 0 (0.0%) |
| 5 to 17 Years | 0 (0.0%) | 0 (0.0%) |
| 18 to 34 Years | 0 (0.0%) | 0 (0.0%) |
| 35 to 64 Years | 0 (0.0%) | 10 (100.0%) |
| 65 to 74 Years | 0 (0.0%) | 0 (0.0%) |
| 75 Years and over | 0 (0.0%) | 0 (0.0%) |
Disability Class: Cognitive Difficulty
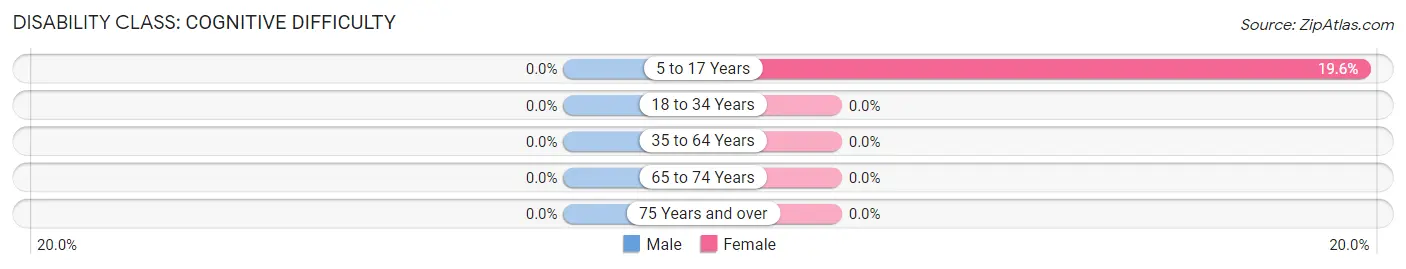
| Age Bracket | Male | Female |
| 5 to 17 Years | 0 (0.0%) | 10 (19.6%) |
| 18 to 34 Years | 0 (0.0%) | 0 (0.0%) |
| 35 to 64 Years | 0 (0.0%) | 0 (0.0%) |
| 65 to 74 Years | 0 (0.0%) | 0 (0.0%) |
| 75 Years and over | 0 (0.0%) | 0 (0.0%) |
Disability Class: Ambulatory Difficulty
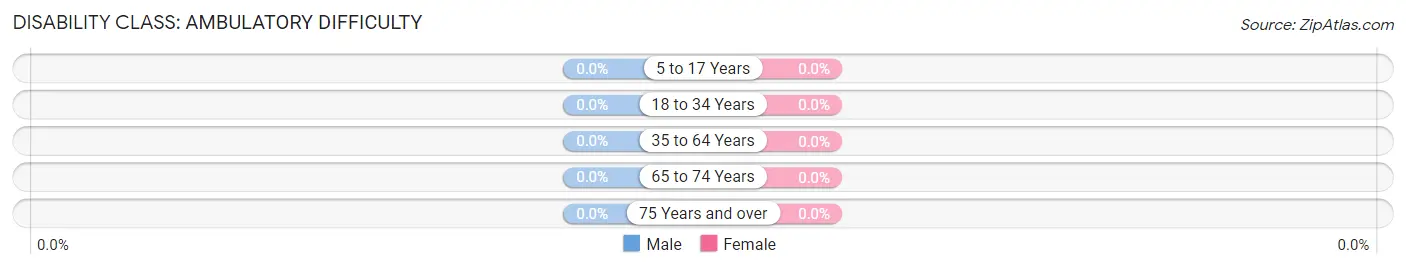
| Age Bracket | Male | Female |
| 5 to 17 Years | 0 (0.0%) | 0 (0.0%) |
| 18 to 34 Years | 0 (0.0%) | 0 (0.0%) |
| 35 to 64 Years | 0 (0.0%) | 0 (0.0%) |
| 65 to 74 Years | 0 (0.0%) | 0 (0.0%) |
| 75 Years and over | 0 (0.0%) | 0 (0.0%) |
Disability Class: Self-Care Difficulty
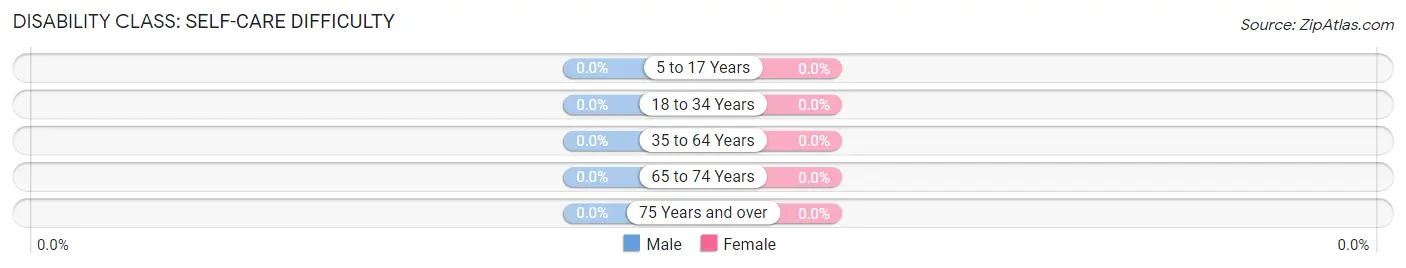
| Age Bracket | Male | Female |
| 5 to 17 Years | 0 (0.0%) | 0 (0.0%) |
| 18 to 34 Years | 0 (0.0%) | 0 (0.0%) |
| 35 to 64 Years | 0 (0.0%) | 0 (0.0%) |
| 65 to 74 Years | 0 (0.0%) | 0 (0.0%) |
| 75 Years and over | 0 (0.0%) | 0 (0.0%) |
Technology Access in Olmito and Olmito
Computing Device Access in Olmito and Olmito
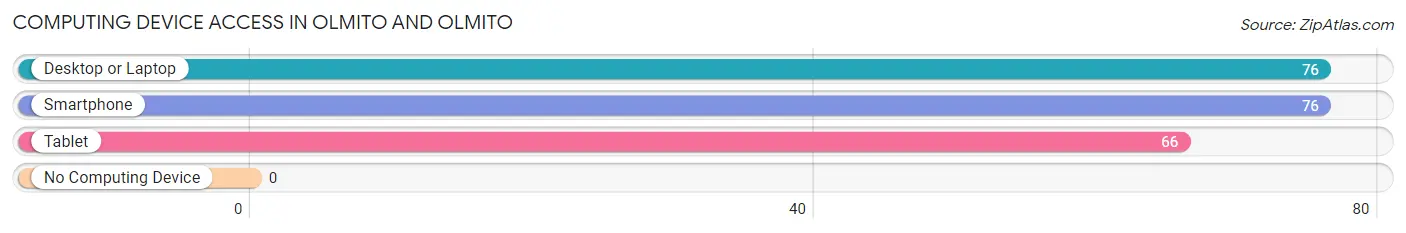
| Device Type | # Households | % Households |
| Desktop or Laptop | 76 | 100.0% |
| Smartphone | 76 | 100.0% |
| Tablet | 66 | 86.8% |
| No Computing Device | 0 | 0.0% |
| Total | 76 | 100.0% |
Internet Access in Olmito and Olmito
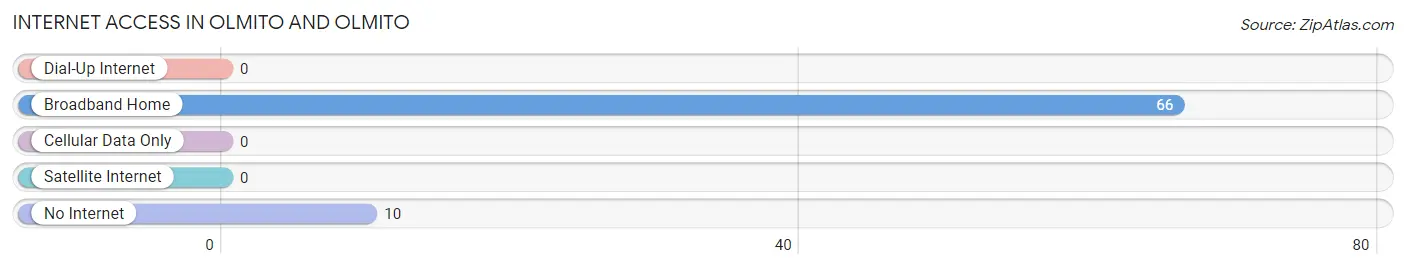
| Internet Type | # Households | % Households |
| Dial-Up Internet | 0 | 0.0% |
| Broadband Home | 66 | 86.8% |
| Cellular Data Only | 0 | 0.0% |
| Satellite Internet | 0 | 0.0% |
| No Internet | 10 | 13.2% |
| Total | 76 | 100.0% |
Olmito and Olmito Summary
Olmito is a small unincorporated community located in Cameron County, Texas, United States. It is situated on the western edge of the Rio Grande Valley, approximately 20 miles south of Brownsville and the Mexican border. The population of Olmito was estimated to be 1,845 in 2019.
Geography
Olmito is located at 26°10'25"N 97°27'45"W (26.173611, -97.462500). It is situated on the western edge of the Rio Grande Valley, approximately 20 miles south of Brownsville and the Mexican border. The area is characterized by flat terrain and is surrounded by agricultural fields. The climate is subtropical with hot summers and mild winters.
History
The area that is now Olmito was originally inhabited by the Coahuiltecan Indians. The first European settlers arrived in the area in the late 19th century. The town was founded in 1891 and was originally known as “Olmito Station”. The name is derived from the Spanish word for “little olive”, referring to the abundance of olive trees in the area.
In the early 20th century, Olmito was a thriving agricultural community. The town was home to several cotton gins, a sugar mill, and a railroad station. The town also had a post office, a school, and several stores.
In the 1950s, the town began to decline as the railroad station closed and the population began to move away. In the 1970s, the town was revitalized with the construction of a new highway and the opening of a new school.
Economy
The economy of Olmito is largely based on agriculture. The town is home to several farms and ranches that produce a variety of crops, including cotton, corn, sorghum, and vegetables. The town is also home to several businesses, including a grocery store, a hardware store, and a restaurant.
Demographics
As of the 2019 census, the population of Olmito was estimated to be 1,845. The racial makeup of the town was 79.2% Hispanic or Latino, 19.2% White, 0.7% African American, 0.2% Native American, 0.1% Asian, and 0.8% from other races.
The median household income in Olmito was $30,938 in 2019. The median age of the population was 28.7 years. The town had a poverty rate of 28.3%.
Conclusion
Olmito is a small unincorporated community located in Cameron County, Texas. It is situated on the western edge of the Rio Grande Valley, approximately 20 miles south of Brownsville and the Mexican border. The population of Olmito was estimated to be 1,845 in 2019. The economy of Olmito is largely based on agriculture, and the town is home to several businesses. The racial makeup of the town was 79.2% Hispanic or Latino, 19.2% White, 0.7% African American, 0.2% Native American, 0.1% Asian, and 0.8% from other races. The median household income in Olmito was $30,938 in 2019.
Common Questions
What is Per Capita Income in Olmito and Olmito?
Per Capita income in Olmito and Olmito is $12,124.
What is the Median Family Income in Olmito and Olmito?
Median Family Income in Olmito and Olmito is $41,944.
What is the Median Household income in Olmito and Olmito?
Median Household Income in Olmito and Olmito is $41,944.
What is Inequality or Gini Index in Olmito and Olmito?
Inequality or Gini Index in Olmito and Olmito is 0.06.
What is the Total Population of Olmito and Olmito?
Total Population of Olmito and Olmito is 284.
What is the Total Male Population of Olmito and Olmito?
Total Male Population of Olmito and Olmito is 103.
What is the Total Female Population of Olmito and Olmito?
Total Female Population of Olmito and Olmito is 181.
What is the Ratio of Males per 100 Females in Olmito and Olmito?
There are 56.91 Males per 100 Females in Olmito and Olmito.
What is the Ratio of Females per 100 Males in Olmito and Olmito?
There are 175.73 Females per 100 Males in Olmito and Olmito.
What is the Median Population Age in Olmito and Olmito?
Median Population Age in Olmito and Olmito is 9.8 Years.
What is the Average Family Size in Olmito and Olmito
Average Family Size in Olmito and Olmito is 3.7 People.
What is the Average Household Size in Olmito and Olmito
Average Household Size in Olmito and Olmito is 3.7 People.
How Large is the Labor Force in Olmito and Olmito?
There are 86 People in the Labor Forcein in Olmito and Olmito.
What is the Percentage of People in the Labor Force in Olmito and Olmito?
65.2% of People are in the Labor Force in Olmito and Olmito.