Froid, MT Map & Demographics
Froid Map
Froid Overview
$24,198
PER CAPITA INCOME
$85,625
AVG FAMILY INCOME
$68,500
AVG HOUSEHOLD INCOME
39.1%
WAGE / INCOME GAP [ % ]
60.9¢/ $1
WAGE / INCOME GAP [ $ ]
0.28
INEQUALITY / GINI INDEX
304
TOTAL POPULATION
98
MALE POPULATION
206
FEMALE POPULATION
47.57
MALES / 100 FEMALES
210.20
FEMALES / 100 MALES
13.5
MEDIAN AGE
3.4
AVG FAMILY SIZE
4.6
AVG HOUSEHOLD SIZE
107
LABOR FORCE [ PEOPLE ]
71.8%
PERCENT IN LABOR FORCE
Froid Zip Codes
Froid Area Codes
Income in Froid
Income Overview in Froid
Per Capita Income in Froid is $24,198, while median incomes of families and households are $85,625 and $68,500 respectively.
| Characteristic | Number | Measure |
| Per Capita Income | 304 | $24,198 |
| Median Family Income | 31 | $85,625 |
| Mean Family Income | 31 | $83,255 |
| Median Household Income | 66 | $68,500 |
| Mean Household Income | 66 | $78,364 |
| Income Deficit | 31 | $0 |
| Wage / Income Gap (%) | 304 | 39.10% |
| Wage / Income Gap ($) | 304 | 60.90¢ per $1 |
| Gini / Inequality Index | 304 | 0.28 |
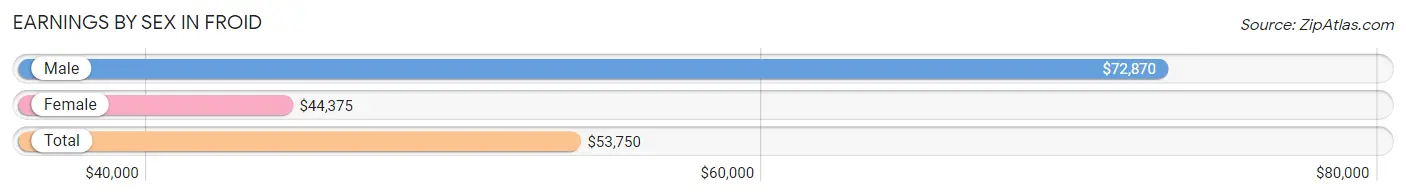
Earnings by Sex in Froid
Average Earnings in Froid are $53,750, $72,870 for men and $44,375 for women, a difference of 39.1%.
| Sex | Number | Average Earnings |
| Male | 64 (57.7%) | $72,870 |
| Female | 47 (42.3%) | $44,375 |
| Total | 111 (100.0%) | $53,750 |
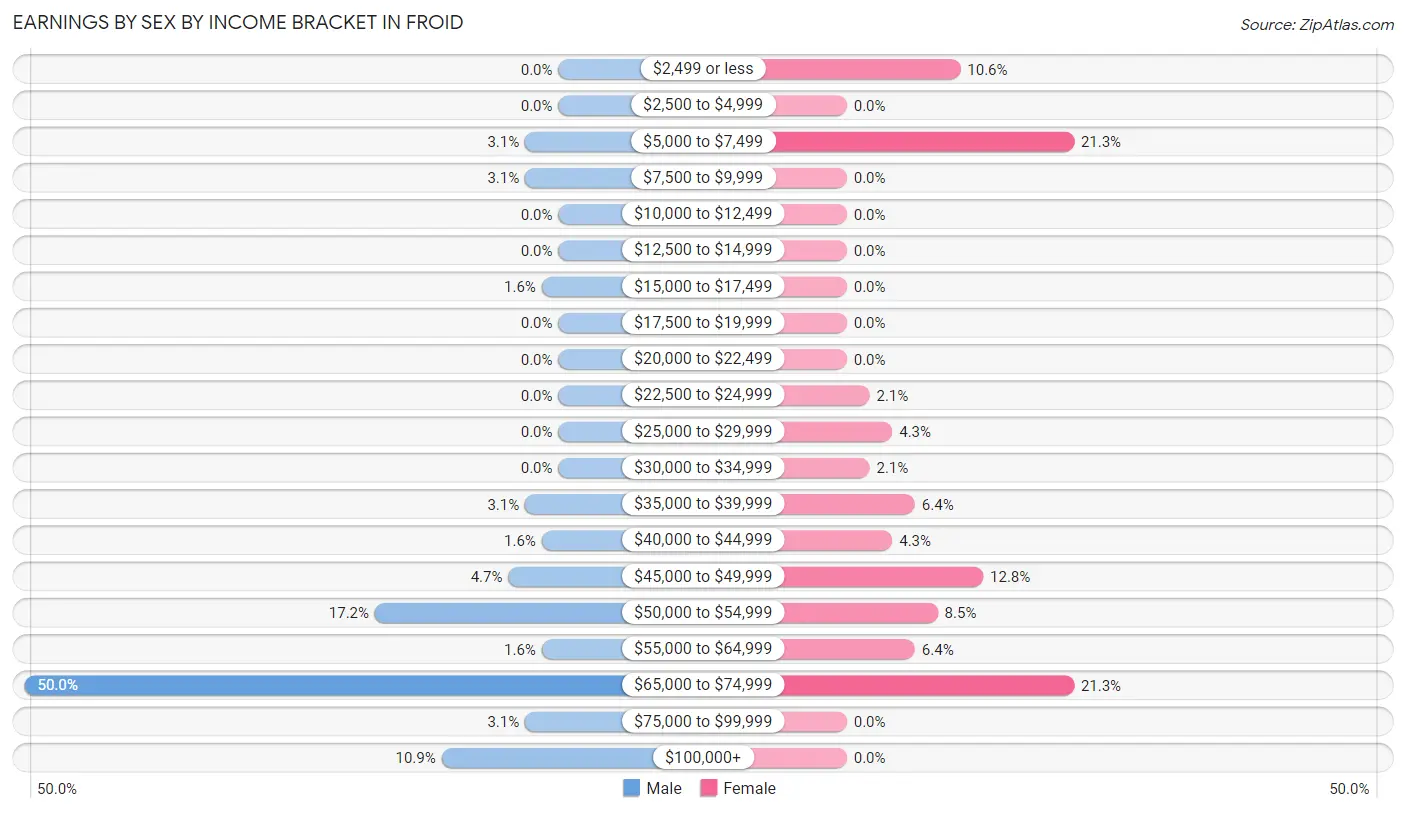
Earnings by Sex by Income Bracket in Froid
The most common earnings brackets in Froid are $65,000 to $74,999 for men (32 | 50.0%) and $5,000 to $7,499 for women (10 | 21.3%).
| Income | Male | Female |
| $2,499 or less | 0 (0.0%) | 5 (10.6%) |
| $2,500 to $4,999 | 0 (0.0%) | 0 (0.0%) |
| $5,000 to $7,499 | 2 (3.1%) | 10 (21.3%) |
| $7,500 to $9,999 | 2 (3.1%) | 0 (0.0%) |
| $10,000 to $12,499 | 0 (0.0%) | 0 (0.0%) |
| $12,500 to $14,999 | 0 (0.0%) | 0 (0.0%) |
| $15,000 to $17,499 | 1 (1.6%) | 0 (0.0%) |
| $17,500 to $19,999 | 0 (0.0%) | 0 (0.0%) |
| $20,000 to $22,499 | 0 (0.0%) | 0 (0.0%) |
| $22,500 to $24,999 | 0 (0.0%) | 1 (2.1%) |
| $25,000 to $29,999 | 0 (0.0%) | 2 (4.3%) |
| $30,000 to $34,999 | 0 (0.0%) | 1 (2.1%) |
| $35,000 to $39,999 | 2 (3.1%) | 3 (6.4%) |
| $40,000 to $44,999 | 1 (1.6%) | 2 (4.3%) |
| $45,000 to $49,999 | 3 (4.7%) | 6 (12.8%) |
| $50,000 to $54,999 | 11 (17.2%) | 4 (8.5%) |
| $55,000 to $64,999 | 1 (1.6%) | 3 (6.4%) |
| $65,000 to $74,999 | 32 (50.0%) | 10 (21.3%) |
| $75,000 to $99,999 | 2 (3.1%) | 0 (0.0%) |
| $100,000+ | 7 (10.9%) | 0 (0.0%) |
| Total | 64 (100.0%) | 47 (100.0%) |
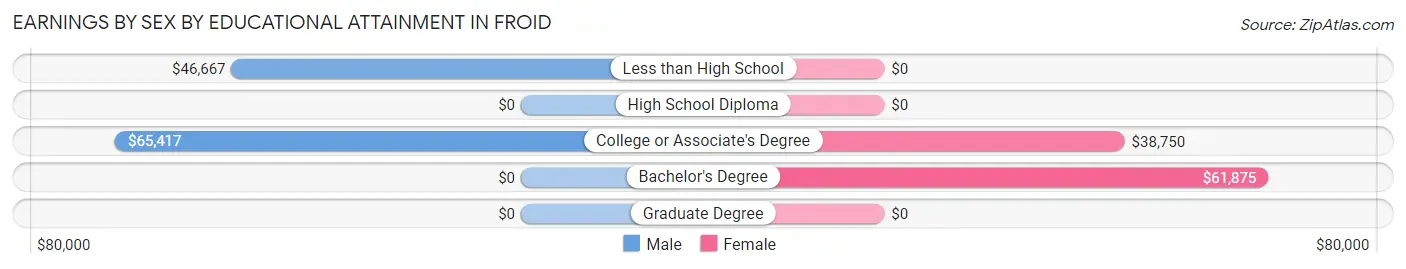
Earnings by Sex by Educational Attainment in Froid
Average earnings in Froid are $72,870 for men and $47,500 for women, a difference of 34.8%. Men with an educational attainment of college or associate's degree enjoy the highest average annual earnings of $65,417, while those with less than high school education earn the least with $46,667. Women with an educational attainment of bachelor's degree earn the most with the average annual earnings of $61,875, while those with college or associate's degree education have the smallest earnings of $38,750.
| Educational Attainment | Male Income | Female Income |
| Less than High School | $46,667 | $0 |
| High School Diploma | - | - |
| College or Associate's Degree | $65,417 | $38,750 |
| Bachelor's Degree | - | - |
| Graduate Degree | - | - |
| Total | $72,870 | $47,500 |
Family Income in Froid
Family Income Brackets in Froid
According to the Froid family income data, there are 9 families falling into the $50,000 to $74,999 income range, which is the most common income bracket and makes up 29.0% of all families.
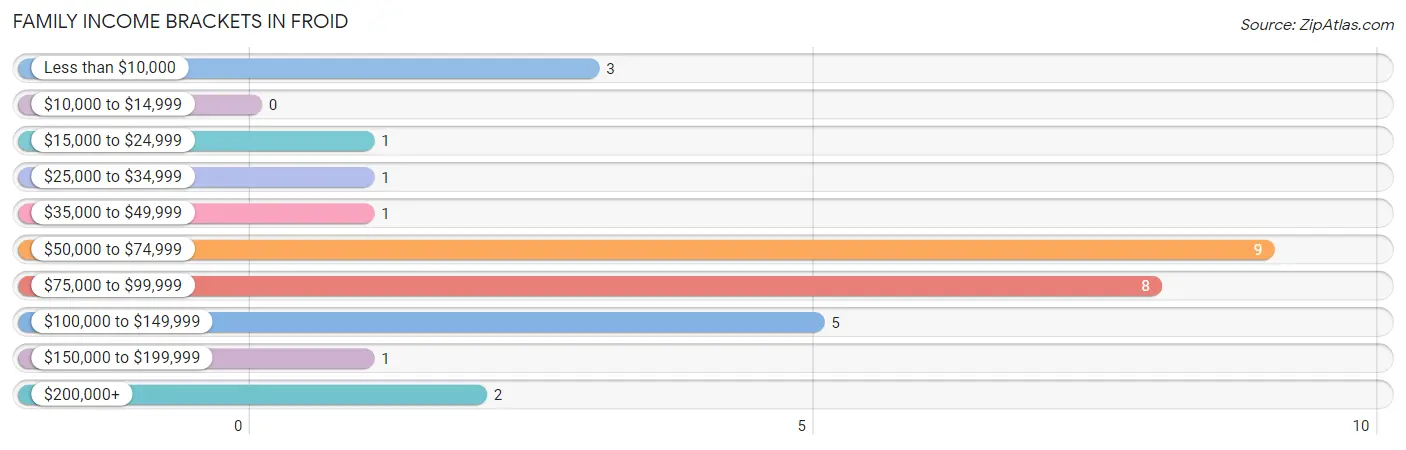
| Income Bracket | # Families | % Families |
| Less than $10,000 | 3 | 9.7% |
| $10,000 to $14,999 | 0 | 0.0% |
| $15,000 to $24,999 | 1 | 3.2% |
| $25,000 to $34,999 | 1 | 3.2% |
| $35,000 to $49,999 | 1 | 3.2% |
| $50,000 to $74,999 | 9 | 29.0% |
| $75,000 to $99,999 | 8 | 25.8% |
| $100,000 to $149,999 | 5 | 16.1% |
| $150,000 to $199,999 | 1 | 3.2% |
| $200,000+ | 2 | 6.5% |
Family Income by Famaliy Size in Froid
3-person families (5 | 16.1%) account for the highest median family income in Froid with $196,250 per family, while 3-person families (5 | 16.1%) have the highest median income of $65,417 per family member.
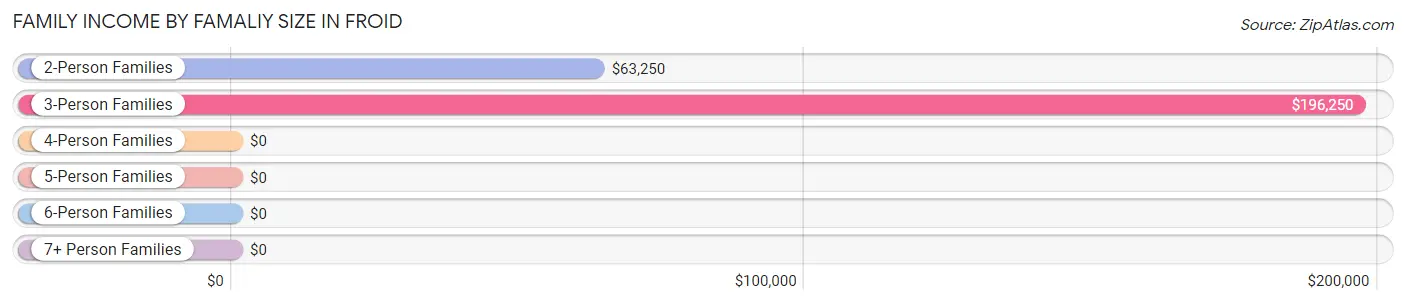
| Income Bracket | # Families | Median Income |
| 2-Person Families | 21 (67.7%) | $63,250 |
| 3-Person Families | 5 (16.1%) | $196,250 |
| 4-Person Families | 2 (6.5%) | $0 |
| 5-Person Families | 3 (9.7%) | $0 |
| 6-Person Families | 0 (0.0%) | $0 |
| 7+ Person Families | 0 (0.0%) | $0 |
| Total | 31 (100.0%) | $85,625 |
Family Income by Number of Earners in Froid
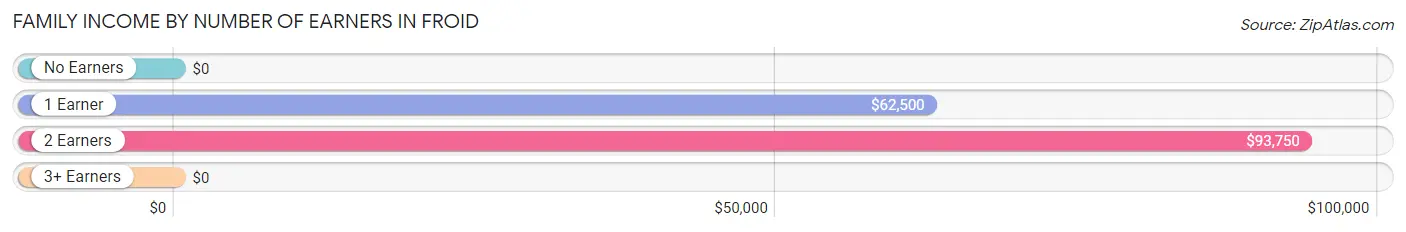
| Number of Earners | # Families | Median Income |
| No Earners | 7 (22.6%) | $0 |
| 1 Earner | 8 (25.8%) | $62,500 |
| 2 Earners | 13 (41.9%) | $93,750 |
| 3+ Earners | 3 (9.7%) | $0 |
| Total | 31 (100.0%) | $85,625 |
Household Income in Froid
Household Income Brackets in Froid
With 25 households falling in the category, the $50,000 to $74,999 income range is the most frequent in Froid, accounting for 37.9% of all households.
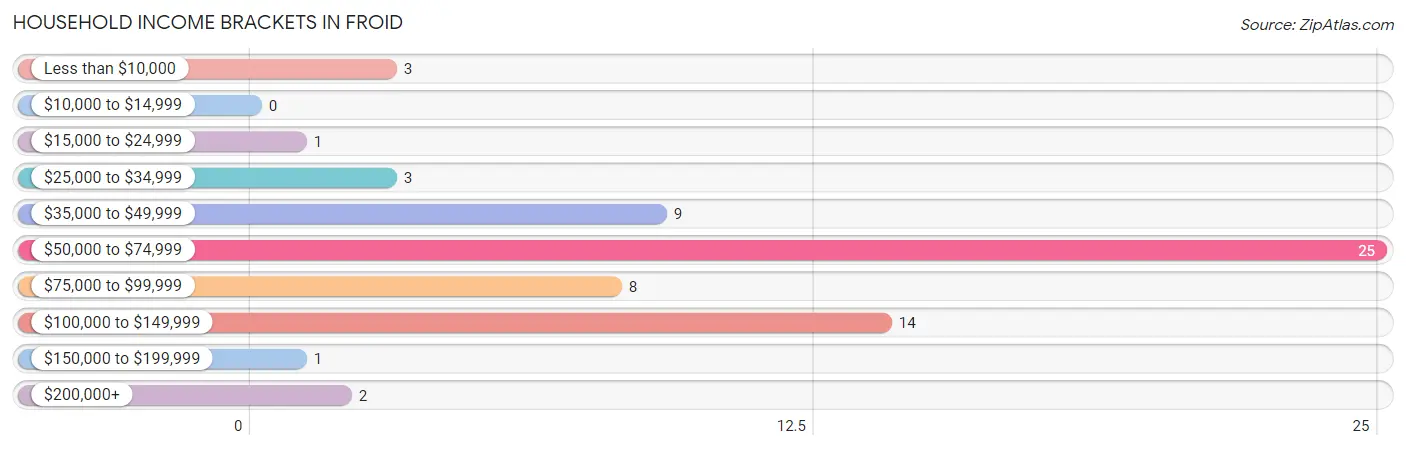
| Income Bracket | # Households | % Households |
| Less than $10,000 | 3 | 4.5% |
| $10,000 to $14,999 | 0 | 0.0% |
| $15,000 to $24,999 | 1 | 1.5% |
| $25,000 to $34,999 | 3 | 4.5% |
| $35,000 to $49,999 | 9 | 13.6% |
| $50,000 to $74,999 | 25 | 37.9% |
| $75,000 to $99,999 | 8 | 12.1% |
| $100,000 to $149,999 | 14 | 21.2% |
| $150,000 to $199,999 | 1 | 1.5% |
| $200,000+ | 2 | 3.0% |
Household Income by Householder Age in Froid
The median household income in Froid is $68,500, with the highest median household income of $108,125 found in the 25 to 44 years age bracket for the primary householder. A total of 21 households (31.8%) fall into this category. Meanwhile, the 15 to 24 years age bracket for the primary householder has the lowest median household income of $0, with 1 households (1.5%) in this group.
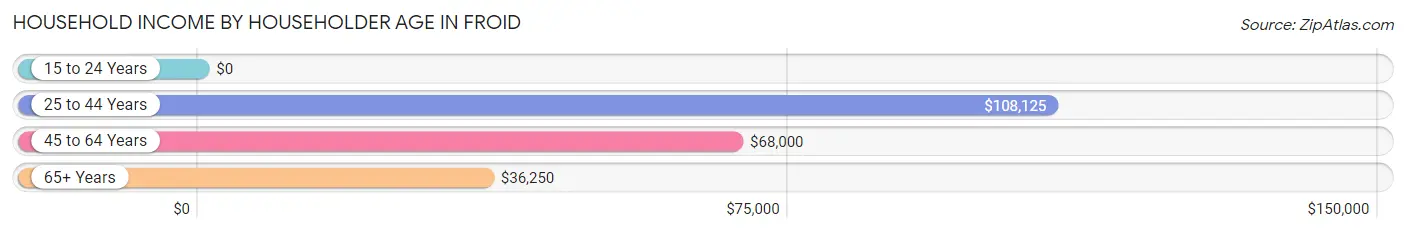
| Income Bracket | # Households | Median Income |
| 15 to 24 Years | 1 (1.5%) | $0 |
| 25 to 44 Years | 21 (31.8%) | $108,125 |
| 45 to 64 Years | 28 (42.4%) | $68,000 |
| 65+ Years | 16 (24.2%) | $36,250 |
| Total | 66 (100.0%) | $68,500 |
Poverty in Froid
Income Below Poverty by Sex and Age in Froid
With 4.1% poverty level for males and 8.2% for females among the residents of Froid, 65 to 74 year old males and 65 to 74 year old females are the most vulnerable to poverty, with 3 males (33.3%) and 4 females (25.0%) in their respective age groups living below the poverty level.
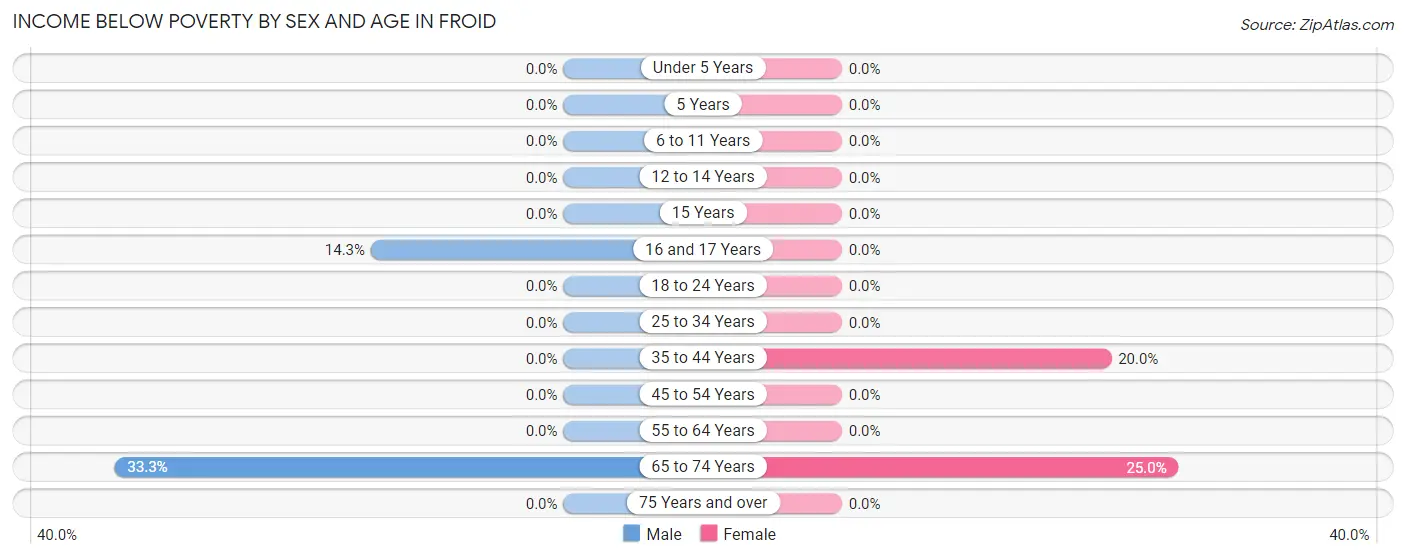
| Age Bracket | Male | Female |
| Under 5 Years | 0 (0.0%) | 0 (0.0%) |
| 5 Years | 0 (0.0%) | 0 (0.0%) |
| 6 to 11 Years | 0 (0.0%) | 0 (0.0%) |
| 12 to 14 Years | 0 (0.0%) | 0 (0.0%) |
| 15 Years | 0 (0.0%) | 0 (0.0%) |
| 16 and 17 Years | 1 (14.3%) | 0 (0.0%) |
| 18 to 24 Years | 0 (0.0%) | 0 (0.0%) |
| 25 to 34 Years | 0 (0.0%) | 0 (0.0%) |
| 35 to 44 Years | 0 (0.0%) | 2 (20.0%) |
| 45 to 54 Years | 0 (0.0%) | 0 (0.0%) |
| 55 to 64 Years | 0 (0.0%) | 0 (0.0%) |
| 65 to 74 Years | 3 (33.3%) | 4 (25.0%) |
| 75 Years and over | 0 (0.0%) | 0 (0.0%) |
| Total | 4 (4.1%) | 6 (8.2%) |
Income Above Poverty by Sex and Age in Froid
According to the poverty statistics in Froid, males aged under 5 years and females aged under 5 years are the age groups that are most secure financially, with 100.0% of males and 100.0% of females in these age groups living above the poverty line.
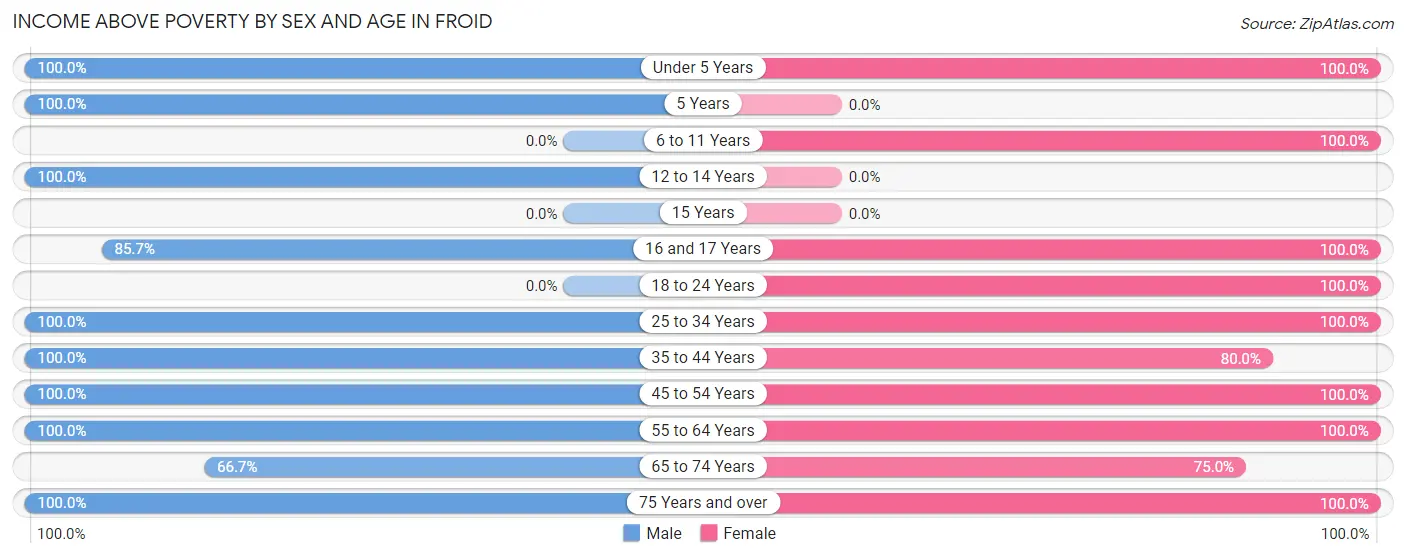
| Age Bracket | Male | Female |
| Under 5 Years | 6 (100.0%) | 5 (100.0%) |
| 5 Years | 2 (100.0%) | 0 (0.0%) |
| 6 to 11 Years | 0 (0.0%) | 3 (100.0%) |
| 12 to 14 Years | 6 (100.0%) | 0 (0.0%) |
| 15 Years | 0 (0.0%) | 0 (0.0%) |
| 16 and 17 Years | 6 (85.7%) | 9 (100.0%) |
| 18 to 24 Years | 0 (0.0%) | 2 (100.0%) |
| 25 to 34 Years | 36 (100.0%) | 2 (100.0%) |
| 35 to 44 Years | 6 (100.0%) | 8 (80.0%) |
| 45 to 54 Years | 8 (100.0%) | 1 (100.0%) |
| 55 to 64 Years | 12 (100.0%) | 23 (100.0%) |
| 65 to 74 Years | 6 (66.7%) | 12 (75.0%) |
| 75 Years and over | 6 (100.0%) | 2 (100.0%) |
| Total | 94 (95.9%) | 67 (91.8%) |
Income Below Poverty Among Married-Couple Families in Froid
The poverty statistics for married-couple families in Froid show that 11.5% or 3 of the total 26 families live below the poverty line. Families with no children have the highest poverty rate of 15.8%, comprising of 3 families. On the other hand, families with 1 or 2 children have the lowest poverty rate of 0.0%, which includes 0 families.
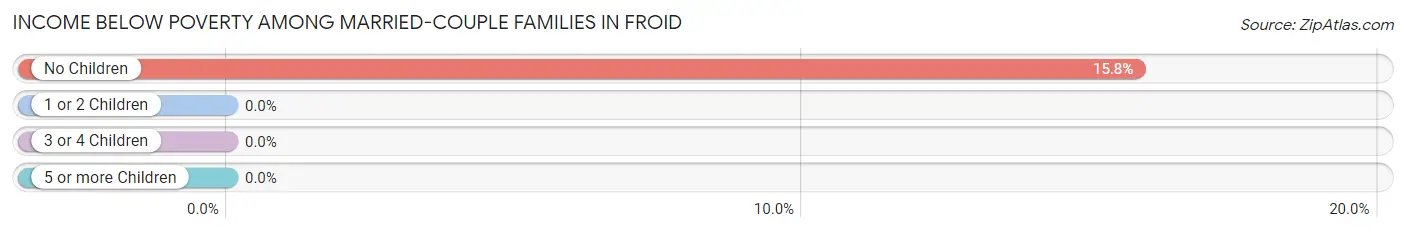
| Children | Above Poverty | Below Poverty |
| No Children | 16 (84.2%) | 3 (15.8%) |
| 1 or 2 Children | 4 (100.0%) | 0 (0.0%) |
| 3 or 4 Children | 3 (100.0%) | 0 (0.0%) |
| 5 or more Children | 0 (0.0%) | 0 (0.0%) |
| Total | 23 (88.5%) | 3 (11.5%) |
Income Below Poverty Among Single-Parent Households in Froid
| Children | Single Father | Single Mother |
| No Children | 0 (0.0%) | 0 (0.0%) |
| 1 or 2 Children | 0 (0.0%) | 0 (0.0%) |
| 3 or 4 Children | 0 (0.0%) | 0 (0.0%) |
| 5 or more Children | 0 (0.0%) | 0 (0.0%) |
| Total | 0 (0.0%) | 0 (0.0%) |
Income Below Poverty Among Married-Couple vs Single-Parent Households in Froid
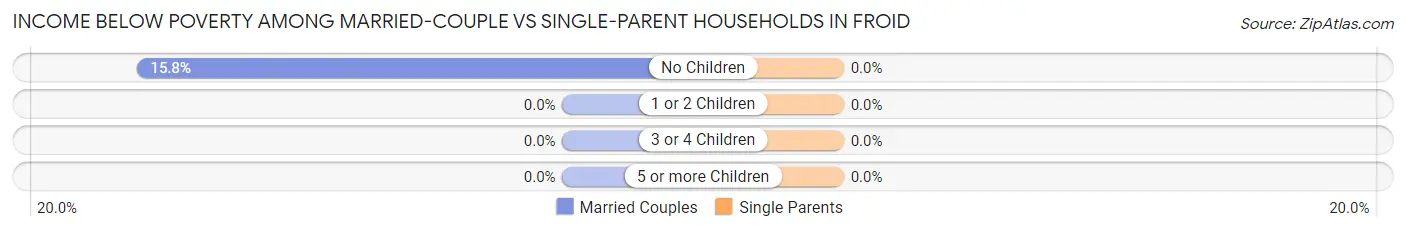
| Children | Married-Couple Families | Single-Parent Households |
| No Children | 3 (15.8%) | 0 (0.0%) |
| 1 or 2 Children | 0 (0.0%) | 0 (0.0%) |
| 3 or 4 Children | 0 (0.0%) | 0 (0.0%) |
| 5 or more Children | 0 (0.0%) | 0 (0.0%) |
| Total | 3 (11.5%) | 0 (0.0%) |
Race in Froid
The most populous races in Froid are Native / Alaskan (159 | 52.3%), White / Caucasian (140 | 46.1%), and Black / African American (3 | 1.0%).
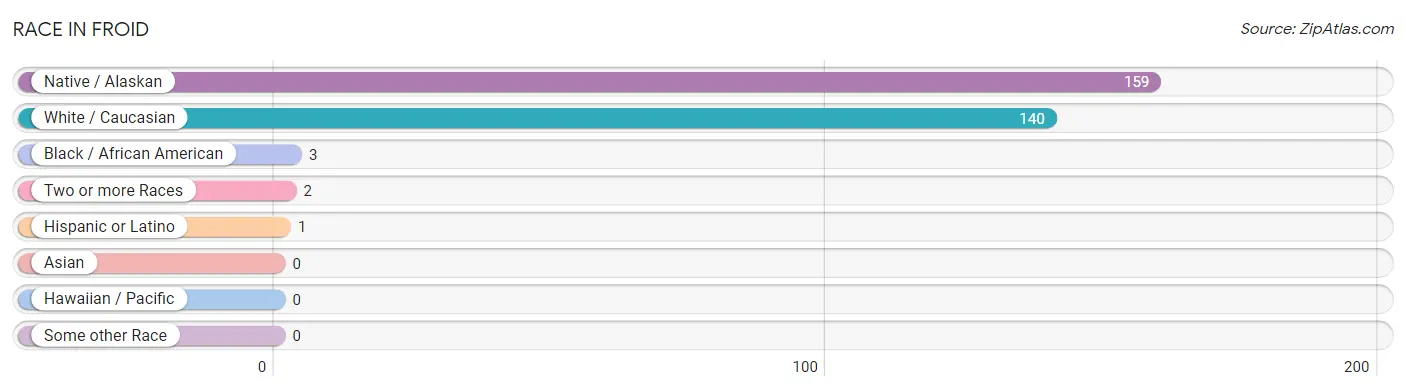
| Race | # Population | % Population |
| Asian | 0 | 0.0% |
| Black / African American | 3 | 1.0% |
| Hawaiian / Pacific | 0 | 0.0% |
| Hispanic or Latino | 1 | 0.3% |
| Native / Alaskan | 159 | 52.3% |
| White / Caucasian | 140 | 46.1% |
| Two or more Races | 2 | 0.7% |
| Some other Race | 0 | 0.0% |
| Total | 304 | 100.0% |
Ancestry in Froid
The most populous ancestries reported in Froid are German (55 | 18.1%), Norwegian (39 | 12.8%), Irish (15 | 4.9%), Scotch-Irish (8 | 2.6%), and Scottish (8 | 2.6%), together accounting for 41.1% of all Froid residents.
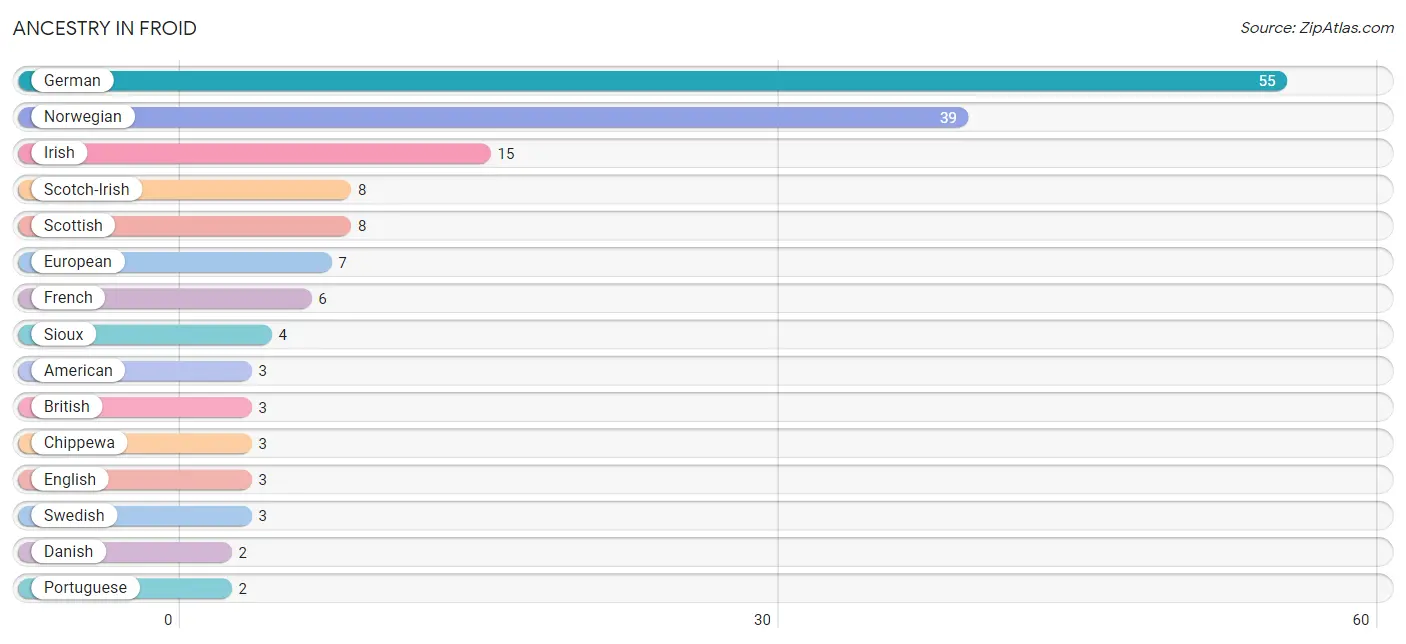
| Ancestry | # Population | % Population |
| American | 3 | 1.0% |
| British | 3 | 1.0% |
| Chippewa | 3 | 1.0% |
| Czech | 1 | 0.3% |
| Danish | 2 | 0.7% |
| English | 3 | 1.0% |
| European | 7 | 2.3% |
| French | 6 | 2.0% |
| German | 55 | 18.1% |
| Irish | 15 | 4.9% |
| Norwegian | 39 | 12.8% |
| Portuguese | 2 | 0.7% |
| Scotch-Irish | 8 | 2.6% |
| Scottish | 8 | 2.6% |
| Sioux | 4 | 1.3% |
| Spaniard | 1 | 0.3% |
| Swedish | 3 | 1.0% | View All 17 Rows |
Immigrants in Froid

| Immigration Origin | # Population | % Population | View All 0 Rows |
Sex and Age in Froid
Sex and Age in Froid
The most populous age groups in Froid are 25 to 29 Years (26 | 26.5%) for men and 5 to 9 Years (131 | 63.6%) for women.
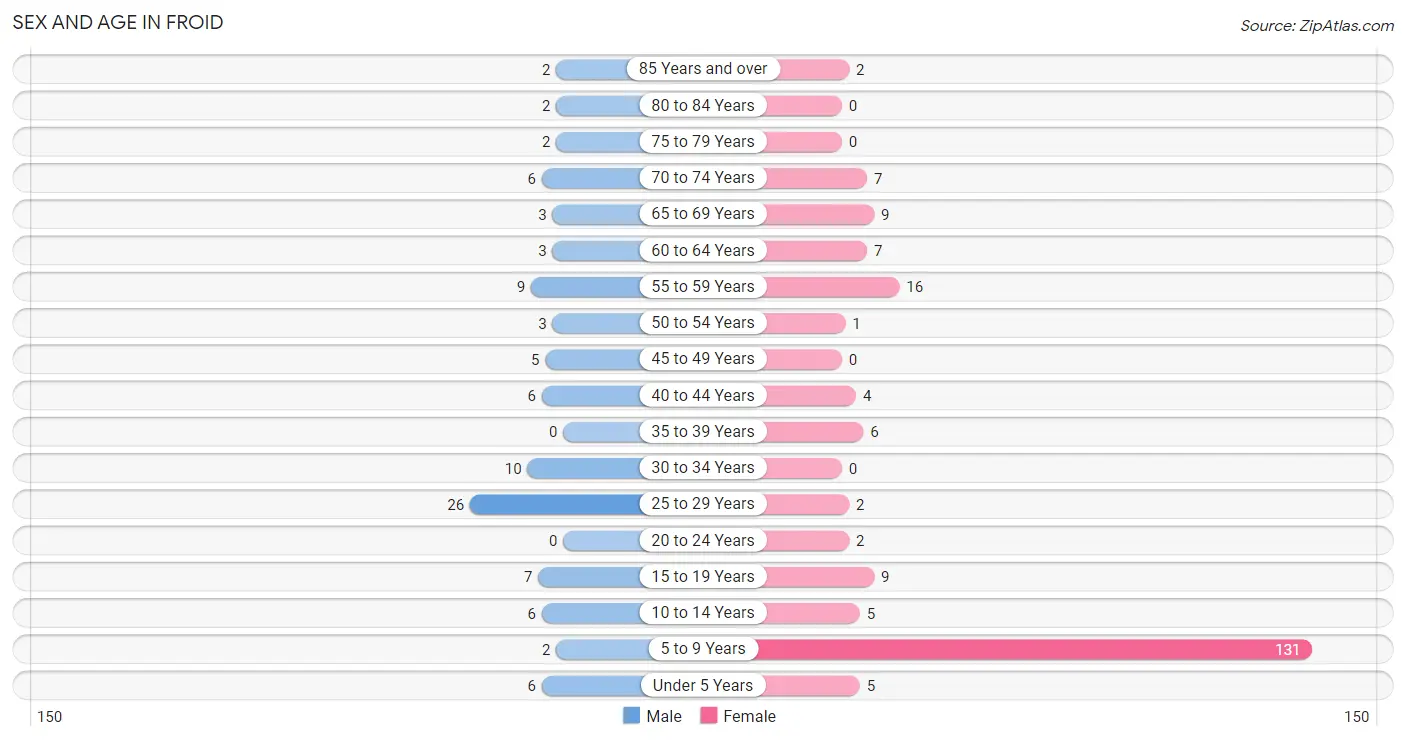
| Age Bracket | Male | Female |
| Under 5 Years | 6 (6.1%) | 5 (2.4%) |
| 5 to 9 Years | 2 (2.0%) | 131 (63.6%) |
| 10 to 14 Years | 6 (6.1%) | 5 (2.4%) |
| 15 to 19 Years | 7 (7.1%) | 9 (4.4%) |
| 20 to 24 Years | 0 (0.0%) | 2 (1.0%) |
| 25 to 29 Years | 26 (26.5%) | 2 (1.0%) |
| 30 to 34 Years | 10 (10.2%) | 0 (0.0%) |
| 35 to 39 Years | 0 (0.0%) | 6 (2.9%) |
| 40 to 44 Years | 6 (6.1%) | 4 (1.9%) |
| 45 to 49 Years | 5 (5.1%) | 0 (0.0%) |
| 50 to 54 Years | 3 (3.1%) | 1 (0.5%) |
| 55 to 59 Years | 9 (9.2%) | 16 (7.8%) |
| 60 to 64 Years | 3 (3.1%) | 7 (3.4%) |
| 65 to 69 Years | 3 (3.1%) | 9 (4.4%) |
| 70 to 74 Years | 6 (6.1%) | 7 (3.4%) |
| 75 to 79 Years | 2 (2.0%) | 0 (0.0%) |
| 80 to 84 Years | 2 (2.0%) | 0 (0.0%) |
| 85 Years and over | 2 (2.0%) | 2 (1.0%) |
| Total | 98 (100.0%) | 206 (100.0%) |
Families and Households in Froid
Median Family Size in Froid
The median family size in Froid is 3.39 persons per family, with single female/mother families (2 | 6.5%) accounting for the largest median family size of 4 persons per family. On the other hand, single male/father families (3 | 9.7%) represent the smallest median family size with 3.00 persons per family.
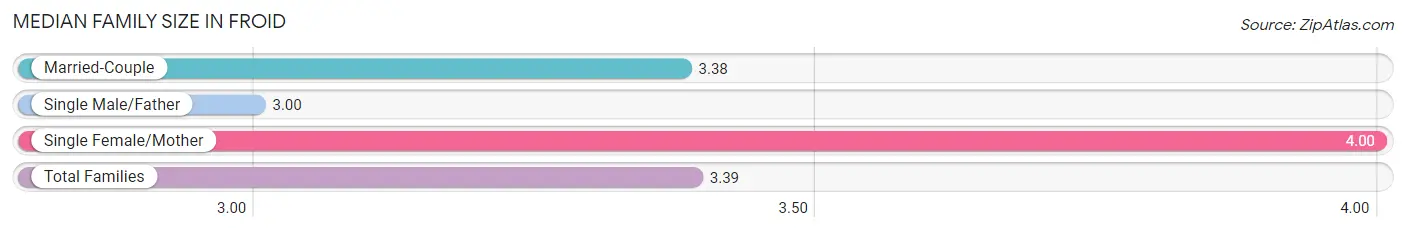
| Family Type | # Families | Family Size |
| Married-Couple | 26 (83.9%) | 3.38 |
| Single Male/Father | 3 (9.7%) | 3.00 |
| Single Female/Mother | 2 (6.5%) | 4.00 |
| Total Families | 31 (100.0%) | 3.39 |
Median Household Size in Froid
The median household size in Froid is 4.61 persons per household, with non-family households (35 | 53.0%) accounting for the largest median household size of 5.57 persons per household. married-couple households (26 | 39.4%) represent the smallest median household size with 3.38 persons per household.
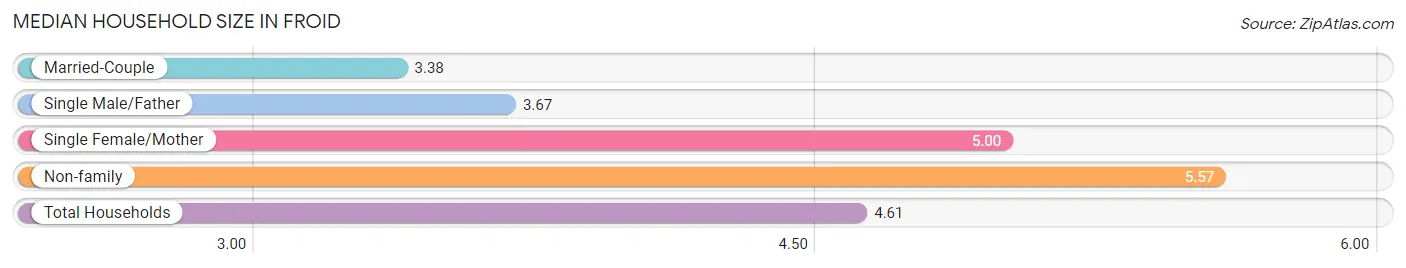
| Household Type | # Households | Household Size |
| Married-Couple | 26 (39.4%) | 3.38 |
| Single Male/Father | 3 (4.5%) | 3.67 |
| Single Female/Mother | 2 (3.0%) | 5.00 |
| Non-family | 35 (53.0%) | 5.57 |
| Total Households | 66 (100.0%) | 4.61 |
Household Size by Marriage Status in Froid
Out of a total of 66 households in Froid, 31 (47.0%) are family households, while 35 (53.0%) are nonfamily households. The most numerous type of family households are 2-person households, comprising 20, and the most common type of nonfamily households are 1-person households, comprising 15.
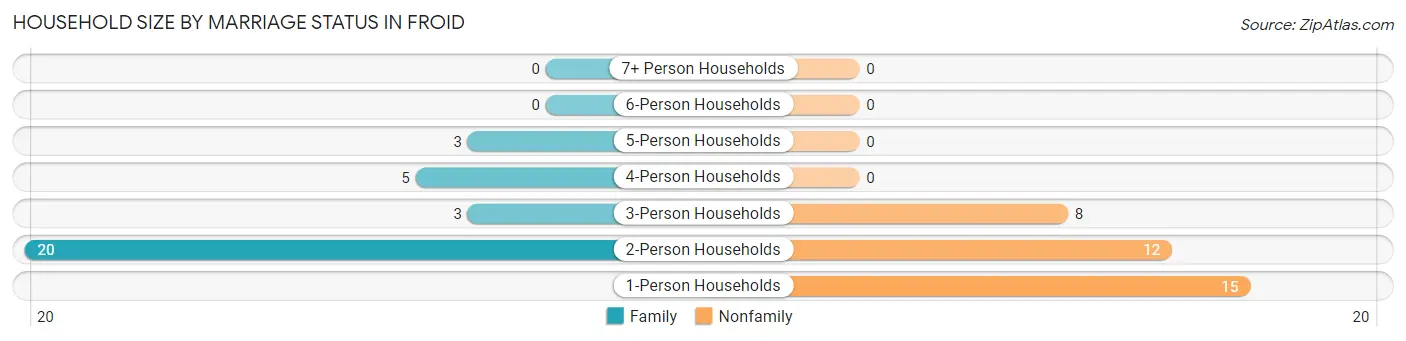
| Household Size | Family Households | Nonfamily Households |
| 1-Person Households | - | 15 (22.7%) |
| 2-Person Households | 20 (30.3%) | 12 (18.2%) |
| 3-Person Households | 3 (4.5%) | 8 (12.1%) |
| 4-Person Households | 5 (7.6%) | 0 (0.0%) |
| 5-Person Households | 3 (4.5%) | 0 (0.0%) |
| 6-Person Households | 0 (0.0%) | 0 (0.0%) |
| 7+ Person Households | 0 (0.0%) | 0 (0.0%) |
| Total | 31 (47.0%) | 35 (53.0%) |
Female Fertility in Froid
Fertility by Age in Froid
| Age Bracket | Women with Births | Births / 1,000 Women |
| 15 to 19 years | 0 (0.0%) | 0.0 |
| 20 to 34 years | 0 (0.0%) | 0.0 |
| 35 to 50 years | 0 (0.0%) | 0.0 |
| Total | 0 (0.0%) | 0.0 |
Fertility by Age by Marriage Status in Froid
| Age Bracket | Married | Unmarried |
| 15 to 19 years | 0 (0.0%) | 0 (0.0%) |
| 20 to 34 years | 0 (0.0%) | 0 (0.0%) |
| 35 to 50 years | 0 (0.0%) | 0 (0.0%) |
| Total | 0 (0.0%) | 0 (0.0%) |
Fertility by Education in Froid
| Educational Attainment | Women with Births | Births / 1,000 Women |
| Less than High School | 0 (0.0%) | 0.0 |
| High School Diploma | 0 (0.0%) | 0.0 |
| College or Associate's Degree | 0 (0.0%) | 0.0 |
| Bachelor's Degree | 0 (0.0%) | 0.0 |
| Graduate Degree | 0 (0.0%) | 0.0 |
| Total | 0 (0.0%) | 0.0 |
Fertility by Education by Marriage Status in Froid
| Educational Attainment | Married | Unmarried |
| Less than High School | 0 (0.0%) | 0 (0.0%) |
| High School Diploma | 0 (0.0%) | 0 (0.0%) |
| College or Associate's Degree | 0 (0.0%) | 0 (0.0%) |
| Bachelor's Degree | 0 (0.0%) | 0 (0.0%) |
| Graduate Degree | 0 (0.0%) | 0 (0.0%) |
| Total | 0 (0.0%) | 0 (0.0%) |
Employment Characteristics in Froid
Employment by Class of Employer in Froid
Among the 104 employed individuals in Froid, local government employees (56 | 53.8%), private company employees (36 | 34.6%), and self-employed (not incorporated) (7 | 6.7%) make up the most common classes of employment.
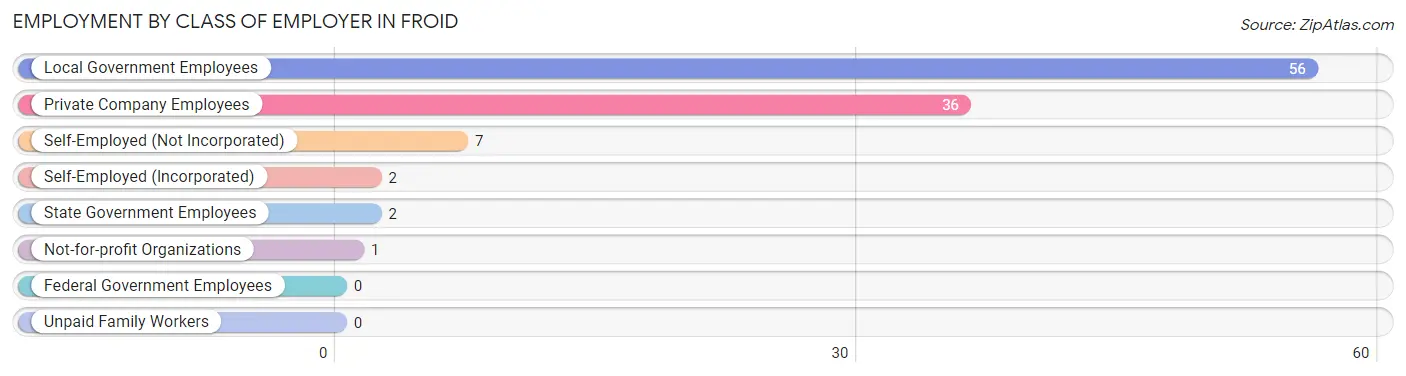
| Employer Class | # Employees | % Employees |
| Private Company Employees | 36 | 34.6% |
| Self-Employed (Incorporated) | 2 | 1.9% |
| Self-Employed (Not Incorporated) | 7 | 6.7% |
| Not-for-profit Organizations | 1 | 1.0% |
| Local Government Employees | 56 | 53.8% |
| State Government Employees | 2 | 1.9% |
| Federal Government Employees | 0 | 0.0% |
| Unpaid Family Workers | 0 | 0.0% |
| Total | 104 | 100.0% |
Employment Status by Age in Froid
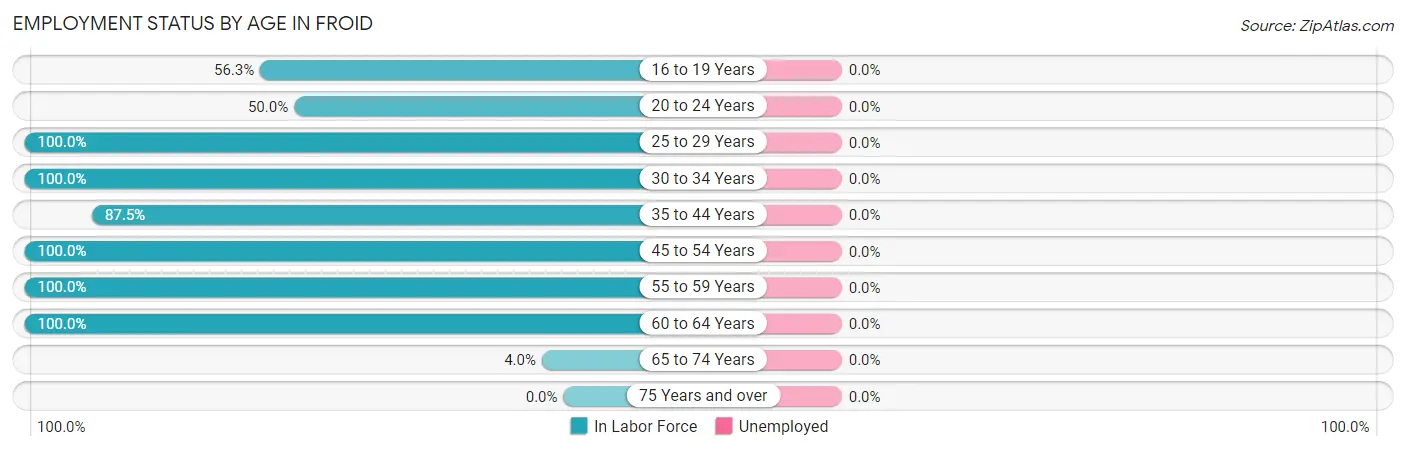
| Age Bracket | In Labor Force | Unemployed |
| 16 to 19 Years | 9 (56.3%) | 0 (0.0%) |
| 20 to 24 Years | 1 (50.0%) | 0 (0.0%) |
| 25 to 29 Years | 28 (100.0%) | 0 (0.0%) |
| 30 to 34 Years | 10 (100.0%) | 0 (0.0%) |
| 35 to 44 Years | 14 (87.5%) | 0 (0.0%) |
| 45 to 54 Years | 9 (100.0%) | 0 (0.0%) |
| 55 to 59 Years | 25 (100.0%) | 0 (0.0%) |
| 60 to 64 Years | 10 (100.0%) | 0 (0.0%) |
| 65 to 74 Years | 1 (4.0%) | 0 (0.0%) |
| 75 Years and over | 0 (0.0%) | 0 (0.0%) |
| Total | 107 (71.8%) | 0 (0.0%) |
Employment Status by Educational Attainment in Froid
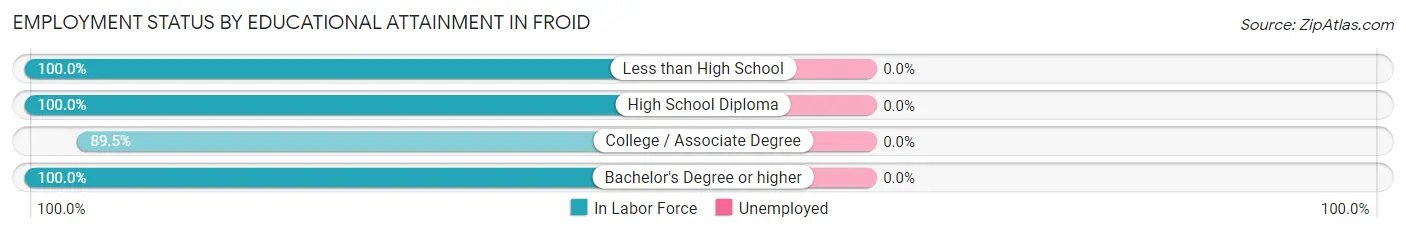
| Educational Attainment | In Labor Force | Unemployed |
| Less than High School | 6 (100.0%) | 0 (0.0%) |
| High School Diploma | 16 (100.0%) | 0 (0.0%) |
| College / Associate Degree | 17 (89.5%) | 0 (0.0%) |
| Bachelor's Degree or higher | 57 (100.0%) | 0 (0.0%) |
| Total | 96 (98.0%) | 0 (0.0%) |
Employment Occupations by Sex in Froid
Management, Business, Science and Arts Occupations
The most common Management, Business, Science and Arts occupations in Froid are Management (19 | 17.8%), Community & Social Service (15 | 14.0%), Education Instruction & Library (15 | 14.0%), and Business & Financial (2 | 1.9%).
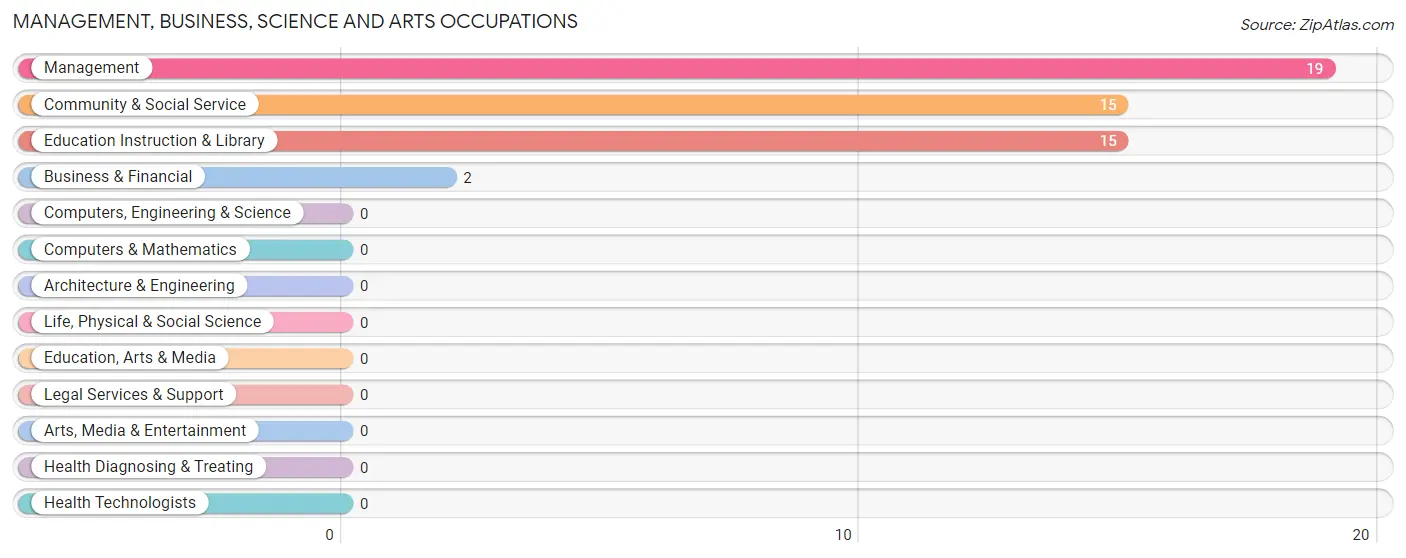
Management, Business, Science and Arts Occupations by Sex
Within the Management, Business, Science and Arts occupations in Froid, the most male-oriented occupations are Community & Social Service (60.0%), Education Instruction & Library (60.0%), and Management (10.5%), while the most female-oriented occupations are Business & Financial (100.0%), Management (89.5%), and Community & Social Service (40.0%).
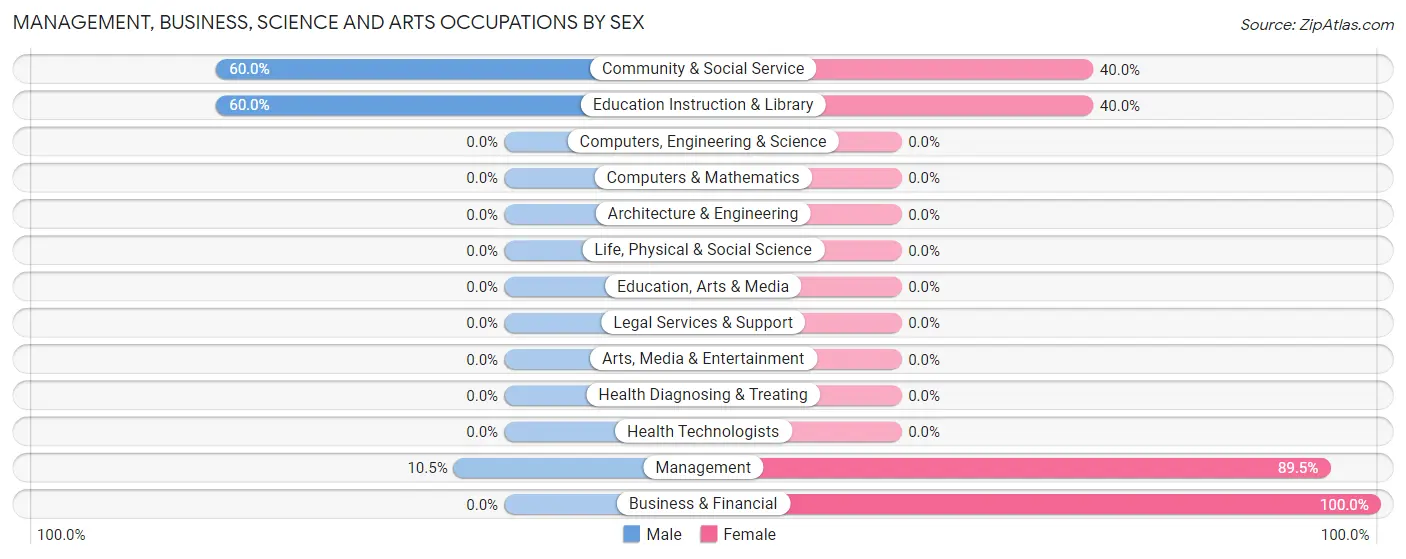
| Occupation | Male | Female |
| Management | 2 (10.5%) | 17 (89.5%) |
| Business & Financial | 0 (0.0%) | 2 (100.0%) |
| Computers, Engineering & Science | 0 (0.0%) | 0 (0.0%) |
| Computers & Mathematics | 0 (0.0%) | 0 (0.0%) |
| Architecture & Engineering | 0 (0.0%) | 0 (0.0%) |
| Life, Physical & Social Science | 0 (0.0%) | 0 (0.0%) |
| Community & Social Service | 9 (60.0%) | 6 (40.0%) |
| Education, Arts & Media | 0 (0.0%) | 0 (0.0%) |
| Legal Services & Support | 0 (0.0%) | 0 (0.0%) |
| Education Instruction & Library | 9 (60.0%) | 6 (40.0%) |
| Arts, Media & Entertainment | 0 (0.0%) | 0 (0.0%) |
| Health Diagnosing & Treating | 0 (0.0%) | 0 (0.0%) |
| Health Technologists | 0 (0.0%) | 0 (0.0%) |
| Total (Category) | 11 (30.6%) | 25 (69.4%) |
| Total (Overall) | 62 (57.9%) | 45 (42.1%) |
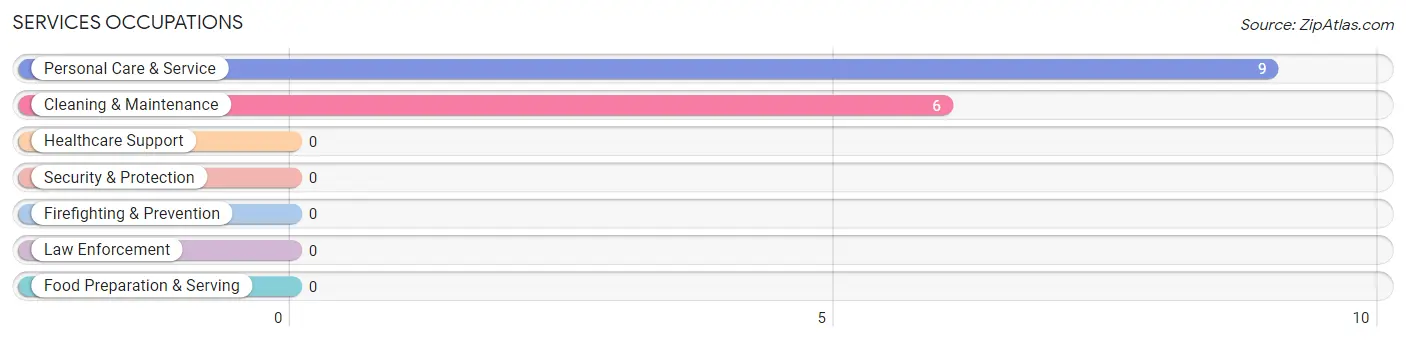
Services Occupations
The most common Services occupations in Froid are Personal Care & Service (9 | 8.4%), and Cleaning & Maintenance (6 | 5.6%).
Services Occupations by Sex
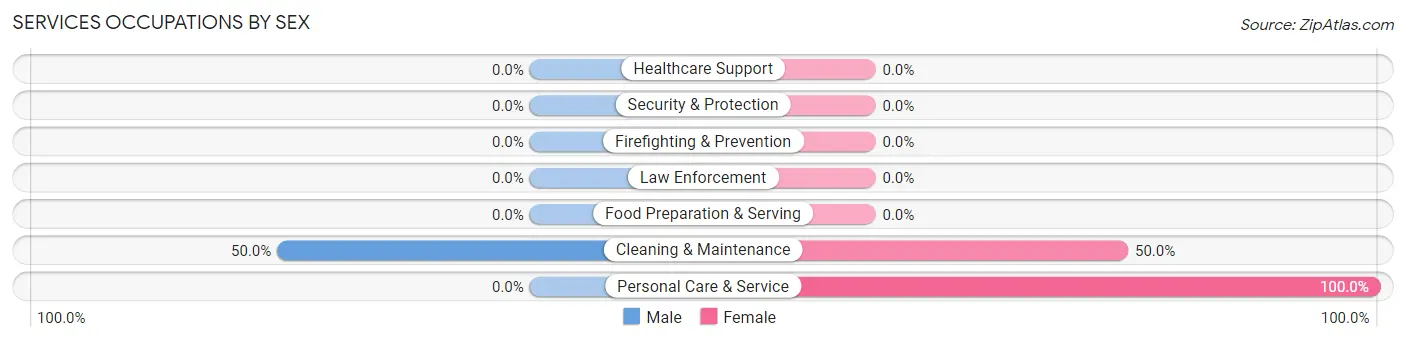
| Occupation | Male | Female |
| Healthcare Support | 0 (0.0%) | 0 (0.0%) |
| Security & Protection | 0 (0.0%) | 0 (0.0%) |
| Firefighting & Prevention | 0 (0.0%) | 0 (0.0%) |
| Law Enforcement | 0 (0.0%) | 0 (0.0%) |
| Food Preparation & Serving | 0 (0.0%) | 0 (0.0%) |
| Cleaning & Maintenance | 3 (50.0%) | 3 (50.0%) |
| Personal Care & Service | 0 (0.0%) | 9 (100.0%) |
| Total (Category) | 3 (20.0%) | 12 (80.0%) |
| Total (Overall) | 62 (57.9%) | 45 (42.1%) |
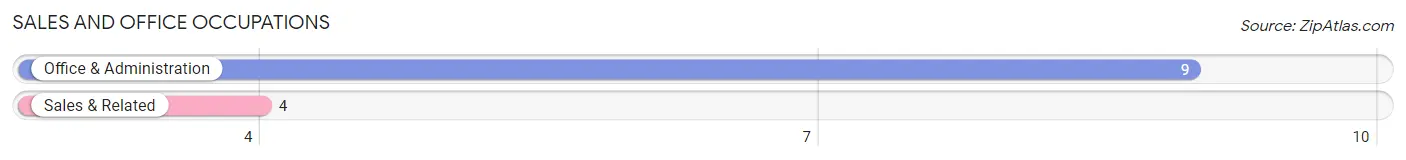
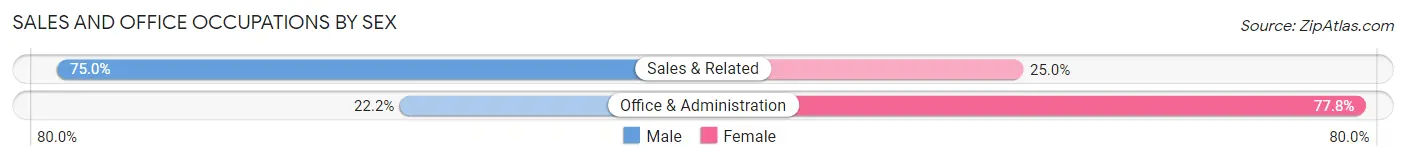
Sales and Office Occupations
The most common Sales and Office occupations in Froid are Office & Administration (9 | 8.4%), and Sales & Related (4 | 3.7%).
Sales and Office Occupations by Sex
| Occupation | Male | Female |
| Sales & Related | 3 (75.0%) | 1 (25.0%) |
| Office & Administration | 2 (22.2%) | 7 (77.8%) |
| Total (Category) | 5 (38.5%) | 8 (61.5%) |
| Total (Overall) | 62 (57.9%) | 45 (42.1%) |
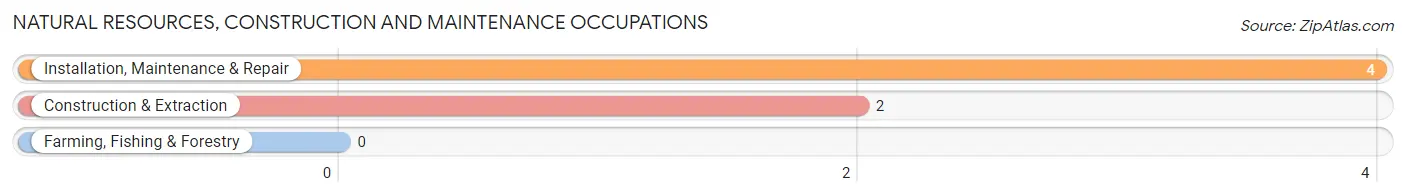
Natural Resources, Construction and Maintenance Occupations
The most common Natural Resources, Construction and Maintenance occupations in Froid are Installation, Maintenance & Repair (4 | 3.7%), and Construction & Extraction (2 | 1.9%).
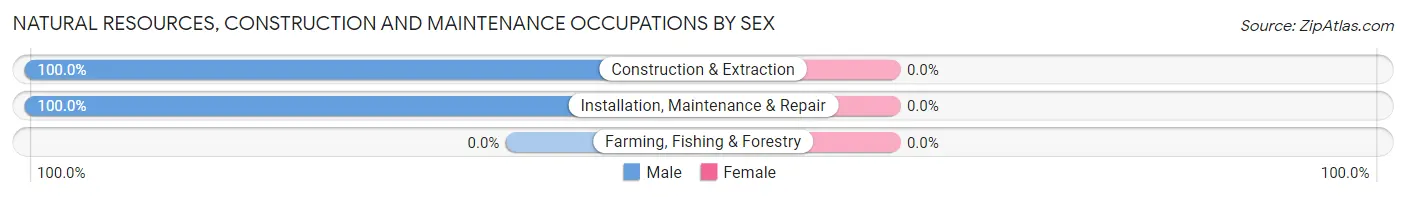
Natural Resources, Construction and Maintenance Occupations by Sex
| Occupation | Male | Female |
| Farming, Fishing & Forestry | 0 (0.0%) | 0 (0.0%) |
| Construction & Extraction | 2 (100.0%) | 0 (0.0%) |
| Installation, Maintenance & Repair | 4 (100.0%) | 0 (0.0%) |
| Total (Category) | 6 (100.0%) | 0 (0.0%) |
| Total (Overall) | 62 (57.9%) | 45 (42.1%) |
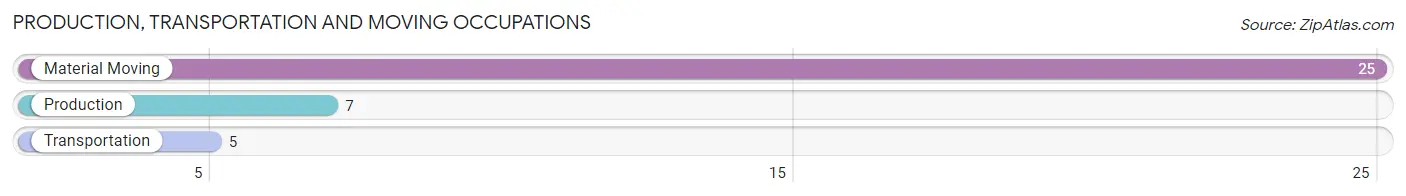
Production, Transportation and Moving Occupations
The most common Production, Transportation and Moving occupations in Froid are Material Moving (25 | 23.4%), Production (7 | 6.5%), and Transportation (5 | 4.7%).
Production, Transportation and Moving Occupations by Sex
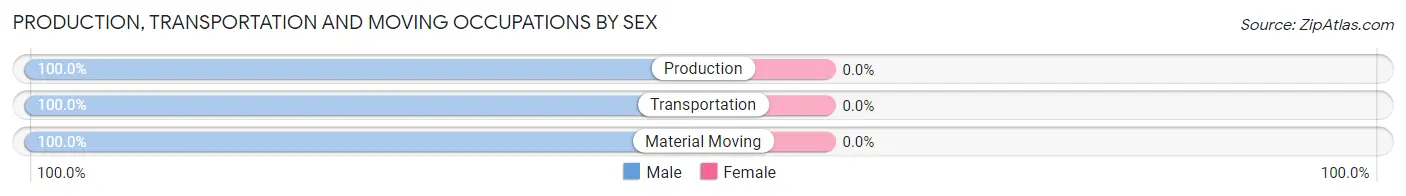
| Occupation | Male | Female |
| Production | 7 (100.0%) | 0 (0.0%) |
| Transportation | 5 (100.0%) | 0 (0.0%) |
| Material Moving | 25 (100.0%) | 0 (0.0%) |
| Total (Category) | 37 (100.0%) | 0 (0.0%) |
| Total (Overall) | 62 (57.9%) | 45 (42.1%) |
Employment Industries by Sex in Froid
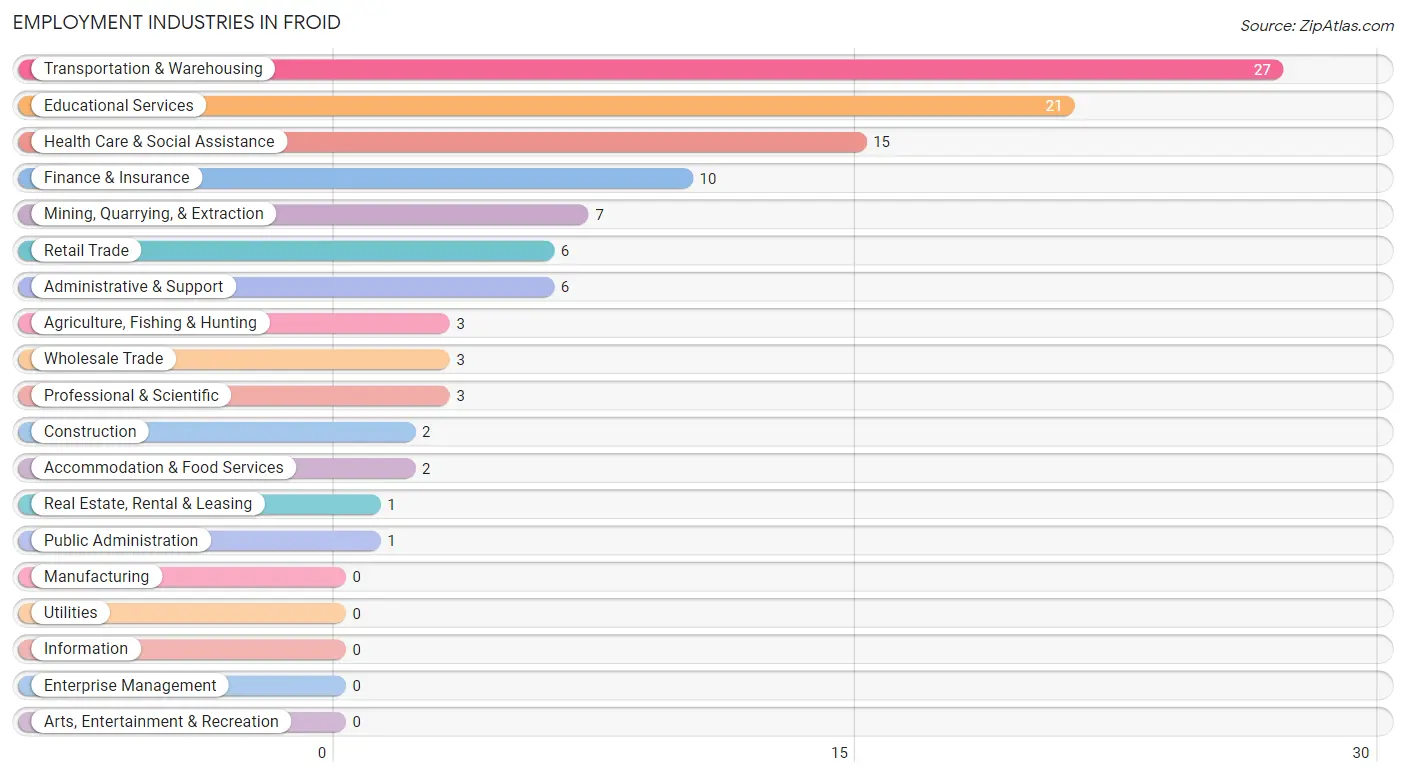
Employment Industries in Froid
The major employment industries in Froid include Transportation & Warehousing (27 | 25.2%), Educational Services (21 | 19.6%), Health Care & Social Assistance (15 | 14.0%), Finance & Insurance (10 | 9.3%), and Mining, Quarrying, & Extraction (7 | 6.5%).
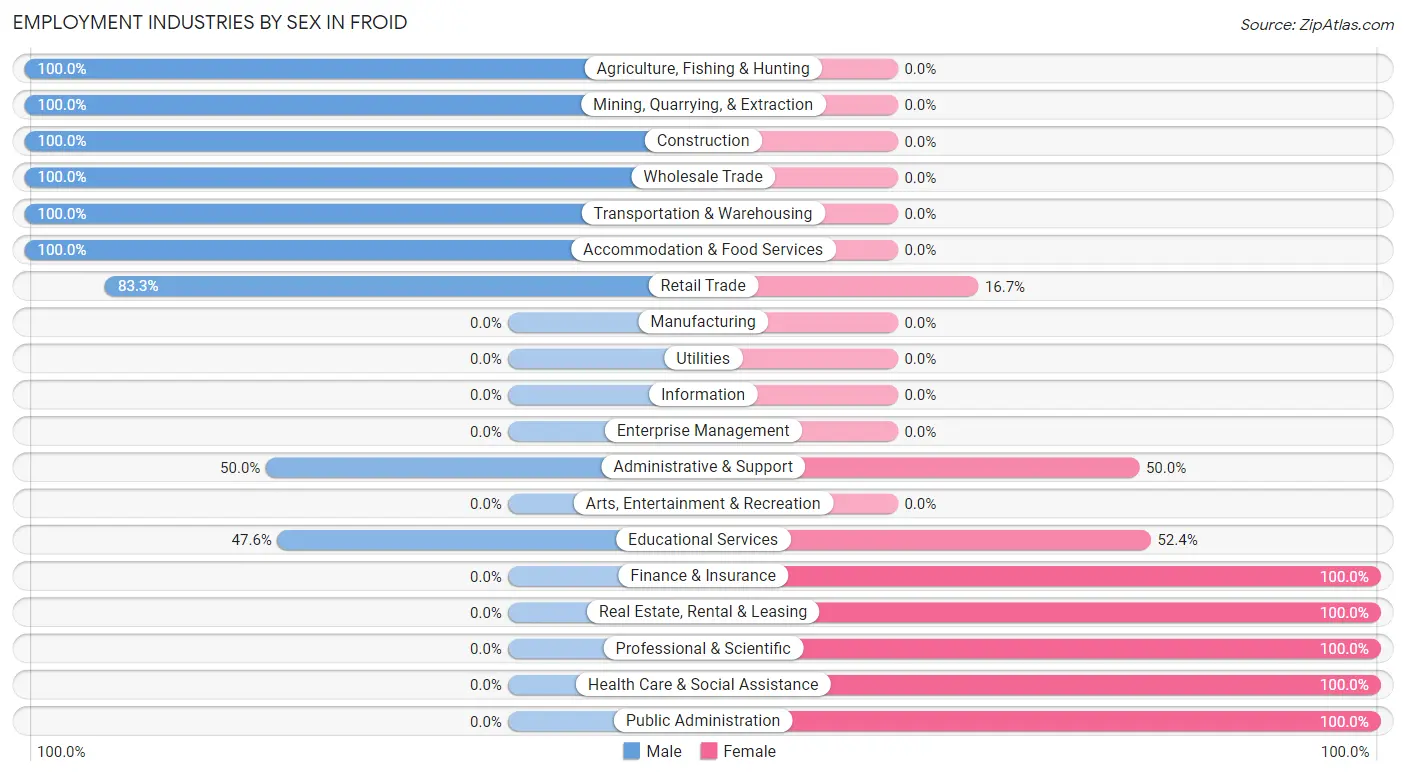
Employment Industries by Sex in Froid
The Froid industries that see more men than women are Agriculture, Fishing & Hunting (100.0%), Mining, Quarrying, & Extraction (100.0%), and Construction (100.0%), whereas the industries that tend to have a higher number of women are Finance & Insurance (100.0%), Real Estate, Rental & Leasing (100.0%), and Professional & Scientific (100.0%).
| Industry | Male | Female |
| Agriculture, Fishing & Hunting | 3 (100.0%) | 0 (0.0%) |
| Mining, Quarrying, & Extraction | 7 (100.0%) | 0 (0.0%) |
| Construction | 2 (100.0%) | 0 (0.0%) |
| Manufacturing | 0 (0.0%) | 0 (0.0%) |
| Wholesale Trade | 3 (100.0%) | 0 (0.0%) |
| Retail Trade | 5 (83.3%) | 1 (16.7%) |
| Transportation & Warehousing | 27 (100.0%) | 0 (0.0%) |
| Utilities | 0 (0.0%) | 0 (0.0%) |
| Information | 0 (0.0%) | 0 (0.0%) |
| Finance & Insurance | 0 (0.0%) | 10 (100.0%) |
| Real Estate, Rental & Leasing | 0 (0.0%) | 1 (100.0%) |
| Professional & Scientific | 0 (0.0%) | 3 (100.0%) |
| Enterprise Management | 0 (0.0%) | 0 (0.0%) |
| Administrative & Support | 3 (50.0%) | 3 (50.0%) |
| Educational Services | 10 (47.6%) | 11 (52.4%) |
| Health Care & Social Assistance | 0 (0.0%) | 15 (100.0%) |
| Arts, Entertainment & Recreation | 0 (0.0%) | 0 (0.0%) |
| Accommodation & Food Services | 2 (100.0%) | 0 (0.0%) |
| Public Administration | 0 (0.0%) | 1 (100.0%) |
| Total | 62 (57.9%) | 45 (42.1%) |
Education in Froid
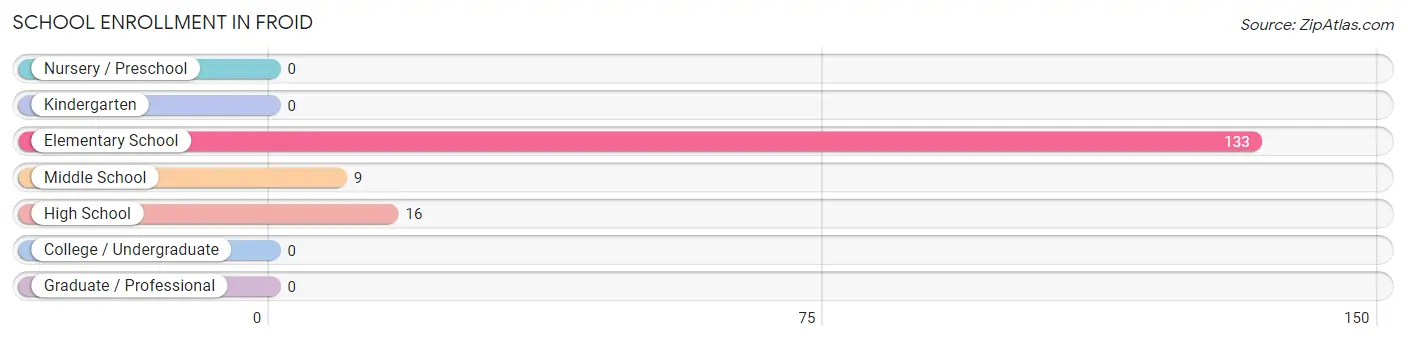
School Enrollment in Froid
The most common levels of schooling among the 158 students in Froid are elementary school (133 | 84.2%), high school (16 | 10.1%), and middle school (9 | 5.7%).
| School Level | # Students | % Students |
| Nursery / Preschool | 0 | 0.0% |
| Kindergarten | 0 | 0.0% |
| Elementary School | 133 | 84.2% |
| Middle School | 9 | 5.7% |
| High School | 16 | 10.1% |
| College / Undergraduate | 0 | 0.0% |
| Graduate / Professional | 0 | 0.0% |
| Total | 158 | 100.0% |
School Enrollment by Age by Funding Source in Froid
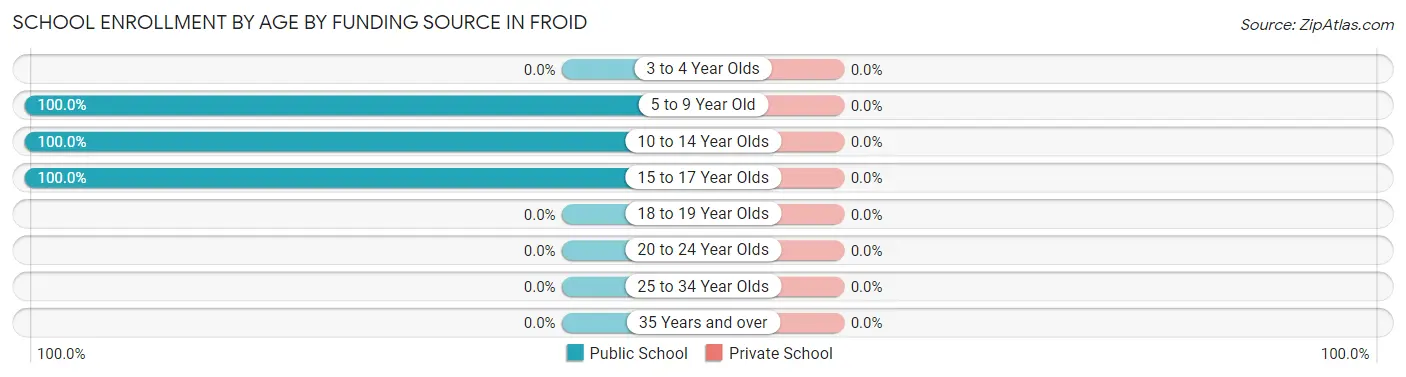
| Age Bracket | Public School | Private School |
| 3 to 4 Year Olds | 0 (0.0%) | 0 (0.0%) |
| 5 to 9 Year Old | 131 (100.0%) | 0 (0.0%) |
| 10 to 14 Year Olds | 11 (100.0%) | 0 (0.0%) |
| 15 to 17 Year Olds | 16 (100.0%) | 0 (0.0%) |
| 18 to 19 Year Olds | 0 (0.0%) | 0 (0.0%) |
| 20 to 24 Year Olds | 0 (0.0%) | 0 (0.0%) |
| 25 to 34 Year Olds | 0 (0.0%) | 0 (0.0%) |
| 35 Years and over | 0 (0.0%) | 0 (0.0%) |
| Total | 158 (100.0%) | 0 (0.0%) |
Educational Attainment by Field of Study in Froid
Arts & humanities (25 | 39.7%), education (21 | 33.3%), business (15 | 23.8%), and bio, nature & agricultural (2 | 3.2%) are the most common fields of study among 63 individuals in Froid who have obtained a bachelor's degree or higher.
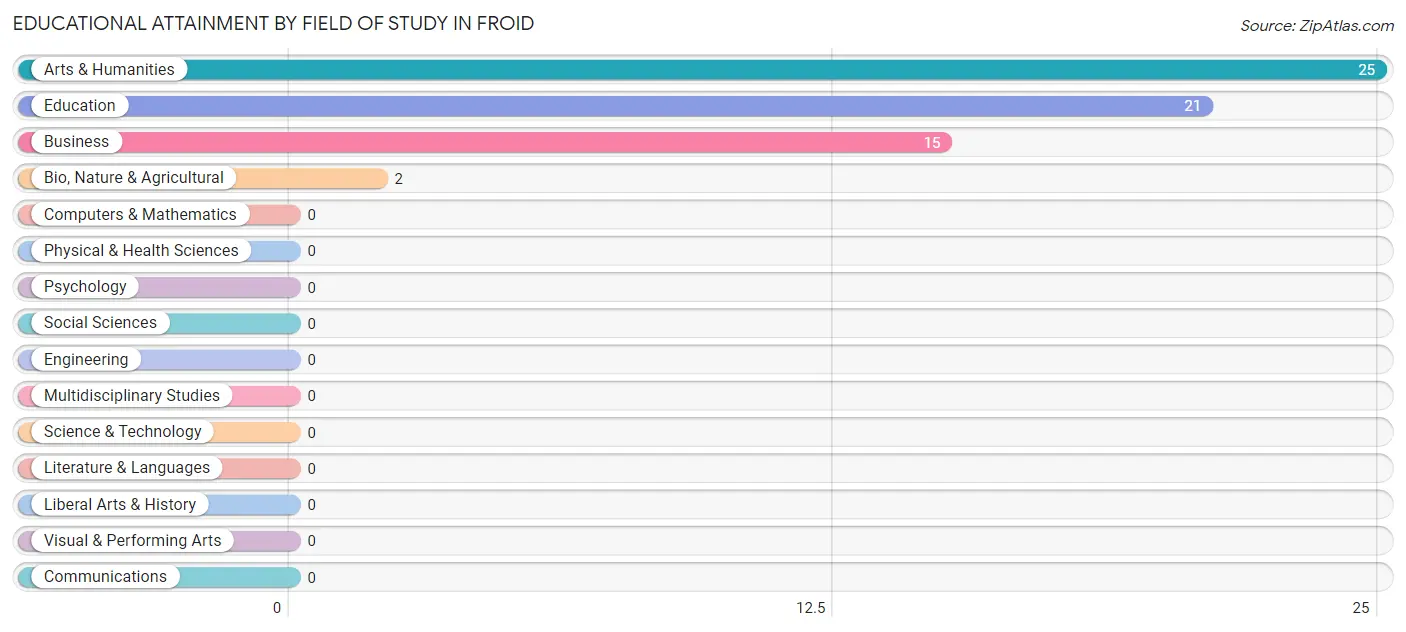
| Field of Study | # Graduates | % Graduates |
| Computers & Mathematics | 0 | 0.0% |
| Bio, Nature & Agricultural | 2 | 3.2% |
| Physical & Health Sciences | 0 | 0.0% |
| Psychology | 0 | 0.0% |
| Social Sciences | 0 | 0.0% |
| Engineering | 0 | 0.0% |
| Multidisciplinary Studies | 0 | 0.0% |
| Science & Technology | 0 | 0.0% |
| Business | 15 | 23.8% |
| Education | 21 | 33.3% |
| Literature & Languages | 0 | 0.0% |
| Liberal Arts & History | 0 | 0.0% |
| Visual & Performing Arts | 0 | 0.0% |
| Communications | 0 | 0.0% |
| Arts & Humanities | 25 | 39.7% |
| Total | 63 | 100.0% |
Transportation & Commute in Froid
Vehicle Availability by Sex in Froid
The most prevalent vehicle ownership categories in Froid are males with 2 vehicles (47, accounting for 79.7%) and females with 2 vehicles (17, making up 104.4%).
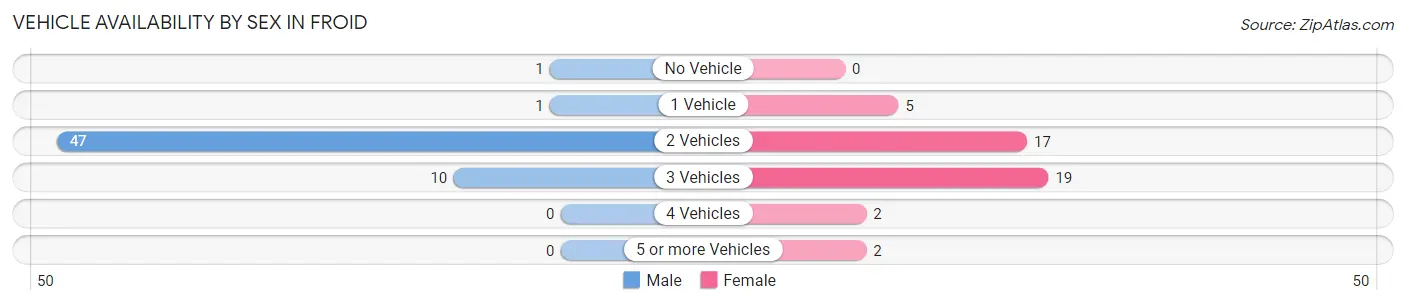
| Vehicles Available | Male | Female |
| No Vehicle | 1 (1.7%) | 0 (0.0%) |
| 1 Vehicle | 1 (1.7%) | 5 (11.1%) |
| 2 Vehicles | 47 (79.7%) | 17 (37.8%) |
| 3 Vehicles | 10 (17.0%) | 19 (42.2%) |
| 4 Vehicles | 0 (0.0%) | 2 (4.4%) |
| 5 or more Vehicles | 0 (0.0%) | 2 (4.4%) |
| Total | 59 (100.0%) | 45 (100.0%) |
Commute Time in Froid
The most frequently occuring commute durations in Froid are 45 to 59 minutes (27 commuters, 26.0%), less than 5 minutes (21 commuters, 20.2%), and 60 to 89 minutes (15 commuters, 14.4%).
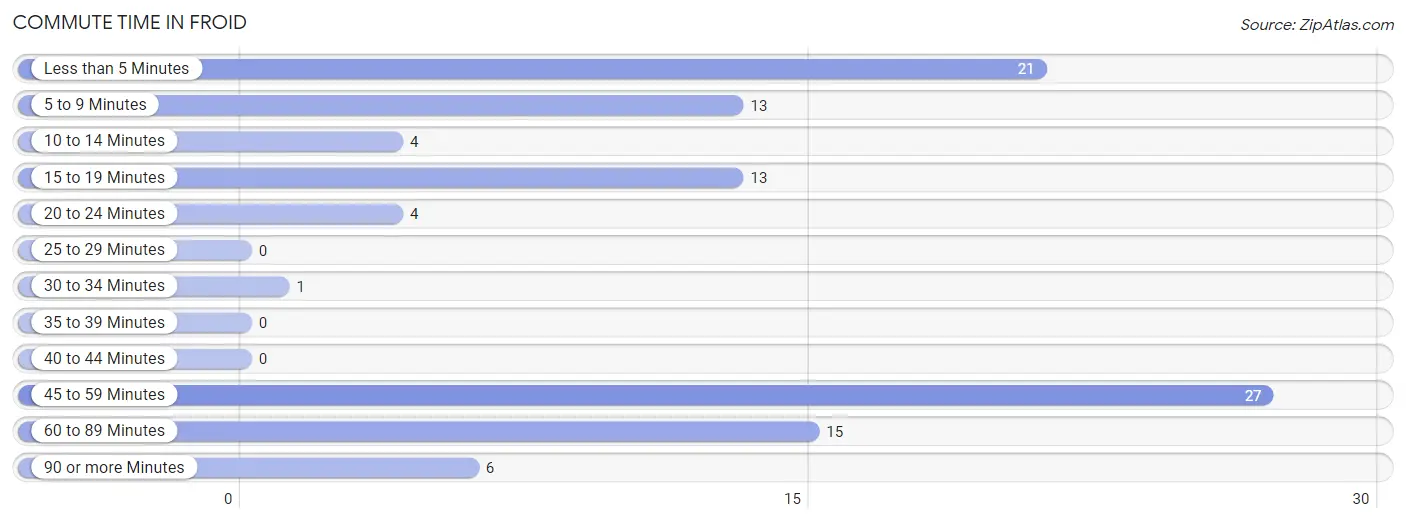
| Commute Time | # Commuters | % Commuters |
| Less than 5 Minutes | 21 | 20.2% |
| 5 to 9 Minutes | 13 | 12.5% |
| 10 to 14 Minutes | 4 | 3.8% |
| 15 to 19 Minutes | 13 | 12.5% |
| 20 to 24 Minutes | 4 | 3.8% |
| 25 to 29 Minutes | 0 | 0.0% |
| 30 to 34 Minutes | 1 | 1.0% |
| 35 to 39 Minutes | 0 | 0.0% |
| 40 to 44 Minutes | 0 | 0.0% |
| 45 to 59 Minutes | 27 | 26.0% |
| 60 to 89 Minutes | 15 | 14.4% |
| 90 or more Minutes | 6 | 5.8% |
Commute Time by Sex in Froid
The most common commute times in Froid are 45 to 59 minutes (25 commuters, 42.4%) for males and 15 to 19 minutes (11 commuters, 24.4%) for females.
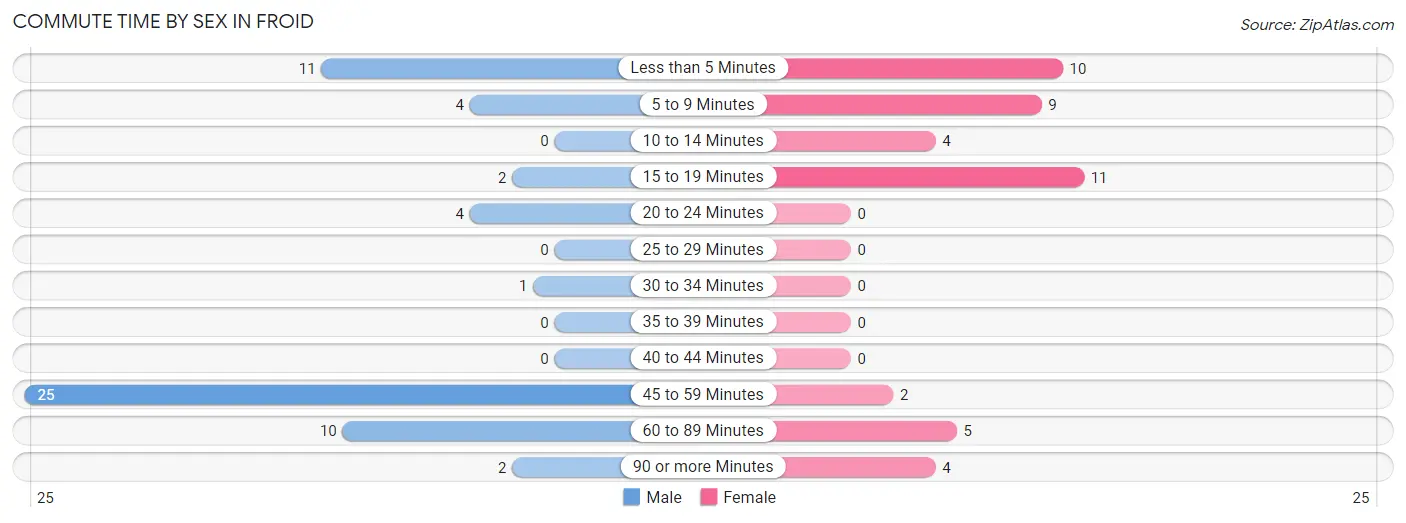
| Commute Time | Male | Female |
| Less than 5 Minutes | 11 (18.6%) | 10 (22.2%) |
| 5 to 9 Minutes | 4 (6.8%) | 9 (20.0%) |
| 10 to 14 Minutes | 0 (0.0%) | 4 (8.9%) |
| 15 to 19 Minutes | 2 (3.4%) | 11 (24.4%) |
| 20 to 24 Minutes | 4 (6.8%) | 0 (0.0%) |
| 25 to 29 Minutes | 0 (0.0%) | 0 (0.0%) |
| 30 to 34 Minutes | 1 (1.7%) | 0 (0.0%) |
| 35 to 39 Minutes | 0 (0.0%) | 0 (0.0%) |
| 40 to 44 Minutes | 0 (0.0%) | 0 (0.0%) |
| 45 to 59 Minutes | 25 (42.4%) | 2 (4.4%) |
| 60 to 89 Minutes | 10 (17.0%) | 5 (11.1%) |
| 90 or more Minutes | 2 (3.4%) | 4 (8.9%) |
Time of Departure to Work by Sex in Froid
The most frequent times of departure to work in Froid are 12:00 PM to 3:59 PM (25, 42.4%) for males and 7:30 AM to 7:59 AM (24, 53.3%) for females.
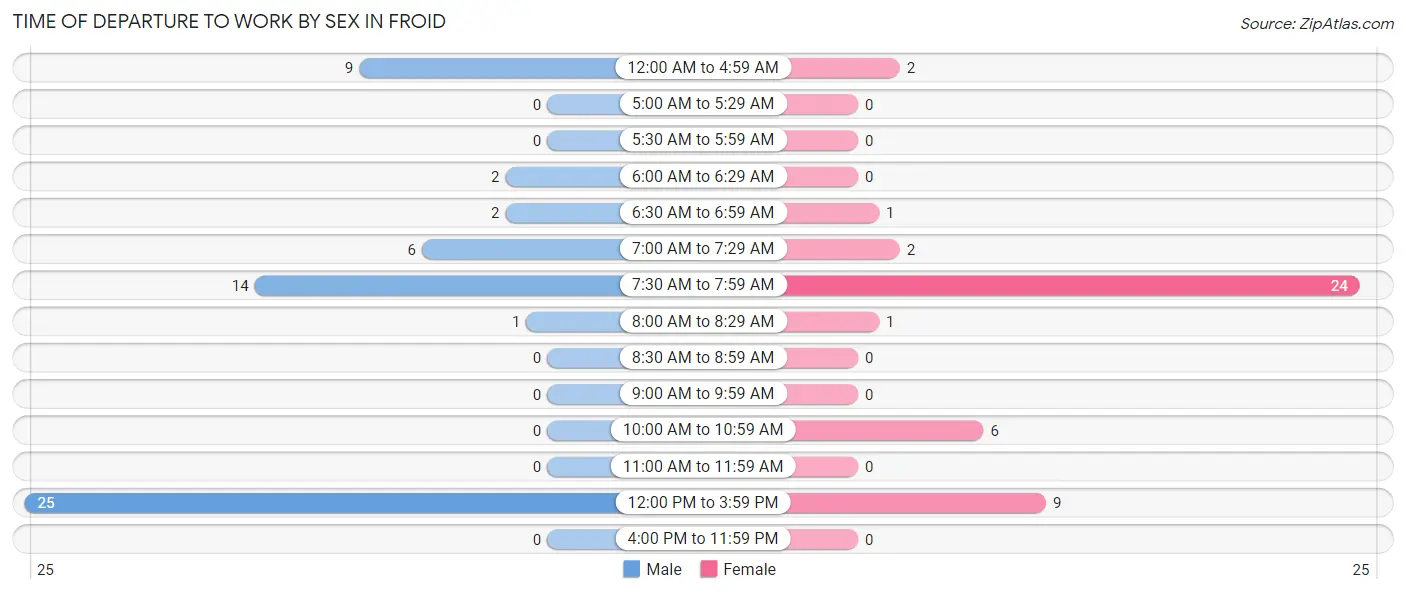
| Time of Departure | Male | Female |
| 12:00 AM to 4:59 AM | 9 (15.2%) | 2 (4.4%) |
| 5:00 AM to 5:29 AM | 0 (0.0%) | 0 (0.0%) |
| 5:30 AM to 5:59 AM | 0 (0.0%) | 0 (0.0%) |
| 6:00 AM to 6:29 AM | 2 (3.4%) | 0 (0.0%) |
| 6:30 AM to 6:59 AM | 2 (3.4%) | 1 (2.2%) |
| 7:00 AM to 7:29 AM | 6 (10.2%) | 2 (4.4%) |
| 7:30 AM to 7:59 AM | 14 (23.7%) | 24 (53.3%) |
| 8:00 AM to 8:29 AM | 1 (1.7%) | 1 (2.2%) |
| 8:30 AM to 8:59 AM | 0 (0.0%) | 0 (0.0%) |
| 9:00 AM to 9:59 AM | 0 (0.0%) | 0 (0.0%) |
| 10:00 AM to 10:59 AM | 0 (0.0%) | 6 (13.3%) |
| 11:00 AM to 11:59 AM | 0 (0.0%) | 0 (0.0%) |
| 12:00 PM to 3:59 PM | 25 (42.4%) | 9 (20.0%) |
| 4:00 PM to 11:59 PM | 0 (0.0%) | 0 (0.0%) |
| Total | 59 (100.0%) | 45 (100.0%) |
Housing Occupancy in Froid
Occupancy by Ownership in Froid
Of the total 66 dwellings in Froid, owner-occupied units account for 48 (72.7%), while renter-occupied units make up 18 (27.3%).
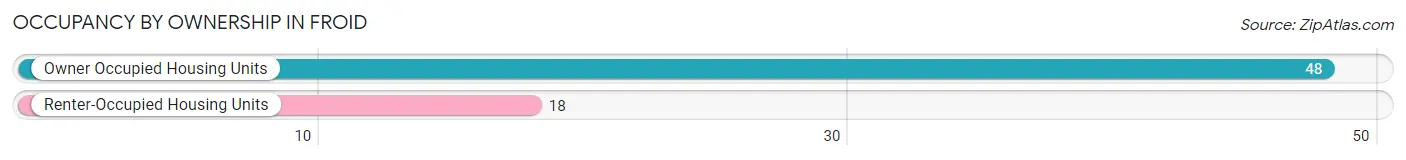
| Occupancy | # Housing Units | % Housing Units |
| Owner Occupied Housing Units | 48 | 72.7% |
| Renter-Occupied Housing Units | 18 | 27.3% |
| Total Occupied Housing Units | 66 | 100.0% |
Occupancy by Household Size in Froid
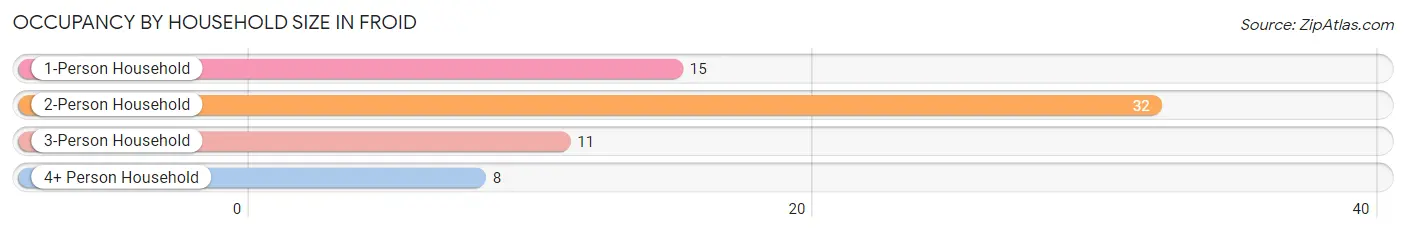
| Household Size | # Housing Units | % Housing Units |
| 1-Person Household | 15 | 22.7% |
| 2-Person Household | 32 | 48.5% |
| 3-Person Household | 11 | 16.7% |
| 4+ Person Household | 8 | 12.1% |
| Total Housing Units | 66 | 100.0% |
Occupancy by Ownership by Household Size in Froid
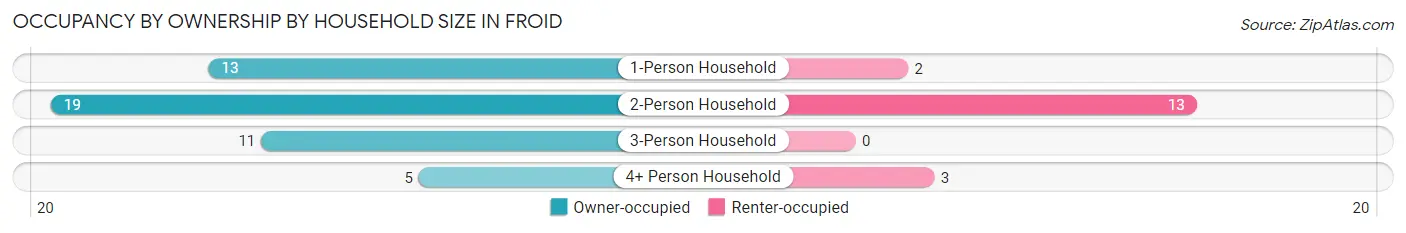
| Household Size | Owner-occupied | Renter-occupied |
| 1-Person Household | 13 (86.7%) | 2 (13.3%) |
| 2-Person Household | 19 (59.4%) | 13 (40.6%) |
| 3-Person Household | 11 (100.0%) | 0 (0.0%) |
| 4+ Person Household | 5 (62.5%) | 3 (37.5%) |
| Total Housing Units | 48 (72.7%) | 18 (27.3%) |
Occupancy by Educational Attainment in Froid
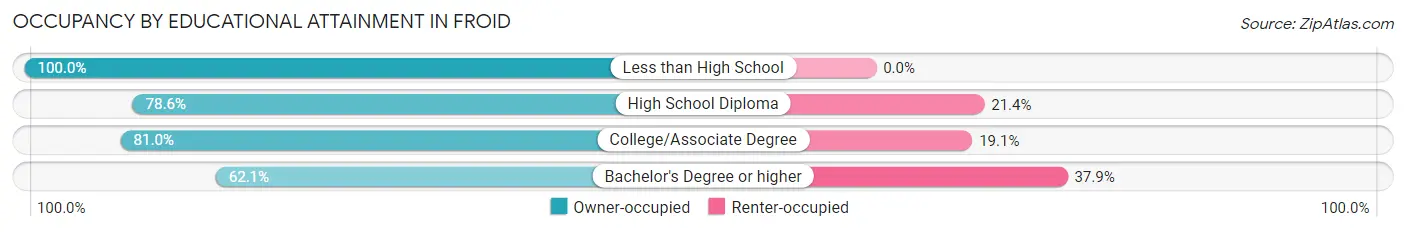
| Household Size | Owner-occupied | Renter-occupied |
| Less than High School | 2 (100.0%) | 0 (0.0%) |
| High School Diploma | 11 (78.6%) | 3 (21.4%) |
| College/Associate Degree | 17 (80.9%) | 4 (19.1%) |
| Bachelor's Degree or higher | 18 (62.1%) | 11 (37.9%) |
Occupancy by Age of Householder in Froid
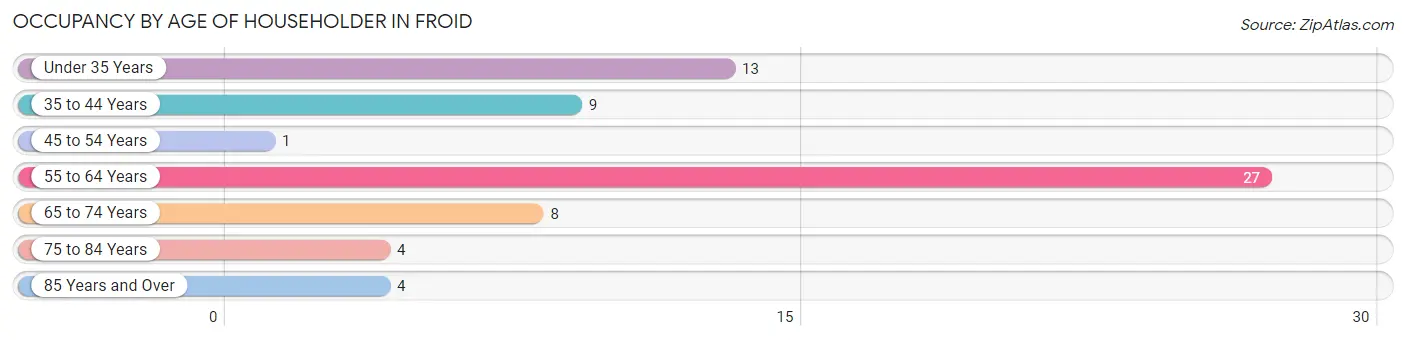
| Age Bracket | # Households | % Households |
| Under 35 Years | 13 | 19.7% |
| 35 to 44 Years | 9 | 13.6% |
| 45 to 54 Years | 1 | 1.5% |
| 55 to 64 Years | 27 | 40.9% |
| 65 to 74 Years | 8 | 12.1% |
| 75 to 84 Years | 4 | 6.1% |
| 85 Years and Over | 4 | 6.1% |
| Total | 66 | 100.0% |
Housing Finances in Froid
Median Income by Occupancy in Froid
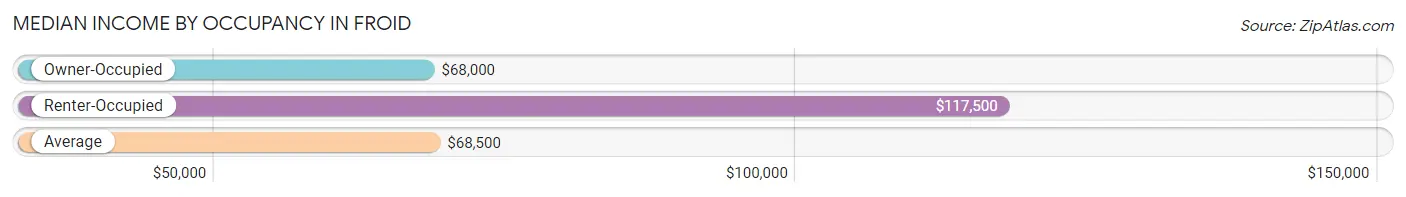
| Occupancy Type | # Households | Median Income |
| Owner-Occupied | 48 (72.7%) | $68,000 |
| Renter-Occupied | 18 (27.3%) | $117,500 |
| Average | 66 (100.0%) | $68,500 |
Occupancy by Householder Income Bracket in Froid
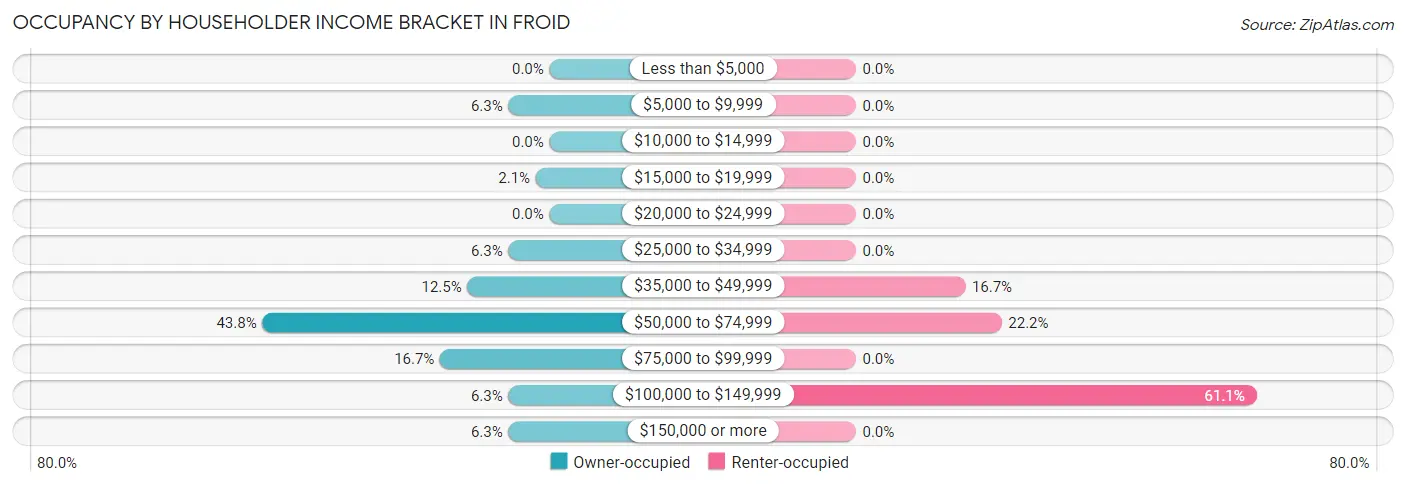
| Income Bracket | Owner-occupied | Renter-occupied |
| Less than $5,000 | 0 (0.0%) | 0 (0.0%) |
| $5,000 to $9,999 | 3 (6.2%) | 0 (0.0%) |
| $10,000 to $14,999 | 0 (0.0%) | 0 (0.0%) |
| $15,000 to $19,999 | 1 (2.1%) | 0 (0.0%) |
| $20,000 to $24,999 | 0 (0.0%) | 0 (0.0%) |
| $25,000 to $34,999 | 3 (6.2%) | 0 (0.0%) |
| $35,000 to $49,999 | 6 (12.5%) | 3 (16.7%) |
| $50,000 to $74,999 | 21 (43.8%) | 4 (22.2%) |
| $75,000 to $99,999 | 8 (16.7%) | 0 (0.0%) |
| $100,000 to $149,999 | 3 (6.2%) | 11 (61.1%) |
| $150,000 or more | 3 (6.2%) | 0 (0.0%) |
| Total | 48 (100.0%) | 18 (100.0%) |
Monthly Housing Cost Tiers in Froid
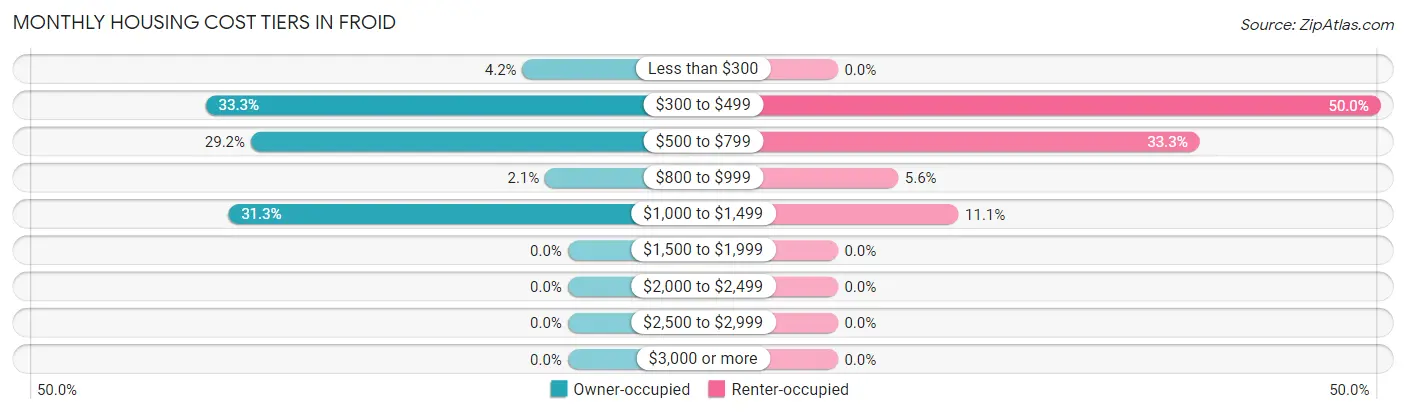
| Monthly Cost | Owner-occupied | Renter-occupied |
| Less than $300 | 2 (4.2%) | 0 (0.0%) |
| $300 to $499 | 16 (33.3%) | 9 (50.0%) |
| $500 to $799 | 14 (29.2%) | 6 (33.3%) |
| $800 to $999 | 1 (2.1%) | 1 (5.6%) |
| $1,000 to $1,499 | 15 (31.2%) | 2 (11.1%) |
| $1,500 to $1,999 | 0 (0.0%) | 0 (0.0%) |
| $2,000 to $2,499 | 0 (0.0%) | 0 (0.0%) |
| $2,500 to $2,999 | 0 (0.0%) | 0 (0.0%) |
| $3,000 or more | 0 (0.0%) | 0 (0.0%) |
| Total | 48 (100.0%) | 18 (100.0%) |
Physical Housing Characteristics in Froid
Housing Structures in Froid
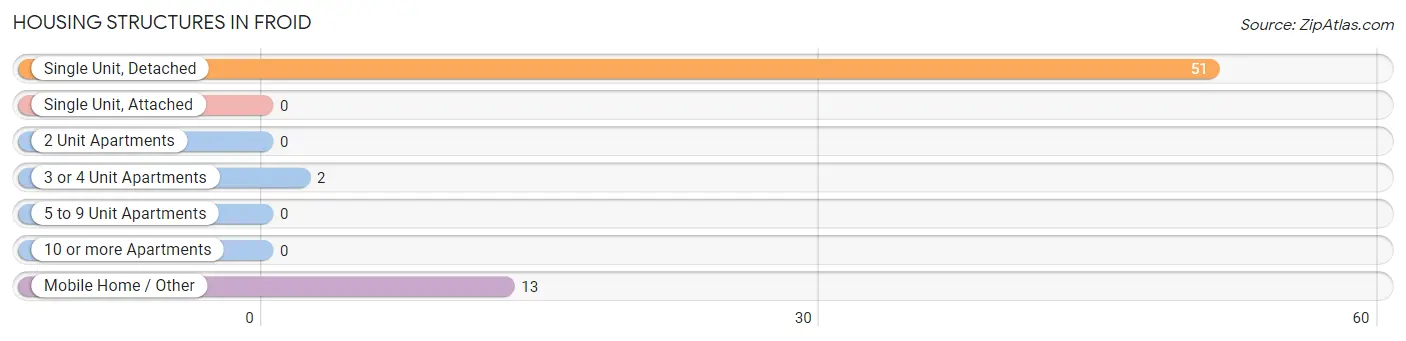
| Structure Type | # Housing Units | % Housing Units |
| Single Unit, Detached | 51 | 77.3% |
| Single Unit, Attached | 0 | 0.0% |
| 2 Unit Apartments | 0 | 0.0% |
| 3 or 4 Unit Apartments | 2 | 3.0% |
| 5 to 9 Unit Apartments | 0 | 0.0% |
| 10 or more Apartments | 0 | 0.0% |
| Mobile Home / Other | 13 | 19.7% |
| Total | 66 | 100.0% |
Housing Structures by Occupancy in Froid
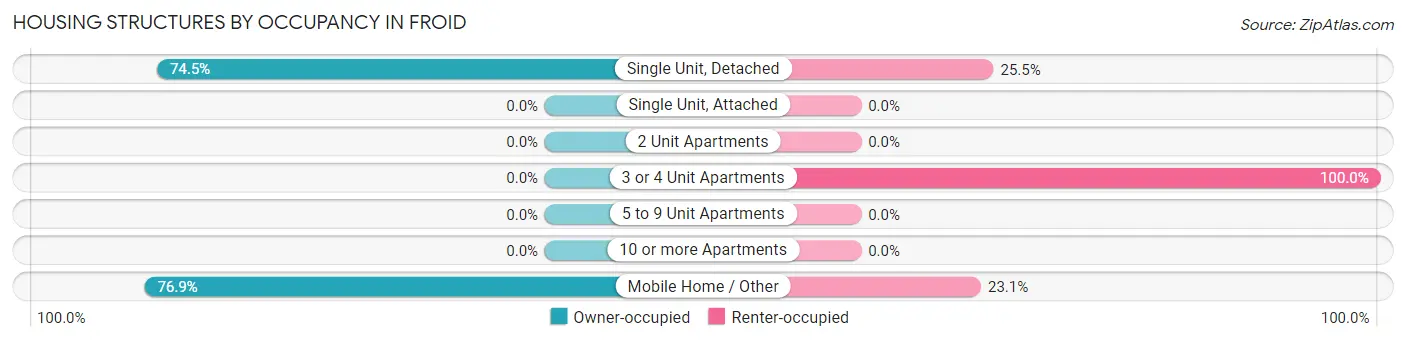
| Structure Type | Owner-occupied | Renter-occupied |
| Single Unit, Detached | 38 (74.5%) | 13 (25.5%) |
| Single Unit, Attached | 0 (0.0%) | 0 (0.0%) |
| 2 Unit Apartments | 0 (0.0%) | 0 (0.0%) |
| 3 or 4 Unit Apartments | 0 (0.0%) | 2 (100.0%) |
| 5 to 9 Unit Apartments | 0 (0.0%) | 0 (0.0%) |
| 10 or more Apartments | 0 (0.0%) | 0 (0.0%) |
| Mobile Home / Other | 10 (76.9%) | 3 (23.1%) |
| Total | 48 (72.7%) | 18 (27.3%) |
Housing Structures by Number of Rooms in Froid
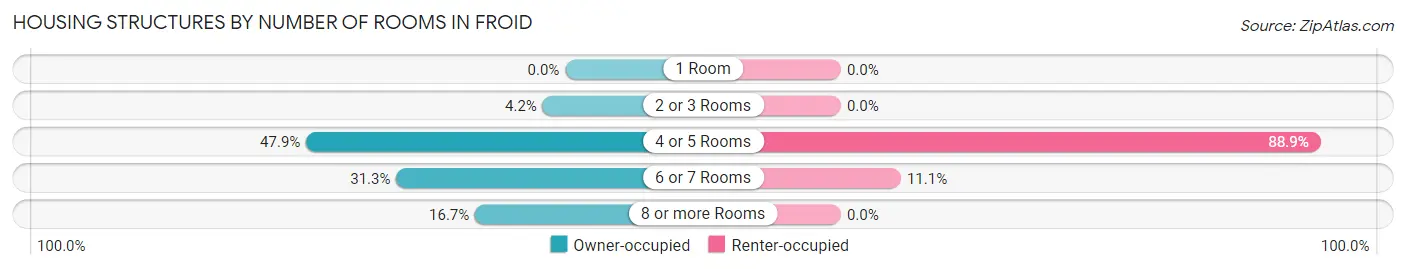
| Number of Rooms | Owner-occupied | Renter-occupied |
| 1 Room | 0 (0.0%) | 0 (0.0%) |
| 2 or 3 Rooms | 2 (4.2%) | 0 (0.0%) |
| 4 or 5 Rooms | 23 (47.9%) | 16 (88.9%) |
| 6 or 7 Rooms | 15 (31.2%) | 2 (11.1%) |
| 8 or more Rooms | 8 (16.7%) | 0 (0.0%) |
| Total | 48 (100.0%) | 18 (100.0%) |
Housing Structure by Heating Type in Froid
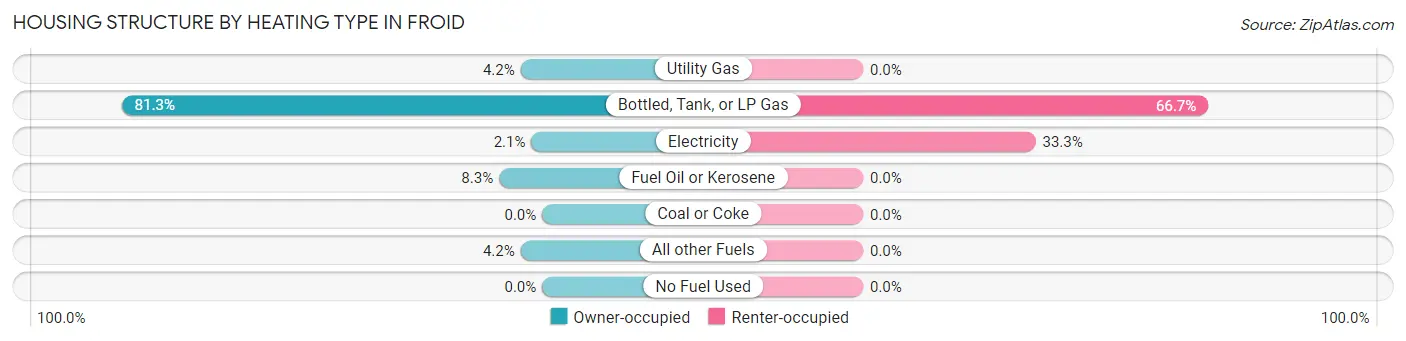
| Heating Type | Owner-occupied | Renter-occupied |
| Utility Gas | 2 (4.2%) | 0 (0.0%) |
| Bottled, Tank, or LP Gas | 39 (81.2%) | 12 (66.7%) |
| Electricity | 1 (2.1%) | 6 (33.3%) |
| Fuel Oil or Kerosene | 4 (8.3%) | 0 (0.0%) |
| Coal or Coke | 0 (0.0%) | 0 (0.0%) |
| All other Fuels | 2 (4.2%) | 0 (0.0%) |
| No Fuel Used | 0 (0.0%) | 0 (0.0%) |
| Total | 48 (100.0%) | 18 (100.0%) |
Household Vehicle Usage in Froid
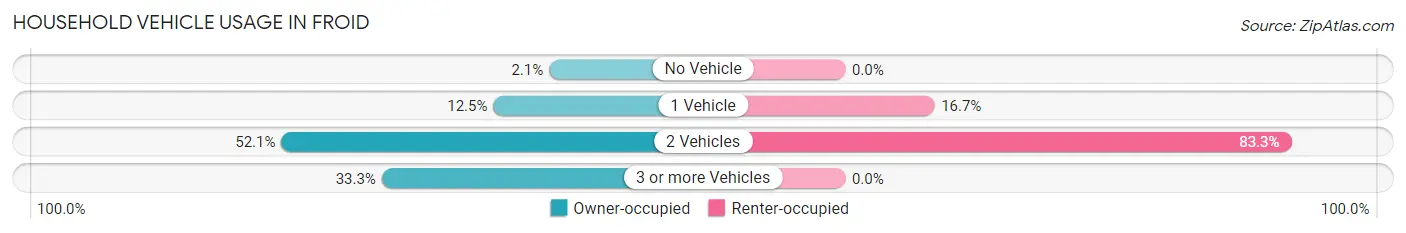
| Vehicles per Household | Owner-occupied | Renter-occupied |
| No Vehicle | 1 (2.1%) | 0 (0.0%) |
| 1 Vehicle | 6 (12.5%) | 3 (16.7%) |
| 2 Vehicles | 25 (52.1%) | 15 (83.3%) |
| 3 or more Vehicles | 16 (33.3%) | 0 (0.0%) |
| Total | 48 (100.0%) | 18 (100.0%) |
Real Estate & Mortgages in Froid
Real Estate and Mortgage Overview in Froid
| Characteristic | Without Mortgage | With Mortgage |
| Housing Units | 32 | 16 |
| Median Property Value | $97,500 | $187,500 |
| Median Household Income | $65,000 | $0 |
| Monthly Housing Costs | $400 | $0 |
| Real Estate Taxes | $844 | $0 |
Property Value by Mortgage Status in Froid
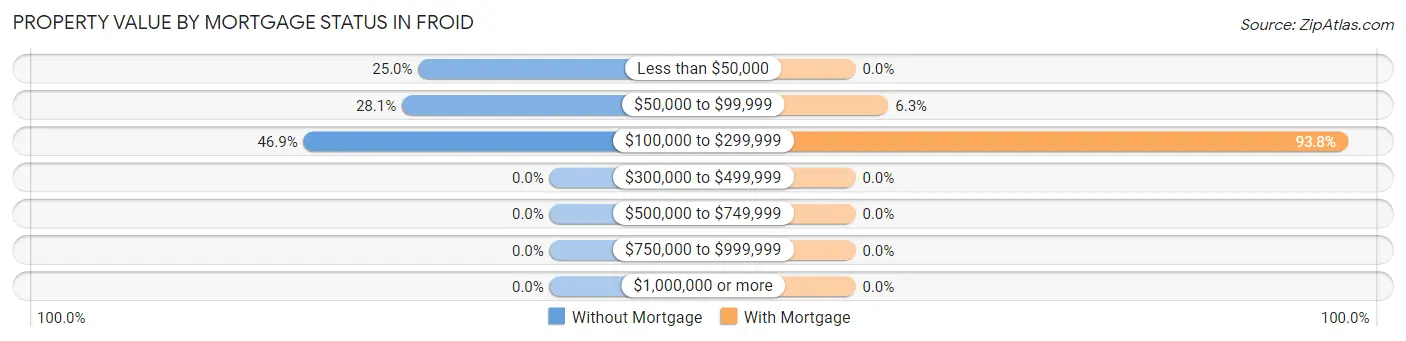
| Property Value | Without Mortgage | With Mortgage |
| Less than $50,000 | 8 (25.0%) | 0 (0.0%) |
| $50,000 to $99,999 | 9 (28.1%) | 1 (6.2%) |
| $100,000 to $299,999 | 15 (46.9%) | 15 (93.8%) |
| $300,000 to $499,999 | 0 (0.0%) | 0 (0.0%) |
| $500,000 to $749,999 | 0 (0.0%) | 0 (0.0%) |
| $750,000 to $999,999 | 0 (0.0%) | 0 (0.0%) |
| $1,000,000 or more | 0 (0.0%) | 0 (0.0%) |
| Total | 32 (100.0%) | 16 (100.0%) |
Household Income by Mortgage Status in Froid
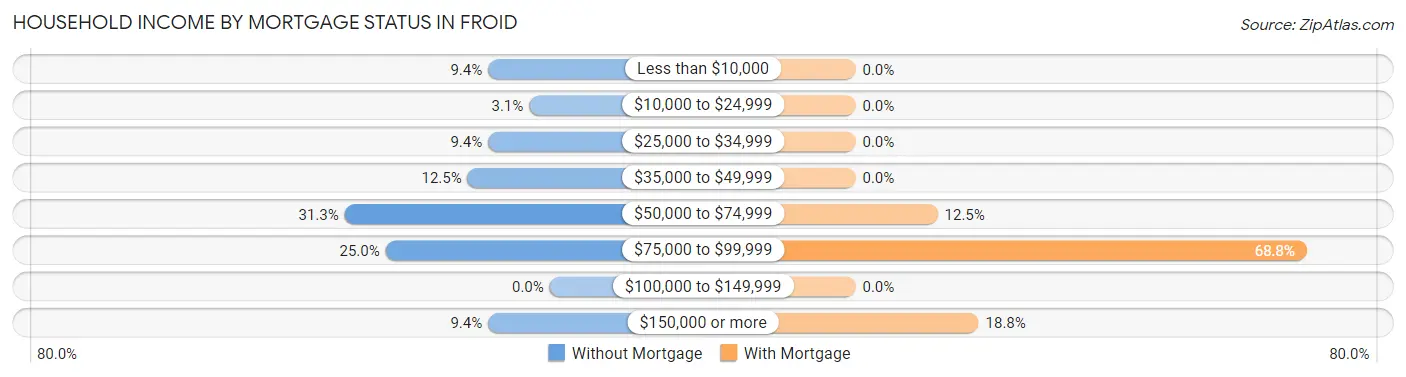
| Household Income | Without Mortgage | With Mortgage |
| Less than $10,000 | 3 (9.4%) | 0 (0.0%) |
| $10,000 to $24,999 | 1 (3.1%) | 0 (0.0%) |
| $25,000 to $34,999 | 3 (9.4%) | 0 (0.0%) |
| $35,000 to $49,999 | 4 (12.5%) | 0 (0.0%) |
| $50,000 to $74,999 | 10 (31.2%) | 2 (12.5%) |
| $75,000 to $99,999 | 8 (25.0%) | 11 (68.8%) |
| $100,000 to $149,999 | 0 (0.0%) | 0 (0.0%) |
| $150,000 or more | 3 (9.4%) | 3 (18.8%) |
| Total | 32 (100.0%) | 16 (100.0%) |
Property Value to Household Income Ratio in Froid
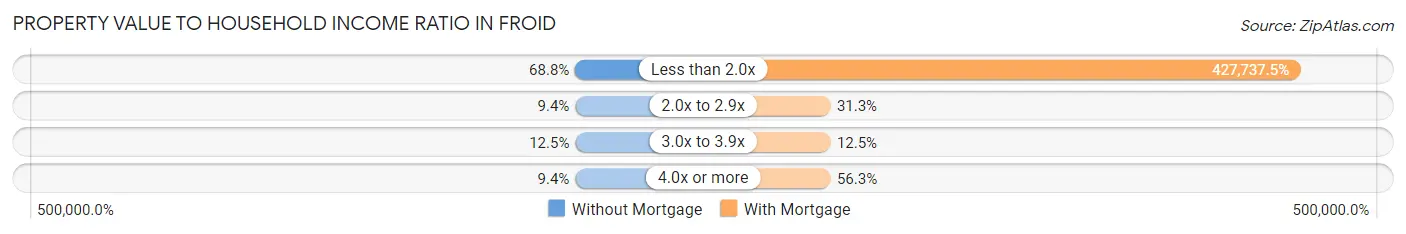
| Value-to-Income Ratio | Without Mortgage | With Mortgage |
| Less than 2.0x | 22 (68.8%) | 68,438 (427,737.5%) |
| 2.0x to 2.9x | 3 (9.4%) | 5 (31.2%) |
| 3.0x to 3.9x | 4 (12.5%) | 2 (12.5%) |
| 4.0x or more | 3 (9.4%) | 9 (56.2%) |
| Total | 32 (100.0%) | 16 (100.0%) |
Real Estate Taxes by Mortgage Status in Froid
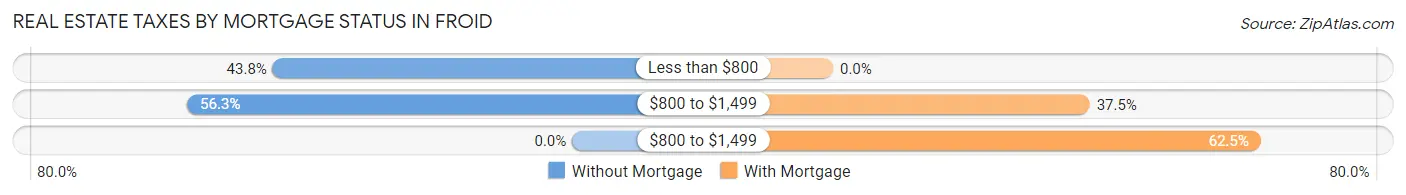
| Property Taxes | Without Mortgage | With Mortgage |
| Less than $800 | 14 (43.8%) | 0 (0.0%) |
| $800 to $1,499 | 18 (56.2%) | 6 (37.5%) |
| $800 to $1,499 | 0 (0.0%) | 10 (62.5%) |
| Total | 32 (100.0%) | 16 (100.0%) |
Health & Disability in Froid
Health Insurance Coverage by Age in Froid
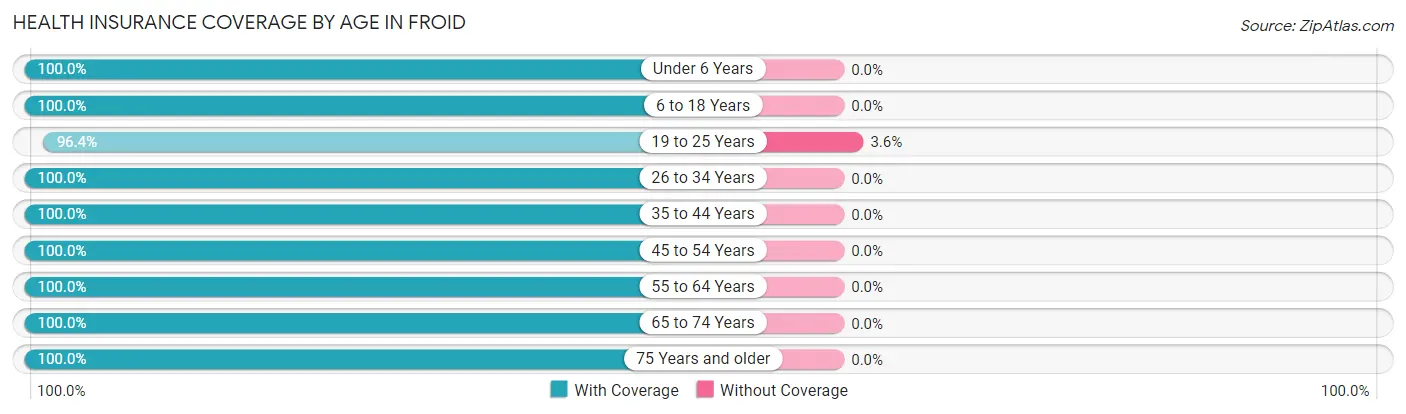
| Age Bracket | With Coverage | Without Coverage |
| Under 6 Years | 13 (100.0%) | 0 (0.0%) |
| 6 to 18 Years | 158 (100.0%) | 0 (0.0%) |
| 19 to 25 Years | 27 (96.4%) | 1 (3.6%) |
| 26 to 34 Years | 12 (100.0%) | 0 (0.0%) |
| 35 to 44 Years | 16 (100.0%) | 0 (0.0%) |
| 45 to 54 Years | 9 (100.0%) | 0 (0.0%) |
| 55 to 64 Years | 35 (100.0%) | 0 (0.0%) |
| 65 to 74 Years | 25 (100.0%) | 0 (0.0%) |
| 75 Years and older | 8 (100.0%) | 0 (0.0%) |
| Total | 303 (99.7%) | 1 (0.3%) |
Health Insurance Coverage by Citizenship Status in Froid
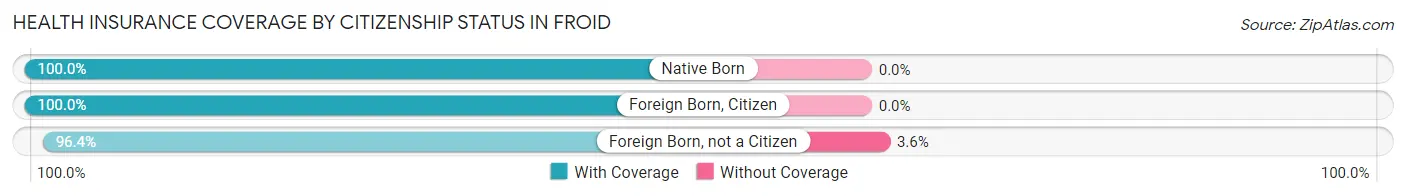
| Citizenship Status | With Coverage | Without Coverage |
| Native Born | 13 (100.0%) | 0 (0.0%) |
| Foreign Born, Citizen | 158 (100.0%) | 0 (0.0%) |
| Foreign Born, not a Citizen | 27 (96.4%) | 1 (3.6%) |
Health Insurance Coverage by Household Income in Froid
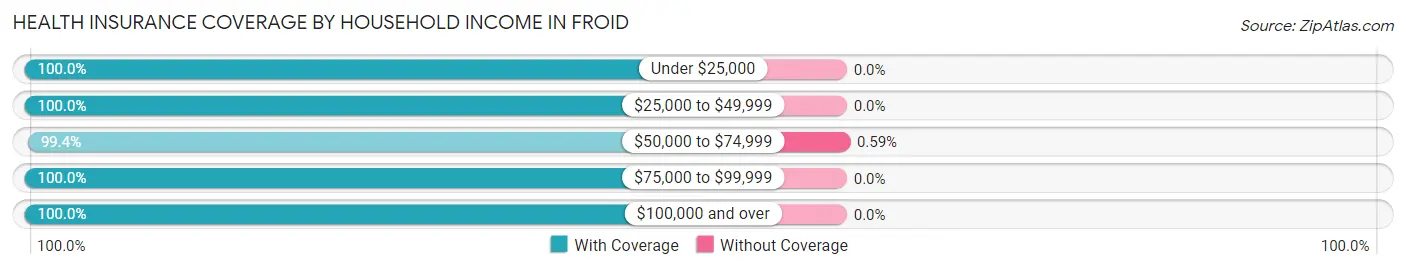
| Household Income | With Coverage | Without Coverage |
| Under $25,000 | 8 (100.0%) | 0 (0.0%) |
| $25,000 to $49,999 | 17 (100.0%) | 0 (0.0%) |
| $50,000 to $74,999 | 168 (99.4%) | 1 (0.6%) |
| $75,000 to $99,999 | 24 (100.0%) | 0 (0.0%) |
| $100,000 and over | 86 (100.0%) | 0 (0.0%) |
Public vs Private Health Insurance Coverage by Age in Froid
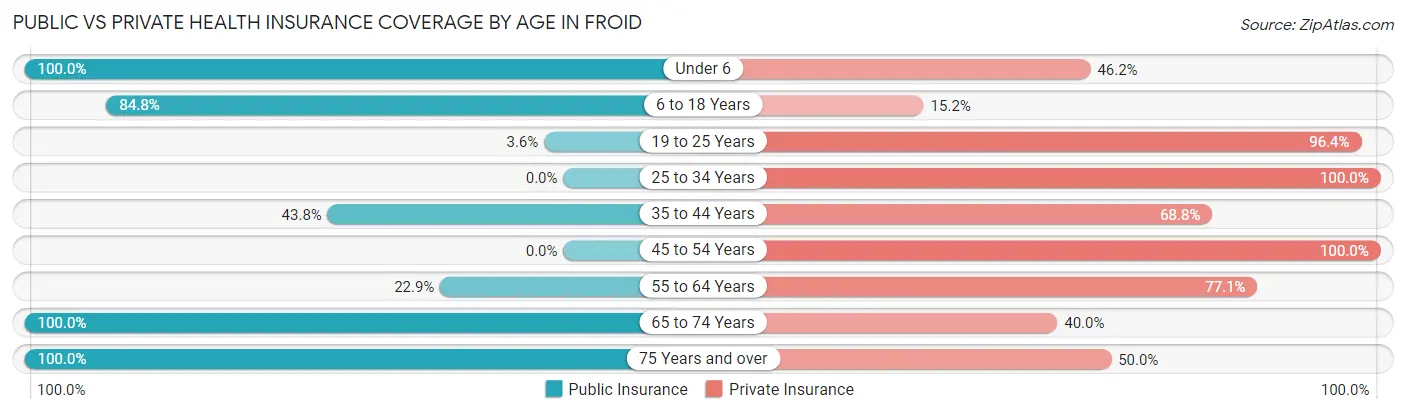
| Age Bracket | Public Insurance | Private Insurance |
| Under 6 | 13 (100.0%) | 6 (46.2%) |
| 6 to 18 Years | 134 (84.8%) | 24 (15.2%) |
| 19 to 25 Years | 1 (3.6%) | 27 (96.4%) |
| 25 to 34 Years | 0 (0.0%) | 12 (100.0%) |
| 35 to 44 Years | 7 (43.8%) | 11 (68.8%) |
| 45 to 54 Years | 0 (0.0%) | 9 (100.0%) |
| 55 to 64 Years | 8 (22.9%) | 27 (77.1%) |
| 65 to 74 Years | 25 (100.0%) | 10 (40.0%) |
| 75 Years and over | 8 (100.0%) | 4 (50.0%) |
| Total | 196 (64.5%) | 130 (42.8%) |
Disability Status by Sex by Age in Froid
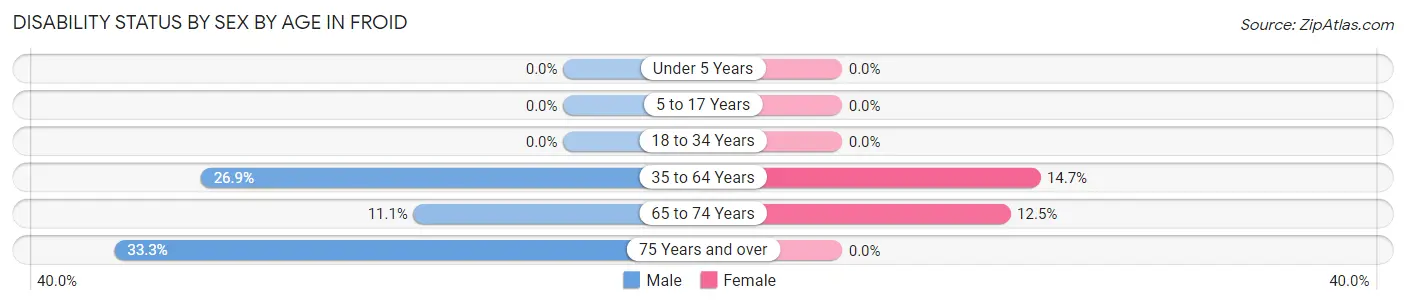
| Age Bracket | Male | Female |
| Under 5 Years | 0 (0.0%) | 0 (0.0%) |
| 5 to 17 Years | 0 (0.0%) | 0 (0.0%) |
| 18 to 34 Years | 0 (0.0%) | 0 (0.0%) |
| 35 to 64 Years | 7 (26.9%) | 5 (14.7%) |
| 65 to 74 Years | 1 (11.1%) | 2 (12.5%) |
| 75 Years and over | 2 (33.3%) | 0 (0.0%) |
Disability Class by Sex by Age in Froid
Disability Class: Hearing Difficulty
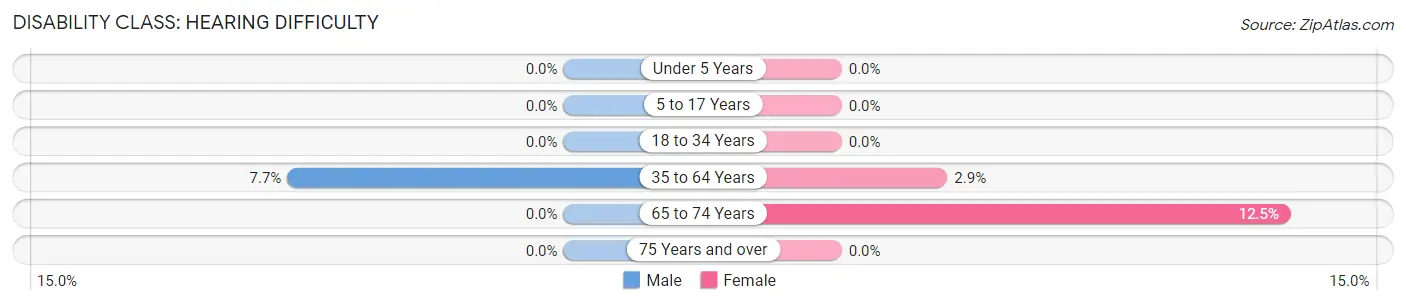
| Age Bracket | Male | Female |
| Under 5 Years | 0 (0.0%) | 0 (0.0%) |
| 5 to 17 Years | 0 (0.0%) | 0 (0.0%) |
| 18 to 34 Years | 0 (0.0%) | 0 (0.0%) |
| 35 to 64 Years | 2 (7.7%) | 1 (2.9%) |
| 65 to 74 Years | 0 (0.0%) | 2 (12.5%) |
| 75 Years and over | 0 (0.0%) | 0 (0.0%) |
Disability Class: Vision Difficulty
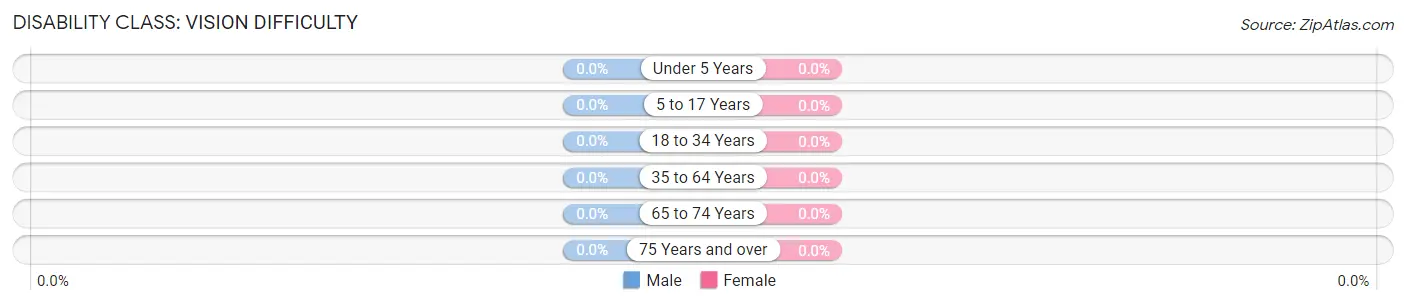
| Age Bracket | Male | Female |
| Under 5 Years | 0 (0.0%) | 0 (0.0%) |
| 5 to 17 Years | 0 (0.0%) | 0 (0.0%) |
| 18 to 34 Years | 0 (0.0%) | 0 (0.0%) |
| 35 to 64 Years | 0 (0.0%) | 0 (0.0%) |
| 65 to 74 Years | 0 (0.0%) | 0 (0.0%) |
| 75 Years and over | 0 (0.0%) | 0 (0.0%) |
Disability Class: Cognitive Difficulty
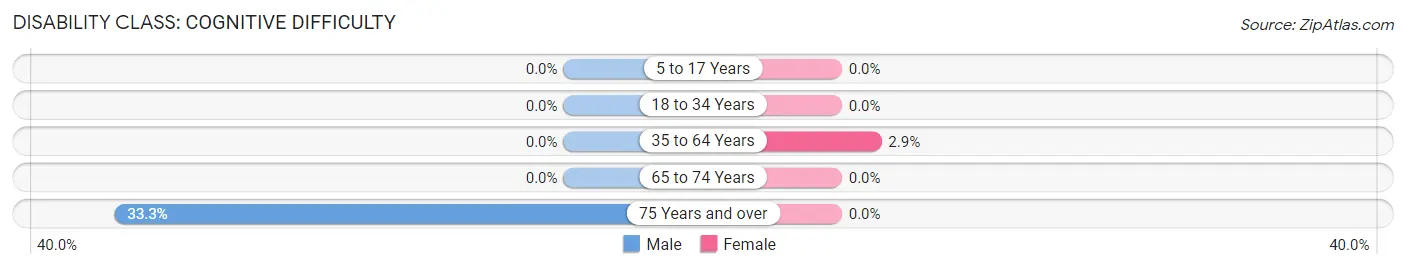
| Age Bracket | Male | Female |
| 5 to 17 Years | 0 (0.0%) | 0 (0.0%) |
| 18 to 34 Years | 0 (0.0%) | 0 (0.0%) |
| 35 to 64 Years | 0 (0.0%) | 1 (2.9%) |
| 65 to 74 Years | 0 (0.0%) | 0 (0.0%) |
| 75 Years and over | 2 (33.3%) | 0 (0.0%) |
Disability Class: Ambulatory Difficulty
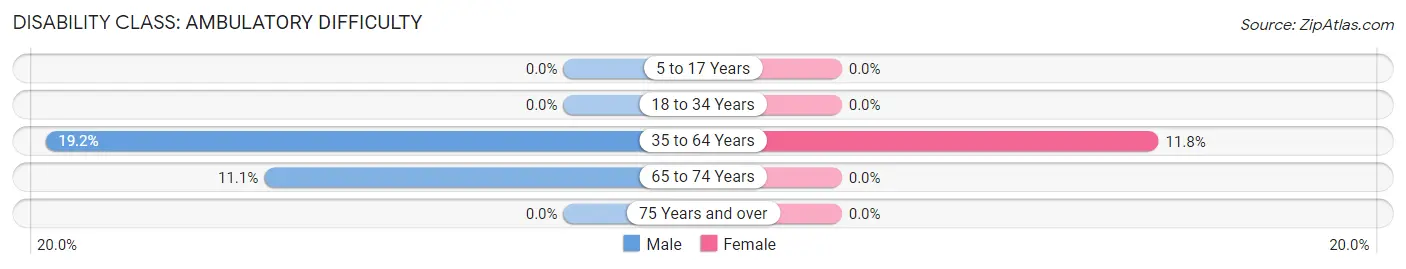
| Age Bracket | Male | Female |
| 5 to 17 Years | 0 (0.0%) | 0 (0.0%) |
| 18 to 34 Years | 0 (0.0%) | 0 (0.0%) |
| 35 to 64 Years | 5 (19.2%) | 4 (11.8%) |
| 65 to 74 Years | 1 (11.1%) | 0 (0.0%) |
| 75 Years and over | 0 (0.0%) | 0 (0.0%) |
Disability Class: Self-Care Difficulty
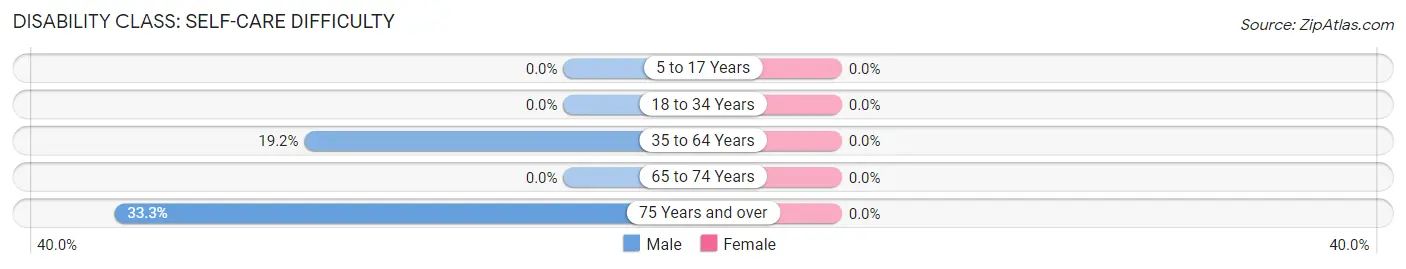
| Age Bracket | Male | Female |
| 5 to 17 Years | 0 (0.0%) | 0 (0.0%) |
| 18 to 34 Years | 0 (0.0%) | 0 (0.0%) |
| 35 to 64 Years | 5 (19.2%) | 0 (0.0%) |
| 65 to 74 Years | 0 (0.0%) | 0 (0.0%) |
| 75 Years and over | 2 (33.3%) | 0 (0.0%) |
Technology Access in Froid
Computing Device Access in Froid
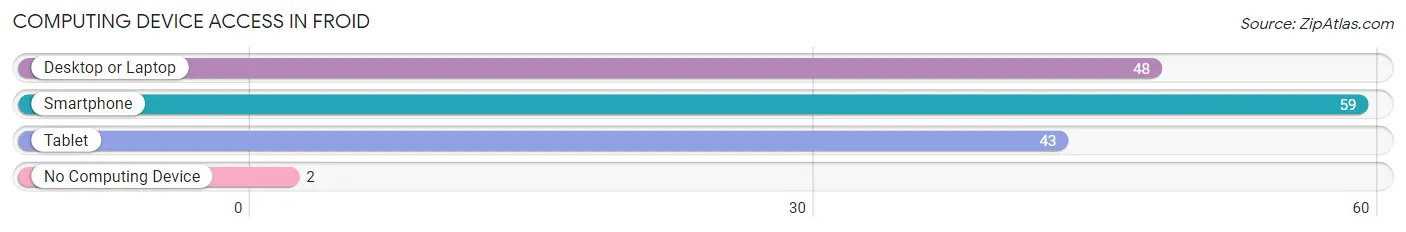
| Device Type | # Households | % Households |
| Desktop or Laptop | 48 | 72.7% |
| Smartphone | 59 | 89.4% |
| Tablet | 43 | 65.1% |
| No Computing Device | 2 | 3.0% |
| Total | 66 | 100.0% |
Internet Access in Froid
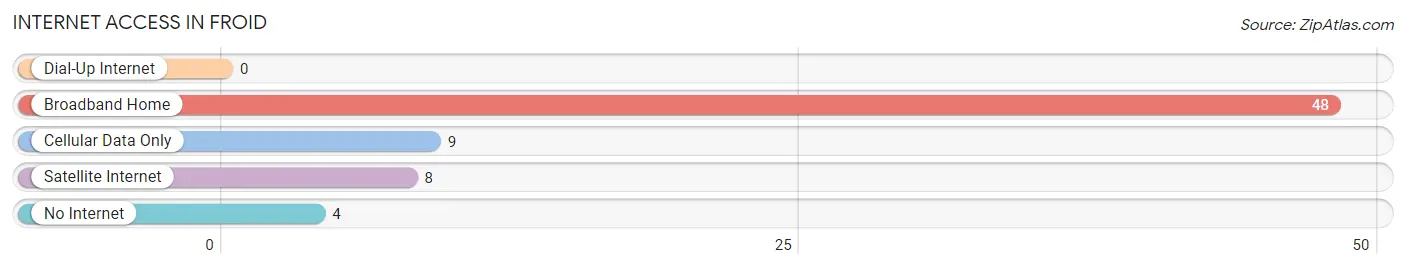
| Internet Type | # Households | % Households |
| Dial-Up Internet | 0 | 0.0% |
| Broadband Home | 48 | 72.7% |
| Cellular Data Only | 9 | 13.6% |
| Satellite Internet | 8 | 12.1% |
| No Internet | 4 | 6.1% |
| Total | 66 | 100.0% |
Froid Summary
Froid is a small town located in the northeastern corner of Montana, in the United States. It is situated in the middle of the Fort Peck Indian Reservation, and is the county seat of Roosevelt County. The town has a population of just over 500 people, and is the smallest incorporated town in the state.
Geography
Froid is located in the northeastern corner of Montana, in the United States. It is situated in the middle of the Fort Peck Indian Reservation, and is the county seat of Roosevelt County. The town is located on the banks of the Missouri River, and is surrounded by rolling hills and prairies. The town is located at an elevation of 2,400 feet, and has a total area of 0.6 square miles.
History
Froid was founded in 1910, when the Great Northern Railway was built through the area. The town was named after the French word for “cold”, due to the cold winter temperatures in the area. The town quickly grew, and by 1920, it had a population of over 500 people.
In the 1930s, the town was hit hard by the Great Depression, and many of the businesses in the town closed. However, the town was able to survive, and by the 1950s, it had recovered and was once again a thriving community.
Economy
The economy of Froid is largely based on agriculture and tourism. The town is home to several farms, which produce a variety of crops, including wheat, barley, and hay. The town is also home to several tourist attractions, including the Fort Peck Dam, which is a popular destination for fishing and boating.
The town is also home to several small businesses, including a grocery store, a hardware store, and a few restaurants. The town also has a small airport, which serves as a hub for air travel in the region.
Demographics
As of the 2010 census, the population of Froid was 517 people. The racial makeup of the town was 95.3% White, 0.6% Native American, 0.2% Asian, 0.2% from other races, and 3.7% from two or more races. The median household income in the town was $35,000, and the median family income was $41,000.
Conclusion
Froid is a small town located in the northeastern corner of Montana, in the United States. It is situated in the middle of the Fort Peck Indian Reservation, and is the county seat of Roosevelt County. The town has a population of just over 500 people, and is the smallest incorporated town in the state. The economy of Froid is largely based on agriculture and tourism, and the town is home to several small businesses. The racial makeup of the town is predominantly White, with a small percentage of Native American and Asian residents.
Common Questions
What is Per Capita Income in Froid?
Per Capita income in Froid is $24,198.
What is the Median Family Income in Froid?
Median Family Income in Froid is $85,625.
What is the Median Household income in Froid?
Median Household Income in Froid is $68,500.
What is Income or Wage Gap in Froid?
Income or Wage Gap in Froid is 39.1%.
Women in Froid earn 60.9 cents for every dollar earned by a man.
What is Inequality or Gini Index in Froid?
Inequality or Gini Index in Froid is 0.28.
What is the Total Population of Froid?
Total Population of Froid is 304.
What is the Total Male Population of Froid?
Total Male Population of Froid is 98.
What is the Total Female Population of Froid?
Total Female Population of Froid is 206.
What is the Ratio of Males per 100 Females in Froid?
There are 47.57 Males per 100 Females in Froid.
What is the Ratio of Females per 100 Males in Froid?
There are 210.20 Females per 100 Males in Froid.
What is the Median Population Age in Froid?
Median Population Age in Froid is 13.5 Years.
What is the Average Family Size in Froid
Average Family Size in Froid is 3.4 People.
What is the Average Household Size in Froid
Average Household Size in Froid is 4.6 People.
How Large is the Labor Force in Froid?
There are 107 People in the Labor Forcein in Froid.
What is the Percentage of People in the Labor Force in Froid?
71.8% of People are in the Labor Force in Froid.