Polvadera, NM Map & Demographics
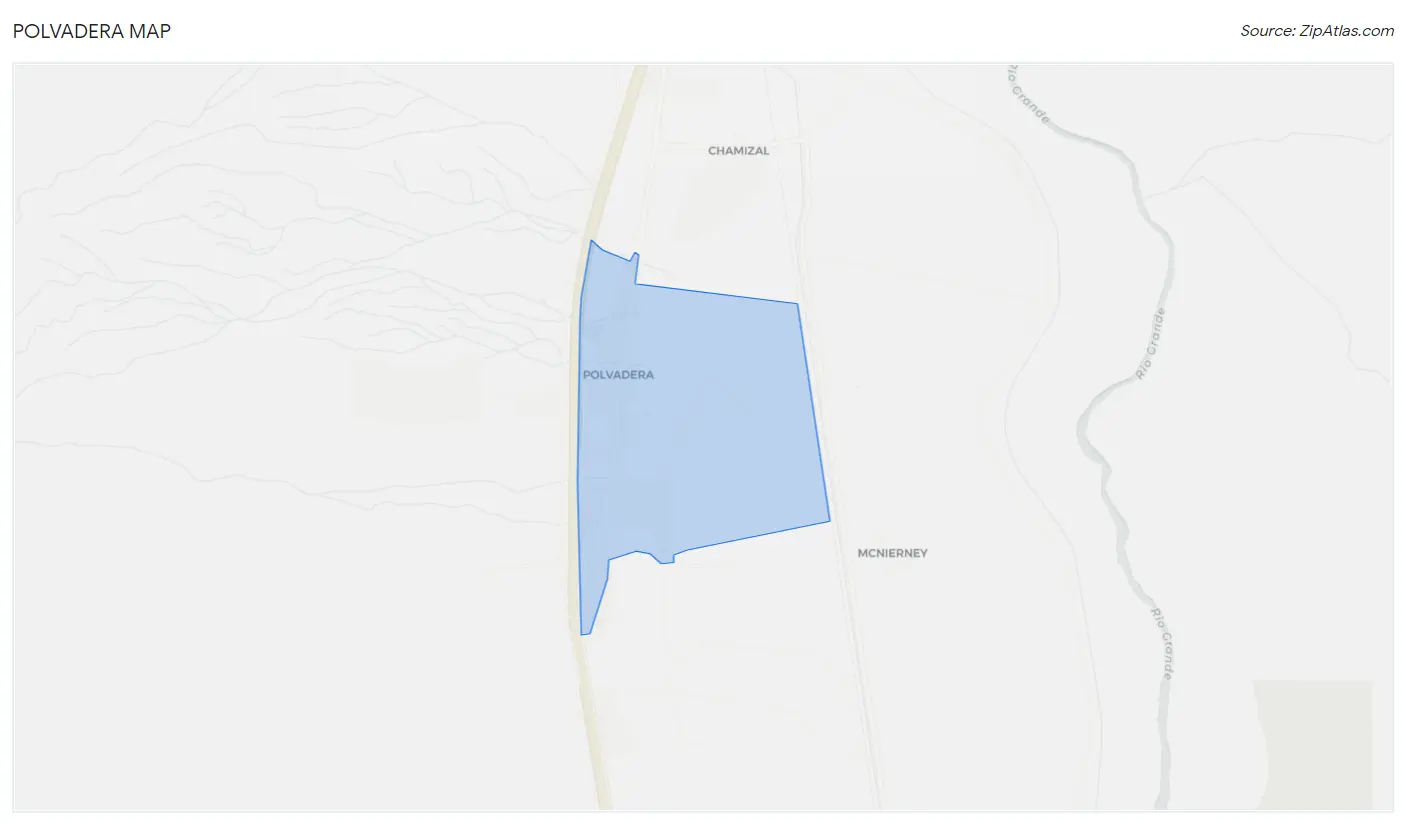
Polvadera Map
Polvadera Overview
$7,342
PER CAPITA INCOME
0.39
INEQUALITY / GINI INDEX
573
TOTAL POPULATION
260
MALE POPULATION
313
FEMALE POPULATION
83.07
MALES / 100 FEMALES
120.38
FEMALES / 100 MALES
8.0
MEDIAN AGE
5.3
AVG FAMILY SIZE
5.2
AVG HOUSEHOLD SIZE
99
LABOR FORCE [ PEOPLE ]
42.3%
PERCENT IN LABOR FORCE
10.1%
UNEMPLOYMENT RATE
Polvadera Zip Codes
Polvadera Area Codes
Income in Polvadera
Income Overview in Polvadera
| Characteristic | Number | Measure |
| Per Capita Income | 573 | $7,342 |
| Median Family Income | 81 | $0 |
| Mean Family Income | 81 | $0 |
| Median Household Income | 111 | $0 |
| Mean Household Income | 111 | $39,892 |
| Income Deficit | 81 | $0 |
| Wage / Income Gap (%) | 573 | 0.00% |
| Wage / Income Gap ($) | 573 | 100.00¢ per $1 |
| Gini / Inequality Index | 573 | 0.39 |
Earnings by Sex in Polvadera
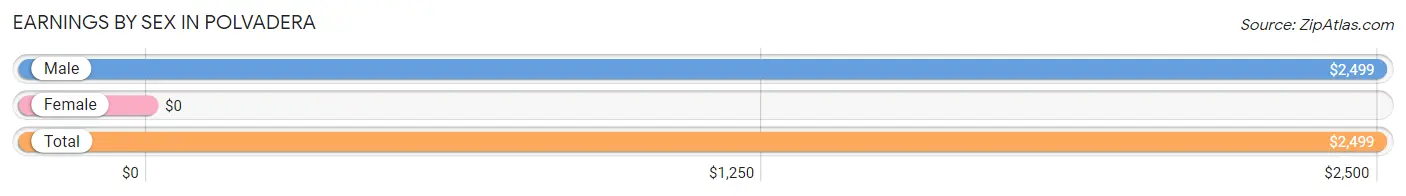
| Sex | Number | Average Earnings |
| Male | 91 (91.9%) | $2,499 |
| Female | 8 (8.1%) | $0 |
| Total | 99 (100.0%) | $2,499 |
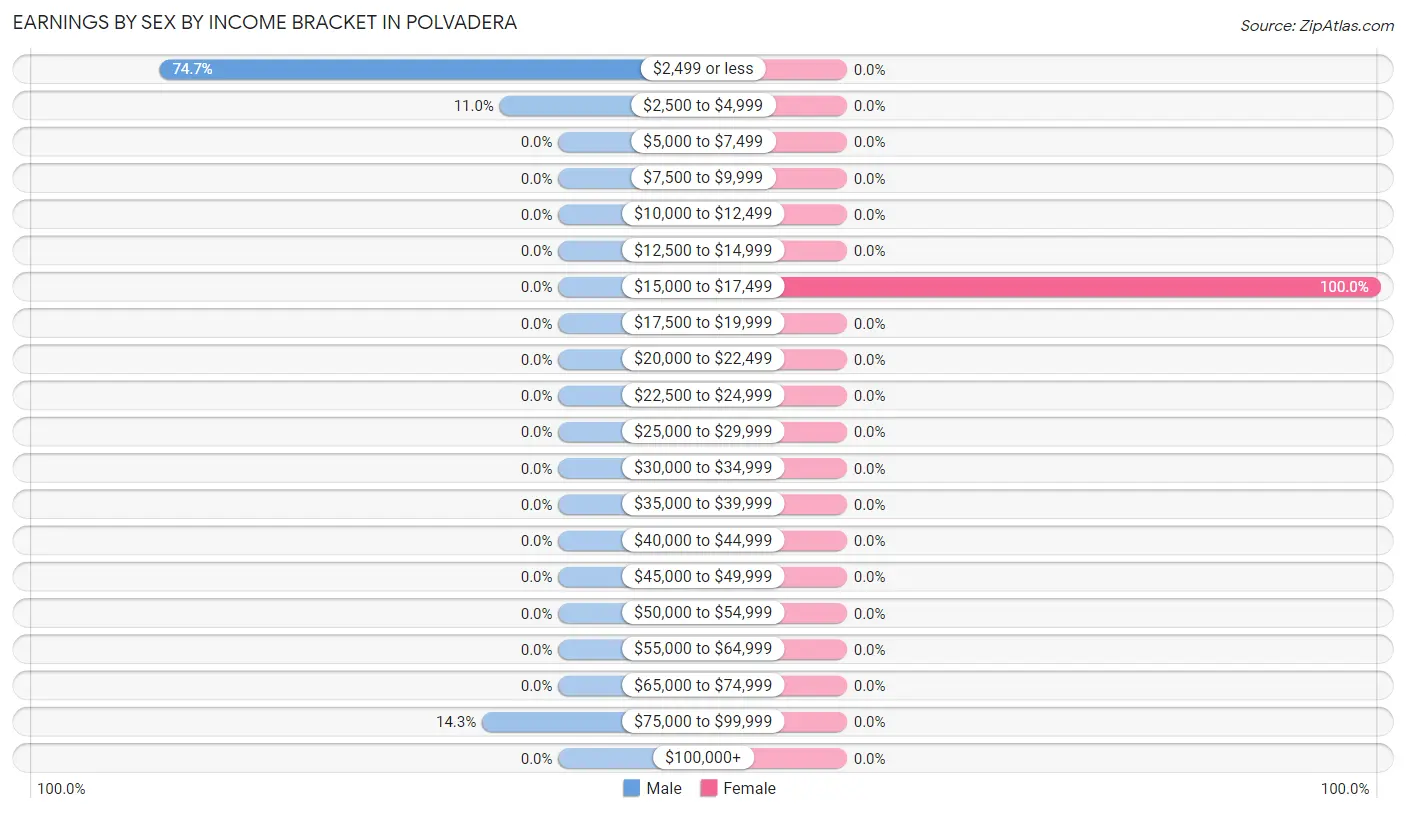
Earnings by Sex by Income Bracket in Polvadera
The most common earnings brackets in Polvadera are $2,499 or less for men (68 | 74.7%) and $15,000 to $17,499 for women (8 | 100.0%).
| Income | Male | Female |
| $2,499 or less | 68 (74.7%) | 0 (0.0%) |
| $2,500 to $4,999 | 10 (11.0%) | 0 (0.0%) |
| $5,000 to $7,499 | 0 (0.0%) | 0 (0.0%) |
| $7,500 to $9,999 | 0 (0.0%) | 0 (0.0%) |
| $10,000 to $12,499 | 0 (0.0%) | 0 (0.0%) |
| $12,500 to $14,999 | 0 (0.0%) | 0 (0.0%) |
| $15,000 to $17,499 | 0 (0.0%) | 8 (100.0%) |
| $17,500 to $19,999 | 0 (0.0%) | 0 (0.0%) |
| $20,000 to $22,499 | 0 (0.0%) | 0 (0.0%) |
| $22,500 to $24,999 | 0 (0.0%) | 0 (0.0%) |
| $25,000 to $29,999 | 0 (0.0%) | 0 (0.0%) |
| $30,000 to $34,999 | 0 (0.0%) | 0 (0.0%) |
| $35,000 to $39,999 | 0 (0.0%) | 0 (0.0%) |
| $40,000 to $44,999 | 0 (0.0%) | 0 (0.0%) |
| $45,000 to $49,999 | 0 (0.0%) | 0 (0.0%) |
| $50,000 to $54,999 | 0 (0.0%) | 0 (0.0%) |
| $55,000 to $64,999 | 0 (0.0%) | 0 (0.0%) |
| $65,000 to $74,999 | 0 (0.0%) | 0 (0.0%) |
| $75,000 to $99,999 | 13 (14.3%) | 0 (0.0%) |
| $100,000+ | 0 (0.0%) | 0 (0.0%) |
| Total | 91 (100.0%) | 8 (100.0%) |
Earnings by Sex by Educational Attainment in Polvadera
| Educational Attainment | Male Income | Female Income |
| Less than High School | - | - |
| High School Diploma | - | - |
| College or Associate's Degree | - | - |
| Bachelor's Degree | - | - |
| Graduate Degree | - | - |
| Total | $2,499 | $0 |
Family Income in Polvadera
Family Income Brackets in Polvadera
According to the Polvadera family income data, there are 68 families falling into the $15,000 to $24,999 income range, which is the most common income bracket and makes up 84.0% of all families.
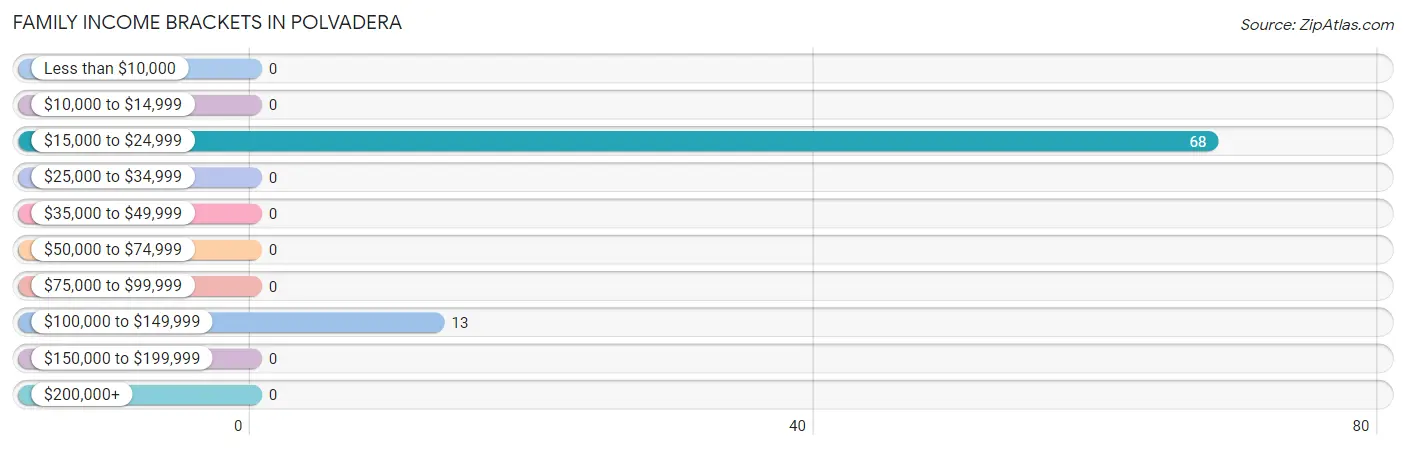
| Income Bracket | # Families | % Families |
| Less than $10,000 | 0 | 0.0% |
| $10,000 to $14,999 | 0 | 0.0% |
| $15,000 to $24,999 | 68 | 84.0% |
| $25,000 to $34,999 | 0 | 0.0% |
| $35,000 to $49,999 | 0 | 0.0% |
| $50,000 to $74,999 | 0 | 0.0% |
| $75,000 to $99,999 | 0 | 0.0% |
| $100,000 to $149,999 | 13 | 16.0% |
| $150,000 to $199,999 | 0 | 0.0% |
| $200,000+ | 0 | 0.0% |
Family Income by Famaliy Size in Polvadera
| Income Bracket | # Families | Median Income |
| 2-Person Families | 13 (16.1%) | $0 |
| 3-Person Families | 0 (0.0%) | $0 |
| 4-Person Families | 0 (0.0%) | $0 |
| 5-Person Families | 0 (0.0%) | $0 |
| 6-Person Families | 0 (0.0%) | $0 |
| 7+ Person Families | 68 (84.0%) | $0 |
| Total | 81 (100.0%) | $0 |
Family Income by Number of Earners in Polvadera
| Number of Earners | # Families | Median Income |
| No Earners | 0 (0.0%) | $0 |
| 1 Earner | 68 (84.0%) | $0 |
| 2 Earners | 13 (16.1%) | $0 |
| 3+ Earners | 0 (0.0%) | $0 |
| Total | 81 (100.0%) | $0 |
Household Income in Polvadera
Household Income Brackets in Polvadera
With 68 households falling in the category, the $15,000 to $24,999 income range is the most frequent in Polvadera, accounting for 61.3% of all households.
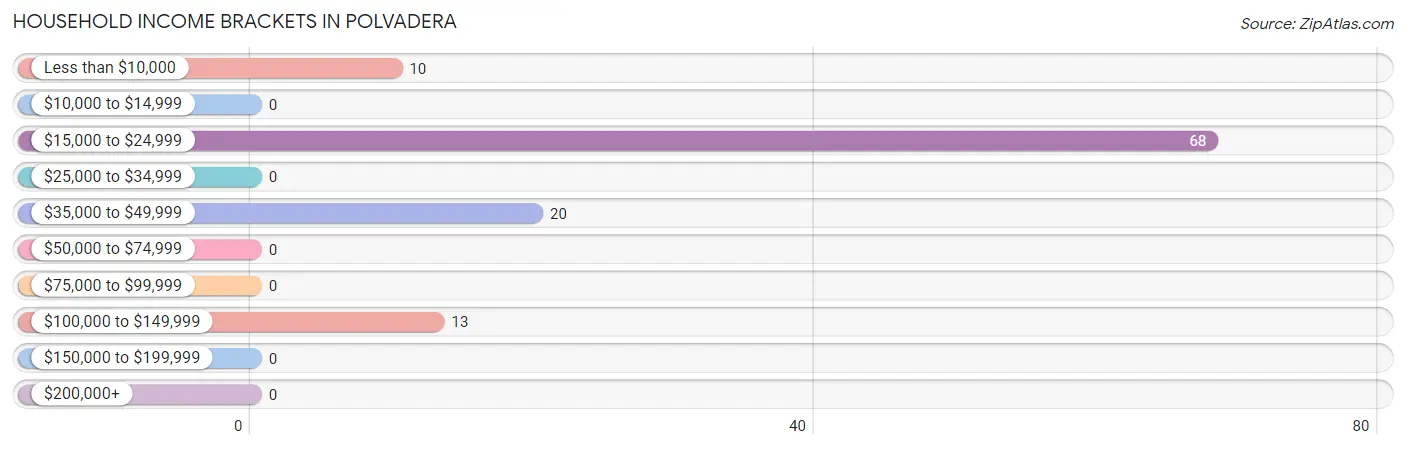
| Income Bracket | # Households | % Households |
| Less than $10,000 | 10 | 9.0% |
| $10,000 to $14,999 | 0 | 0.0% |
| $15,000 to $24,999 | 68 | 61.3% |
| $25,000 to $34,999 | 0 | 0.0% |
| $35,000 to $49,999 | 20 | 18.0% |
| $50,000 to $74,999 | 0 | 0.0% |
| $75,000 to $99,999 | 0 | 0.0% |
| $100,000 to $149,999 | 13 | 11.7% |
| $150,000 to $199,999 | 0 | 0.0% |
| $200,000+ | 0 | 0.0% |
Household Income by Householder Age in Polvadera
| Income Bracket | # Households | Median Income |
| 15 to 24 Years | 0 (0.0%) | $0 |
| 25 to 44 Years | 10 (9.0%) | $0 |
| 45 to 64 Years | 81 (73.0%) | $0 |
| 65+ Years | 20 (18.0%) | $0 |
| Total | 111 (100.0%) | $0 |
Poverty in Polvadera
Income Below Poverty by Sex and Age in Polvadera
With 95.0% poverty level for males and 91.0% for females among the residents of Polvadera, under 5 year old males and under 5 year old females are the most vulnerable to poverty, with 36 males (100.0%) and 118 females (100.0%) in their respective age groups living below the poverty level.
| Age Bracket | Male | Female |
| Under 5 Years | 36 (100.0%) | 118 (100.0%) |
| 5 Years | 104 (100.0%) | 0 (0.0%) |
| 6 to 11 Years | 29 (100.0%) | 52 (100.0%) |
| 12 to 14 Years | 0 (0.0%) | 0 (0.0%) |
| 15 Years | 0 (0.0%) | 0 (0.0%) |
| 16 and 17 Years | 0 (0.0%) | 0 (0.0%) |
| 18 to 24 Years | 0 (0.0%) | 0 (0.0%) |
| 25 to 34 Years | 10 (100.0%) | 0 (0.0%) |
| 35 to 44 Years | 0 (0.0%) | 0 (0.0%) |
| 45 to 54 Years | 0 (0.0%) | 115 (100.0%) |
| 55 to 64 Years | 68 (84.0%) | 0 (0.0%) |
| 65 to 74 Years | 0 (0.0%) | 0 (0.0%) |
| 75 Years and over | 0 (0.0%) | 0 (0.0%) |
| Total | 247 (95.0%) | 285 (91.0%) |
Income Above Poverty by Sex and Age in Polvadera
According to the poverty statistics in Polvadera, males aged 55 to 64 years and females aged 55 to 64 years are the age groups that are most secure financially, with 16.1% of males and 100.0% of females in these age groups living above the poverty line.
| Age Bracket | Male | Female |
| Under 5 Years | 0 (0.0%) | 0 (0.0%) |
| 5 Years | 0 (0.0%) | 0 (0.0%) |
| 6 to 11 Years | 0 (0.0%) | 0 (0.0%) |
| 12 to 14 Years | 0 (0.0%) | 0 (0.0%) |
| 15 Years | 0 (0.0%) | 0 (0.0%) |
| 16 and 17 Years | 0 (0.0%) | 0 (0.0%) |
| 18 to 24 Years | 0 (0.0%) | 0 (0.0%) |
| 25 to 34 Years | 0 (0.0%) | 0 (0.0%) |
| 35 to 44 Years | 0 (0.0%) | 0 (0.0%) |
| 45 to 54 Years | 0 (0.0%) | 0 (0.0%) |
| 55 to 64 Years | 13 (16.1%) | 8 (100.0%) |
| 65 to 74 Years | 0 (0.0%) | 20 (100.0%) |
| 75 Years and over | 0 (0.0%) | 0 (0.0%) |
| Total | 13 (5.0%) | 28 (8.9%) |
Income Below Poverty Among Married-Couple Families in Polvadera
| Children | Above Poverty | Below Poverty |
| No Children | 13 (100.0%) | 0 (0.0%) |
| 1 or 2 Children | 0 (0.0%) | 0 (0.0%) |
| 3 or 4 Children | 0 (0.0%) | 0 (0.0%) |
| 5 or more Children | 0 (0.0%) | 0 (0.0%) |
| Total | 13 (100.0%) | 0 (0.0%) |
Income Below Poverty Among Single-Parent Households in Polvadera
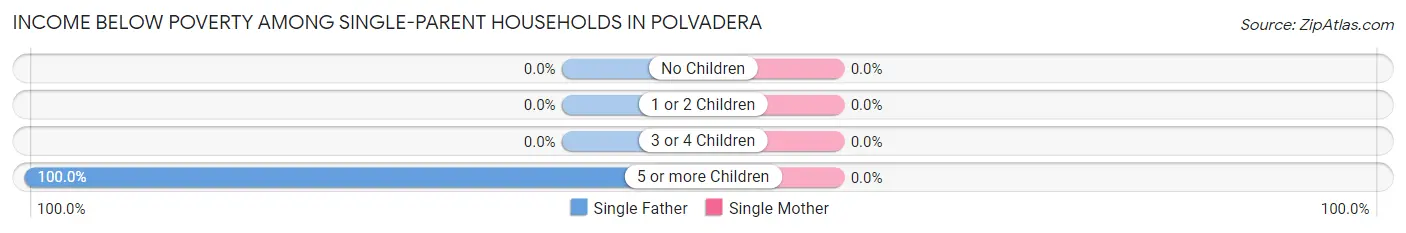
| Children | Single Father | Single Mother |
| No Children | 0 (0.0%) | 0 (0.0%) |
| 1 or 2 Children | 0 (0.0%) | 0 (0.0%) |
| 3 or 4 Children | 0 (0.0%) | 0 (0.0%) |
| 5 or more Children | 68 (100.0%) | 0 (0.0%) |
| Total | 68 (100.0%) | 0 (0.0%) |
Income Below Poverty Among Married-Couple vs Single-Parent Households in Polvadera
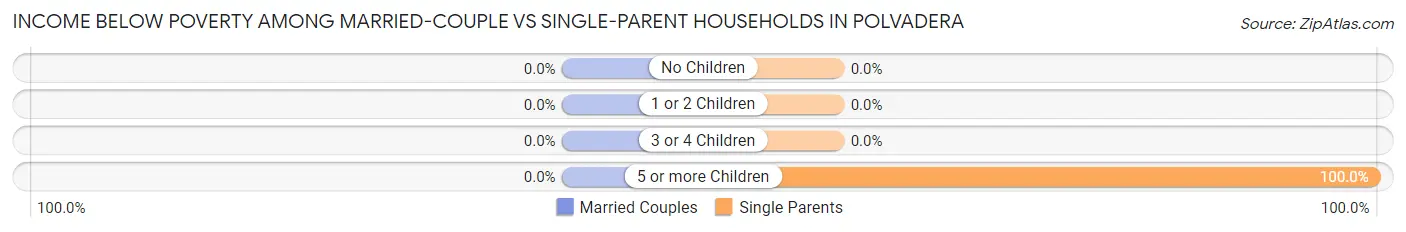
| Children | Married-Couple Families | Single-Parent Households |
| No Children | 0 (0.0%) | 0 (0.0%) |
| 1 or 2 Children | 0 (0.0%) | 0 (0.0%) |
| 3 or 4 Children | 0 (0.0%) | 0 (0.0%) |
| 5 or more Children | 0 (0.0%) | 68 (100.0%) |
| Total | 0 (0.0%) | 68 (100.0%) |
Race in Polvadera
The most populous races in Polvadera are Hispanic or Latino (359 | 62.6%), Two or more Races (359 | 62.6%), and White / Caucasian (214 | 37.3%).
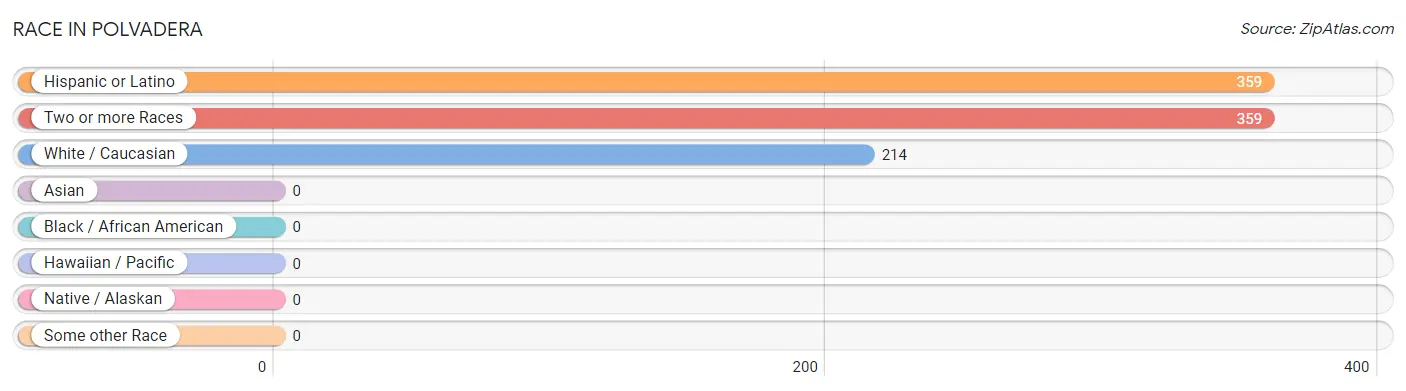
| Race | # Population | % Population |
| Asian | 0 | 0.0% |
| Black / African American | 0 | 0.0% |
| Hawaiian / Pacific | 0 | 0.0% |
| Hispanic or Latino | 359 | 62.6% |
| Native / Alaskan | 0 | 0.0% |
| White / Caucasian | 214 | 37.3% |
| Two or more Races | 359 | 62.6% |
| Some other Race | 0 | 0.0% |
| Total | 573 | 100.0% |
Ancestry in Polvadera
The most populous ancestries reported in Polvadera are American (339 | 59.2%), Spanish (20 | 3.5%), German (13 | 2.3%), and Dutch (8 | 1.4%), together accounting for 66.3% of all Polvadera residents.
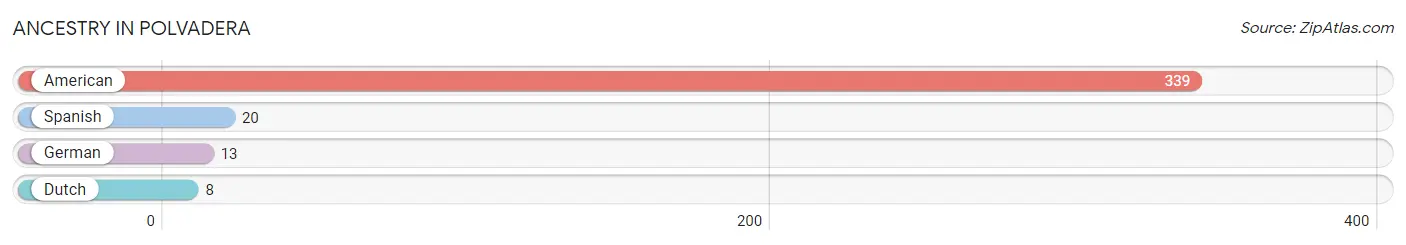
| Ancestry | # Population | % Population |
| American | 339 | 59.2% |
| Dutch | 8 | 1.4% |
| German | 13 | 2.3% |
| Spanish | 20 | 3.5% | View All 4 Rows |
Immigrants in Polvadera

| Immigration Origin | # Population | % Population | View All 0 Rows |
Sex and Age in Polvadera
Sex and Age in Polvadera
The most populous age groups in Polvadera are 5 to 9 Years (133 | 51.1%) for men and Under 5 Years (118 | 37.7%) for women.
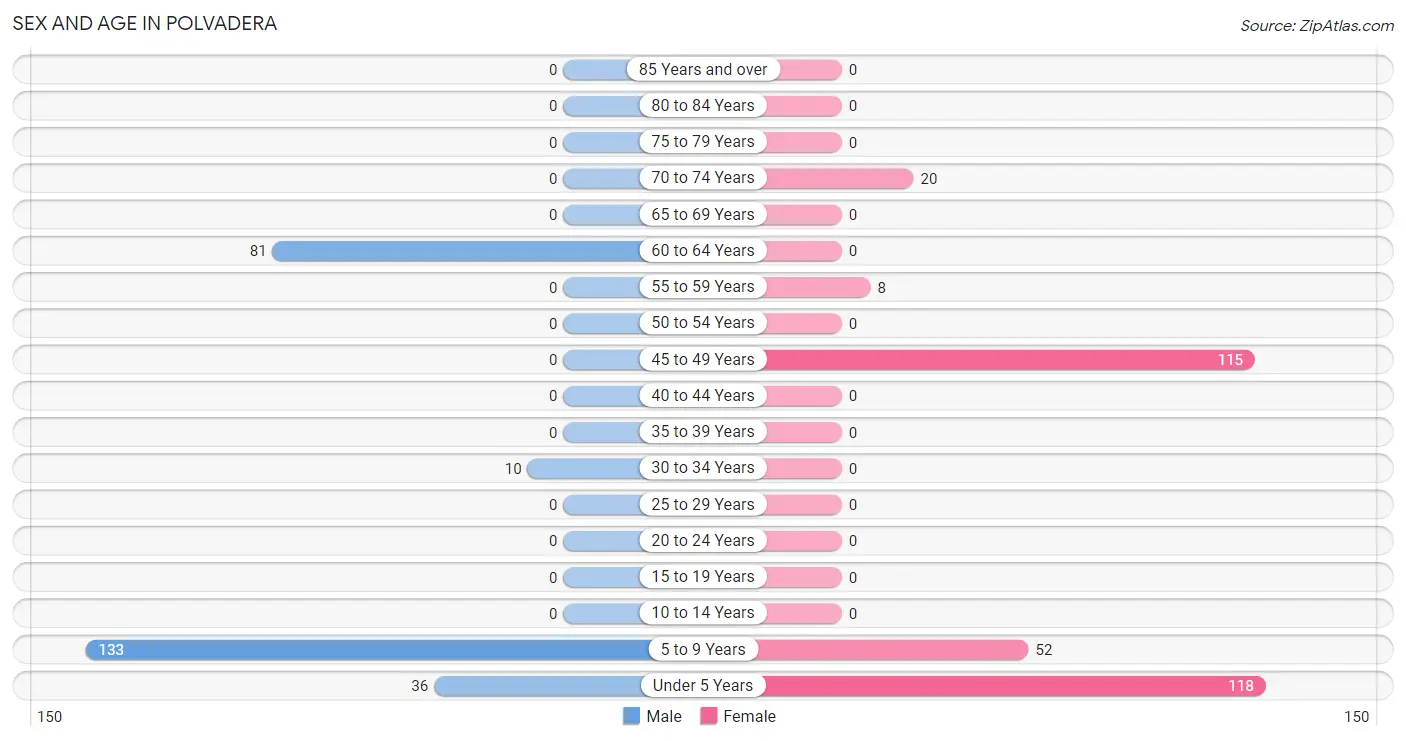
| Age Bracket | Male | Female |
| Under 5 Years | 36 (13.9%) | 118 (37.7%) |
| 5 to 9 Years | 133 (51.1%) | 52 (16.6%) |
| 10 to 14 Years | 0 (0.0%) | 0 (0.0%) |
| 15 to 19 Years | 0 (0.0%) | 0 (0.0%) |
| 20 to 24 Years | 0 (0.0%) | 0 (0.0%) |
| 25 to 29 Years | 0 (0.0%) | 0 (0.0%) |
| 30 to 34 Years | 10 (3.8%) | 0 (0.0%) |
| 35 to 39 Years | 0 (0.0%) | 0 (0.0%) |
| 40 to 44 Years | 0 (0.0%) | 0 (0.0%) |
| 45 to 49 Years | 0 (0.0%) | 115 (36.7%) |
| 50 to 54 Years | 0 (0.0%) | 0 (0.0%) |
| 55 to 59 Years | 0 (0.0%) | 8 (2.6%) |
| 60 to 64 Years | 81 (31.1%) | 0 (0.0%) |
| 65 to 69 Years | 0 (0.0%) | 0 (0.0%) |
| 70 to 74 Years | 0 (0.0%) | 20 (6.4%) |
| 75 to 79 Years | 0 (0.0%) | 0 (0.0%) |
| 80 to 84 Years | 0 (0.0%) | 0 (0.0%) |
| 85 Years and over | 0 (0.0%) | 0 (0.0%) |
| Total | 260 (100.0%) | 313 (100.0%) |
Families and Households in Polvadera
Median Family Size in Polvadera
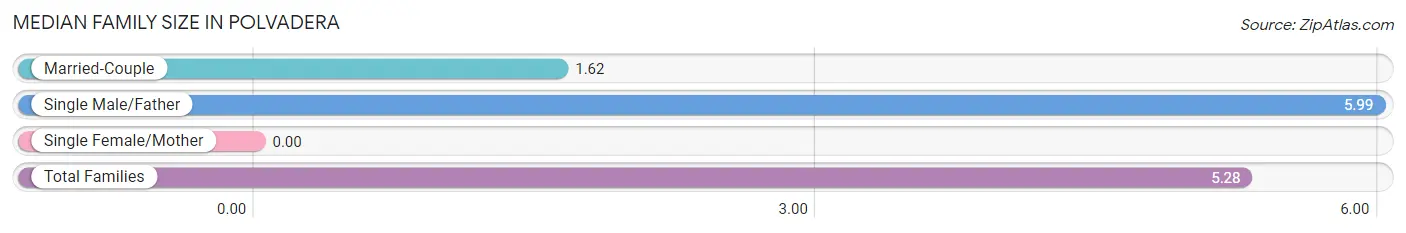
| Family Type | # Families | Family Size |
| Married-Couple | 13 (16.1%) | 1.62 |
| Single Male/Father | 68 (84.0%) | 5.99 |
| Single Female/Mother | 0 (0.0%) | - |
| Total Families | 81 (100.0%) | 5.28 |
Median Household Size in Polvadera
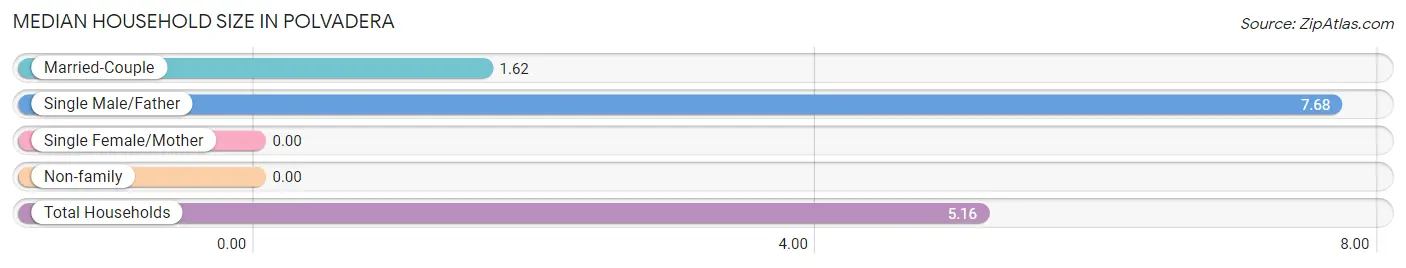
| Household Type | # Households | Household Size |
| Married-Couple | 13 (11.7%) | 1.62 |
| Single Male/Father | 68 (61.3%) | 7.68 |
| Single Female/Mother | 0 (0.0%) | - |
| Non-family | 30 (27.0%) | - |
| Total Households | 111 (100.0%) | 5.16 |
Household Size by Marriage Status in Polvadera
Out of a total of 111 households in Polvadera, 81 (73.0%) are family households, while 30 (27.0%) are nonfamily households. The most numerous type of family households are 7+ person households, comprising 68, and the most common type of nonfamily households are 1-person households, comprising 30.
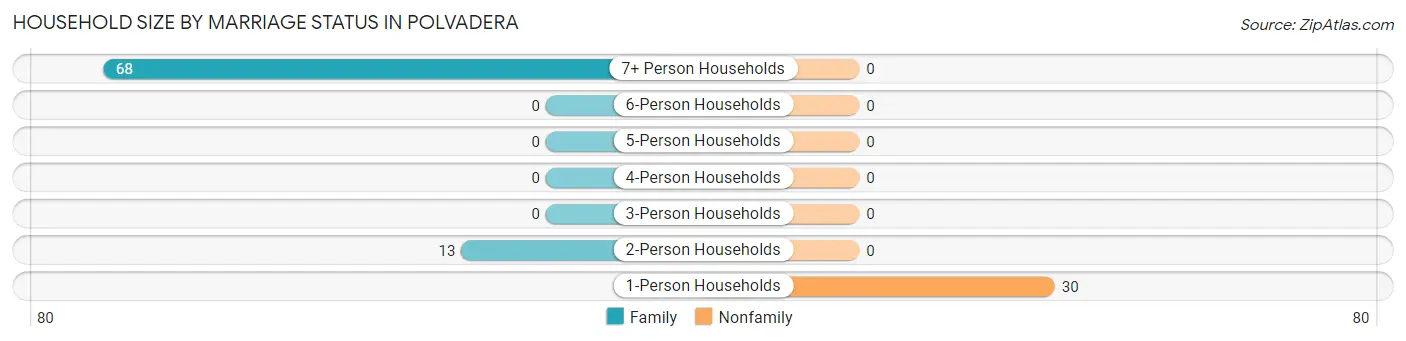
| Household Size | Family Households | Nonfamily Households |
| 1-Person Households | - | 30 (27.0%) |
| 2-Person Households | 13 (11.7%) | 0 (0.0%) |
| 3-Person Households | 0 (0.0%) | 0 (0.0%) |
| 4-Person Households | 0 (0.0%) | 0 (0.0%) |
| 5-Person Households | 0 (0.0%) | 0 (0.0%) |
| 6-Person Households | 0 (0.0%) | 0 (0.0%) |
| 7+ Person Households | 68 (61.3%) | 0 (0.0%) |
| Total | 81 (73.0%) | 30 (27.0%) |
Female Fertility in Polvadera
Fertility by Age in Polvadera
| Age Bracket | Women with Births | Births / 1,000 Women |
| 15 to 19 years | 0 (0.0%) | 0.0 |
| 20 to 34 years | 0 (0.0%) | 0.0 |
| 35 to 50 years | 0 (0.0%) | 0.0 |
| Total | 0 (0.0%) | 0.0 |
Fertility by Age by Marriage Status in Polvadera
| Age Bracket | Married | Unmarried |
| 15 to 19 years | 0 (0.0%) | 0 (0.0%) |
| 20 to 34 years | 0 (0.0%) | 0 (0.0%) |
| 35 to 50 years | 0 (0.0%) | 0 (0.0%) |
| Total | 0 (0.0%) | 0 (0.0%) |
Fertility by Education in Polvadera
| Educational Attainment | Women with Births | Births / 1,000 Women |
| Less than High School | 0 (0.0%) | 0.0 |
| High School Diploma | 0 (0.0%) | 0.0 |
| College or Associate's Degree | 0 (0.0%) | 0.0 |
| Bachelor's Degree | 0 (0.0%) | 0.0 |
| Graduate Degree | 0 (0.0%) | 0.0 |
| Total | 0 (0.0%) | 0.0 |
Fertility by Education by Marriage Status in Polvadera
| Educational Attainment | Married | Unmarried |
| Less than High School | 0 (0.0%) | 0 (0.0%) |
| High School Diploma | 0 (0.0%) | 0 (0.0%) |
| College or Associate's Degree | 0 (0.0%) | 0 (0.0%) |
| Bachelor's Degree | 0 (0.0%) | 0 (0.0%) |
| Graduate Degree | 0 (0.0%) | 0 (0.0%) |
| Total | 0 (0.0%) | 0 (0.0%) |
Employment Characteristics in Polvadera
Employment by Class of Employer in Polvadera
Among the 89 employed individuals in Polvadera, self-employed (not incorporated) (68 | 76.4%), and state government employees (21 | 23.6%) make up the most common classes of employment.
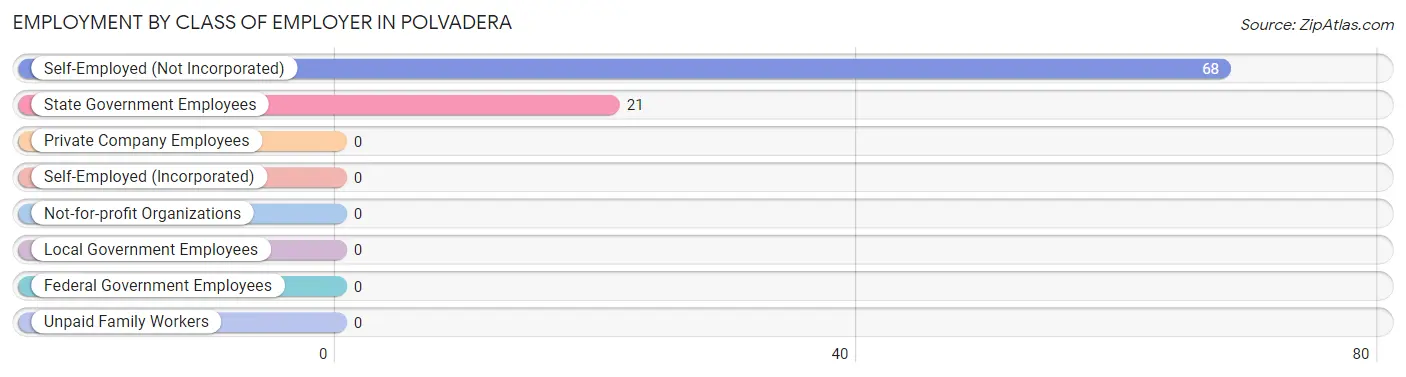
| Employer Class | # Employees | % Employees |
| Private Company Employees | 0 | 0.0% |
| Self-Employed (Incorporated) | 0 | 0.0% |
| Self-Employed (Not Incorporated) | 68 | 76.4% |
| Not-for-profit Organizations | 0 | 0.0% |
| Local Government Employees | 0 | 0.0% |
| State Government Employees | 21 | 23.6% |
| Federal Government Employees | 0 | 0.0% |
| Unpaid Family Workers | 0 | 0.0% |
| Total | 89 | 100.0% |
Employment Status by Age in Polvadera
According to the labor force statistics for Polvadera, out of the total population over 16 years of age (234), 42.3% or 99 individuals are in the labor force, with 10.1% or 10 of them unemployed. The age group with the highest labor force participation rate is 30 to 34 years, with 100.0% or 10 individuals in the labor force. Within the labor force, the 30 to 34 years age range has the highest percentage of unemployed individuals, with 100.0% or 10 of them being unemployed.
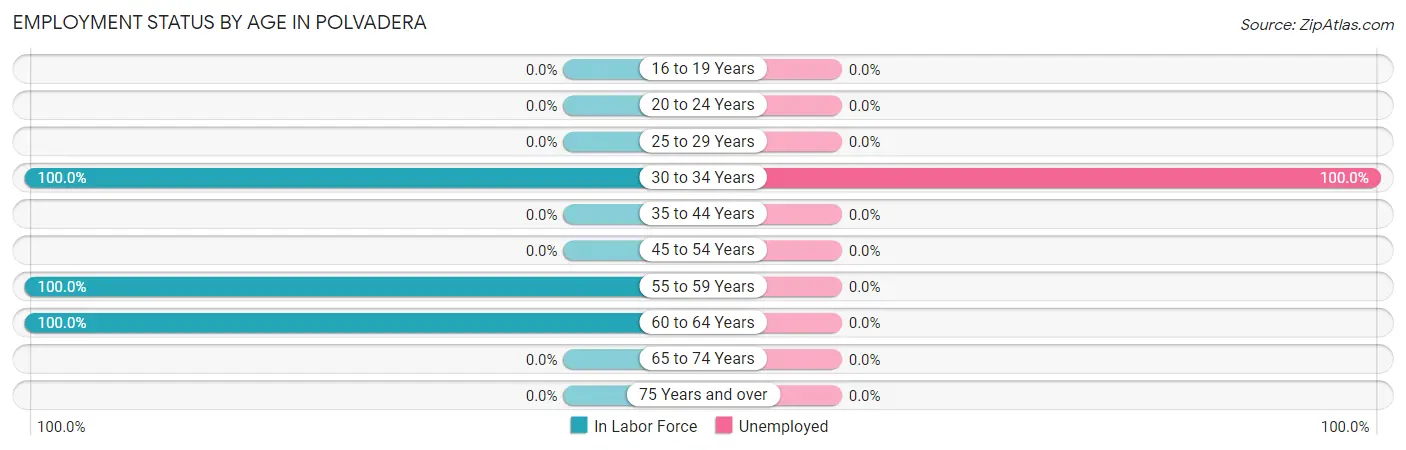
| Age Bracket | In Labor Force | Unemployed |
| 16 to 19 Years | 0 (0.0%) | 0 (0.0%) |
| 20 to 24 Years | 0 (0.0%) | 0 (0.0%) |
| 25 to 29 Years | 0 (0.0%) | 0 (0.0%) |
| 30 to 34 Years | 10 (100.0%) | 10 (100.0%) |
| 35 to 44 Years | 0 (0.0%) | 0 (0.0%) |
| 45 to 54 Years | 0 (0.0%) | 0 (0.0%) |
| 55 to 59 Years | 8 (100.0%) | 0 (0.0%) |
| 60 to 64 Years | 81 (100.0%) | 0 (0.0%) |
| 65 to 74 Years | 0 (0.0%) | 0 (0.0%) |
| 75 Years and over | 0 (0.0%) | 0 (0.0%) |
| Total | 99 (42.3%) | 10 (10.1%) |
Employment Status by Educational Attainment in Polvadera
According to labor force statistics for Polvadera, 46.3% of individuals (99) out of the total population between 25 and 64 years of age (214) are in the labor force, with 10.1% or 10 of them being unemployed. The group with the highest labor force participation rate are those with the educational attainment of college / associate degree, with 100.0% or 10 individuals in the labor force. Within the labor force, individuals with college / associate degree education have the highest percentage of unemployment, with 100.0% or 10 of them being unemployed.
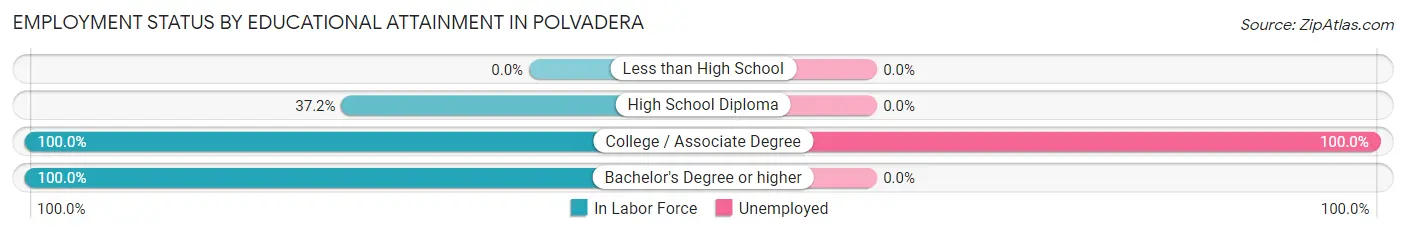
| Educational Attainment | In Labor Force | Unemployed |
| Less than High School | 0 (0.0%) | 0 (0.0%) |
| High School Diploma | 68 (37.2%) | 0 (0.0%) |
| College / Associate Degree | 10 (100.0%) | 10 (100.0%) |
| Bachelor's Degree or higher | 21 (100.0%) | 0 (0.0%) |
| Total | 99 (46.3%) | 22 (10.1%) |
Employment Occupations by Sex in Polvadera
Management, Business, Science and Arts Occupations
The most common Management, Business, Science and Arts occupations in Polvadera are Computers, Engineering & Science (13 | 14.6%), Life, Physical & Social Science (13 | 14.6%), and Management (8 | 9.0%).
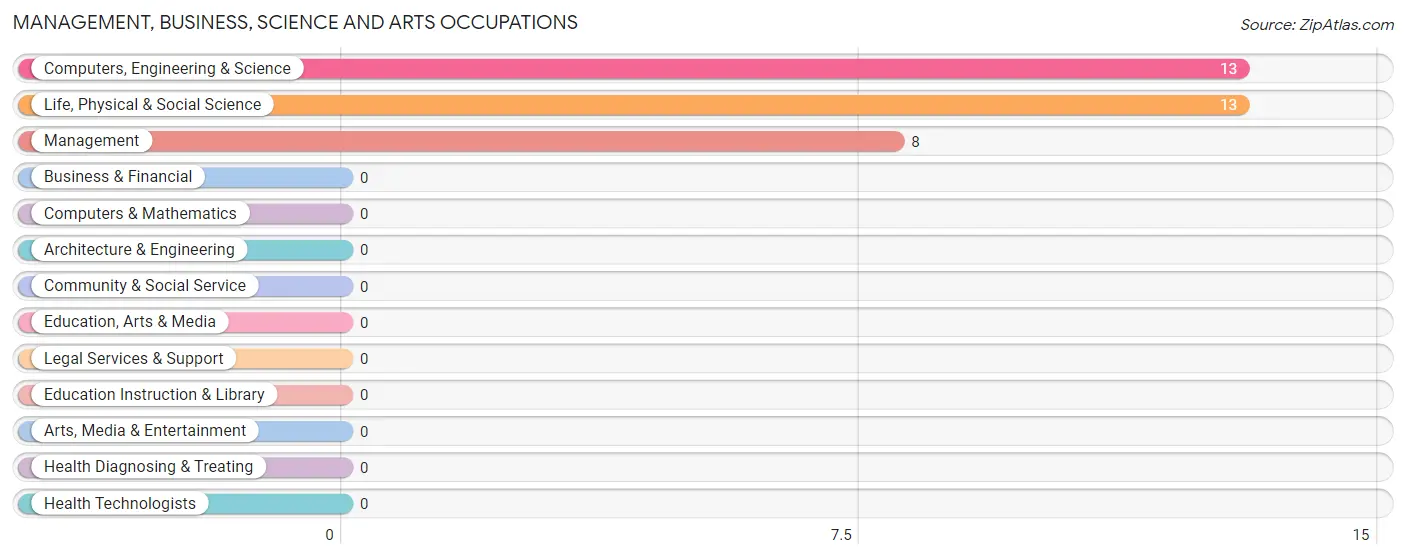
Management, Business, Science and Arts Occupations by Sex
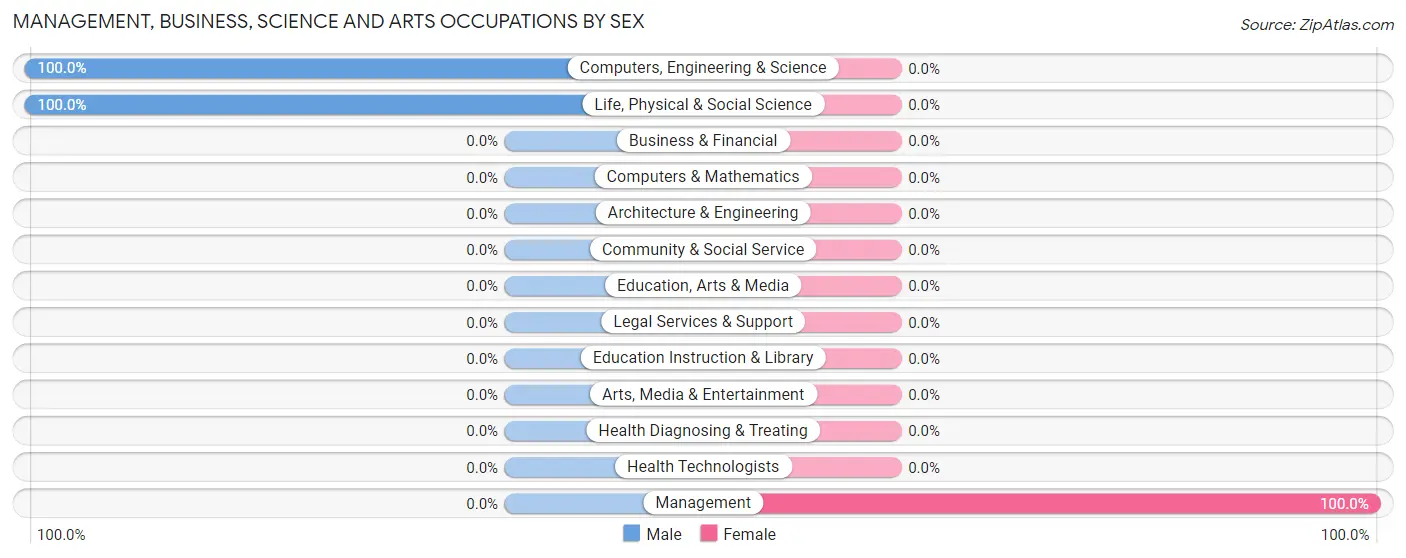
| Occupation | Male | Female |
| Management | 0 (0.0%) | 8 (100.0%) |
| Business & Financial | 0 (0.0%) | 0 (0.0%) |
| Computers, Engineering & Science | 13 (100.0%) | 0 (0.0%) |
| Computers & Mathematics | 0 (0.0%) | 0 (0.0%) |
| Architecture & Engineering | 0 (0.0%) | 0 (0.0%) |
| Life, Physical & Social Science | 13 (100.0%) | 0 (0.0%) |
| Community & Social Service | 0 (0.0%) | 0 (0.0%) |
| Education, Arts & Media | 0 (0.0%) | 0 (0.0%) |
| Legal Services & Support | 0 (0.0%) | 0 (0.0%) |
| Education Instruction & Library | 0 (0.0%) | 0 (0.0%) |
| Arts, Media & Entertainment | 0 (0.0%) | 0 (0.0%) |
| Health Diagnosing & Treating | 0 (0.0%) | 0 (0.0%) |
| Health Technologists | 0 (0.0%) | 0 (0.0%) |
| Total (Category) | 13 (61.9%) | 8 (38.1%) |
| Total (Overall) | 81 (91.0%) | 8 (9.0%) |
Services Occupations
Services Occupations by Sex
| Occupation | Male | Female |
| Healthcare Support | 0 (0.0%) | 0 (0.0%) |
| Security & Protection | 0 (0.0%) | 0 (0.0%) |
| Firefighting & Prevention | 0 (0.0%) | 0 (0.0%) |
| Law Enforcement | 0 (0.0%) | 0 (0.0%) |
| Food Preparation & Serving | 0 (0.0%) | 0 (0.0%) |
| Cleaning & Maintenance | 0 (0.0%) | 0 (0.0%) |
| Personal Care & Service | 0 (0.0%) | 0 (0.0%) |
| Total (Category) | 0 (0.0%) | 0 (0.0%) |
| Total (Overall) | 81 (91.0%) | 8 (9.0%) |
Sales and Office Occupations

Sales and Office Occupations by Sex

| Occupation | Male | Female |
| Sales & Related | 0 (0.0%) | 0 (0.0%) |
| Office & Administration | 0 (0.0%) | 0 (0.0%) |
| Total (Category) | 0 (0.0%) | 0 (0.0%) |
| Total (Overall) | 81 (91.0%) | 8 (9.0%) |
Natural Resources, Construction and Maintenance Occupations

Natural Resources, Construction and Maintenance Occupations by Sex
| Occupation | Male | Female |
| Farming, Fishing & Forestry | 0 (0.0%) | 0 (0.0%) |
| Construction & Extraction | 0 (0.0%) | 0 (0.0%) |
| Installation, Maintenance & Repair | 0 (0.0%) | 0 (0.0%) |
| Total (Category) | 0 (0.0%) | 0 (0.0%) |
| Total (Overall) | 81 (91.0%) | 8 (9.0%) |
Production, Transportation and Moving Occupations
The most common Production, Transportation and Moving occupations in Polvadera are , and Production (68 | 76.4%).
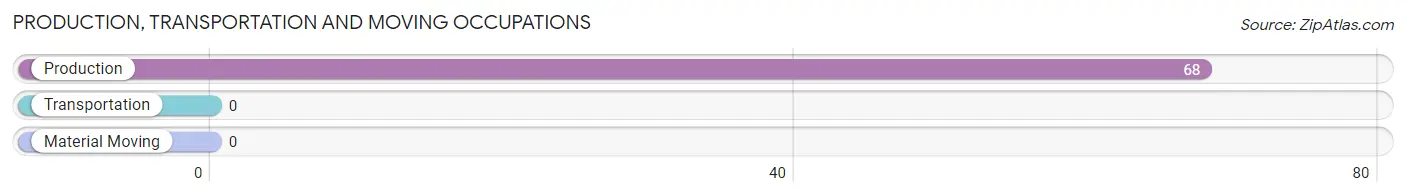
Production, Transportation and Moving Occupations by Sex
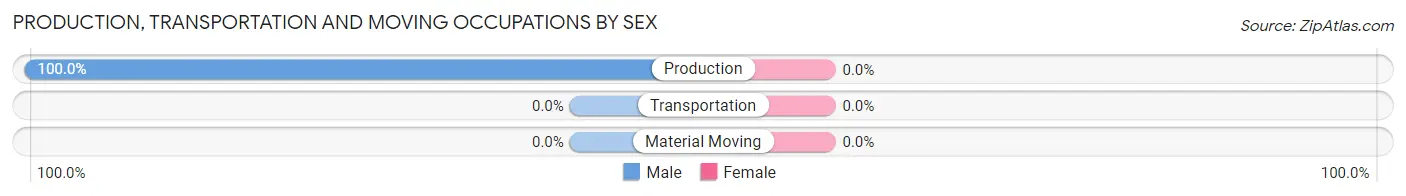
| Occupation | Male | Female |
| Production | 68 (100.0%) | 0 (0.0%) |
| Transportation | 0 (0.0%) | 0 (0.0%) |
| Material Moving | 0 (0.0%) | 0 (0.0%) |
| Total (Category) | 68 (100.0%) | 0 (0.0%) |
| Total (Overall) | 81 (91.0%) | 8 (9.0%) |
Employment Industries by Sex in Polvadera
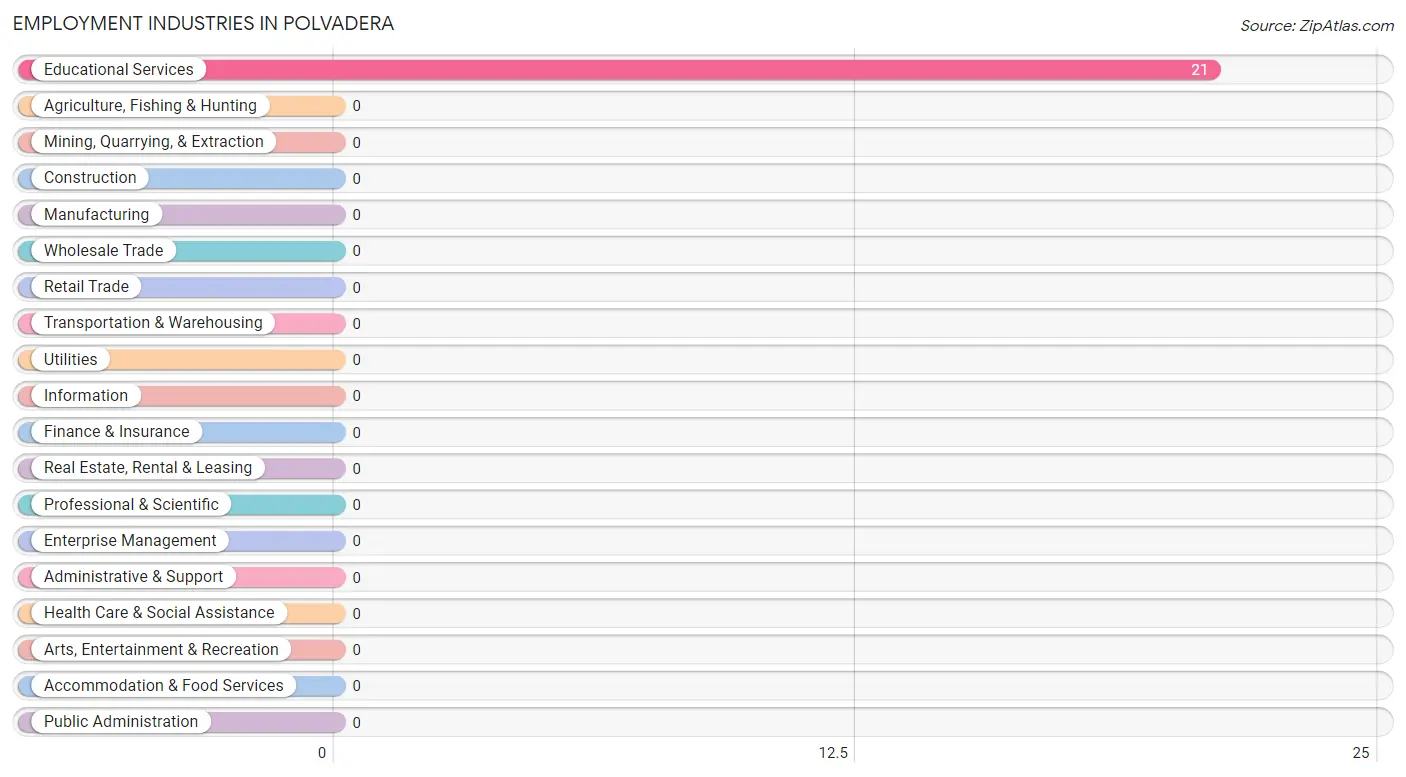
Employment Industries in Polvadera
The major employment industries in Polvadera include , and Educational Services (21 | 23.6%).
Employment Industries by Sex in Polvadera
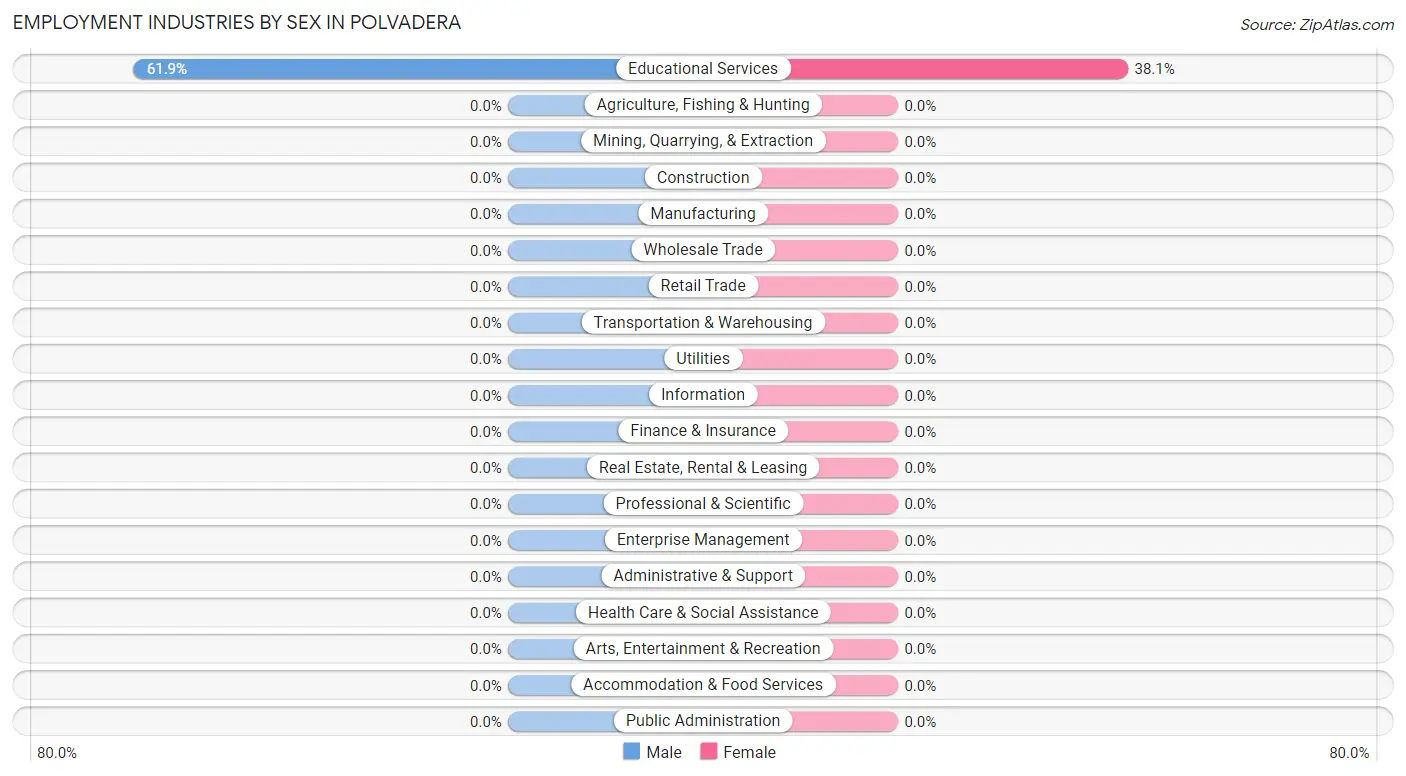
| Industry | Male | Female |
| Agriculture, Fishing & Hunting | 0 (0.0%) | 0 (0.0%) |
| Mining, Quarrying, & Extraction | 0 (0.0%) | 0 (0.0%) |
| Construction | 0 (0.0%) | 0 (0.0%) |
| Manufacturing | 0 (0.0%) | 0 (0.0%) |
| Wholesale Trade | 0 (0.0%) | 0 (0.0%) |
| Retail Trade | 0 (0.0%) | 0 (0.0%) |
| Transportation & Warehousing | 0 (0.0%) | 0 (0.0%) |
| Utilities | 0 (0.0%) | 0 (0.0%) |
| Information | 0 (0.0%) | 0 (0.0%) |
| Finance & Insurance | 0 (0.0%) | 0 (0.0%) |
| Real Estate, Rental & Leasing | 0 (0.0%) | 0 (0.0%) |
| Professional & Scientific | 0 (0.0%) | 0 (0.0%) |
| Enterprise Management | 0 (0.0%) | 0 (0.0%) |
| Administrative & Support | 0 (0.0%) | 0 (0.0%) |
| Educational Services | 13 (61.9%) | 8 (38.1%) |
| Health Care & Social Assistance | 0 (0.0%) | 0 (0.0%) |
| Arts, Entertainment & Recreation | 0 (0.0%) | 0 (0.0%) |
| Accommodation & Food Services | 0 (0.0%) | 0 (0.0%) |
| Public Administration | 0 (0.0%) | 0 (0.0%) |
| Total | 81 (91.0%) | 8 (9.0%) |
Education in Polvadera
School Enrollment in Polvadera
The most common levels of schooling among the 185 students in Polvadera are kindergarten (104 | 56.2%), and elementary school (81 | 43.8%).
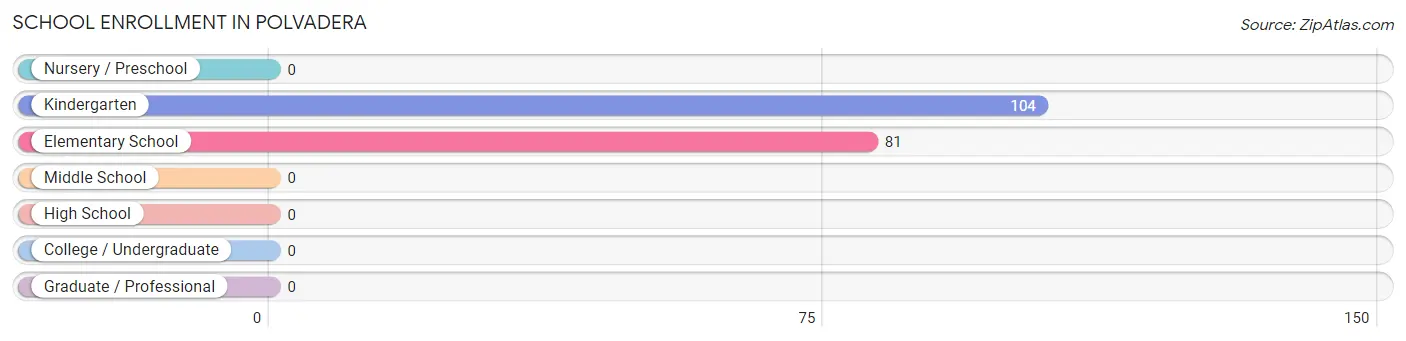
| School Level | # Students | % Students |
| Nursery / Preschool | 0 | 0.0% |
| Kindergarten | 104 | 56.2% |
| Elementary School | 81 | 43.8% |
| Middle School | 0 | 0.0% |
| High School | 0 | 0.0% |
| College / Undergraduate | 0 | 0.0% |
| Graduate / Professional | 0 | 0.0% |
| Total | 185 | 100.0% |
School Enrollment by Age by Funding Source in Polvadera
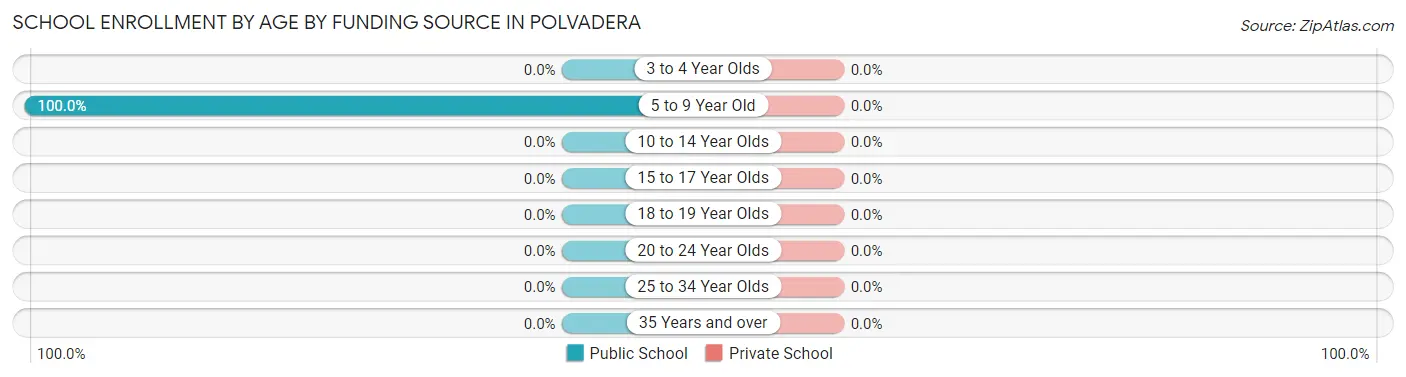
| Age Bracket | Public School | Private School |
| 3 to 4 Year Olds | 0 (0.0%) | 0 (0.0%) |
| 5 to 9 Year Old | 185 (100.0%) | 0 (0.0%) |
| 10 to 14 Year Olds | 0 (0.0%) | 0 (0.0%) |
| 15 to 17 Year Olds | 0 (0.0%) | 0 (0.0%) |
| 18 to 19 Year Olds | 0 (0.0%) | 0 (0.0%) |
| 20 to 24 Year Olds | 0 (0.0%) | 0 (0.0%) |
| 25 to 34 Year Olds | 0 (0.0%) | 0 (0.0%) |
| 35 Years and over | 0 (0.0%) | 0 (0.0%) |
| Total | 185 (100.0%) | 0 (0.0%) |
Educational Attainment by Field of Study in Polvadera
Physical & health sciences (21 | 51.2%), and literature & languages (20 | 48.8%) are the most common fields of study among 41 individuals in Polvadera who have obtained a bachelor's degree or higher.
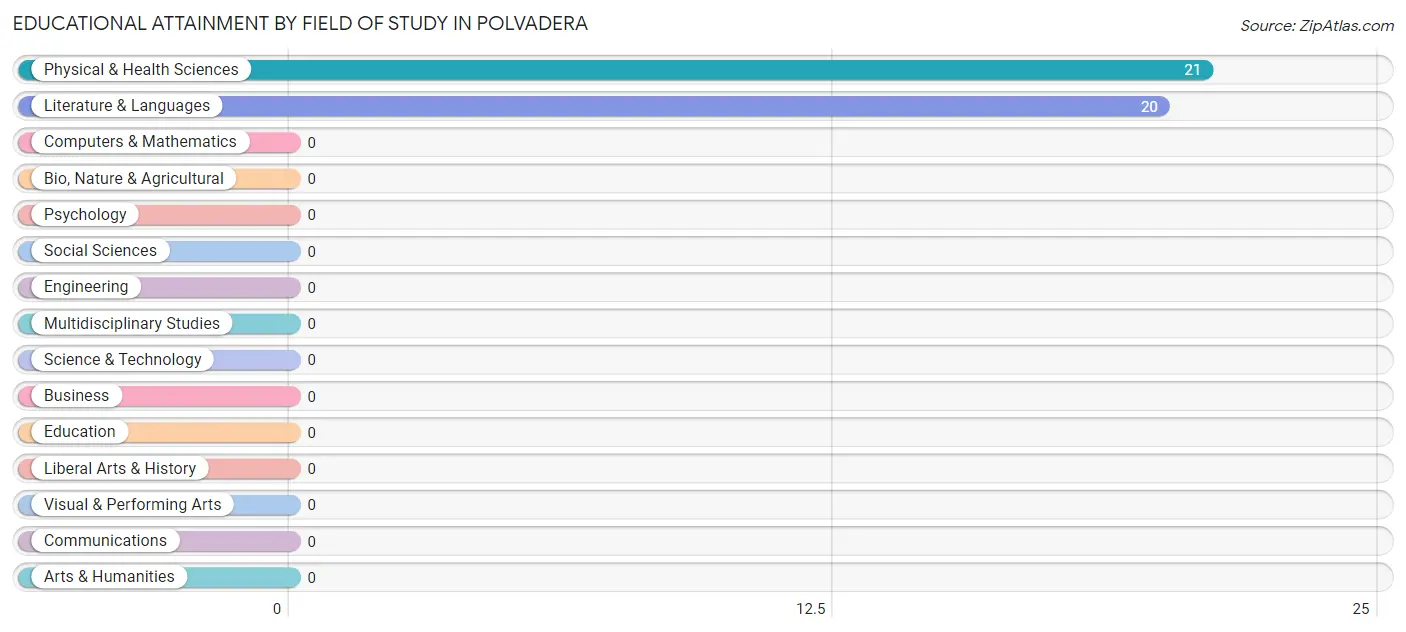
| Field of Study | # Graduates | % Graduates |
| Computers & Mathematics | 0 | 0.0% |
| Bio, Nature & Agricultural | 0 | 0.0% |
| Physical & Health Sciences | 21 | 51.2% |
| Psychology | 0 | 0.0% |
| Social Sciences | 0 | 0.0% |
| Engineering | 0 | 0.0% |
| Multidisciplinary Studies | 0 | 0.0% |
| Science & Technology | 0 | 0.0% |
| Business | 0 | 0.0% |
| Education | 0 | 0.0% |
| Literature & Languages | 20 | 48.8% |
| Liberal Arts & History | 0 | 0.0% |
| Visual & Performing Arts | 0 | 0.0% |
| Communications | 0 | 0.0% |
| Arts & Humanities | 0 | 0.0% |
| Total | 41 | 100.0% |
Transportation & Commute in Polvadera
Vehicle Availability by Sex in Polvadera
The most prevalent vehicle ownership categories in Polvadera are males with 3 vehicles (68, accounting for 84.0%) and females with 3 vehicles (0, making up 850.0%).
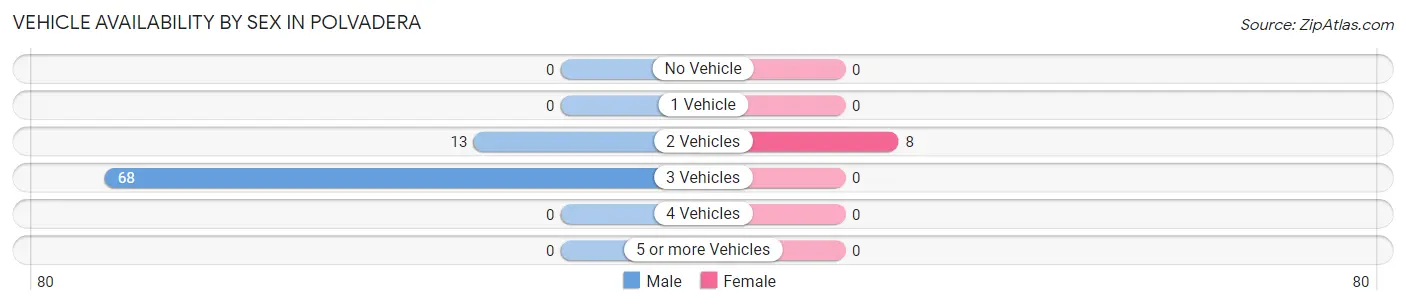
| Vehicles Available | Male | Female |
| No Vehicle | 0 (0.0%) | 0 (0.0%) |
| 1 Vehicle | 0 (0.0%) | 0 (0.0%) |
| 2 Vehicles | 13 (16.1%) | 8 (100.0%) |
| 3 Vehicles | 68 (84.0%) | 0 (0.0%) |
| 4 Vehicles | 0 (0.0%) | 0 (0.0%) |
| 5 or more Vehicles | 0 (0.0%) | 0 (0.0%) |
| Total | 81 (100.0%) | 8 (100.0%) |
Commute Time in Polvadera
The most frequently occuring commute durations in Polvadera are 20 to 24 minutes (21 commuters, 100.0%), less than 5 minutes (0 commuters, 0.0%), and 5 to 9 minutes (0 commuters, 0.0%).
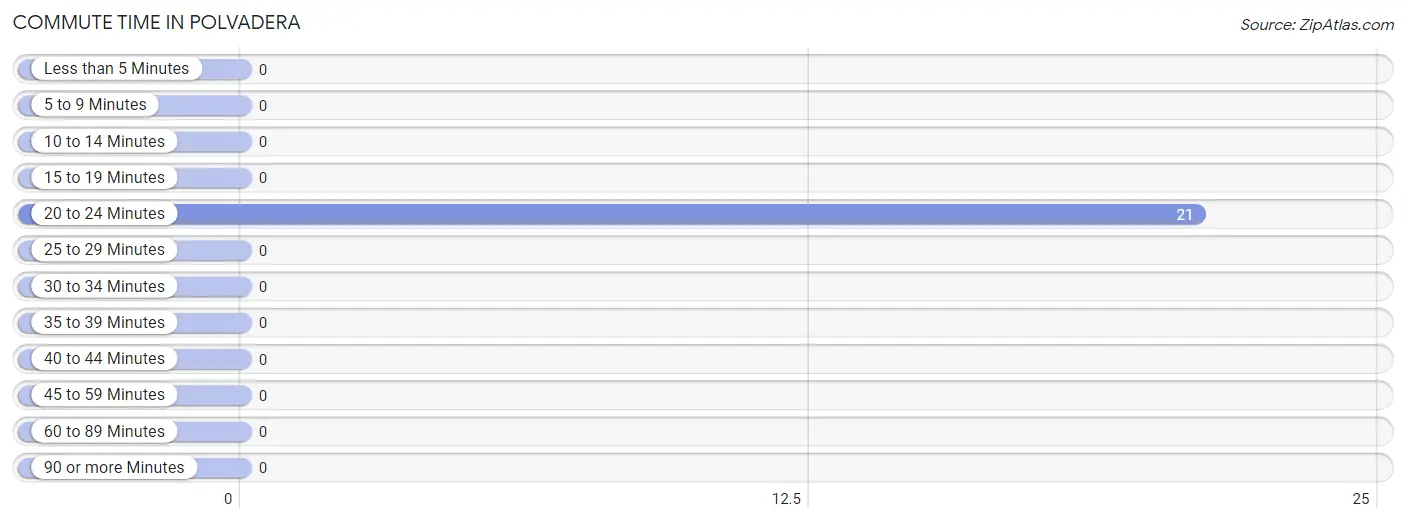
| Commute Time | # Commuters | % Commuters |
| Less than 5 Minutes | 0 | 0.0% |
| 5 to 9 Minutes | 0 | 0.0% |
| 10 to 14 Minutes | 0 | 0.0% |
| 15 to 19 Minutes | 0 | 0.0% |
| 20 to 24 Minutes | 21 | 100.0% |
| 25 to 29 Minutes | 0 | 0.0% |
| 30 to 34 Minutes | 0 | 0.0% |
| 35 to 39 Minutes | 0 | 0.0% |
| 40 to 44 Minutes | 0 | 0.0% |
| 45 to 59 Minutes | 0 | 0.0% |
| 60 to 89 Minutes | 0 | 0.0% |
| 90 or more Minutes | 0 | 0.0% |
Commute Time by Sex in Polvadera
The most common commute times in Polvadera are 20 to 24 minutes (13 commuters, 100.0%) for males and 20 to 24 minutes (8 commuters, 100.0%) for females.
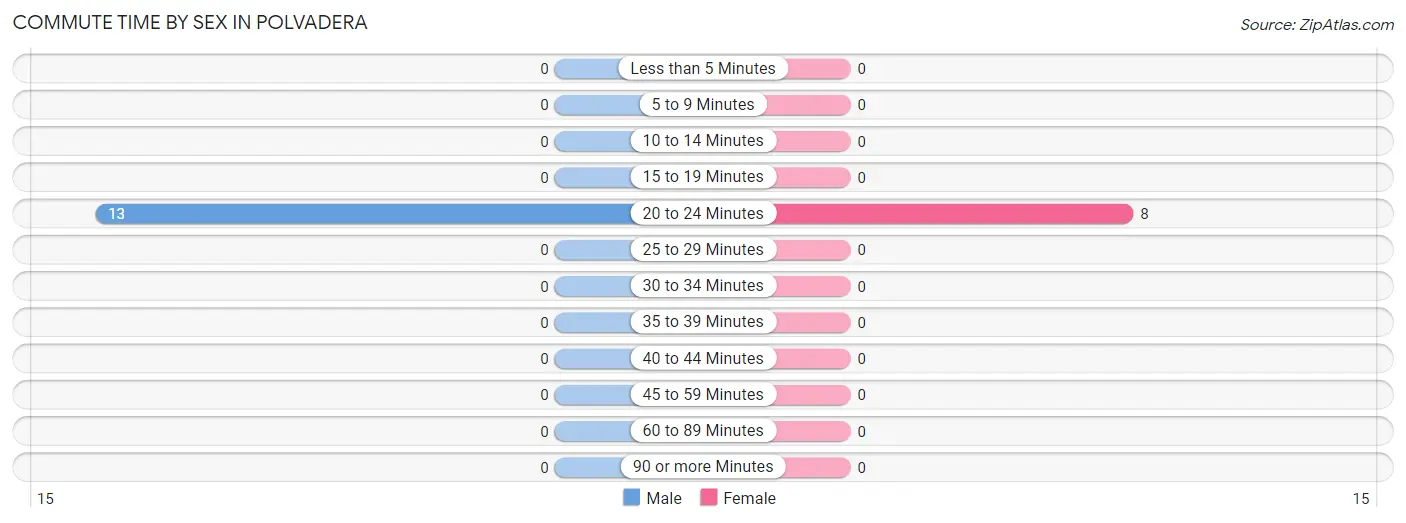
| Commute Time | Male | Female |
| Less than 5 Minutes | 0 (0.0%) | 0 (0.0%) |
| 5 to 9 Minutes | 0 (0.0%) | 0 (0.0%) |
| 10 to 14 Minutes | 0 (0.0%) | 0 (0.0%) |
| 15 to 19 Minutes | 0 (0.0%) | 0 (0.0%) |
| 20 to 24 Minutes | 13 (100.0%) | 8 (100.0%) |
| 25 to 29 Minutes | 0 (0.0%) | 0 (0.0%) |
| 30 to 34 Minutes | 0 (0.0%) | 0 (0.0%) |
| 35 to 39 Minutes | 0 (0.0%) | 0 (0.0%) |
| 40 to 44 Minutes | 0 (0.0%) | 0 (0.0%) |
| 45 to 59 Minutes | 0 (0.0%) | 0 (0.0%) |
| 60 to 89 Minutes | 0 (0.0%) | 0 (0.0%) |
| 90 or more Minutes | 0 (0.0%) | 0 (0.0%) |
Time of Departure to Work by Sex in Polvadera
The most frequent times of departure to work in Polvadera are 9:00 AM to 9:59 AM (13, 100.0%) for males and 9:00 AM to 9:59 AM (8, 100.0%) for females.
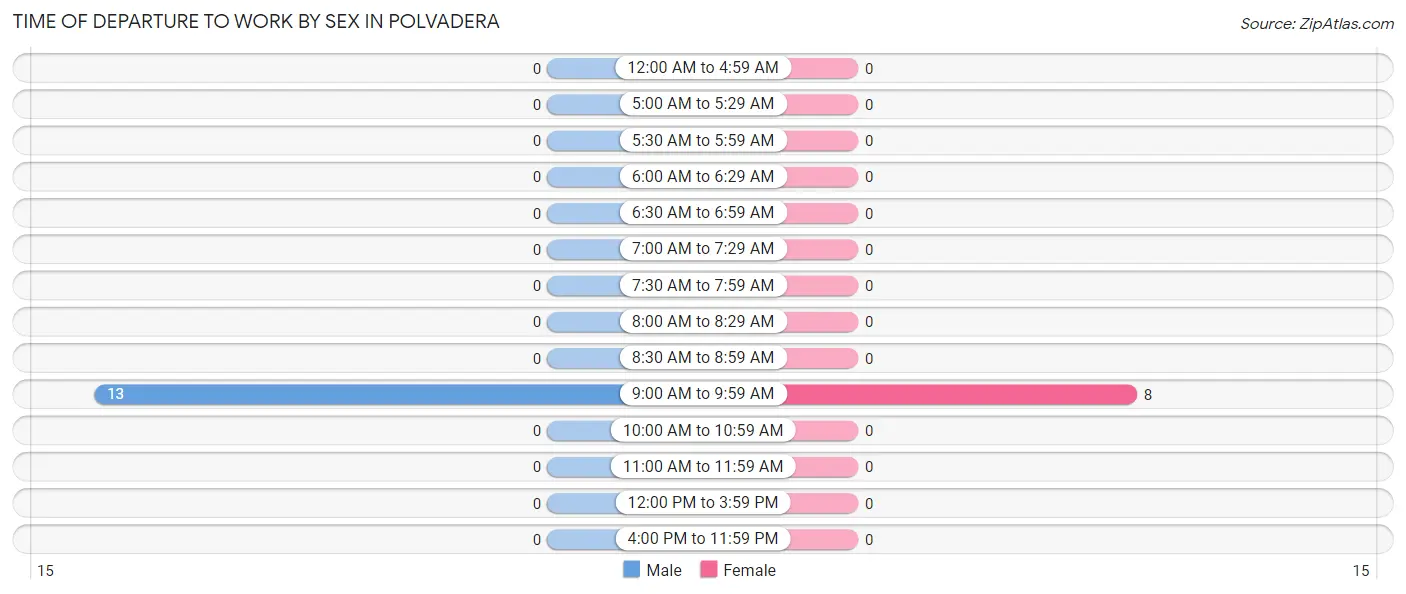
| Time of Departure | Male | Female |
| 12:00 AM to 4:59 AM | 0 (0.0%) | 0 (0.0%) |
| 5:00 AM to 5:29 AM | 0 (0.0%) | 0 (0.0%) |
| 5:30 AM to 5:59 AM | 0 (0.0%) | 0 (0.0%) |
| 6:00 AM to 6:29 AM | 0 (0.0%) | 0 (0.0%) |
| 6:30 AM to 6:59 AM | 0 (0.0%) | 0 (0.0%) |
| 7:00 AM to 7:29 AM | 0 (0.0%) | 0 (0.0%) |
| 7:30 AM to 7:59 AM | 0 (0.0%) | 0 (0.0%) |
| 8:00 AM to 8:29 AM | 0 (0.0%) | 0 (0.0%) |
| 8:30 AM to 8:59 AM | 0 (0.0%) | 0 (0.0%) |
| 9:00 AM to 9:59 AM | 13 (100.0%) | 8 (100.0%) |
| 10:00 AM to 10:59 AM | 0 (0.0%) | 0 (0.0%) |
| 11:00 AM to 11:59 AM | 0 (0.0%) | 0 (0.0%) |
| 12:00 PM to 3:59 PM | 0 (0.0%) | 0 (0.0%) |
| 4:00 PM to 11:59 PM | 0 (0.0%) | 0 (0.0%) |
| Total | 13 (100.0%) | 8 (100.0%) |
Housing Occupancy in Polvadera
Occupancy by Ownership in Polvadera
Of the total 111 dwellings in Polvadera, owner-occupied units account for 101 (91.0%), while renter-occupied units make up 10 (9.0%).
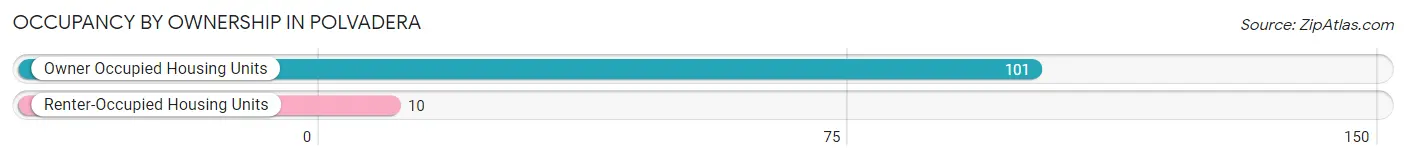
| Occupancy | # Housing Units | % Housing Units |
| Owner Occupied Housing Units | 101 | 91.0% |
| Renter-Occupied Housing Units | 10 | 9.0% |
| Total Occupied Housing Units | 111 | 100.0% |
Occupancy by Household Size in Polvadera
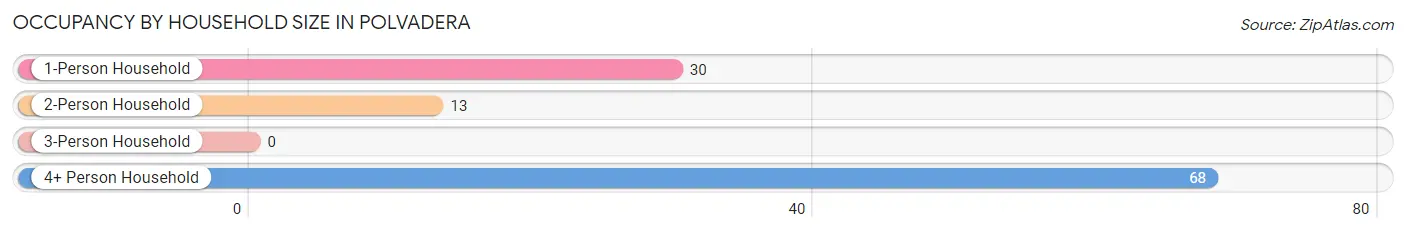
| Household Size | # Housing Units | % Housing Units |
| 1-Person Household | 30 | 27.0% |
| 2-Person Household | 13 | 11.7% |
| 3-Person Household | 0 | 0.0% |
| 4+ Person Household | 68 | 61.3% |
| Total Housing Units | 111 | 100.0% |
Occupancy by Ownership by Household Size in Polvadera
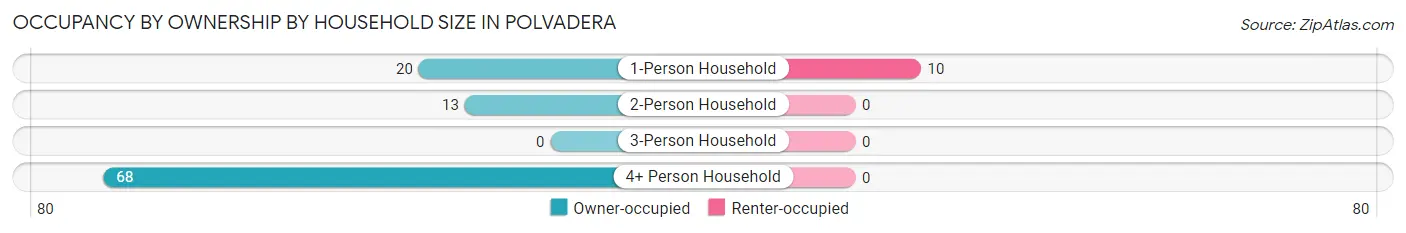
| Household Size | Owner-occupied | Renter-occupied |
| 1-Person Household | 20 (66.7%) | 10 (33.3%) |
| 2-Person Household | 13 (100.0%) | 0 (0.0%) |
| 3-Person Household | 0 (0.0%) | 0 (0.0%) |
| 4+ Person Household | 68 (100.0%) | 0 (0.0%) |
| Total Housing Units | 101 (91.0%) | 10 (9.0%) |
Occupancy by Educational Attainment in Polvadera
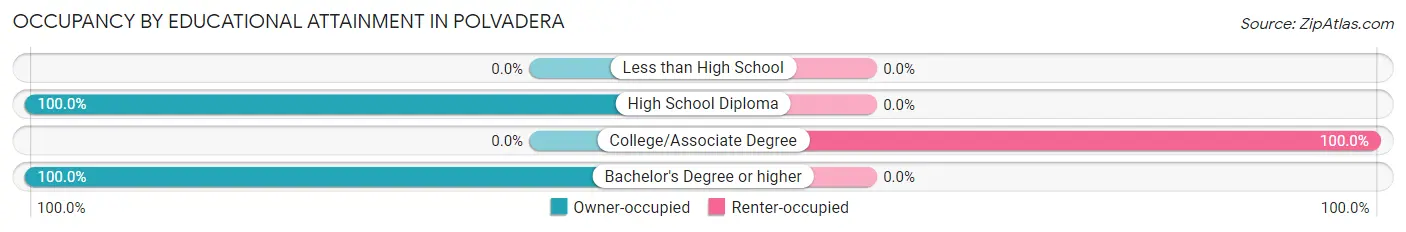
| Household Size | Owner-occupied | Renter-occupied |
| Less than High School | 0 (0.0%) | 0 (0.0%) |
| High School Diploma | 68 (100.0%) | 0 (0.0%) |
| College/Associate Degree | 0 (0.0%) | 10 (100.0%) |
| Bachelor's Degree or higher | 33 (100.0%) | 0 (0.0%) |
Occupancy by Age of Householder in Polvadera
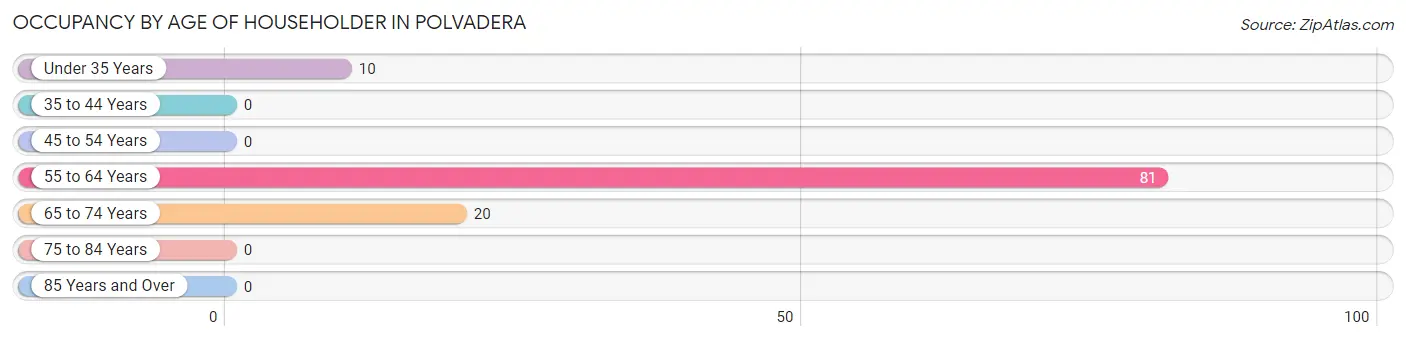
| Age Bracket | # Households | % Households |
| Under 35 Years | 10 | 9.0% |
| 35 to 44 Years | 0 | 0.0% |
| 45 to 54 Years | 0 | 0.0% |
| 55 to 64 Years | 81 | 73.0% |
| 65 to 74 Years | 20 | 18.0% |
| 75 to 84 Years | 0 | 0.0% |
| 85 Years and Over | 0 | 0.0% |
| Total | 111 | 100.0% |
Housing Finances in Polvadera
Median Income by Occupancy in Polvadera
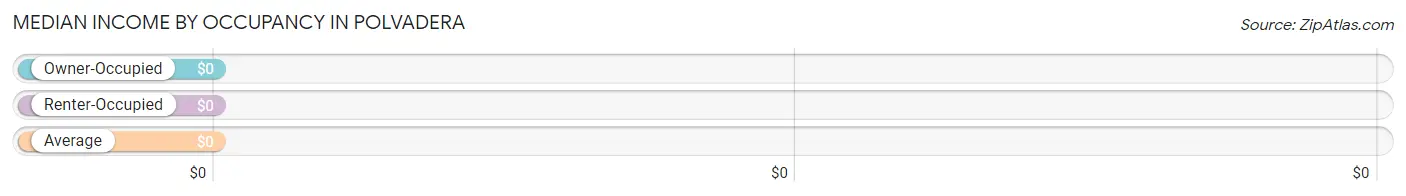
| Occupancy Type | # Households | Median Income |
| Owner-Occupied | 101 (91.0%) | $0 |
| Renter-Occupied | 10 (9.0%) | $0 |
| Average | 111 (100.0%) | $0 |
Occupancy by Householder Income Bracket in Polvadera
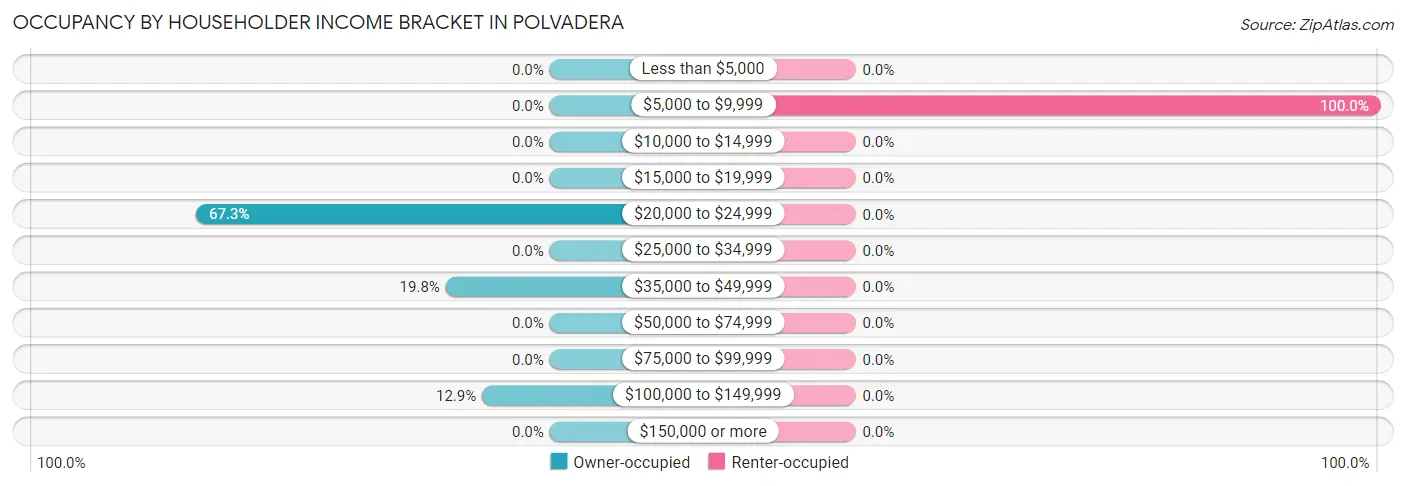
| Income Bracket | Owner-occupied | Renter-occupied |
| Less than $5,000 | 0 (0.0%) | 0 (0.0%) |
| $5,000 to $9,999 | 0 (0.0%) | 10 (100.0%) |
| $10,000 to $14,999 | 0 (0.0%) | 0 (0.0%) |
| $15,000 to $19,999 | 0 (0.0%) | 0 (0.0%) |
| $20,000 to $24,999 | 68 (67.3%) | 0 (0.0%) |
| $25,000 to $34,999 | 0 (0.0%) | 0 (0.0%) |
| $35,000 to $49,999 | 20 (19.8%) | 0 (0.0%) |
| $50,000 to $74,999 | 0 (0.0%) | 0 (0.0%) |
| $75,000 to $99,999 | 0 (0.0%) | 0 (0.0%) |
| $100,000 to $149,999 | 13 (12.9%) | 0 (0.0%) |
| $150,000 or more | 0 (0.0%) | 0 (0.0%) |
| Total | 101 (100.0%) | 10 (100.0%) |
Monthly Housing Cost Tiers in Polvadera
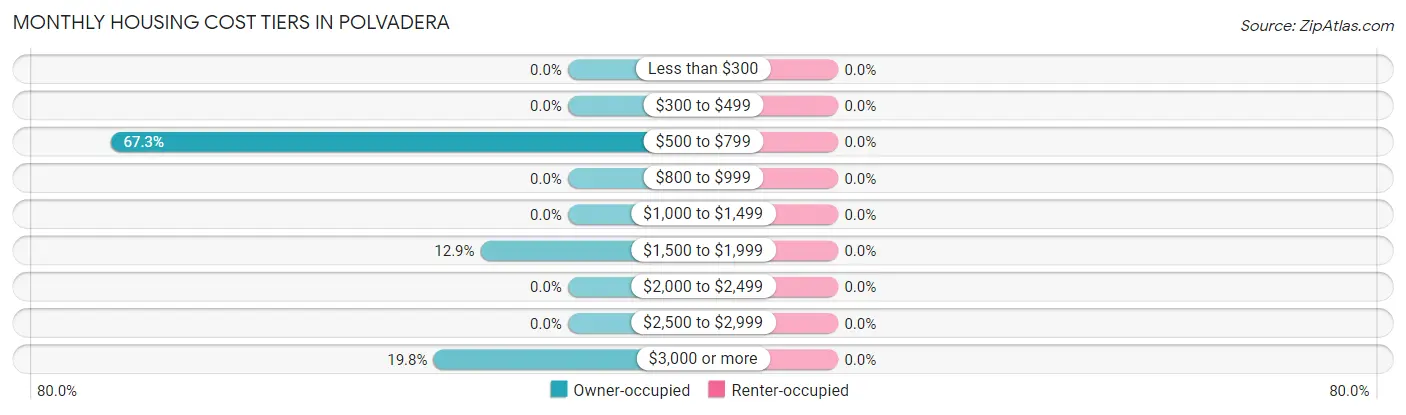
| Monthly Cost | Owner-occupied | Renter-occupied |
| Less than $300 | 0 (0.0%) | 0 (0.0%) |
| $300 to $499 | 0 (0.0%) | 0 (0.0%) |
| $500 to $799 | 68 (67.3%) | 0 (0.0%) |
| $800 to $999 | 0 (0.0%) | 0 (0.0%) |
| $1,000 to $1,499 | 0 (0.0%) | 0 (0.0%) |
| $1,500 to $1,999 | 13 (12.9%) | 0 (0.0%) |
| $2,000 to $2,499 | 0 (0.0%) | 0 (0.0%) |
| $2,500 to $2,999 | 0 (0.0%) | 0 (0.0%) |
| $3,000 or more | 20 (19.8%) | 0 (0.0%) |
| Total | 101 (100.0%) | 10 (100.0%) |
Physical Housing Characteristics in Polvadera
Housing Structures in Polvadera
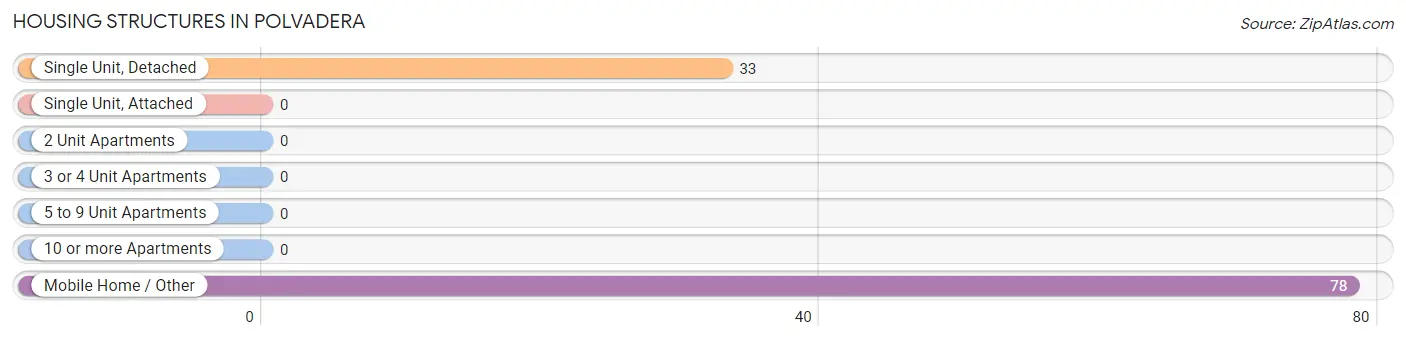
| Structure Type | # Housing Units | % Housing Units |
| Single Unit, Detached | 33 | 29.7% |
| Single Unit, Attached | 0 | 0.0% |
| 2 Unit Apartments | 0 | 0.0% |
| 3 or 4 Unit Apartments | 0 | 0.0% |
| 5 to 9 Unit Apartments | 0 | 0.0% |
| 10 or more Apartments | 0 | 0.0% |
| Mobile Home / Other | 78 | 70.3% |
| Total | 111 | 100.0% |
Housing Structures by Occupancy in Polvadera
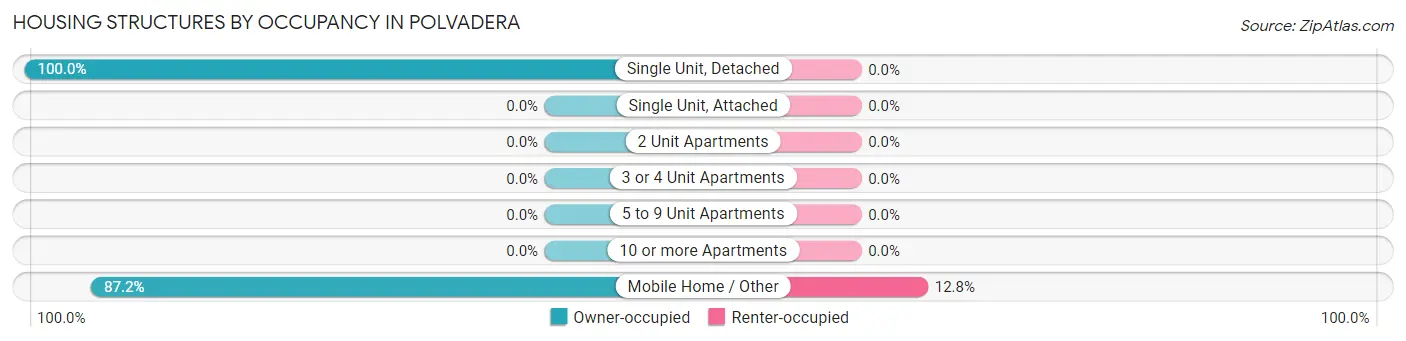
| Structure Type | Owner-occupied | Renter-occupied |
| Single Unit, Detached | 33 (100.0%) | 0 (0.0%) |
| Single Unit, Attached | 0 (0.0%) | 0 (0.0%) |
| 2 Unit Apartments | 0 (0.0%) | 0 (0.0%) |
| 3 or 4 Unit Apartments | 0 (0.0%) | 0 (0.0%) |
| 5 to 9 Unit Apartments | 0 (0.0%) | 0 (0.0%) |
| 10 or more Apartments | 0 (0.0%) | 0 (0.0%) |
| Mobile Home / Other | 68 (87.2%) | 10 (12.8%) |
| Total | 101 (91.0%) | 10 (9.0%) |
Housing Structures by Number of Rooms in Polvadera
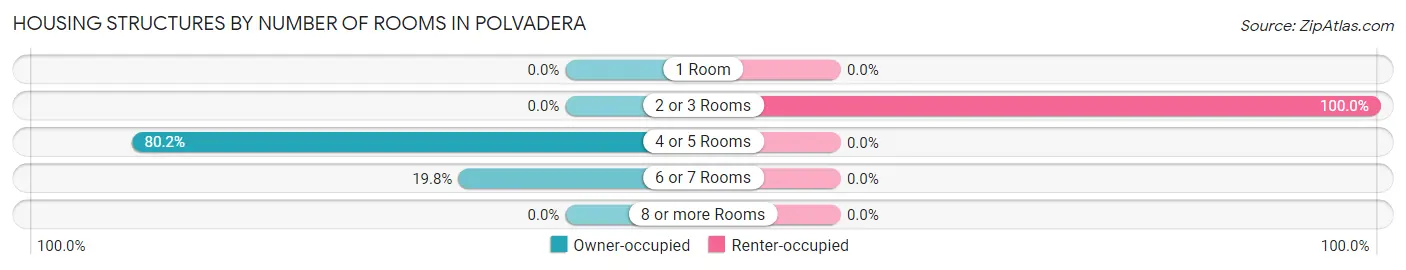
| Number of Rooms | Owner-occupied | Renter-occupied |
| 1 Room | 0 (0.0%) | 0 (0.0%) |
| 2 or 3 Rooms | 0 (0.0%) | 10 (100.0%) |
| 4 or 5 Rooms | 81 (80.2%) | 0 (0.0%) |
| 6 or 7 Rooms | 20 (19.8%) | 0 (0.0%) |
| 8 or more Rooms | 0 (0.0%) | 0 (0.0%) |
| Total | 101 (100.0%) | 10 (100.0%) |
Housing Structure by Heating Type in Polvadera
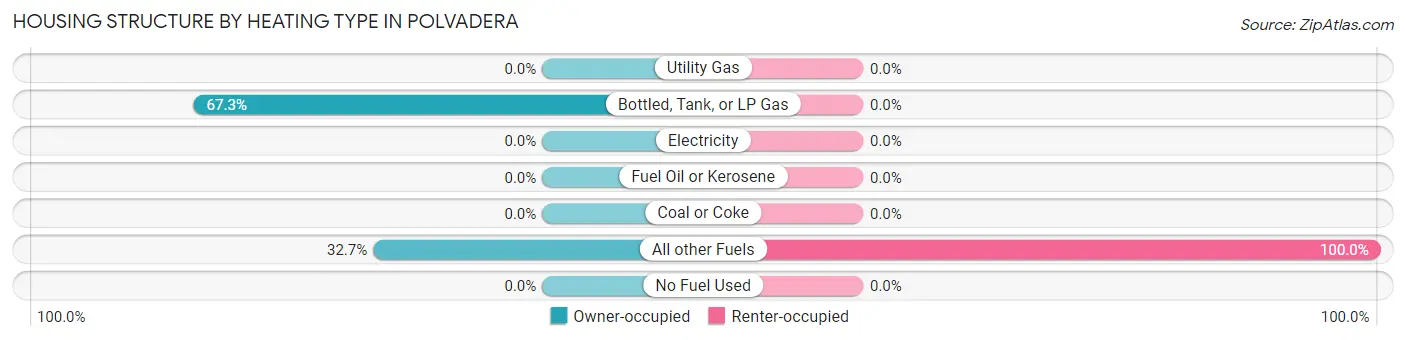
| Heating Type | Owner-occupied | Renter-occupied |
| Utility Gas | 0 (0.0%) | 0 (0.0%) |
| Bottled, Tank, or LP Gas | 68 (67.3%) | 0 (0.0%) |
| Electricity | 0 (0.0%) | 0 (0.0%) |
| Fuel Oil or Kerosene | 0 (0.0%) | 0 (0.0%) |
| Coal or Coke | 0 (0.0%) | 0 (0.0%) |
| All other Fuels | 33 (32.7%) | 10 (100.0%) |
| No Fuel Used | 0 (0.0%) | 0 (0.0%) |
| Total | 101 (100.0%) | 10 (100.0%) |
Household Vehicle Usage in Polvadera
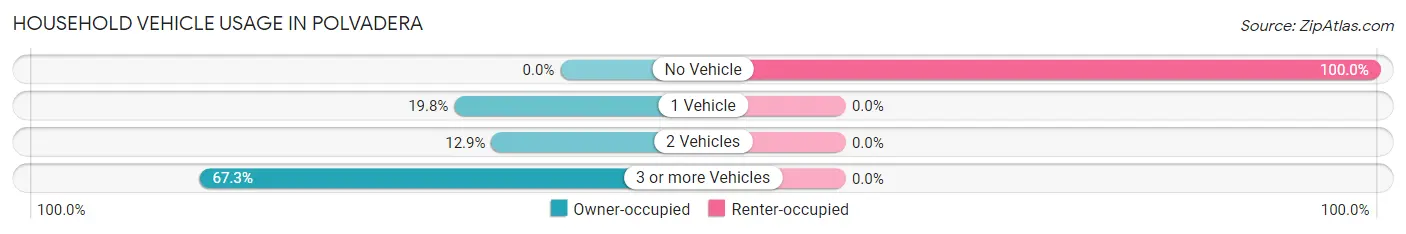
| Vehicles per Household | Owner-occupied | Renter-occupied |
| No Vehicle | 0 (0.0%) | 10 (100.0%) |
| 1 Vehicle | 20 (19.8%) | 0 (0.0%) |
| 2 Vehicles | 13 (12.9%) | 0 (0.0%) |
| 3 or more Vehicles | 68 (67.3%) | 0 (0.0%) |
| Total | 101 (100.0%) | 10 (100.0%) |
Real Estate & Mortgages in Polvadera
Real Estate and Mortgage Overview in Polvadera
| Characteristic | Without Mortgage | With Mortgage |
| Housing Units | 68 | 33 |
| Median Property Value | - | - |
| Median Household Income | - | - |
| Monthly Housing Costs | - | - |
| Real Estate Taxes | - | - |
Property Value by Mortgage Status in Polvadera
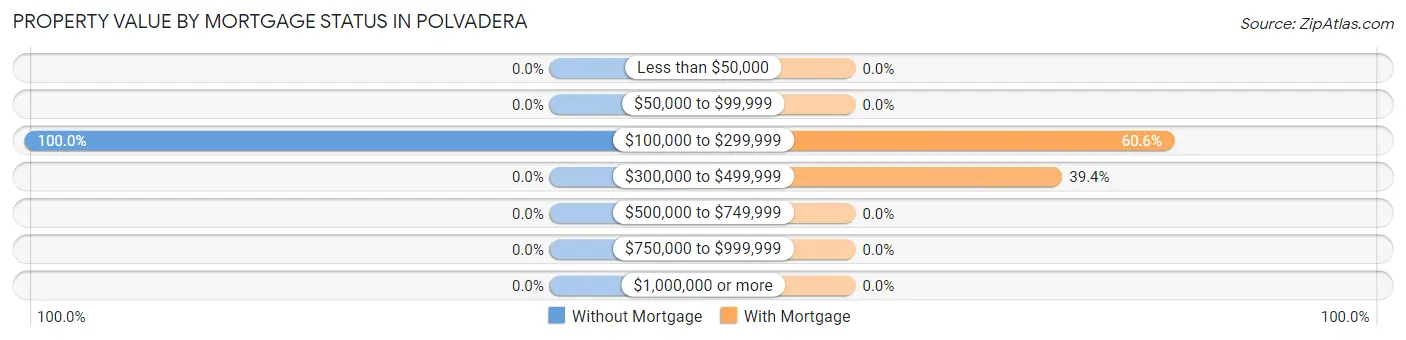
| Property Value | Without Mortgage | With Mortgage |
| Less than $50,000 | 0 (0.0%) | 0 (0.0%) |
| $50,000 to $99,999 | 0 (0.0%) | 0 (0.0%) |
| $100,000 to $299,999 | 68 (100.0%) | 20 (60.6%) |
| $300,000 to $499,999 | 0 (0.0%) | 13 (39.4%) |
| $500,000 to $749,999 | 0 (0.0%) | 0 (0.0%) |
| $750,000 to $999,999 | 0 (0.0%) | 0 (0.0%) |
| $1,000,000 or more | 0 (0.0%) | 0 (0.0%) |
| Total | 68 (100.0%) | 33 (100.0%) |
Household Income by Mortgage Status in Polvadera
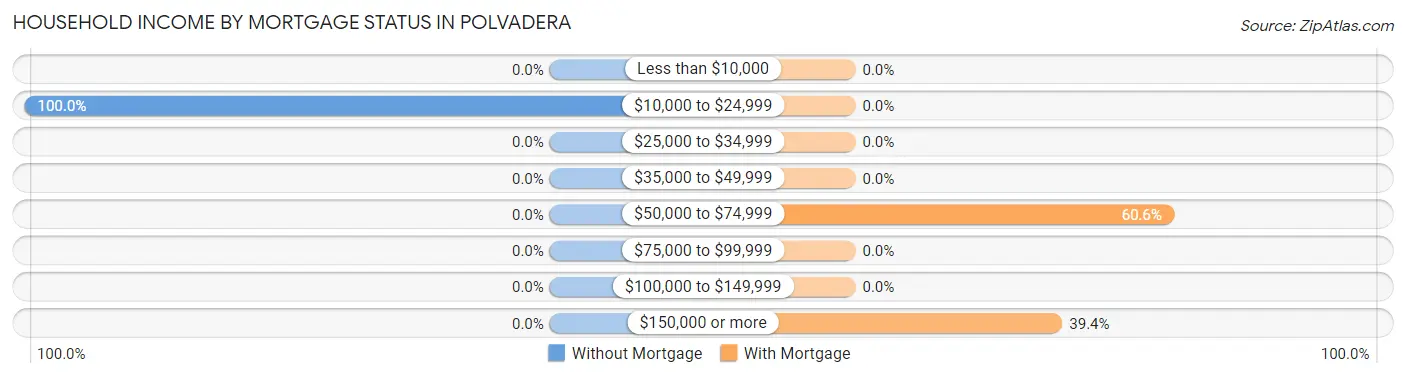
| Household Income | Without Mortgage | With Mortgage |
| Less than $10,000 | 0 (0.0%) | 0 (0.0%) |
| $10,000 to $24,999 | 68 (100.0%) | 0 (0.0%) |
| $25,000 to $34,999 | 0 (0.0%) | 0 (0.0%) |
| $35,000 to $49,999 | 0 (0.0%) | 0 (0.0%) |
| $50,000 to $74,999 | 0 (0.0%) | 20 (60.6%) |
| $75,000 to $99,999 | 0 (0.0%) | 0 (0.0%) |
| $100,000 to $149,999 | 0 (0.0%) | 0 (0.0%) |
| $150,000 or more | 0 (0.0%) | 13 (39.4%) |
| Total | 68 (100.0%) | 33 (100.0%) |
Property Value to Household Income Ratio in Polvadera

| Value-to-Income Ratio | Without Mortgage | With Mortgage |
| Less than 2.0x | 0 (0.0%) | 0 (0.0%) |
| 2.0x to 2.9x | 0 (0.0%) | 0 (0.0%) |
| 3.0x to 3.9x | 0 (0.0%) | 20 (60.6%) |
| 4.0x or more | 68 (100.0%) | 13 (39.4%) |
| Total | 68 (100.0%) | 33 (100.0%) |
Real Estate Taxes by Mortgage Status in Polvadera
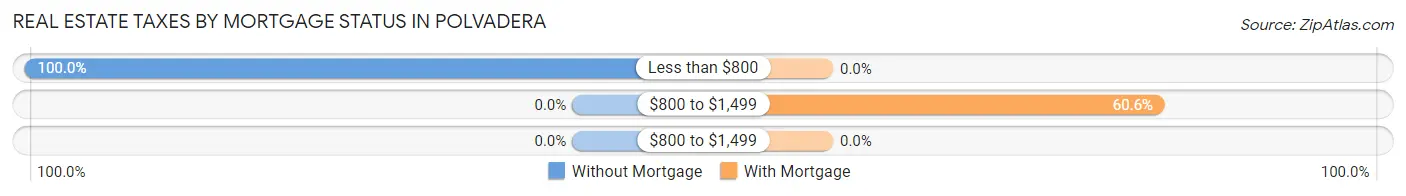
| Property Taxes | Without Mortgage | With Mortgage |
| Less than $800 | 68 (100.0%) | 0 (0.0%) |
| $800 to $1,499 | 0 (0.0%) | 20 (60.6%) |
| $800 to $1,499 | 0 (0.0%) | 0 (0.0%) |
| Total | 68 (100.0%) | 33 (100.0%) |
Health & Disability in Polvadera
Health Insurance Coverage by Age in Polvadera
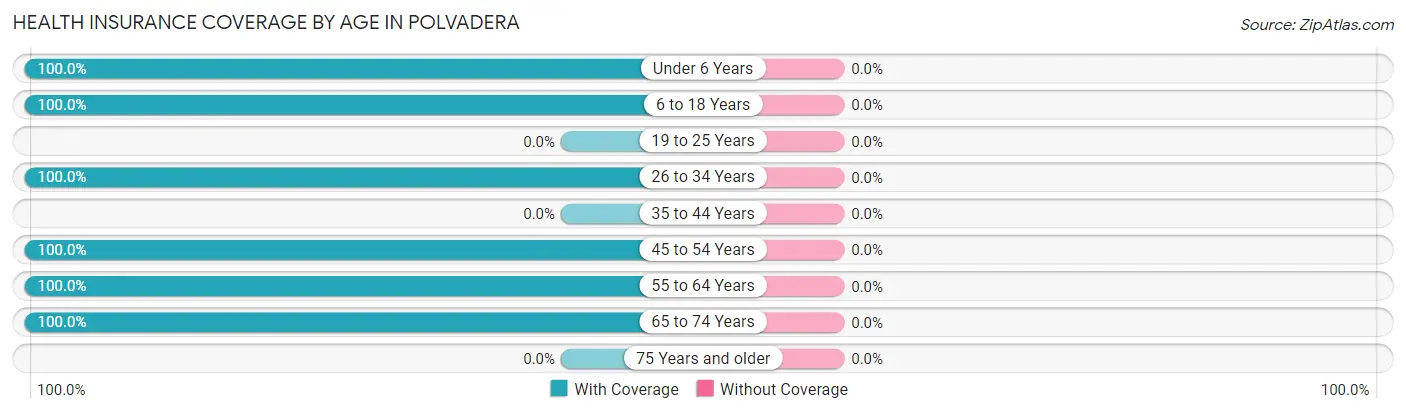
| Age Bracket | With Coverage | Without Coverage |
| Under 6 Years | 258 (100.0%) | 0 (0.0%) |
| 6 to 18 Years | 81 (100.0%) | 0 (0.0%) |
| 19 to 25 Years | 0 (0.0%) | 0 (0.0%) |
| 26 to 34 Years | 10 (100.0%) | 0 (0.0%) |
| 35 to 44 Years | 0 (0.0%) | 0 (0.0%) |
| 45 to 54 Years | 115 (100.0%) | 0 (0.0%) |
| 55 to 64 Years | 89 (100.0%) | 0 (0.0%) |
| 65 to 74 Years | 20 (100.0%) | 0 (0.0%) |
| 75 Years and older | 0 (0.0%) | 0 (0.0%) |
| Total | 573 (100.0%) | 0 (0.0%) |
Health Insurance Coverage by Citizenship Status in Polvadera

| Citizenship Status | With Coverage | Without Coverage |
| Native Born | 258 (100.0%) | 0 (0.0%) |
| Foreign Born, Citizen | 81 (100.0%) | 0 (0.0%) |
| Foreign Born, not a Citizen | 0 (0.0%) | 0 (0.0%) |
Health Insurance Coverage by Household Income in Polvadera

| Household Income | With Coverage | Without Coverage |
| Under $25,000 | 532 (100.0%) | 0 (0.0%) |
| $25,000 to $49,999 | 20 (100.0%) | 0 (0.0%) |
| $50,000 to $74,999 | 0 (0.0%) | 0 (0.0%) |
| $75,000 to $99,999 | 0 (0.0%) | 0 (0.0%) |
| $100,000 and over | 21 (100.0%) | 0 (0.0%) |
Public vs Private Health Insurance Coverage by Age in Polvadera
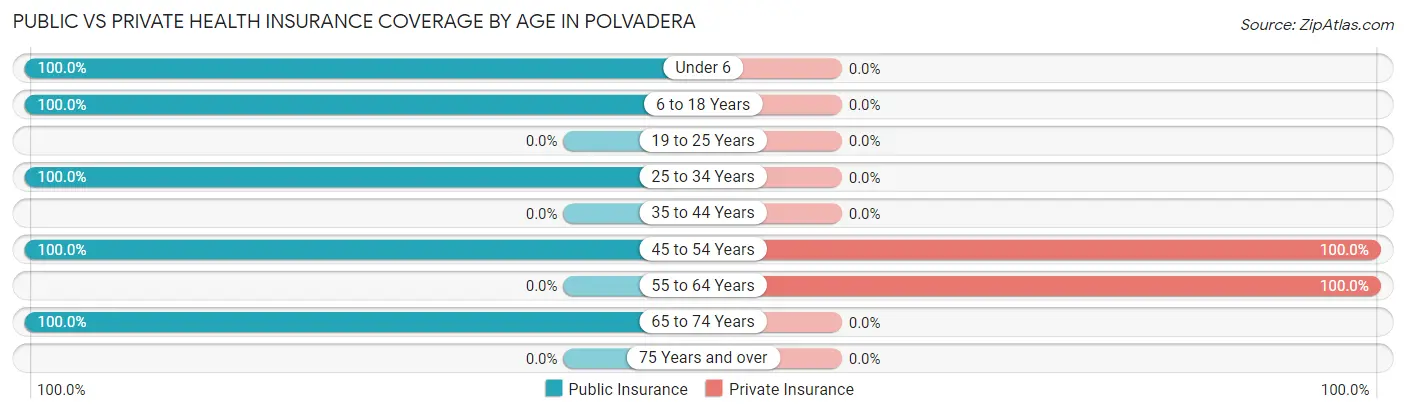
| Age Bracket | Public Insurance | Private Insurance |
| Under 6 | 258 (100.0%) | 0 (0.0%) |
| 6 to 18 Years | 81 (100.0%) | 0 (0.0%) |
| 19 to 25 Years | 0 (0.0%) | 0 (0.0%) |
| 25 to 34 Years | 10 (100.0%) | 0 (0.0%) |
| 35 to 44 Years | 0 (0.0%) | 0 (0.0%) |
| 45 to 54 Years | 115 (100.0%) | 115 (100.0%) |
| 55 to 64 Years | 0 (0.0%) | 89 (100.0%) |
| 65 to 74 Years | 20 (100.0%) | 0 (0.0%) |
| 75 Years and over | 0 (0.0%) | 0 (0.0%) |
| Total | 484 (84.5%) | 204 (35.6%) |
Disability Status by Sex by Age in Polvadera
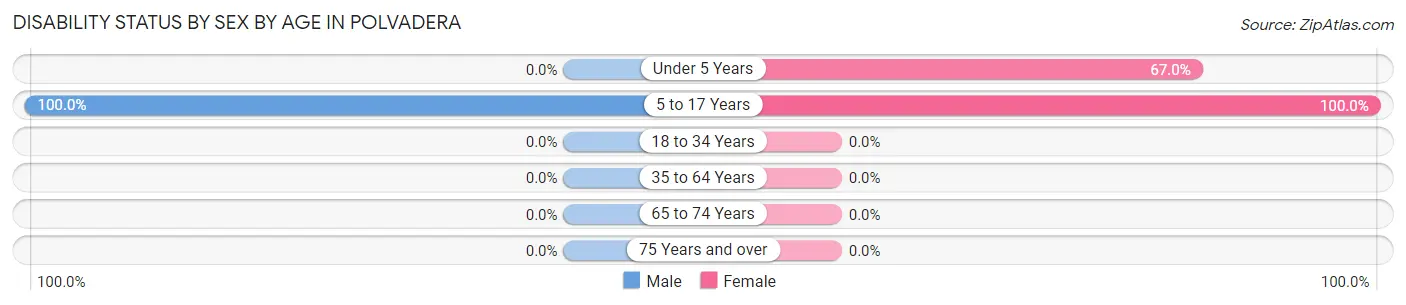
| Age Bracket | Male | Female |
| Under 5 Years | 0 (0.0%) | 79 (66.9%) |
| 5 to 17 Years | 133 (100.0%) | 52 (100.0%) |
| 18 to 34 Years | 0 (0.0%) | 0 (0.0%) |
| 35 to 64 Years | 0 (0.0%) | 0 (0.0%) |
| 65 to 74 Years | 0 (0.0%) | 0 (0.0%) |
| 75 Years and over | 0 (0.0%) | 0 (0.0%) |
Disability Class by Sex by Age in Polvadera
Disability Class: Hearing Difficulty
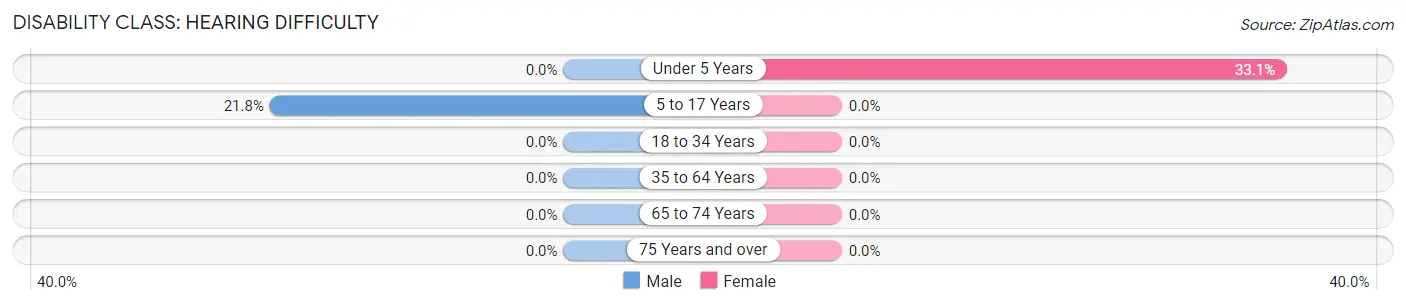
| Age Bracket | Male | Female |
| Under 5 Years | 0 (0.0%) | 39 (33.1%) |
| 5 to 17 Years | 29 (21.8%) | 0 (0.0%) |
| 18 to 34 Years | 0 (0.0%) | 0 (0.0%) |
| 35 to 64 Years | 0 (0.0%) | 0 (0.0%) |
| 65 to 74 Years | 0 (0.0%) | 0 (0.0%) |
| 75 Years and over | 0 (0.0%) | 0 (0.0%) |
Disability Class: Vision Difficulty
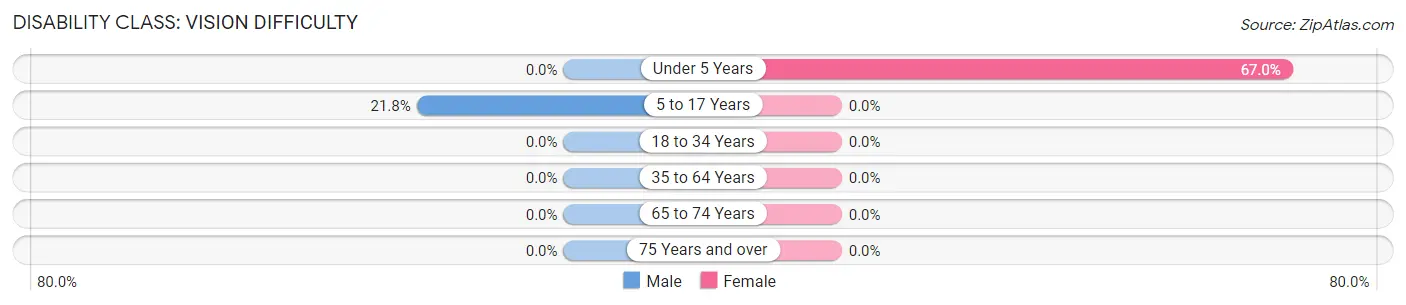
| Age Bracket | Male | Female |
| Under 5 Years | 0 (0.0%) | 79 (66.9%) |
| 5 to 17 Years | 29 (21.8%) | 0 (0.0%) |
| 18 to 34 Years | 0 (0.0%) | 0 (0.0%) |
| 35 to 64 Years | 0 (0.0%) | 0 (0.0%) |
| 65 to 74 Years | 0 (0.0%) | 0 (0.0%) |
| 75 Years and over | 0 (0.0%) | 0 (0.0%) |
Disability Class: Cognitive Difficulty

| Age Bracket | Male | Female |
| 5 to 17 Years | 133 (100.0%) | 52 (100.0%) |
| 18 to 34 Years | 0 (0.0%) | 0 (0.0%) |
| 35 to 64 Years | 0 (0.0%) | 0 (0.0%) |
| 65 to 74 Years | 0 (0.0%) | 0 (0.0%) |
| 75 Years and over | 0 (0.0%) | 0 (0.0%) |
Disability Class: Ambulatory Difficulty
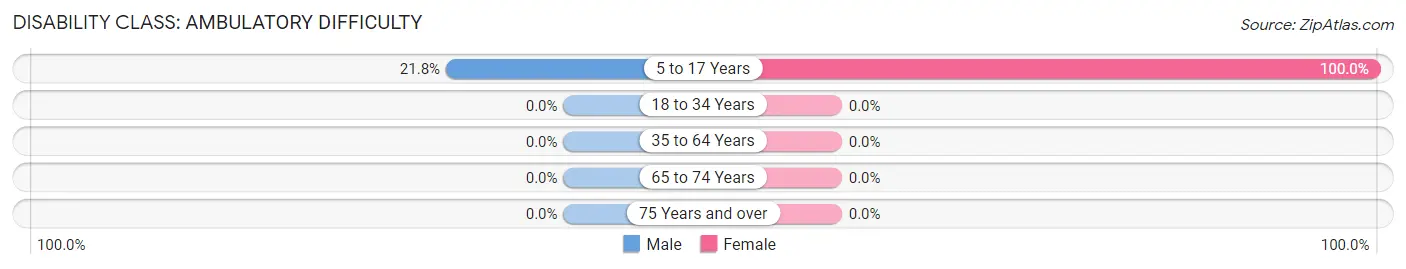
| Age Bracket | Male | Female |
| 5 to 17 Years | 29 (21.8%) | 52 (100.0%) |
| 18 to 34 Years | 0 (0.0%) | 0 (0.0%) |
| 35 to 64 Years | 0 (0.0%) | 0 (0.0%) |
| 65 to 74 Years | 0 (0.0%) | 0 (0.0%) |
| 75 Years and over | 0 (0.0%) | 0 (0.0%) |
Disability Class: Self-Care Difficulty

| Age Bracket | Male | Female |
| 5 to 17 Years | 29 (21.8%) | 52 (100.0%) |
| 18 to 34 Years | 0 (0.0%) | 0 (0.0%) |
| 35 to 64 Years | 0 (0.0%) | 0 (0.0%) |
| 65 to 74 Years | 0 (0.0%) | 0 (0.0%) |
| 75 Years and over | 0 (0.0%) | 0 (0.0%) |
Technology Access in Polvadera
Computing Device Access in Polvadera
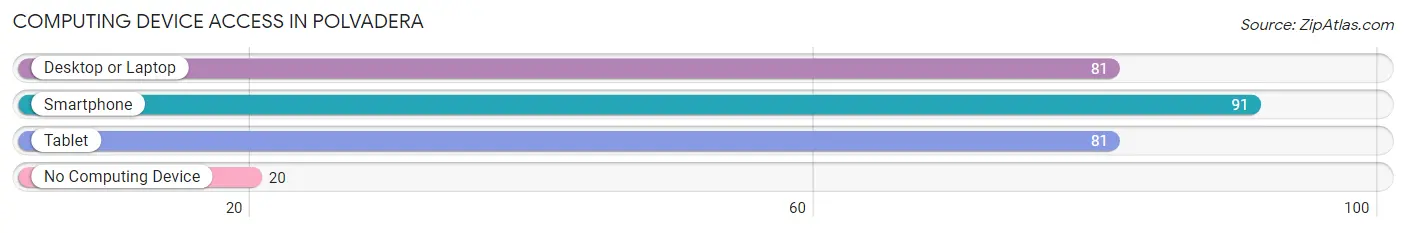
| Device Type | # Households | % Households |
| Desktop or Laptop | 81 | 73.0% |
| Smartphone | 91 | 82.0% |
| Tablet | 81 | 73.0% |
| No Computing Device | 20 | 18.0% |
| Total | 111 | 100.0% |
Internet Access in Polvadera
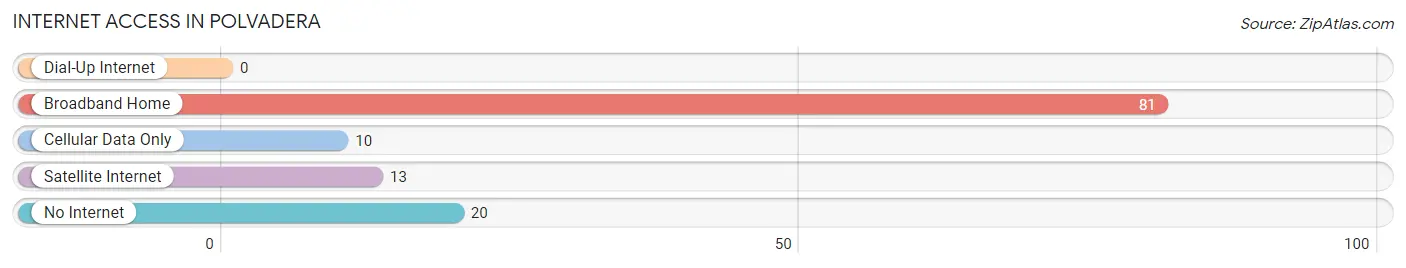
| Internet Type | # Households | % Households |
| Dial-Up Internet | 0 | 0.0% |
| Broadband Home | 81 | 73.0% |
| Cellular Data Only | 10 | 9.0% |
| Satellite Internet | 13 | 11.7% |
| No Internet | 20 | 18.0% |
| Total | 111 | 100.0% |
Polvadera Summary
Polvadera, New Mexico is a small unincorporated community located in Socorro County, New Mexico. It is situated in the Rio Grande Valley, approximately 25 miles south of Socorro and 40 miles north of Las Cruces. The population of Polvadera was estimated to be around 1,000 in 2020.
History
Polvadera was founded in the late 1800s by a group of Mexican settlers who were looking for a place to settle and farm. The name Polvadera is derived from the Spanish word for “dusty”, which is fitting given the arid climate of the area. The settlers were attracted to the area due to its fertile soil and access to the Rio Grande River.
The first settlers of Polvadera were mostly farmers and ranchers, and the community quickly grew. By the early 1900s, the town had a post office, a school, a church, and a few stores. The town was also home to a number of small businesses, including a blacksmith, a barber, and a general store.
In the mid-1900s, the population of Polvadera began to decline as many of the residents moved away in search of better economic opportunities. The town was also affected by the Great Depression, which caused many of the businesses to close.
Geography
Polvadera is located in the Rio Grande Valley, which is a large valley that stretches from El Paso, Texas to Albuquerque, New Mexico. The valley is bordered by the Rio Grande River to the east and the Chihuahuan Desert to the west. The area is characterized by its arid climate and sparse vegetation.
The town of Polvadera is situated on the western edge of the valley, near the Rio Grande River. The town is surrounded by farmland and is located approximately 25 miles south of Socorro and 40 miles north of Las Cruces.
Economy
The economy of Polvadera is largely based on agriculture. The town is home to several farms and ranches, which produce a variety of crops, including alfalfa, cotton, and corn. The town is also home to a number of small businesses, including a grocery store, a gas station, and a few restaurants.
The town is also home to a number of manufacturing companies, which produce a variety of products, including furniture, clothing, and electronics. The town is also home to a number of service-based businesses, including auto repair shops, beauty salons, and a few medical clinics.
Demographics
The population of Polvadera was estimated to be around 1,000 in 2020. The town is predominantly Hispanic, with the majority of the population being of Mexican descent. The town is also home to a small number of Native American and African American residents.
The town is served by the Socorro County School District, which operates a number of elementary and middle schools in the area. The town is also home to a number of churches, including the Church of Jesus Christ of Latter-day Saints, the Catholic Church, and the United Methodist Church.
Conclusion
Polvadera, New Mexico is a small unincorporated community located in Socorro County, New Mexico. It is situated in the Rio Grande Valley, approximately 25 miles south of Socorro and 40 miles north of Las Cruces. The population of Polvadera was estimated to be around 1,000 in 2020. The town is predominantly Hispanic, with the majority of the population being of Mexican descent. The economy of Polvadera is largely based on agriculture, with the town being home to several farms and ranches. The town is also home to a number of small businesses, including a grocery store, a gas station, and a few restaurants. The town is served by the Socorro County School District, which operates a number of elementary and middle schools in the area.
Common Questions
What is Per Capita Income in Polvadera?
Per Capita income in Polvadera is $7,342.
What is Inequality or Gini Index in Polvadera?
Inequality or Gini Index in Polvadera is 0.39.
What is the Total Population of Polvadera?
Total Population of Polvadera is 573.
What is the Total Male Population of Polvadera?
Total Male Population of Polvadera is 260.
What is the Total Female Population of Polvadera?
Total Female Population of Polvadera is 313.
What is the Ratio of Males per 100 Females in Polvadera?
There are 83.07 Males per 100 Females in Polvadera.
What is the Ratio of Females per 100 Males in Polvadera?
There are 120.38 Females per 100 Males in Polvadera.
What is the Median Population Age in Polvadera?
Median Population Age in Polvadera is 8.0 Years.
What is the Average Family Size in Polvadera
Average Family Size in Polvadera is 5.3 People.
What is the Average Household Size in Polvadera
Average Household Size in Polvadera is 5.2 People.
How Large is the Labor Force in Polvadera?
There are 99 People in the Labor Forcein in Polvadera.
What is the Percentage of People in the Labor Force in Polvadera?
42.3% of People are in the Labor Force in Polvadera.
What is the Unemployment Rate in Polvadera?
Unemployment Rate in Polvadera is 10.1%.