Fort Totten, ND Map & Demographics
Fort Totten Map
Fort Totten Overview
$8,232
PER CAPITA INCOME
$27,500
AVG FAMILY INCOME
$30,234
AVG HOUSEHOLD INCOME
0.54
INEQUALITY / GINI INDEX
1,042
TOTAL POPULATION
472
MALE POPULATION
570
FEMALE POPULATION
82.81
MALES / 100 FEMALES
120.76
FEMALES / 100 MALES
14.1
MEDIAN AGE
7.6
AVG FAMILY SIZE
7.1
AVG HOUSEHOLD SIZE
162
LABOR FORCE [ PEOPLE ]
35.2%
PERCENT IN LABOR FORCE
6.2%
UNEMPLOYMENT RATE
Fort Totten Zip Codes
Fort Totten Area Codes
Income in Fort Totten
Income Overview in Fort Totten
Per Capita Income in Fort Totten is $8,232, while median incomes of families and households are $27,500 and $30,234 respectively.
| Characteristic | Number | Measure |
| Per Capita Income | 1,042 | $8,232 |
| Median Family Income | 130 | $27,500 |
| Mean Family Income | 130 | $48,736 |
| Median Household Income | 145 | $30,234 |
| Mean Household Income | 145 | $46,386 |
| Income Deficit | 130 | $0 |
| Wage / Income Gap (%) | 1,042 | 0.00% |
| Wage / Income Gap ($) | 1,042 | 100.00¢ per $1 |
| Gini / Inequality Index | 1,042 | 0.54 |
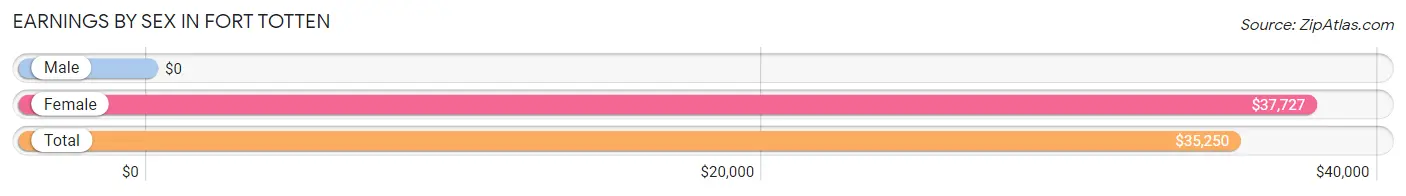
Earnings by Sex in Fort Totten
| Sex | Number | Average Earnings |
| Male | 79 (44.6%) | $0 |
| Female | 98 (55.4%) | $37,727 |
| Total | 177 (100.0%) | $35,250 |
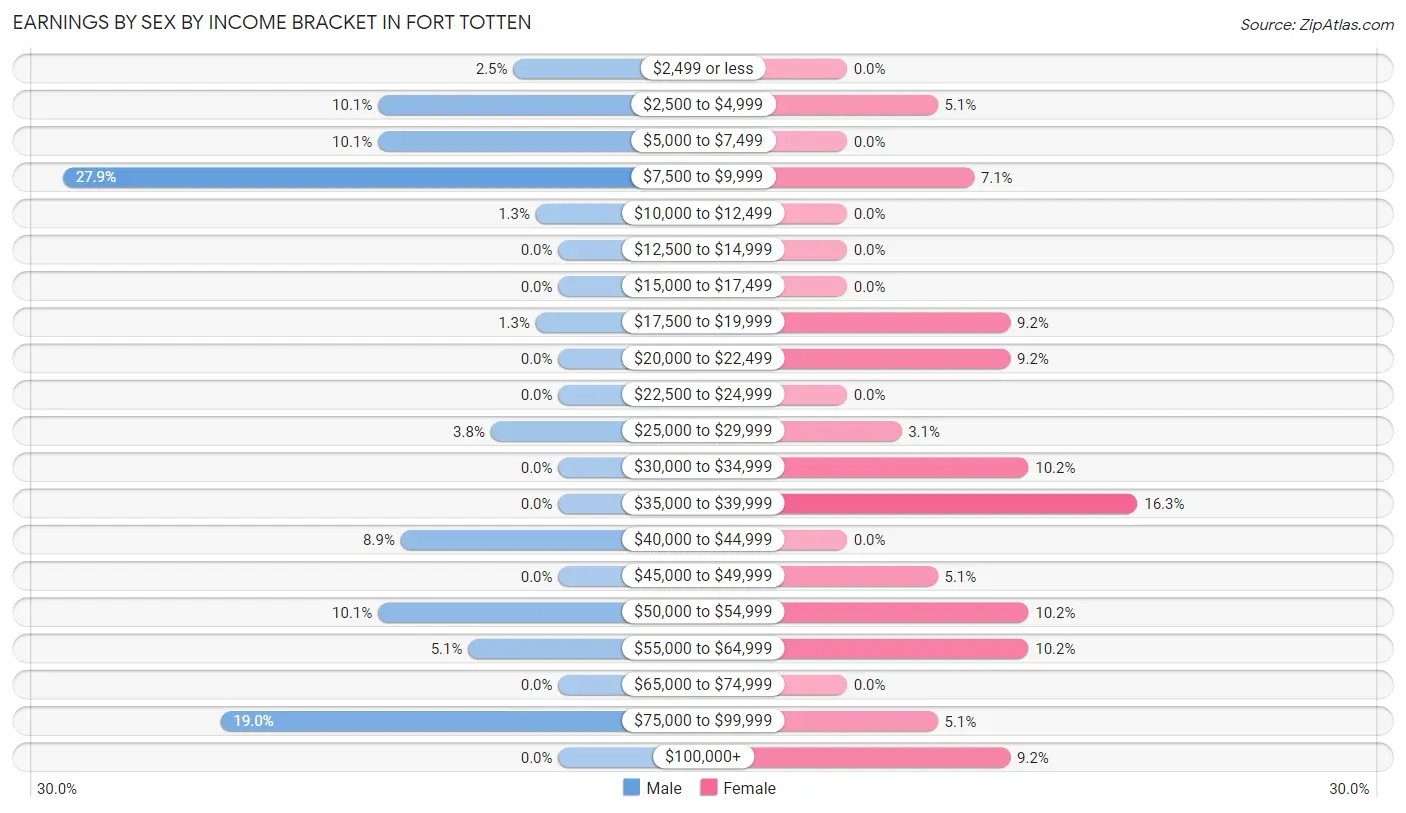
Earnings by Sex by Income Bracket in Fort Totten
The most common earnings brackets in Fort Totten are $7,500 to $9,999 for men (22 | 27.9%) and $35,000 to $39,999 for women (16 | 16.3%).
| Income | Male | Female |
| $2,499 or less | 2 (2.5%) | 0 (0.0%) |
| $2,500 to $4,999 | 8 (10.1%) | 5 (5.1%) |
| $5,000 to $7,499 | 8 (10.1%) | 0 (0.0%) |
| $7,500 to $9,999 | 22 (27.9%) | 7 (7.1%) |
| $10,000 to $12,499 | 1 (1.3%) | 0 (0.0%) |
| $12,500 to $14,999 | 0 (0.0%) | 0 (0.0%) |
| $15,000 to $17,499 | 0 (0.0%) | 0 (0.0%) |
| $17,500 to $19,999 | 1 (1.3%) | 9 (9.2%) |
| $20,000 to $22,499 | 0 (0.0%) | 9 (9.2%) |
| $22,500 to $24,999 | 0 (0.0%) | 0 (0.0%) |
| $25,000 to $29,999 | 3 (3.8%) | 3 (3.1%) |
| $30,000 to $34,999 | 0 (0.0%) | 10 (10.2%) |
| $35,000 to $39,999 | 0 (0.0%) | 16 (16.3%) |
| $40,000 to $44,999 | 7 (8.9%) | 0 (0.0%) |
| $45,000 to $49,999 | 0 (0.0%) | 5 (5.1%) |
| $50,000 to $54,999 | 8 (10.1%) | 10 (10.2%) |
| $55,000 to $64,999 | 4 (5.1%) | 10 (10.2%) |
| $65,000 to $74,999 | 0 (0.0%) | 0 (0.0%) |
| $75,000 to $99,999 | 15 (19.0%) | 5 (5.1%) |
| $100,000+ | 0 (0.0%) | 9 (9.2%) |
| Total | 79 (100.0%) | 98 (100.0%) |
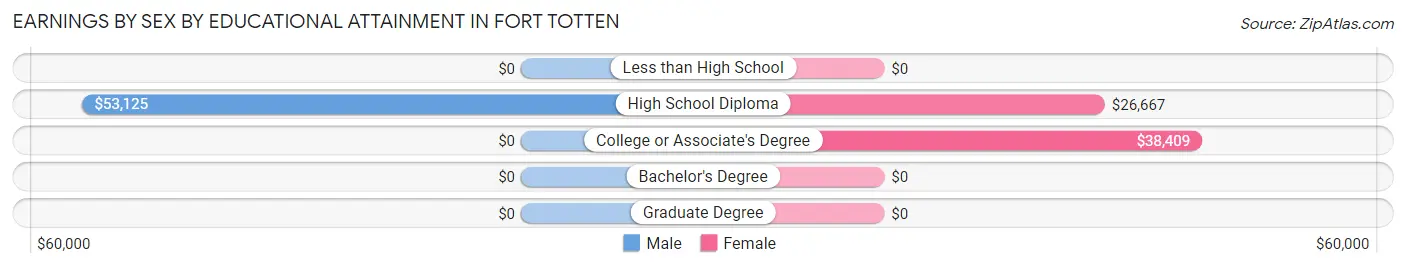
Earnings by Sex by Educational Attainment in Fort Totten
Average earnings in Fort Totten are $44,643 for men and $39,318 for women, a difference of 11.9%. Men with an educational attainment of high school diploma enjoy the highest average annual earnings of $53,125, while those with high school diploma education earn the least with $53,125. Women with an educational attainment of college or associate's degree earn the most with the average annual earnings of $38,409, while those with high school diploma education have the smallest earnings of $26,667.
| Educational Attainment | Male Income | Female Income |
| Less than High School | - | - |
| High School Diploma | $53,125 | $26,667 |
| College or Associate's Degree | - | - |
| Bachelor's Degree | - | - |
| Graduate Degree | - | - |
| Total | $44,643 | $39,318 |
Family Income in Fort Totten
Family Income Brackets in Fort Totten
According to the Fort Totten family income data, there are 33 families falling into the less than $10,000 income range, which is the most common income bracket and makes up 25.4% of all families.
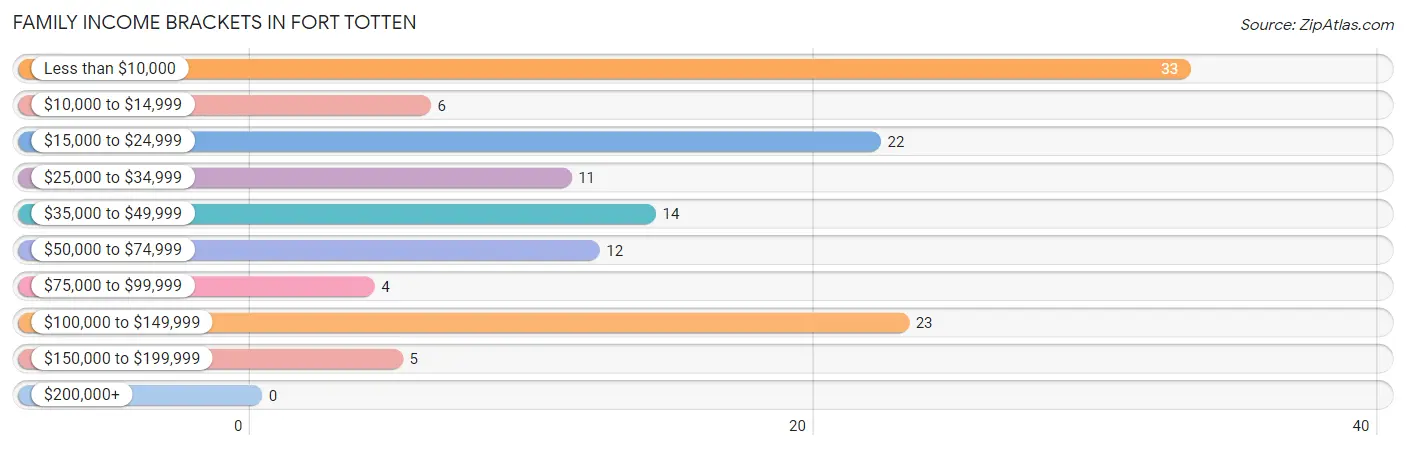
| Income Bracket | # Families | % Families |
| Less than $10,000 | 33 | 25.4% |
| $10,000 to $14,999 | 6 | 4.6% |
| $15,000 to $24,999 | 22 | 16.9% |
| $25,000 to $34,999 | 11 | 8.5% |
| $35,000 to $49,999 | 14 | 10.8% |
| $50,000 to $74,999 | 12 | 9.2% |
| $75,000 to $99,999 | 4 | 3.1% |
| $100,000 to $149,999 | 23 | 17.7% |
| $150,000 to $199,999 | 5 | 3.8% |
| $200,000+ | 0 | 0.0% |
Family Income by Famaliy Size in Fort Totten
2-person families (12 | 9.2%) account for the highest median family income in Fort Totten with $19,375 per family, while 2-person families (12 | 9.2%) have the highest median income of $9,688 per family member.
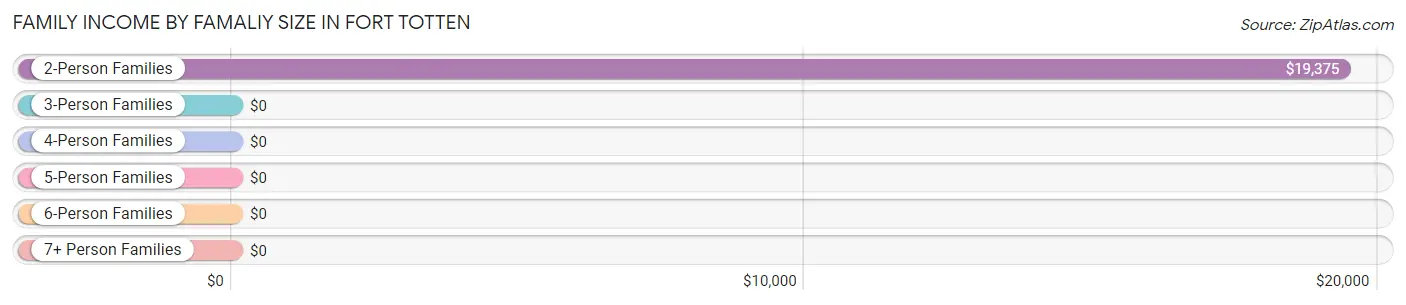
| Income Bracket | # Families | Median Income |
| 2-Person Families | 12 (9.2%) | $19,375 |
| 3-Person Families | 21 (16.2%) | $0 |
| 4-Person Families | 26 (20.0%) | $0 |
| 5-Person Families | 29 (22.3%) | $0 |
| 6-Person Families | 21 (16.2%) | $0 |
| 7+ Person Families | 21 (16.2%) | $0 |
| Total | 130 (100.0%) | $27,500 |
Family Income by Number of Earners in Fort Totten
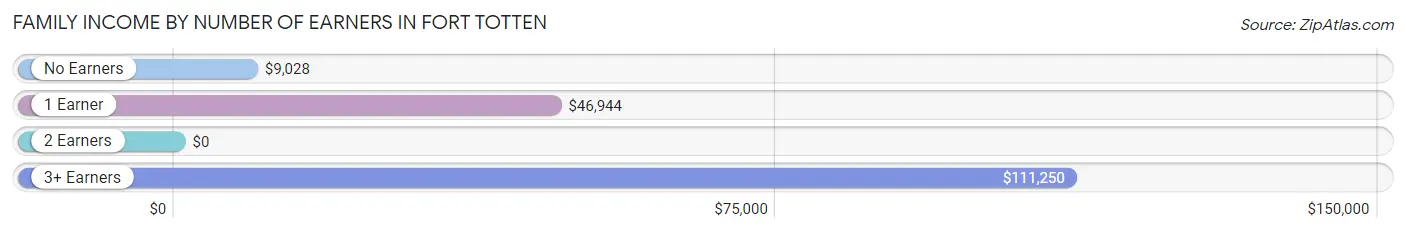
| Number of Earners | # Families | Median Income |
| No Earners | 49 (37.7%) | $9,028 |
| 1 Earner | 46 (35.4%) | $46,944 |
| 2 Earners | 20 (15.4%) | $0 |
| 3+ Earners | 15 (11.5%) | $111,250 |
| Total | 130 (100.0%) | $27,500 |
Household Income in Fort Totten
Household Income Brackets in Fort Totten
With 36 households falling in the category, the less than $10,000 income range is the most frequent in Fort Totten, accounting for 24.8% of all households.
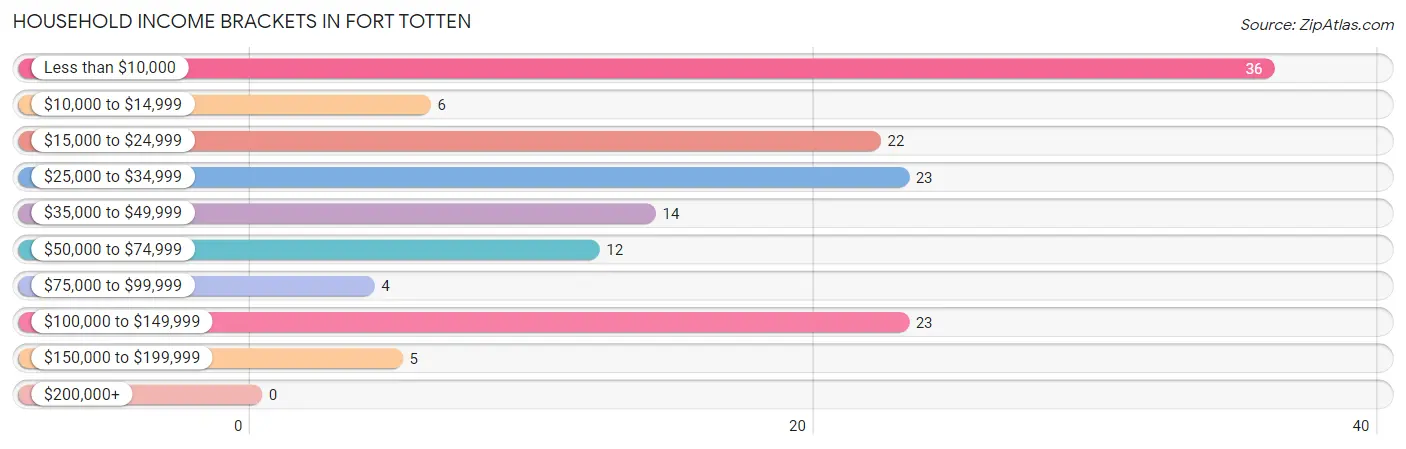
| Income Bracket | # Households | % Households |
| Less than $10,000 | 36 | 24.8% |
| $10,000 to $14,999 | 6 | 4.1% |
| $15,000 to $24,999 | 22 | 15.2% |
| $25,000 to $34,999 | 23 | 15.9% |
| $35,000 to $49,999 | 14 | 9.7% |
| $50,000 to $74,999 | 12 | 8.3% |
| $75,000 to $99,999 | 4 | 2.8% |
| $100,000 to $149,999 | 23 | 15.9% |
| $150,000 to $199,999 | 5 | 3.4% |
| $200,000+ | 0 | 0.0% |
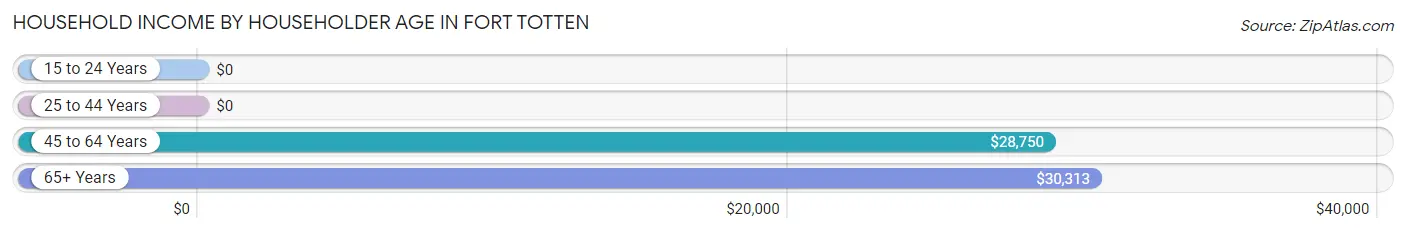
Household Income by Householder Age in Fort Totten
The median household income in Fort Totten is $30,234, with the highest median household income of $30,313 found in the 65+ years age bracket for the primary householder. A total of 29 households (20.0%) fall into this category. Meanwhile, the 15 to 24 years age bracket for the primary householder has the lowest median household income of $0, with 4 households (2.8%) in this group.
| Income Bracket | # Households | Median Income |
| 15 to 24 Years | 4 (2.8%) | $0 |
| 25 to 44 Years | 47 (32.4%) | $0 |
| 45 to 64 Years | 65 (44.8%) | $28,750 |
| 65+ Years | 29 (20.0%) | $30,313 |
| Total | 145 (100.0%) | $30,234 |
Poverty in Fort Totten
Income Below Poverty by Sex and Age in Fort Totten
With 48.3% poverty level for males and 36.2% for females among the residents of Fort Totten, 5 year old males and 15 year old females are the most vulnerable to poverty, with 11 males (100.0%) and 14 females (100.0%) in their respective age groups living below the poverty level.
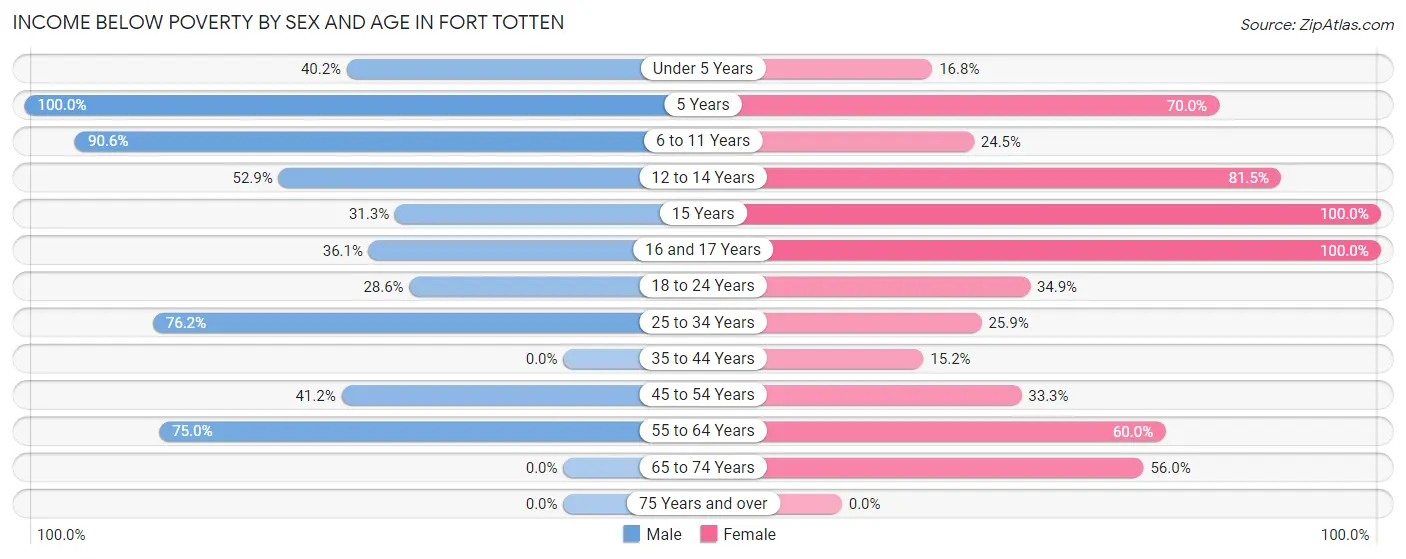
| Age Bracket | Male | Female |
| Under 5 Years | 47 (40.2%) | 22 (16.8%) |
| 5 Years | 11 (100.0%) | 14 (70.0%) |
| 6 to 11 Years | 58 (90.6%) | 25 (24.5%) |
| 12 to 14 Years | 37 (52.9%) | 22 (81.5%) |
| 15 Years | 5 (31.2%) | 14 (100.0%) |
| 16 and 17 Years | 13 (36.1%) | 20 (100.0%) |
| 18 to 24 Years | 12 (28.6%) | 22 (34.9%) |
| 25 to 34 Years | 16 (76.2%) | 7 (25.9%) |
| 35 to 44 Years | 0 (0.0%) | 5 (15.1%) |
| 45 to 54 Years | 14 (41.2%) | 23 (33.3%) |
| 55 to 64 Years | 9 (75.0%) | 15 (60.0%) |
| 65 to 74 Years | 0 (0.0%) | 14 (56.0%) |
| 75 Years and over | 0 (0.0%) | 0 (0.0%) |
| Total | 222 (48.3%) | 203 (36.2%) |
Income Above Poverty by Sex and Age in Fort Totten
According to the poverty statistics in Fort Totten, males aged 35 to 44 years and females aged 75 years and over are the age groups that are most secure financially, with 100.0% of males and 100.0% of females in these age groups living above the poverty line.
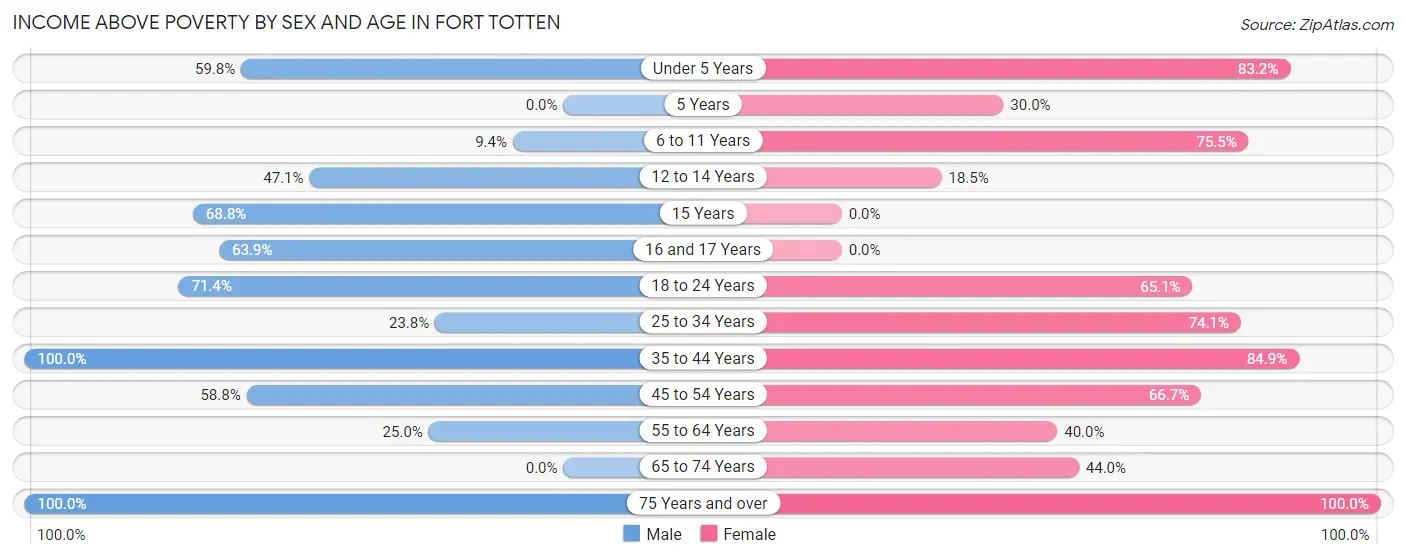
| Age Bracket | Male | Female |
| Under 5 Years | 70 (59.8%) | 109 (83.2%) |
| 5 Years | 0 (0.0%) | 6 (30.0%) |
| 6 to 11 Years | 6 (9.4%) | 77 (75.5%) |
| 12 to 14 Years | 33 (47.1%) | 5 (18.5%) |
| 15 Years | 11 (68.8%) | 0 (0.0%) |
| 16 and 17 Years | 23 (63.9%) | 0 (0.0%) |
| 18 to 24 Years | 30 (71.4%) | 41 (65.1%) |
| 25 to 34 Years | 5 (23.8%) | 20 (74.1%) |
| 35 to 44 Years | 32 (100.0%) | 28 (84.9%) |
| 45 to 54 Years | 20 (58.8%) | 46 (66.7%) |
| 55 to 64 Years | 3 (25.0%) | 10 (40.0%) |
| 65 to 74 Years | 0 (0.0%) | 11 (44.0%) |
| 75 Years and over | 5 (100.0%) | 4 (100.0%) |
| Total | 238 (51.7%) | 357 (63.7%) |
Income Below Poverty Among Married-Couple Families in Fort Totten
The poverty statistics for married-couple families in Fort Totten show that 44.0% or 11 of the total 25 families live below the poverty line. Families with 1 or 2 children have the highest poverty rate of 55.0%, comprising of 11 families. On the other hand, families with 3 or 4 children have the lowest poverty rate of 0.0%, which includes 0 families.
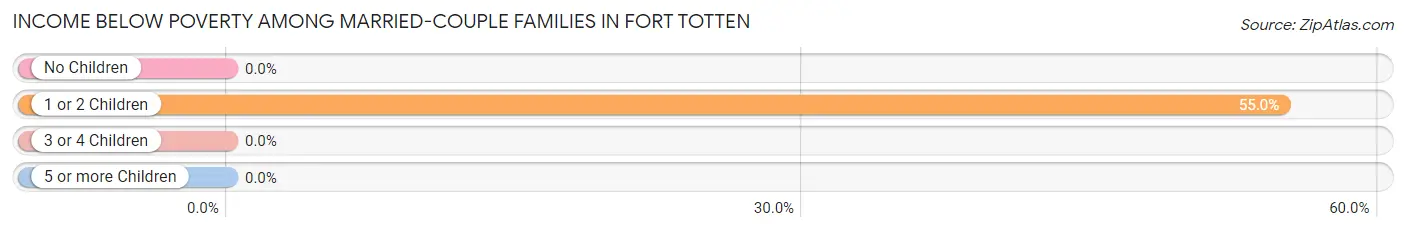
| Children | Above Poverty | Below Poverty |
| No Children | 0 (0.0%) | 0 (0.0%) |
| 1 or 2 Children | 9 (45.0%) | 11 (55.0%) |
| 3 or 4 Children | 5 (100.0%) | 0 (0.0%) |
| 5 or more Children | 0 (0.0%) | 0 (0.0%) |
| Total | 14 (56.0%) | 11 (44.0%) |
Income Below Poverty Among Single-Parent Households in Fort Totten
According to the poverty data in Fort Totten, 76.5% or 13 single-father households and 50.0% or 44 single-mother households are living below the poverty line. Among single-father households, those with 1 or 2 children have the highest poverty rate, with 7 households (100.0%) experiencing poverty. Likewise, among single-mother households, those with 3 or 4 children have the highest poverty rate, with 18 households (85.7%) falling below the poverty line.
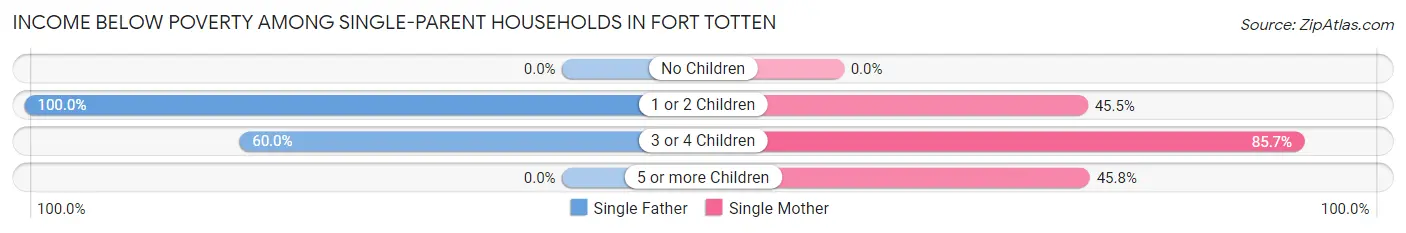
| Children | Single Father | Single Mother |
| No Children | 0 (0.0%) | 0 (0.0%) |
| 1 or 2 Children | 7 (100.0%) | 15 (45.5%) |
| 3 or 4 Children | 6 (60.0%) | 18 (85.7%) |
| 5 or more Children | 0 (0.0%) | 11 (45.8%) |
| Total | 13 (76.5%) | 44 (50.0%) |
Income Below Poverty Among Married-Couple vs Single-Parent Households in Fort Totten
The poverty data for Fort Totten shows that 11 of the married-couple family households (44.0%) and 57 of the single-parent households (54.3%) are living below the poverty level. Within the married-couple family households, those with 1 or 2 children have the highest poverty rate, with 11 households (55.0%) falling below the poverty line. Among the single-parent households, those with 3 or 4 children have the highest poverty rate, with 24 household (77.4%) living below poverty.
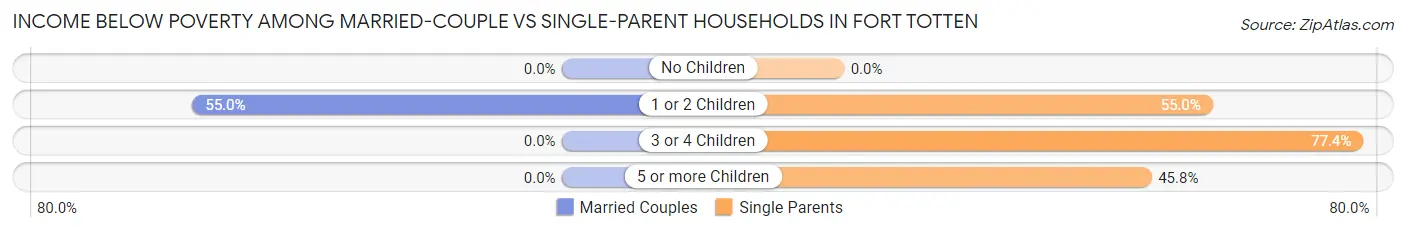
| Children | Married-Couple Families | Single-Parent Households |
| No Children | 0 (0.0%) | 0 (0.0%) |
| 1 or 2 Children | 11 (55.0%) | 22 (55.0%) |
| 3 or 4 Children | 0 (0.0%) | 24 (77.4%) |
| 5 or more Children | 0 (0.0%) | 11 (45.8%) |
| Total | 11 (44.0%) | 57 (54.3%) |
Race in Fort Totten
The most populous races in Fort Totten are Native / Alaskan (1,002 | 96.2%), White / Caucasian (24 | 2.3%), and Two or more Races (14 | 1.3%).
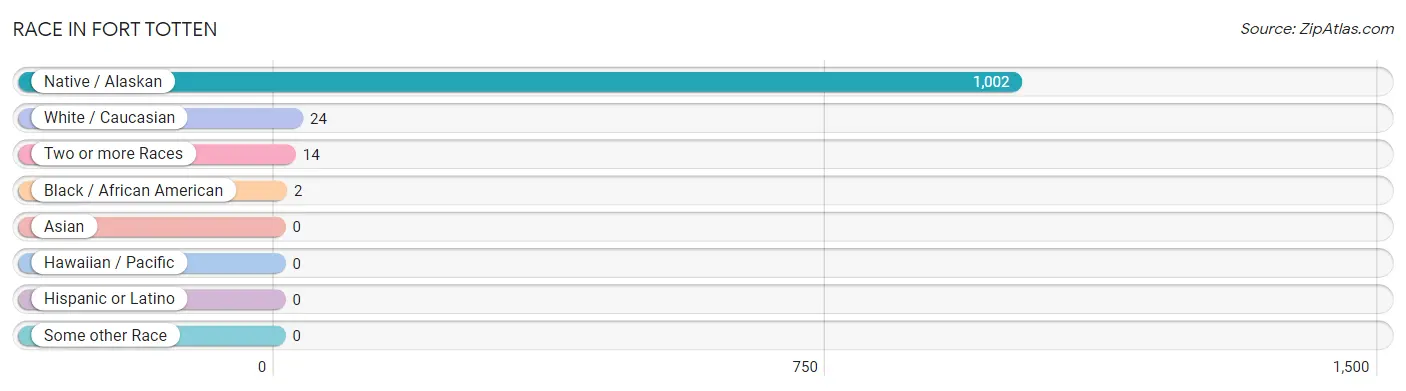
| Race | # Population | % Population |
| Asian | 0 | 0.0% |
| Black / African American | 2 | 0.2% |
| Hawaiian / Pacific | 0 | 0.0% |
| Hispanic or Latino | 0 | 0.0% |
| Native / Alaskan | 1,002 | 96.2% |
| White / Caucasian | 24 | 2.3% |
| Two or more Races | 14 | 1.3% |
| Some other Race | 0 | 0.0% |
| Total | 1,042 | 100.0% |
Ancestry in Fort Totten
The most populous ancestries reported in Fort Totten are Sioux (1,009 | 96.8%), Norwegian (16 | 1.5%), Irish (5 | 0.5%), American (2 | 0.2%), and Dutch (1 | 0.1%), together accounting for 99.1% of all Fort Totten residents.
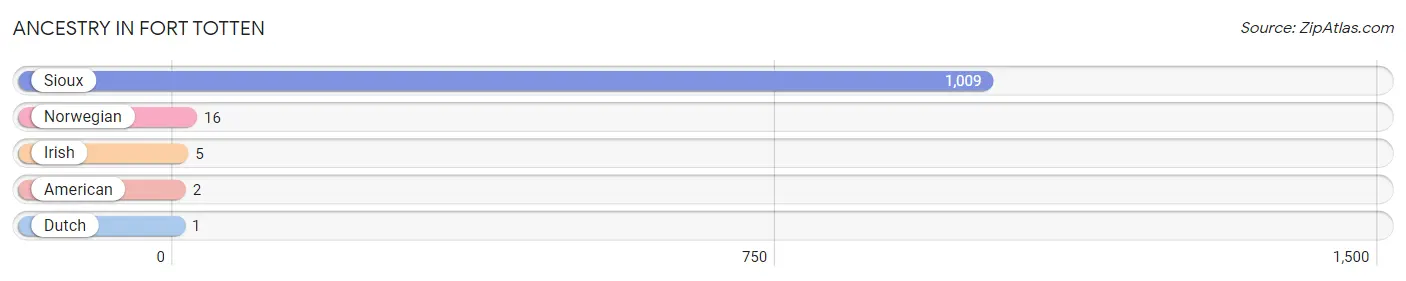
| Ancestry | # Population | % Population |
| American | 2 | 0.2% |
| Dutch | 1 | 0.1% |
| Irish | 5 | 0.5% |
| Norwegian | 16 | 1.5% |
| Sioux | 1,009 | 96.8% | View All 5 Rows |
Immigrants in Fort Totten

| Immigration Origin | # Population | % Population | View All 0 Rows |
Sex and Age in Fort Totten
Sex and Age in Fort Totten
The most populous age groups in Fort Totten are Under 5 Years (117 | 24.8%) for men and Under 5 Years (131 | 23.0%) for women.
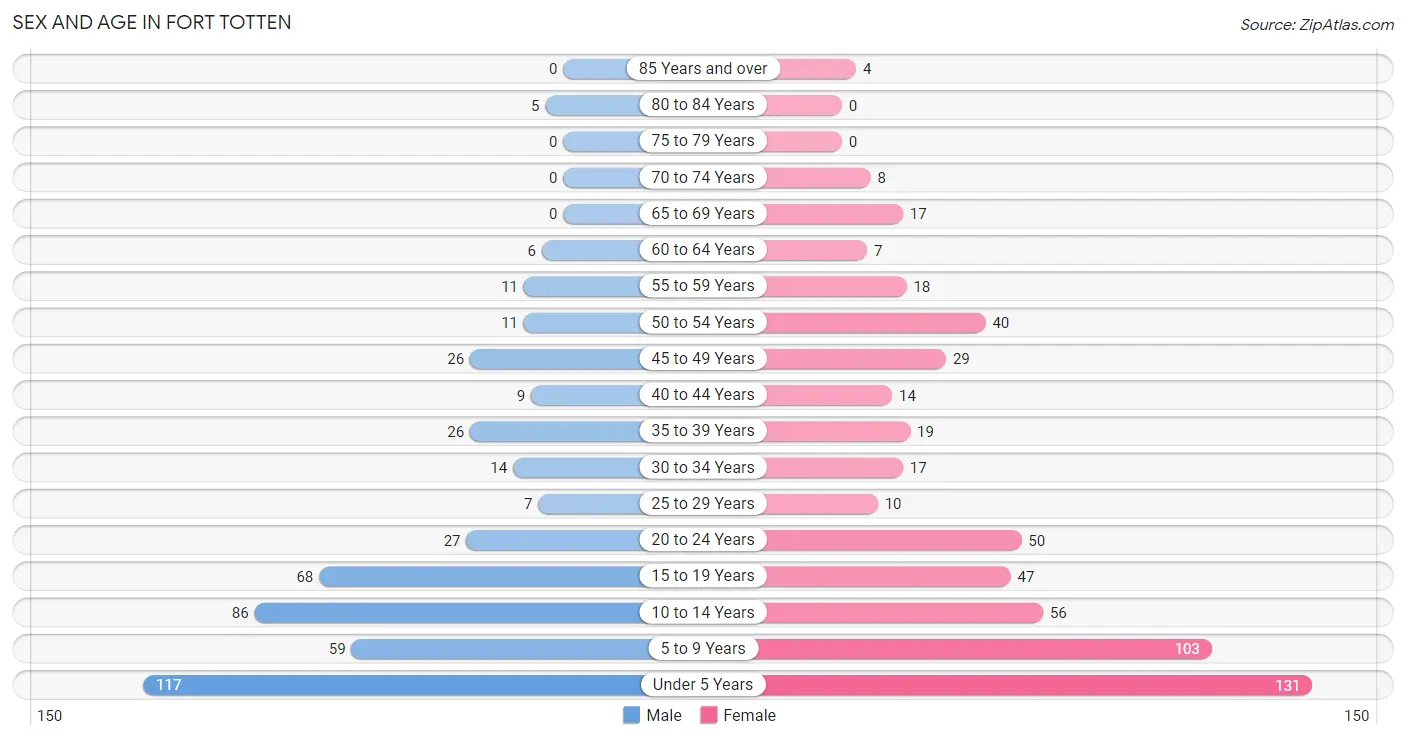
| Age Bracket | Male | Female |
| Under 5 Years | 117 (24.8%) | 131 (23.0%) |
| 5 to 9 Years | 59 (12.5%) | 103 (18.1%) |
| 10 to 14 Years | 86 (18.2%) | 56 (9.8%) |
| 15 to 19 Years | 68 (14.4%) | 47 (8.3%) |
| 20 to 24 Years | 27 (5.7%) | 50 (8.8%) |
| 25 to 29 Years | 7 (1.5%) | 10 (1.8%) |
| 30 to 34 Years | 14 (3.0%) | 17 (3.0%) |
| 35 to 39 Years | 26 (5.5%) | 19 (3.3%) |
| 40 to 44 Years | 9 (1.9%) | 14 (2.5%) |
| 45 to 49 Years | 26 (5.5%) | 29 (5.1%) |
| 50 to 54 Years | 11 (2.3%) | 40 (7.0%) |
| 55 to 59 Years | 11 (2.3%) | 18 (3.2%) |
| 60 to 64 Years | 6 (1.3%) | 7 (1.2%) |
| 65 to 69 Years | 0 (0.0%) | 17 (3.0%) |
| 70 to 74 Years | 0 (0.0%) | 8 (1.4%) |
| 75 to 79 Years | 0 (0.0%) | 0 (0.0%) |
| 80 to 84 Years | 5 (1.1%) | 0 (0.0%) |
| 85 Years and over | 0 (0.0%) | 4 (0.7%) |
| Total | 472 (100.0%) | 570 (100.0%) |
Families and Households in Fort Totten
Median Family Size in Fort Totten
The median family size in Fort Totten is 7.63 persons per family, with single female/mother families (88 | 67.7%) accounting for the largest median family size of 8.97 persons per family. On the other hand, married-couple families (25 | 19.2%) represent the smallest median family size with 4.04 persons per family.
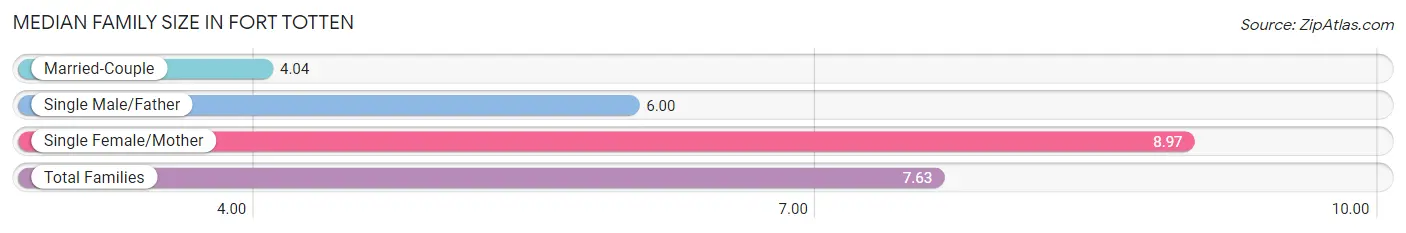
| Family Type | # Families | Family Size |
| Married-Couple | 25 (19.2%) | 4.04 |
| Single Male/Father | 17 (13.1%) | 6.00 |
| Single Female/Mother | 88 (67.7%) | 8.97 |
| Total Families | 130 (100.0%) | 7.63 |
Median Household Size in Fort Totten
The median household size in Fort Totten is 7.10 persons per household, with single female/mother households (88 | 60.7%) accounting for the largest median household size of 9.13 persons per household. non-family households (15 | 10.3%) represent the smallest median household size with 1.27 persons per household.
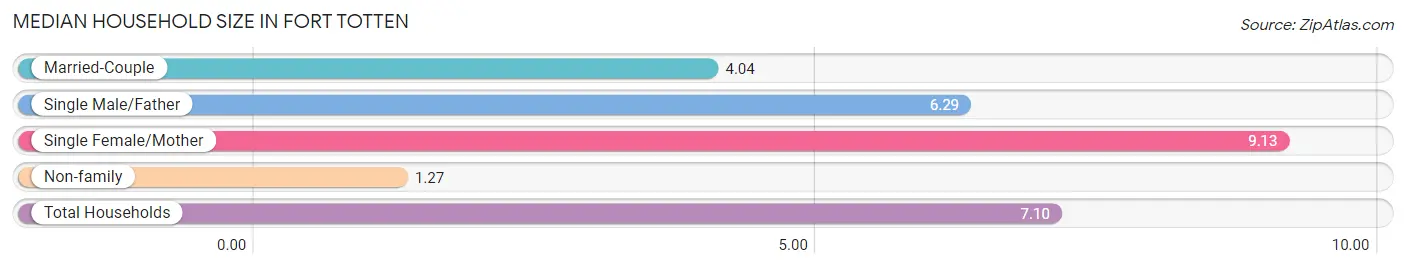
| Household Type | # Households | Household Size |
| Married-Couple | 25 (17.2%) | 4.04 |
| Single Male/Father | 17 (11.7%) | 6.29 |
| Single Female/Mother | 88 (60.7%) | 9.13 |
| Non-family | 15 (10.3%) | 1.27 |
| Total Households | 145 (100.0%) | 7.10 |
Household Size by Marriage Status in Fort Totten
Out of a total of 145 households in Fort Totten, 130 (89.7%) are family households, while 15 (10.3%) are nonfamily households. The most numerous type of family households are 4-person households, comprising 31, and the most common type of nonfamily households are 2-person households, comprising 9.
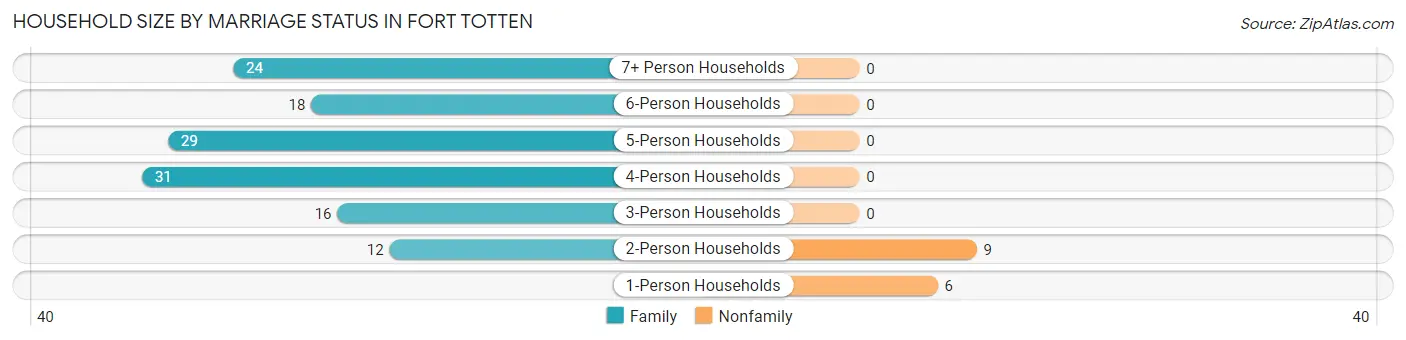
| Household Size | Family Households | Nonfamily Households |
| 1-Person Households | - | 6 (4.1%) |
| 2-Person Households | 12 (8.3%) | 9 (6.2%) |
| 3-Person Households | 16 (11.0%) | 0 (0.0%) |
| 4-Person Households | 31 (21.4%) | 0 (0.0%) |
| 5-Person Households | 29 (20.0%) | 0 (0.0%) |
| 6-Person Households | 18 (12.4%) | 0 (0.0%) |
| 7+ Person Households | 24 (16.6%) | 0 (0.0%) |
| Total | 130 (89.7%) | 15 (10.3%) |
Female Fertility in Fort Totten
Fertility by Age in Fort Totten
Average fertility rate in Fort Totten is 224.0 births per 1,000 women. Women in the age bracket of 20 to 34 years have the highest fertility rate with 571.0 births per 1,000 women. Women in the age bracket of 20 to 34 years acount for 100.0% of all women with births.
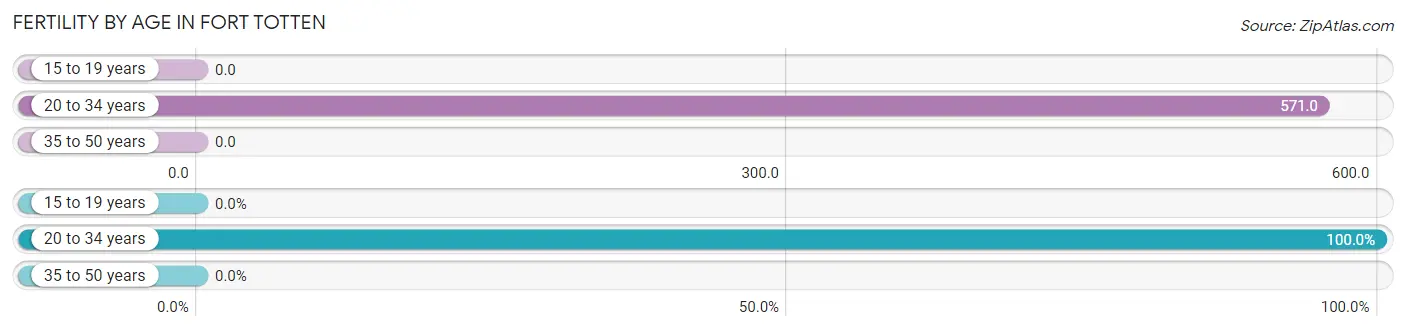
| Age Bracket | Women with Births | Births / 1,000 Women |
| 15 to 19 years | 0 (0.0%) | 0.0 |
| 20 to 34 years | 44 (100.0%) | 571.0 |
| 35 to 50 years | 0 (0.0%) | 0.0 |
| Total | 44 (100.0%) | 224.0 |
Fertility by Age by Marriage Status in Fort Totten
38.6% of women with births (44) in Fort Totten are married. The highest percentage of unmarried women with births falls into 20 to 34 years age bracket with 61.4% of them unmarried at the time of birth, while the lowest percentage of unmarried women with births belong to 20 to 34 years age bracket with 61.4% of them unmarried.
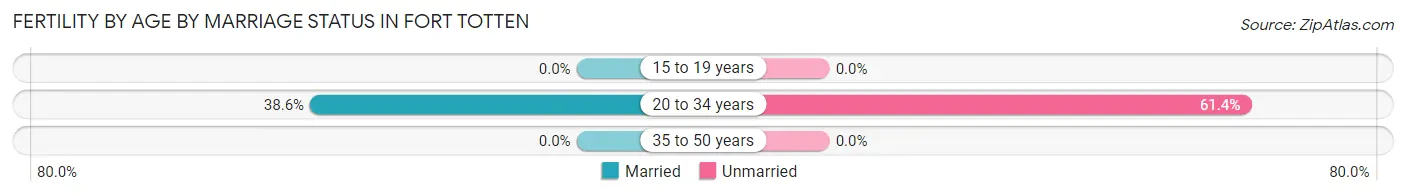
| Age Bracket | Married | Unmarried |
| 15 to 19 years | 0 (0.0%) | 0 (0.0%) |
| 20 to 34 years | 17 (38.6%) | 27 (61.4%) |
| 35 to 50 years | 0 (0.0%) | 0 (0.0%) |
| Total | 17 (38.6%) | 27 (61.4%) |
Fertility by Education in Fort Totten
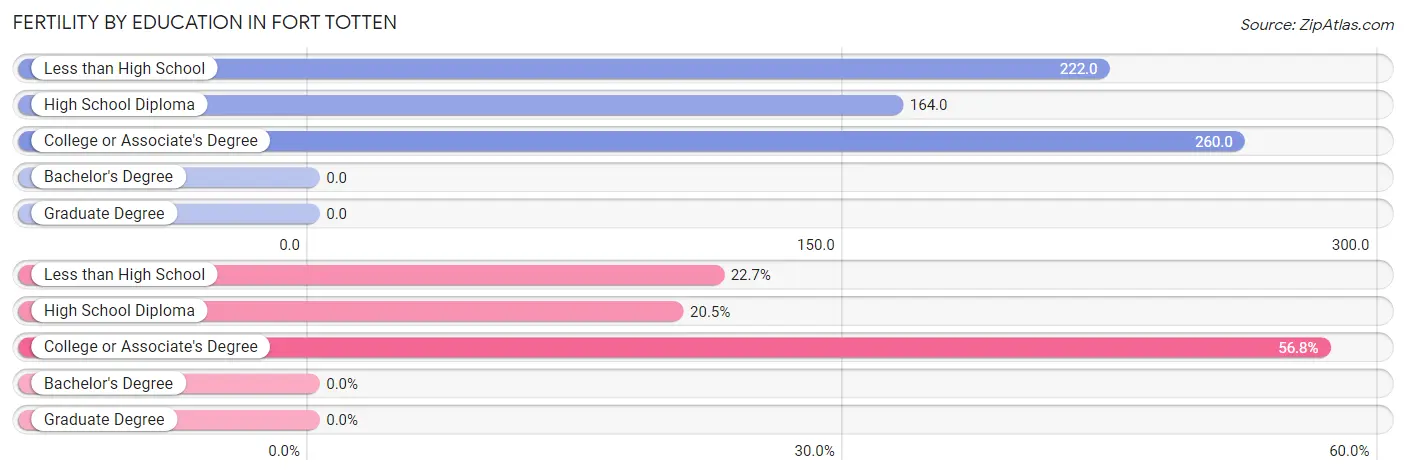
| Educational Attainment | Women with Births | Births / 1,000 Women |
| Less than High School | 10 (22.7%) | 222.0 |
| High School Diploma | 9 (20.4%) | 164.0 |
| College or Associate's Degree | 25 (56.8%) | 260.0 |
| Bachelor's Degree | 0 (0.0%) | 0.0 |
| Graduate Degree | 0 (0.0%) | 0.0 |
| Total | 44 (100.0%) | 224.0 |
Fertility by Education by Marriage Status in Fort Totten
61.4% of women with births in Fort Totten are unmarried. Women with the educational attainment of less than high school are most likely to be married with 100.0% of them married at childbirth, while women with the educational attainment of high school diploma are least likely to be married with 100.0% of them unmarried at childbirth.
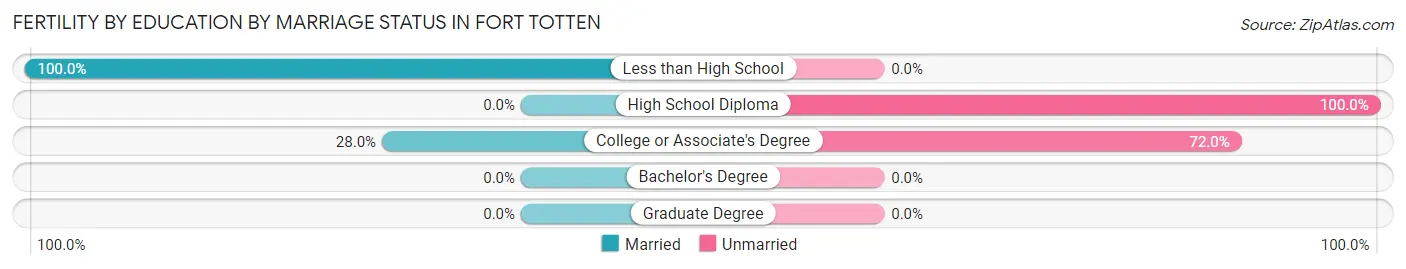
| Educational Attainment | Married | Unmarried |
| Less than High School | 10 (100.0%) | 0 (0.0%) |
| High School Diploma | 0 (0.0%) | 9 (100.0%) |
| College or Associate's Degree | 7 (28.0%) | 18 (72.0%) |
| Bachelor's Degree | 0 (0.0%) | 0 (0.0%) |
| Graduate Degree | 0 (0.0%) | 0 (0.0%) |
| Total | 17 (38.6%) | 27 (61.4%) |
Employment Characteristics in Fort Totten
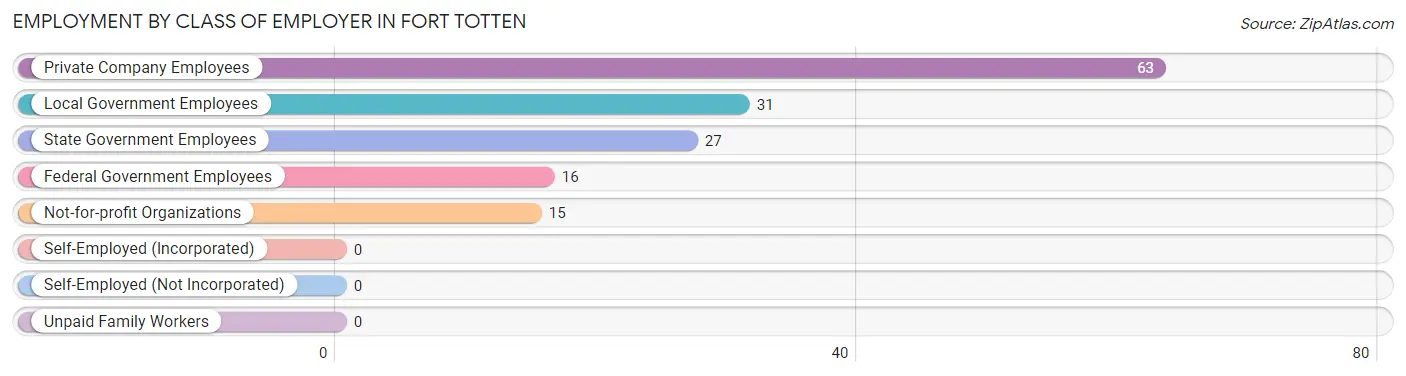
Employment by Class of Employer in Fort Totten
Among the 152 employed individuals in Fort Totten, private company employees (63 | 41.4%), local government employees (31 | 20.4%), and state government employees (27 | 17.8%) make up the most common classes of employment.
| Employer Class | # Employees | % Employees |
| Private Company Employees | 63 | 41.4% |
| Self-Employed (Incorporated) | 0 | 0.0% |
| Self-Employed (Not Incorporated) | 0 | 0.0% |
| Not-for-profit Organizations | 15 | 9.9% |
| Local Government Employees | 31 | 20.4% |
| State Government Employees | 27 | 17.8% |
| Federal Government Employees | 16 | 10.5% |
| Unpaid Family Workers | 0 | 0.0% |
| Total | 152 | 100.0% |
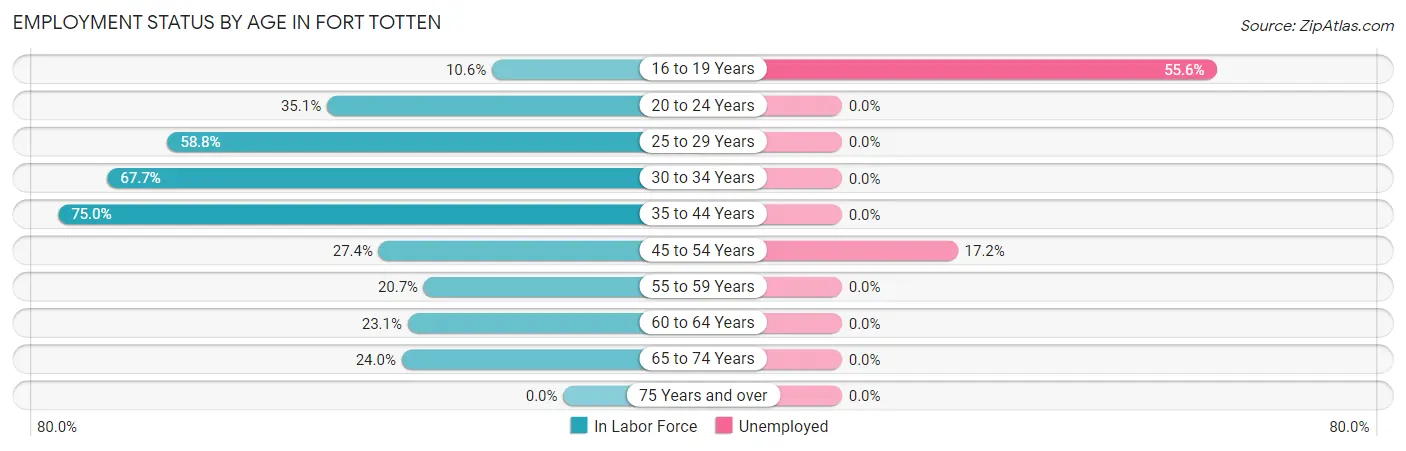
Employment Status by Age in Fort Totten
According to the labor force statistics for Fort Totten, out of the total population over 16 years of age (460), 35.2% or 162 individuals are in the labor force, with 6.2% or 10 of them unemployed. The age group with the highest labor force participation rate is 35 to 44 years, with 75.0% or 51 individuals in the labor force. Within the labor force, the 16 to 19 years age range has the highest percentage of unemployed individuals, with 55.6% or 5 of them being unemployed.
| Age Bracket | In Labor Force | Unemployed |
| 16 to 19 Years | 9 (10.6%) | 5 (55.6%) |
| 20 to 24 Years | 27 (35.1%) | 0 (0.0%) |
| 25 to 29 Years | 10 (58.8%) | 0 (0.0%) |
| 30 to 34 Years | 21 (67.7%) | 0 (0.0%) |
| 35 to 44 Years | 51 (75.0%) | 0 (0.0%) |
| 45 to 54 Years | 29 (27.4%) | 5 (17.2%) |
| 55 to 59 Years | 6 (20.7%) | 0 (0.0%) |
| 60 to 64 Years | 3 (23.1%) | 0 (0.0%) |
| 65 to 74 Years | 6 (24.0%) | 0 (0.0%) |
| 75 Years and over | 0 (0.0%) | 0 (0.0%) |
| Total | 162 (35.2%) | 10 (6.2%) |
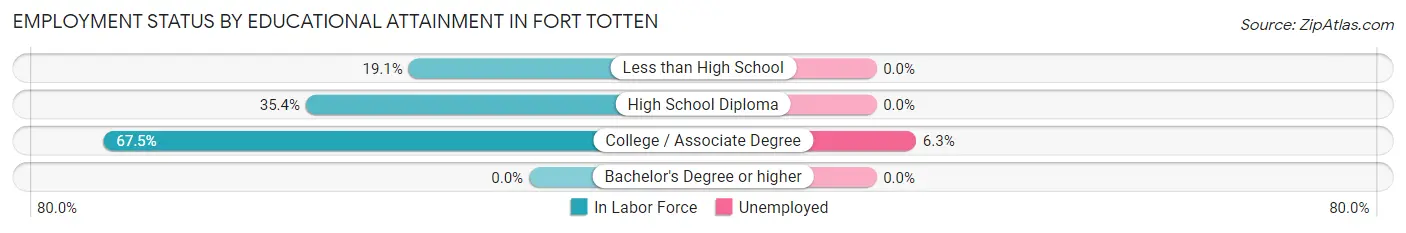
Employment Status by Educational Attainment in Fort Totten
According to labor force statistics for Fort Totten, 45.5% of individuals (120) out of the total population between 25 and 64 years of age (264) are in the labor force, with 4.2% or 5 of them being unemployed. The group with the highest labor force participation rate are those with the educational attainment of college / associate degree, with 67.5% or 79 individuals in the labor force. Within the labor force, individuals with college / associate degree education have the highest percentage of unemployment, with 6.3% or 5 of them being unemployed.
| Educational Attainment | In Labor Force | Unemployed |
| Less than High School | 13 (19.1%) | 0 (0.0%) |
| High School Diploma | 28 (35.4%) | 0 (0.0%) |
| College / Associate Degree | 79 (67.5%) | 7 (6.3%) |
| Bachelor's Degree or higher | 0 (0.0%) | 0 (0.0%) |
| Total | 120 (45.5%) | 11 (4.2%) |
Employment Occupations by Sex in Fort Totten
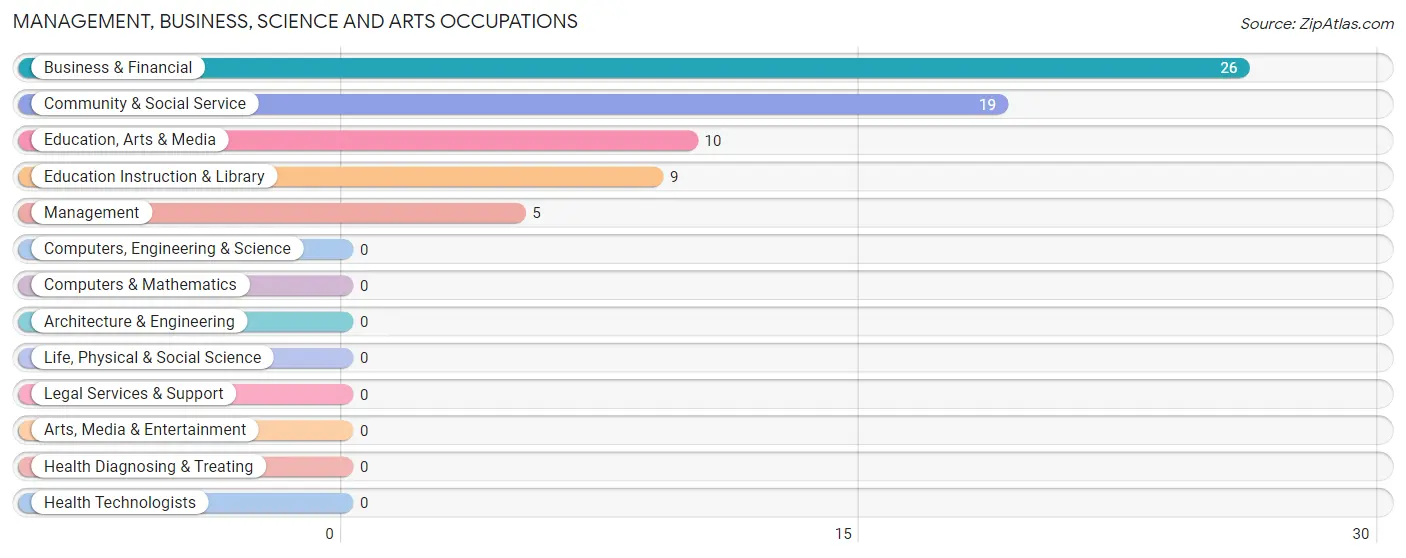
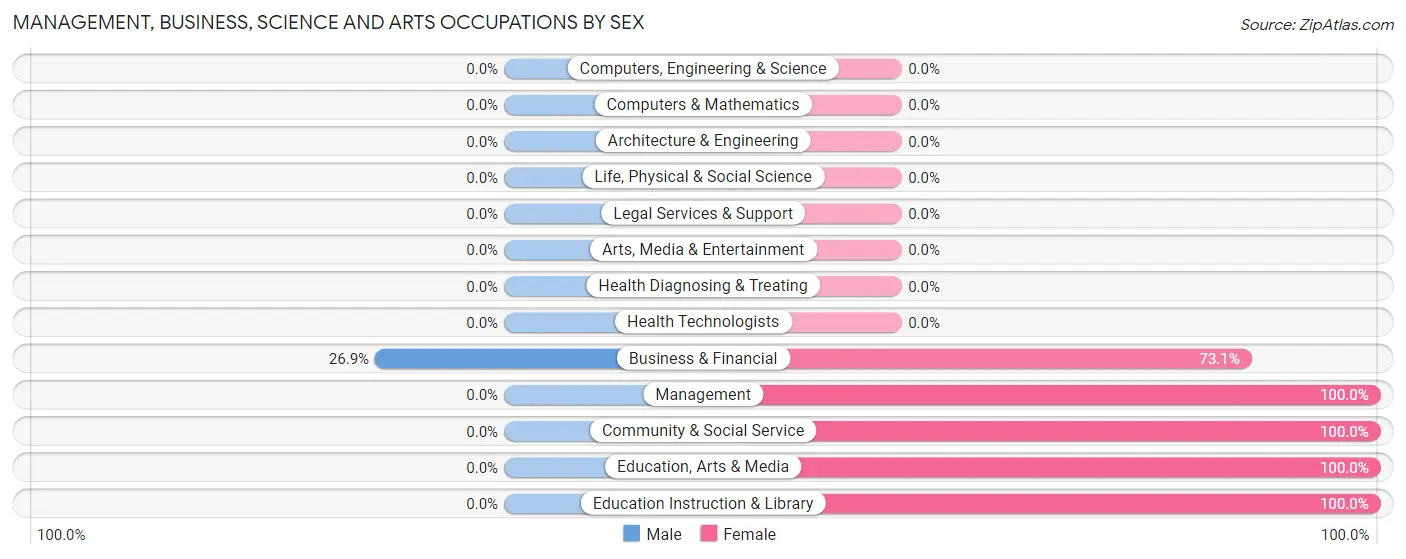
Management, Business, Science and Arts Occupations
The most common Management, Business, Science and Arts occupations in Fort Totten are Business & Financial (26 | 17.1%), Community & Social Service (19 | 12.5%), Education, Arts & Media (10 | 6.6%), Education Instruction & Library (9 | 5.9%), and Management (5 | 3.3%).
Management, Business, Science and Arts Occupations by Sex
| Occupation | Male | Female |
| Management | 0 (0.0%) | 5 (100.0%) |
| Business & Financial | 7 (26.9%) | 19 (73.1%) |
| Computers, Engineering & Science | 0 (0.0%) | 0 (0.0%) |
| Computers & Mathematics | 0 (0.0%) | 0 (0.0%) |
| Architecture & Engineering | 0 (0.0%) | 0 (0.0%) |
| Life, Physical & Social Science | 0 (0.0%) | 0 (0.0%) |
| Community & Social Service | 0 (0.0%) | 19 (100.0%) |
| Education, Arts & Media | 0 (0.0%) | 10 (100.0%) |
| Legal Services & Support | 0 (0.0%) | 0 (0.0%) |
| Education Instruction & Library | 0 (0.0%) | 9 (100.0%) |
| Arts, Media & Entertainment | 0 (0.0%) | 0 (0.0%) |
| Health Diagnosing & Treating | 0 (0.0%) | 0 (0.0%) |
| Health Technologists | 0 (0.0%) | 0 (0.0%) |
| Total (Category) | 7 (14.0%) | 43 (86.0%) |
| Total (Overall) | 64 (42.1%) | 88 (57.9%) |
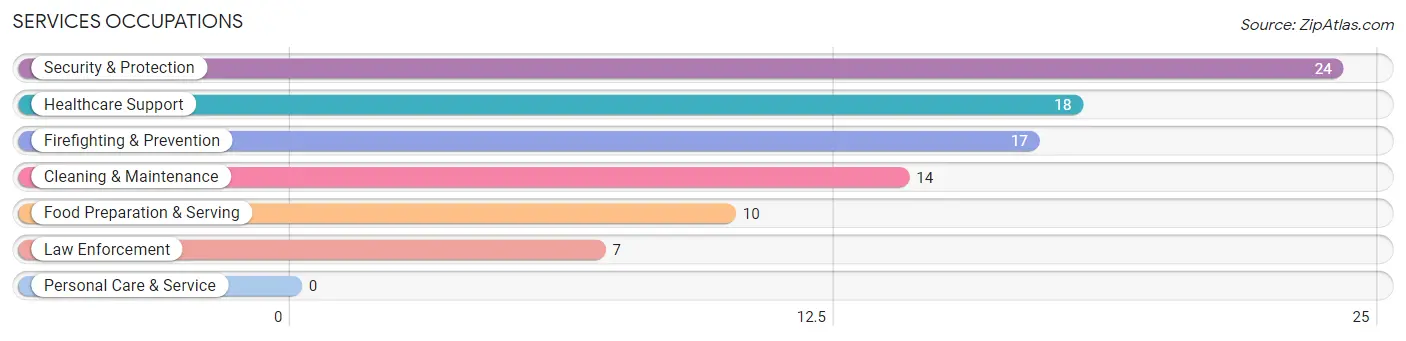
Services Occupations
The most common Services occupations in Fort Totten are Security & Protection (24 | 15.8%), Healthcare Support (18 | 11.8%), Firefighting & Prevention (17 | 11.2%), Cleaning & Maintenance (14 | 9.2%), and Food Preparation & Serving (10 | 6.6%).
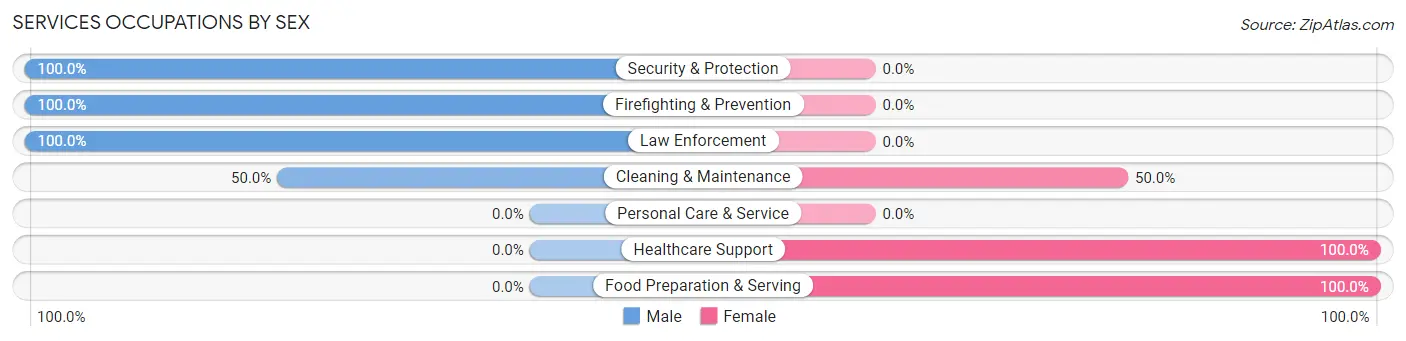
Services Occupations by Sex
Within the Services occupations in Fort Totten, the most male-oriented occupations are Security & Protection (100.0%), Firefighting & Prevention (100.0%), and Law Enforcement (100.0%), while the most female-oriented occupations are Healthcare Support (100.0%), Food Preparation & Serving (100.0%), and Cleaning & Maintenance (50.0%).
| Occupation | Male | Female |
| Healthcare Support | 0 (0.0%) | 18 (100.0%) |
| Security & Protection | 24 (100.0%) | 0 (0.0%) |
| Firefighting & Prevention | 17 (100.0%) | 0 (0.0%) |
| Law Enforcement | 7 (100.0%) | 0 (0.0%) |
| Food Preparation & Serving | 0 (0.0%) | 10 (100.0%) |
| Cleaning & Maintenance | 7 (50.0%) | 7 (50.0%) |
| Personal Care & Service | 0 (0.0%) | 0 (0.0%) |
| Total (Category) | 31 (47.0%) | 35 (53.0%) |
| Total (Overall) | 64 (42.1%) | 88 (57.9%) |
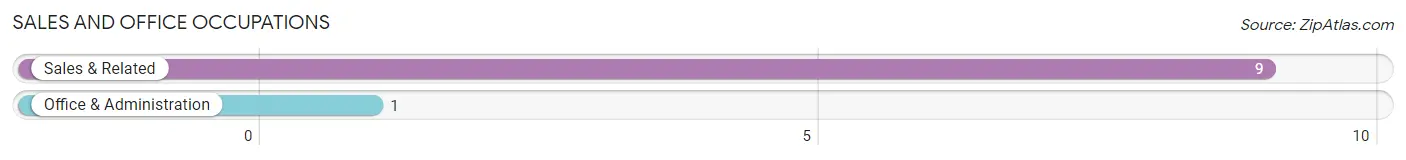
Sales and Office Occupations
The most common Sales and Office occupations in Fort Totten are Sales & Related (9 | 5.9%), and Office & Administration (1 | 0.7%).
Sales and Office Occupations by Sex

| Occupation | Male | Female |
| Sales & Related | 0 (0.0%) | 9 (100.0%) |
| Office & Administration | 0 (0.0%) | 1 (100.0%) |
| Total (Category) | 0 (0.0%) | 10 (100.0%) |
| Total (Overall) | 64 (42.1%) | 88 (57.9%) |
Natural Resources, Construction and Maintenance Occupations
The most common Natural Resources, Construction and Maintenance occupations in Fort Totten are Installation, Maintenance & Repair (16 | 10.5%), and Construction & Extraction (3 | 2.0%).
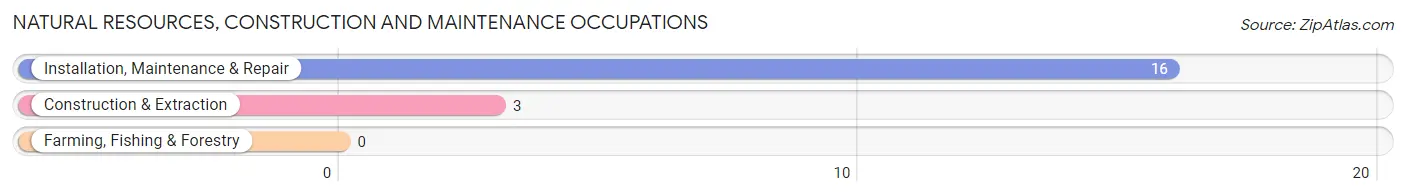
Natural Resources, Construction and Maintenance Occupations by Sex

| Occupation | Male | Female |
| Farming, Fishing & Forestry | 0 (0.0%) | 0 (0.0%) |
| Construction & Extraction | 3 (100.0%) | 0 (0.0%) |
| Installation, Maintenance & Repair | 16 (100.0%) | 0 (0.0%) |
| Total (Category) | 19 (100.0%) | 0 (0.0%) |
| Total (Overall) | 64 (42.1%) | 88 (57.9%) |
Production, Transportation and Moving Occupations
The most common Production, Transportation and Moving occupations in Fort Totten are Production (4 | 2.6%), and Transportation (3 | 2.0%).
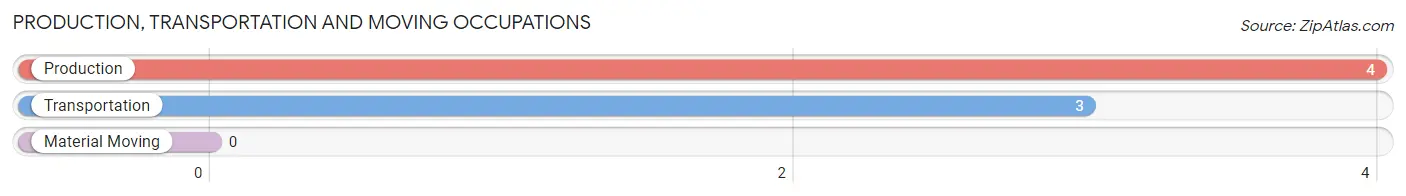
Production, Transportation and Moving Occupations by Sex
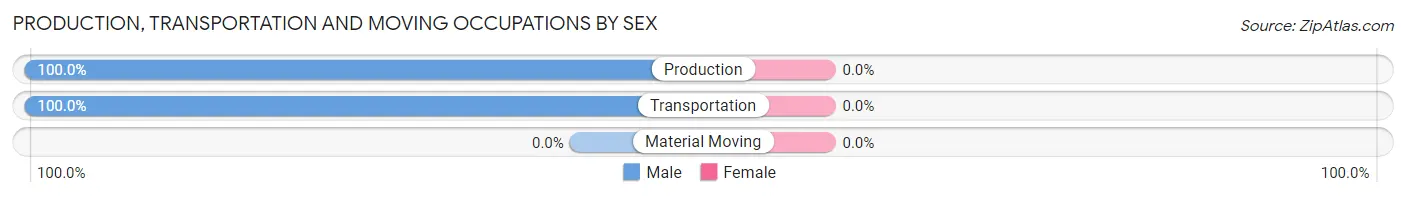
| Occupation | Male | Female |
| Production | 4 (100.0%) | 0 (0.0%) |
| Transportation | 3 (100.0%) | 0 (0.0%) |
| Material Moving | 0 (0.0%) | 0 (0.0%) |
| Total (Category) | 7 (100.0%) | 0 (0.0%) |
| Total (Overall) | 64 (42.1%) | 88 (57.9%) |
Employment Industries by Sex in Fort Totten
Employment Industries in Fort Totten
The major employment industries in Fort Totten include Public Administration (38 | 25.0%), Accommodation & Food Services (34 | 22.4%), Health Care & Social Assistance (17 | 11.2%), Manufacturing (12 | 7.9%), and Educational Services (11 | 7.2%).
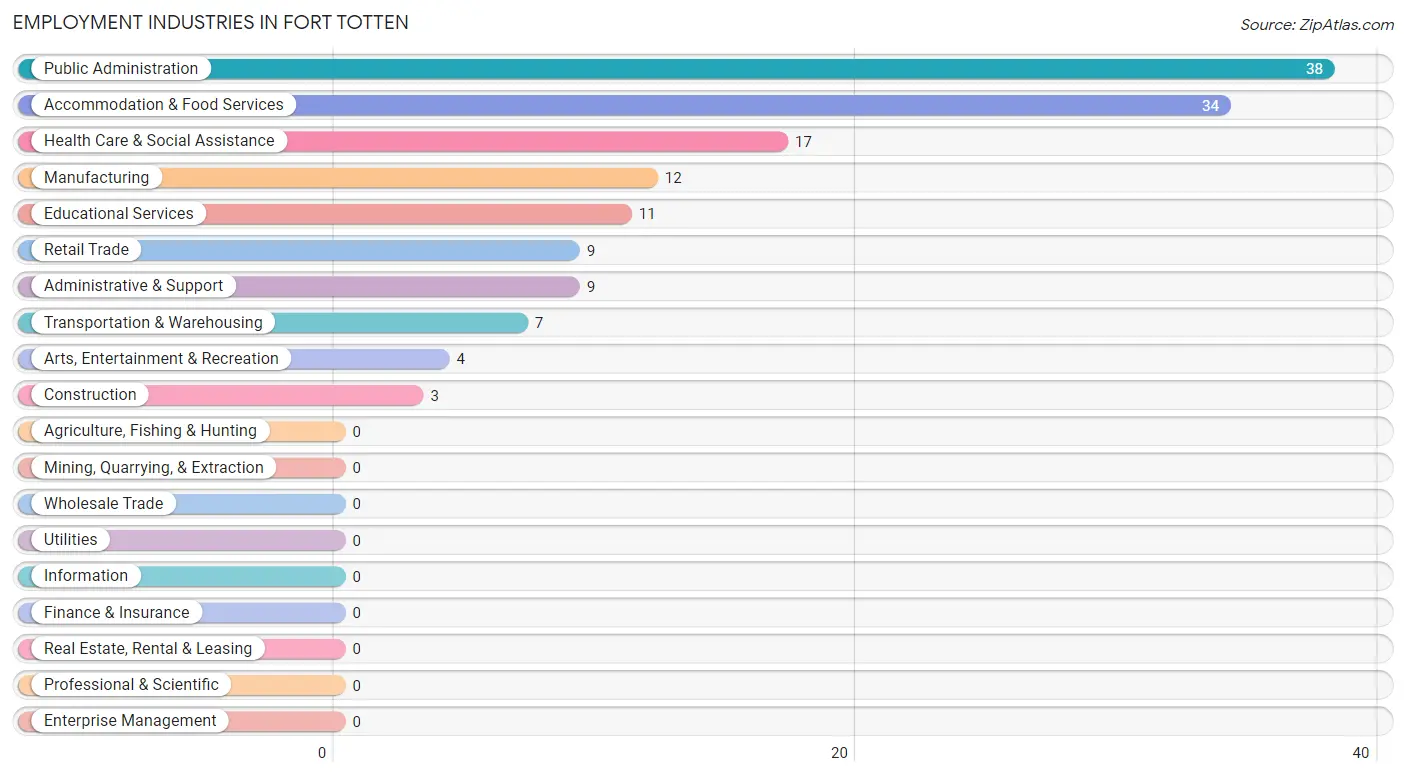
Employment Industries by Sex in Fort Totten
The Fort Totten industries that see more men than women are Construction (100.0%), Manufacturing (100.0%), and Transportation & Warehousing (100.0%), whereas the industries that tend to have a higher number of women are Retail Trade (100.0%), Administrative & Support (100.0%), and Health Care & Social Assistance (100.0%).
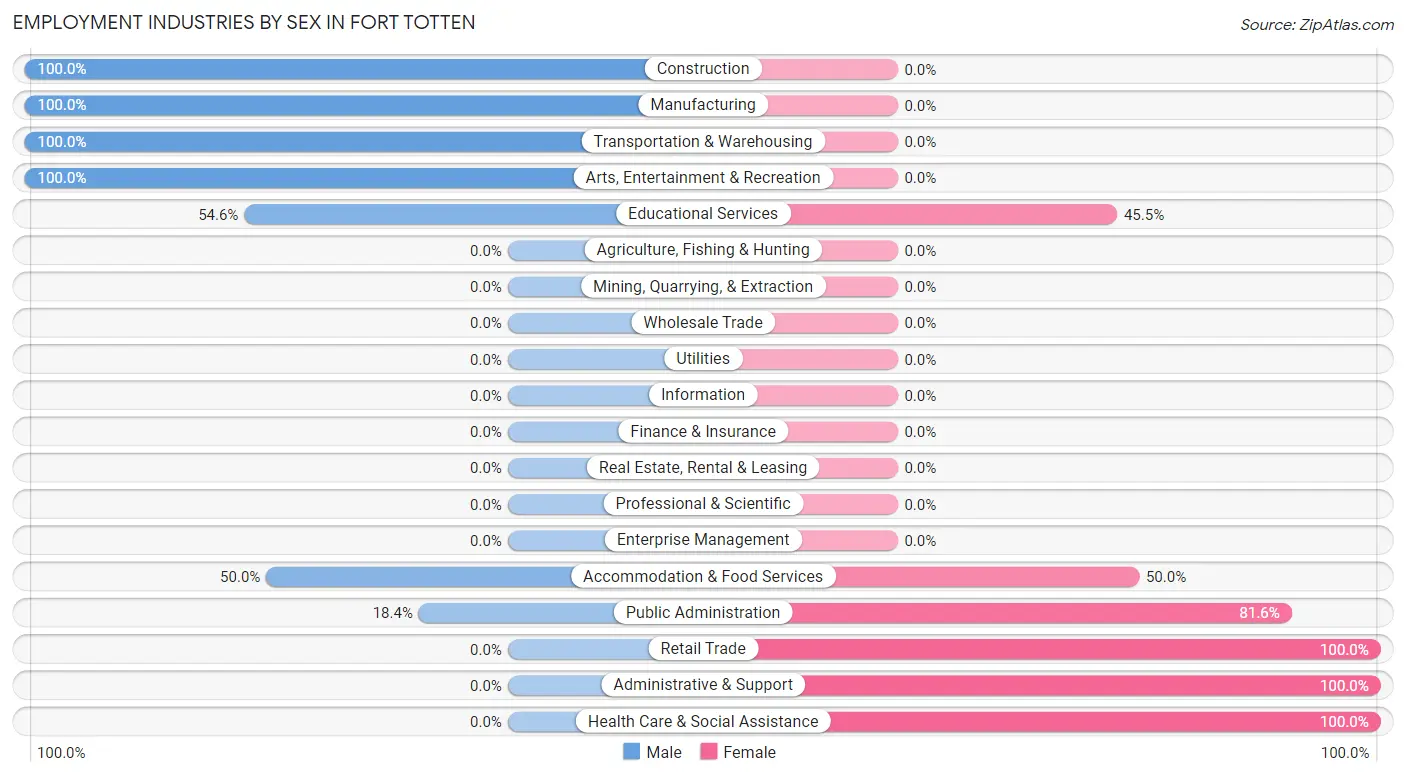
| Industry | Male | Female |
| Agriculture, Fishing & Hunting | 0 (0.0%) | 0 (0.0%) |
| Mining, Quarrying, & Extraction | 0 (0.0%) | 0 (0.0%) |
| Construction | 3 (100.0%) | 0 (0.0%) |
| Manufacturing | 12 (100.0%) | 0 (0.0%) |
| Wholesale Trade | 0 (0.0%) | 0 (0.0%) |
| Retail Trade | 0 (0.0%) | 9 (100.0%) |
| Transportation & Warehousing | 7 (100.0%) | 0 (0.0%) |
| Utilities | 0 (0.0%) | 0 (0.0%) |
| Information | 0 (0.0%) | 0 (0.0%) |
| Finance & Insurance | 0 (0.0%) | 0 (0.0%) |
| Real Estate, Rental & Leasing | 0 (0.0%) | 0 (0.0%) |
| Professional & Scientific | 0 (0.0%) | 0 (0.0%) |
| Enterprise Management | 0 (0.0%) | 0 (0.0%) |
| Administrative & Support | 0 (0.0%) | 9 (100.0%) |
| Educational Services | 6 (54.5%) | 5 (45.5%) |
| Health Care & Social Assistance | 0 (0.0%) | 17 (100.0%) |
| Arts, Entertainment & Recreation | 4 (100.0%) | 0 (0.0%) |
| Accommodation & Food Services | 17 (50.0%) | 17 (50.0%) |
| Public Administration | 7 (18.4%) | 31 (81.6%) |
| Total | 64 (42.1%) | 88 (57.9%) |
Education in Fort Totten
School Enrollment in Fort Totten
The most common levels of schooling among the 360 students in Fort Totten are middle school (123 | 34.2%), elementary school (97 | 26.9%), and high school (64 | 17.8%).
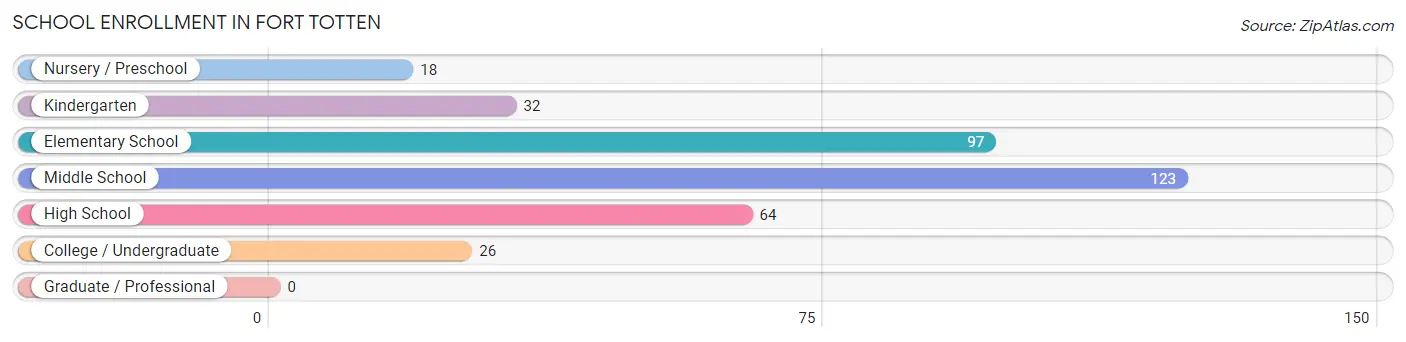
| School Level | # Students | % Students |
| Nursery / Preschool | 18 | 5.0% |
| Kindergarten | 32 | 8.9% |
| Elementary School | 97 | 26.9% |
| Middle School | 123 | 34.2% |
| High School | 64 | 17.8% |
| College / Undergraduate | 26 | 7.2% |
| Graduate / Professional | 0 | 0.0% |
| Total | 360 | 100.0% |
School Enrollment by Age by Funding Source in Fort Totten
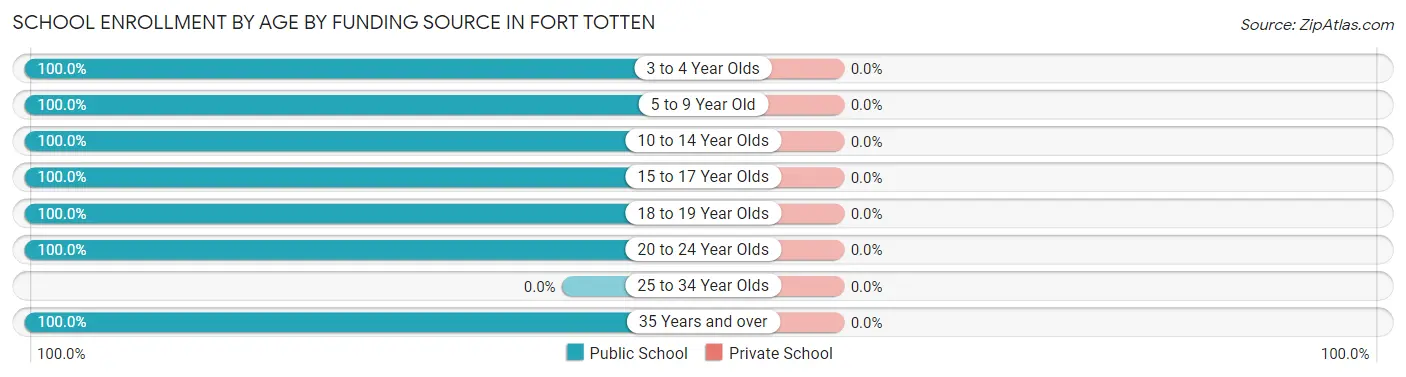
| Age Bracket | Public School | Private School |
| 3 to 4 Year Olds | 12 (100.0%) | 0 (0.0%) |
| 5 to 9 Year Old | 129 (100.0%) | 0 (0.0%) |
| 10 to 14 Year Olds | 123 (100.0%) | 0 (0.0%) |
| 15 to 17 Year Olds | 57 (100.0%) | 0 (0.0%) |
| 18 to 19 Year Olds | 9 (100.0%) | 0 (0.0%) |
| 20 to 24 Year Olds | 27 (100.0%) | 0 (0.0%) |
| 25 to 34 Year Olds | 0 (0.0%) | 0 (0.0%) |
| 35 Years and over | 3 (100.0%) | 0 (0.0%) |
| Total | 360 (100.0%) | 0 (0.0%) |
Educational Attainment by Field of Study in Fort Totten
| Field of Study | # Graduates | % Graduates |
| Computers & Mathematics | 0 | 0.0% |
| Bio, Nature & Agricultural | 0 | 0.0% |
| Physical & Health Sciences | 0 | 0.0% |
| Psychology | 0 | 0.0% |
| Social Sciences | 0 | 0.0% |
| Engineering | 0 | 0.0% |
| Multidisciplinary Studies | 0 | 0.0% |
| Science & Technology | 0 | 0.0% |
| Business | 0 | 0.0% |
| Education | 0 | 0.0% |
| Literature & Languages | 0 | 0.0% |
| Liberal Arts & History | 0 | 0.0% |
| Visual & Performing Arts | 0 | 0.0% |
| Communications | 0 | 0.0% |
| Arts & Humanities | 0 | 0.0% |
| Total | 0 | 0.0% |
Transportation & Commute in Fort Totten
Vehicle Availability by Sex in Fort Totten
The most prevalent vehicle ownership categories in Fort Totten are males with 1 vehicle (21, accounting for 32.8%) and females with 1 vehicle (31, making up 23.9%).
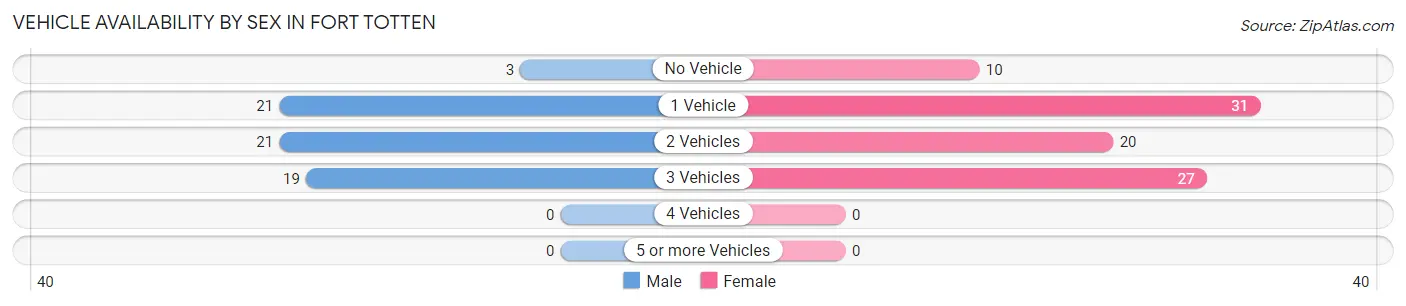
| Vehicles Available | Male | Female |
| No Vehicle | 3 (4.7%) | 10 (11.4%) |
| 1 Vehicle | 21 (32.8%) | 31 (35.2%) |
| 2 Vehicles | 21 (32.8%) | 20 (22.7%) |
| 3 Vehicles | 19 (29.7%) | 27 (30.7%) |
| 4 Vehicles | 0 (0.0%) | 0 (0.0%) |
| 5 or more Vehicles | 0 (0.0%) | 0 (0.0%) |
| Total | 64 (100.0%) | 88 (100.0%) |
Commute Time in Fort Totten
The most frequently occuring commute durations in Fort Totten are less than 5 minutes (60 commuters, 39.5%), 5 to 9 minutes (34 commuters, 22.4%), and 15 to 19 minutes (27 commuters, 17.8%).
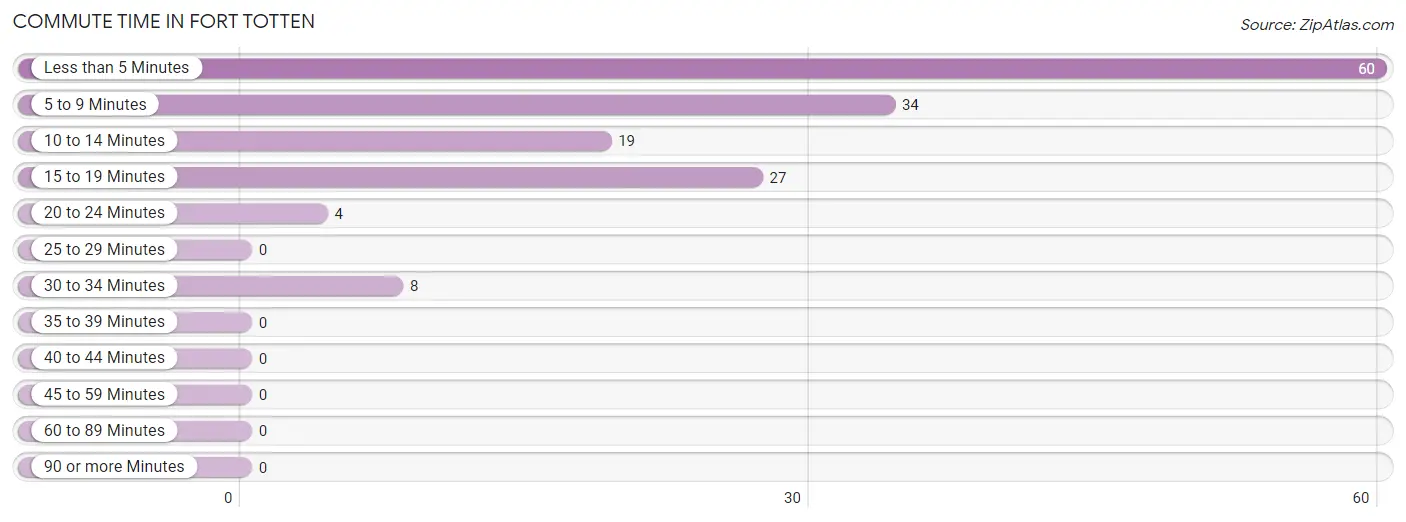
| Commute Time | # Commuters | % Commuters |
| Less than 5 Minutes | 60 | 39.5% |
| 5 to 9 Minutes | 34 | 22.4% |
| 10 to 14 Minutes | 19 | 12.5% |
| 15 to 19 Minutes | 27 | 17.8% |
| 20 to 24 Minutes | 4 | 2.6% |
| 25 to 29 Minutes | 0 | 0.0% |
| 30 to 34 Minutes | 8 | 5.3% |
| 35 to 39 Minutes | 0 | 0.0% |
| 40 to 44 Minutes | 0 | 0.0% |
| 45 to 59 Minutes | 0 | 0.0% |
| 60 to 89 Minutes | 0 | 0.0% |
| 90 or more Minutes | 0 | 0.0% |
Commute Time by Sex in Fort Totten
The most common commute times in Fort Totten are less than 5 minutes (26 commuters, 40.6%) for males and less than 5 minutes (34 commuters, 38.6%) for females.
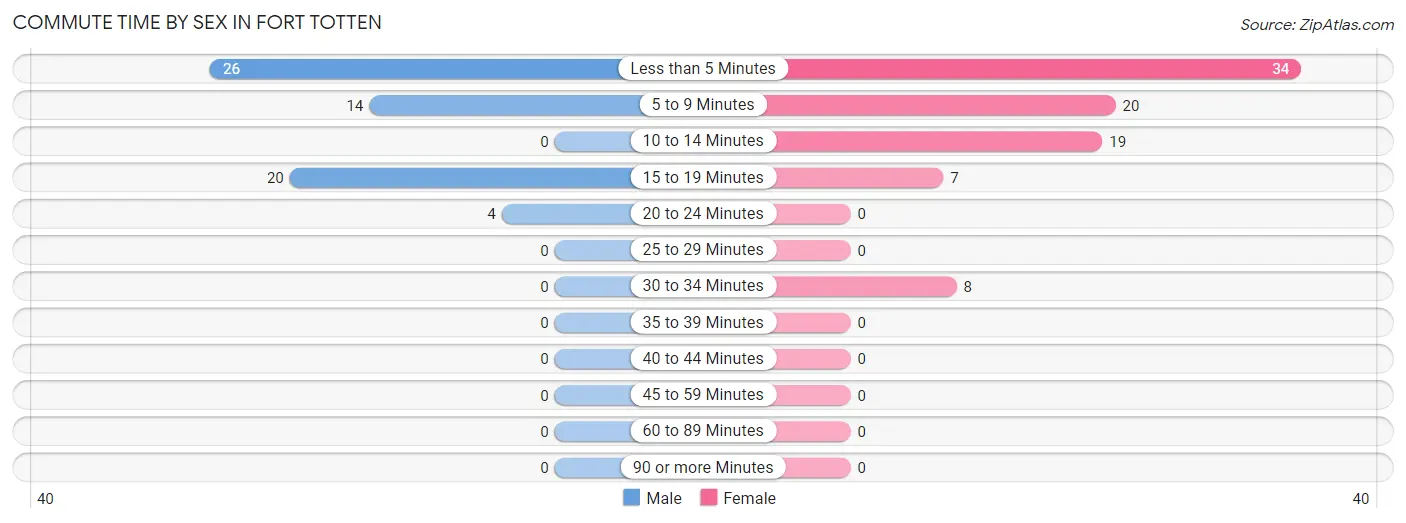
| Commute Time | Male | Female |
| Less than 5 Minutes | 26 (40.6%) | 34 (38.6%) |
| 5 to 9 Minutes | 14 (21.9%) | 20 (22.7%) |
| 10 to 14 Minutes | 0 (0.0%) | 19 (21.6%) |
| 15 to 19 Minutes | 20 (31.2%) | 7 (8.0%) |
| 20 to 24 Minutes | 4 (6.2%) | 0 (0.0%) |
| 25 to 29 Minutes | 0 (0.0%) | 0 (0.0%) |
| 30 to 34 Minutes | 0 (0.0%) | 8 (9.1%) |
| 35 to 39 Minutes | 0 (0.0%) | 0 (0.0%) |
| 40 to 44 Minutes | 0 (0.0%) | 0 (0.0%) |
| 45 to 59 Minutes | 0 (0.0%) | 0 (0.0%) |
| 60 to 89 Minutes | 0 (0.0%) | 0 (0.0%) |
| 90 or more Minutes | 0 (0.0%) | 0 (0.0%) |
Time of Departure to Work by Sex in Fort Totten
The most frequent times of departure to work in Fort Totten are 8:00 AM to 8:29 AM (22, 34.4%) for males and 8:00 AM to 8:29 AM (30, 34.1%) for females.
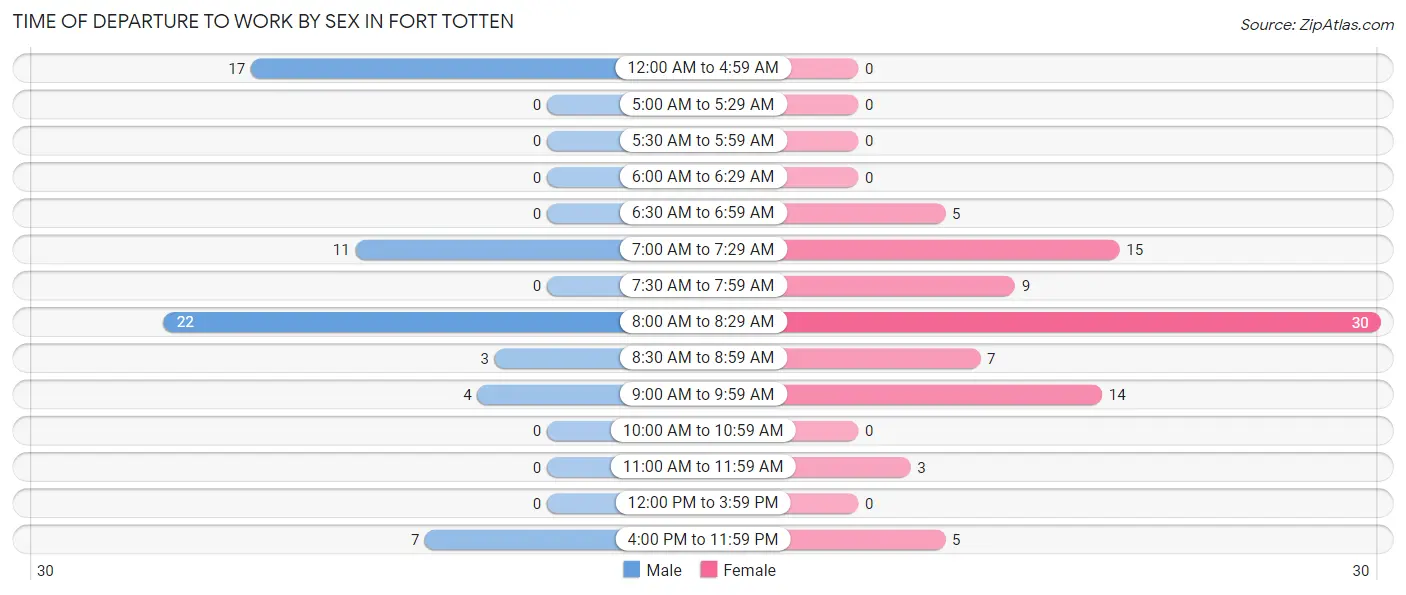
| Time of Departure | Male | Female |
| 12:00 AM to 4:59 AM | 17 (26.6%) | 0 (0.0%) |
| 5:00 AM to 5:29 AM | 0 (0.0%) | 0 (0.0%) |
| 5:30 AM to 5:59 AM | 0 (0.0%) | 0 (0.0%) |
| 6:00 AM to 6:29 AM | 0 (0.0%) | 0 (0.0%) |
| 6:30 AM to 6:59 AM | 0 (0.0%) | 5 (5.7%) |
| 7:00 AM to 7:29 AM | 11 (17.2%) | 15 (17.1%) |
| 7:30 AM to 7:59 AM | 0 (0.0%) | 9 (10.2%) |
| 8:00 AM to 8:29 AM | 22 (34.4%) | 30 (34.1%) |
| 8:30 AM to 8:59 AM | 3 (4.7%) | 7 (8.0%) |
| 9:00 AM to 9:59 AM | 4 (6.2%) | 14 (15.9%) |
| 10:00 AM to 10:59 AM | 0 (0.0%) | 0 (0.0%) |
| 11:00 AM to 11:59 AM | 0 (0.0%) | 3 (3.4%) |
| 12:00 PM to 3:59 PM | 0 (0.0%) | 0 (0.0%) |
| 4:00 PM to 11:59 PM | 7 (10.9%) | 5 (5.7%) |
| Total | 64 (100.0%) | 88 (100.0%) |
Housing Occupancy in Fort Totten
Occupancy by Ownership in Fort Totten
Of the total 145 dwellings in Fort Totten, owner-occupied units account for 74 (51.0%), while renter-occupied units make up 71 (49.0%).
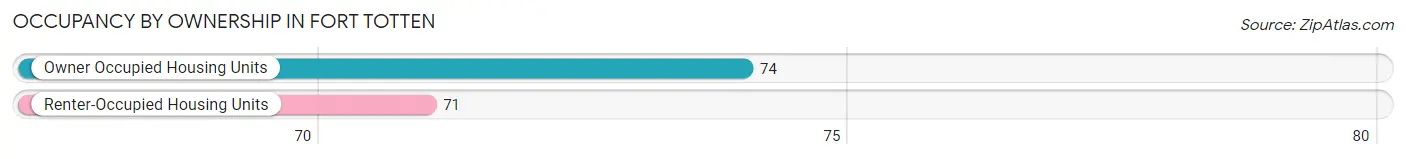
| Occupancy | # Housing Units | % Housing Units |
| Owner Occupied Housing Units | 74 | 51.0% |
| Renter-Occupied Housing Units | 71 | 49.0% |
| Total Occupied Housing Units | 145 | 100.0% |
Occupancy by Household Size in Fort Totten
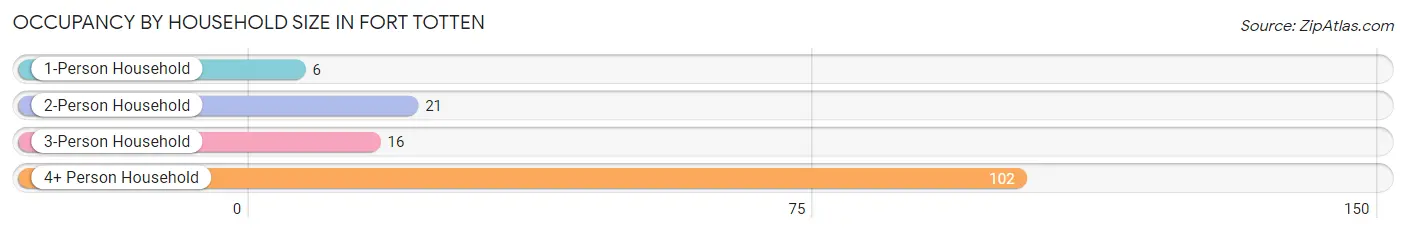
| Household Size | # Housing Units | % Housing Units |
| 1-Person Household | 6 | 4.1% |
| 2-Person Household | 21 | 14.5% |
| 3-Person Household | 16 | 11.0% |
| 4+ Person Household | 102 | 70.3% |
| Total Housing Units | 145 | 100.0% |
Occupancy by Ownership by Household Size in Fort Totten
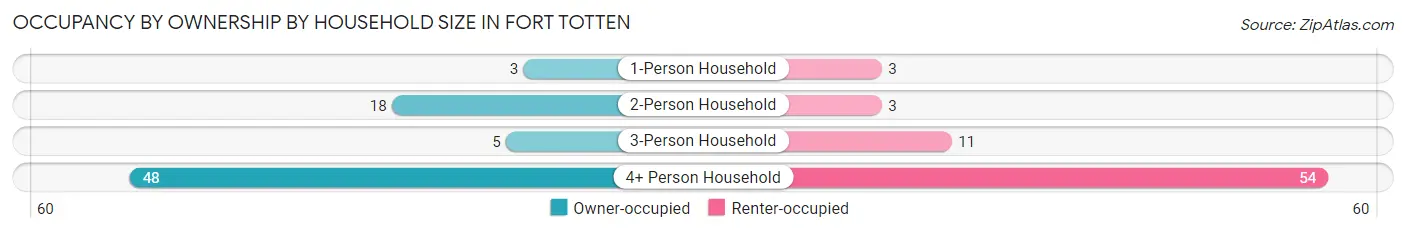
| Household Size | Owner-occupied | Renter-occupied |
| 1-Person Household | 3 (50.0%) | 3 (50.0%) |
| 2-Person Household | 18 (85.7%) | 3 (14.3%) |
| 3-Person Household | 5 (31.2%) | 11 (68.8%) |
| 4+ Person Household | 48 (47.1%) | 54 (52.9%) |
| Total Housing Units | 74 (51.0%) | 71 (49.0%) |
Occupancy by Educational Attainment in Fort Totten
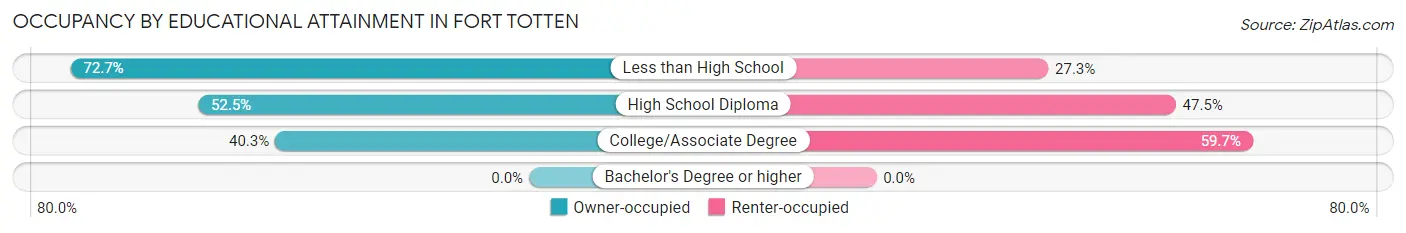
| Household Size | Owner-occupied | Renter-occupied |
| Less than High School | 24 (72.7%) | 9 (27.3%) |
| High School Diploma | 21 (52.5%) | 19 (47.5%) |
| College/Associate Degree | 29 (40.3%) | 43 (59.7%) |
| Bachelor's Degree or higher | 0 (0.0%) | 0 (0.0%) |
Occupancy by Age of Householder in Fort Totten
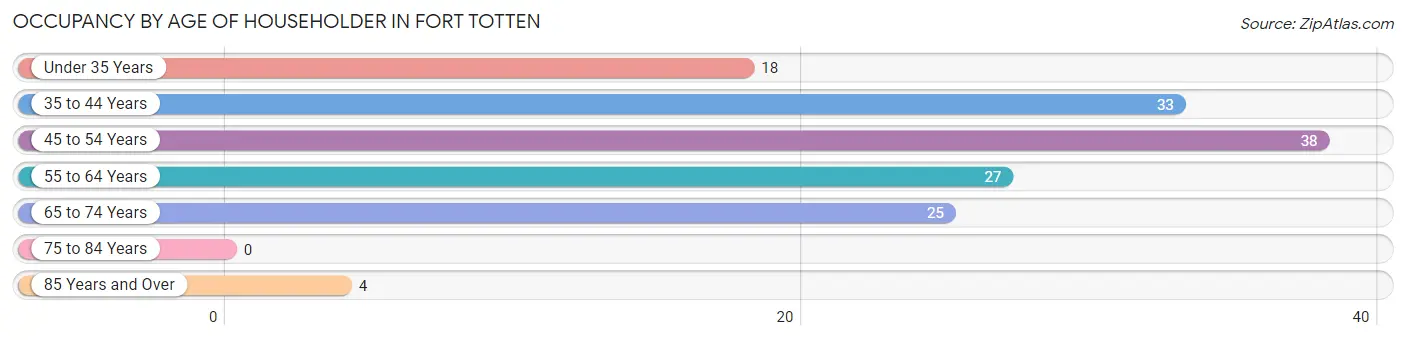
| Age Bracket | # Households | % Households |
| Under 35 Years | 18 | 12.4% |
| 35 to 44 Years | 33 | 22.8% |
| 45 to 54 Years | 38 | 26.2% |
| 55 to 64 Years | 27 | 18.6% |
| 65 to 74 Years | 25 | 17.2% |
| 75 to 84 Years | 0 | 0.0% |
| 85 Years and Over | 4 | 2.8% |
| Total | 145 | 100.0% |
Housing Finances in Fort Totten
Median Income by Occupancy in Fort Totten
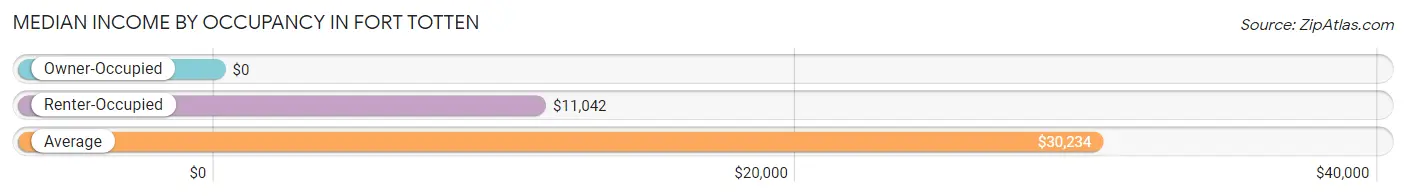
| Occupancy Type | # Households | Median Income |
| Owner-Occupied | 74 (51.0%) | $0 |
| Renter-Occupied | 71 (49.0%) | $11,042 |
| Average | 145 (100.0%) | $30,234 |
Occupancy by Householder Income Bracket in Fort Totten
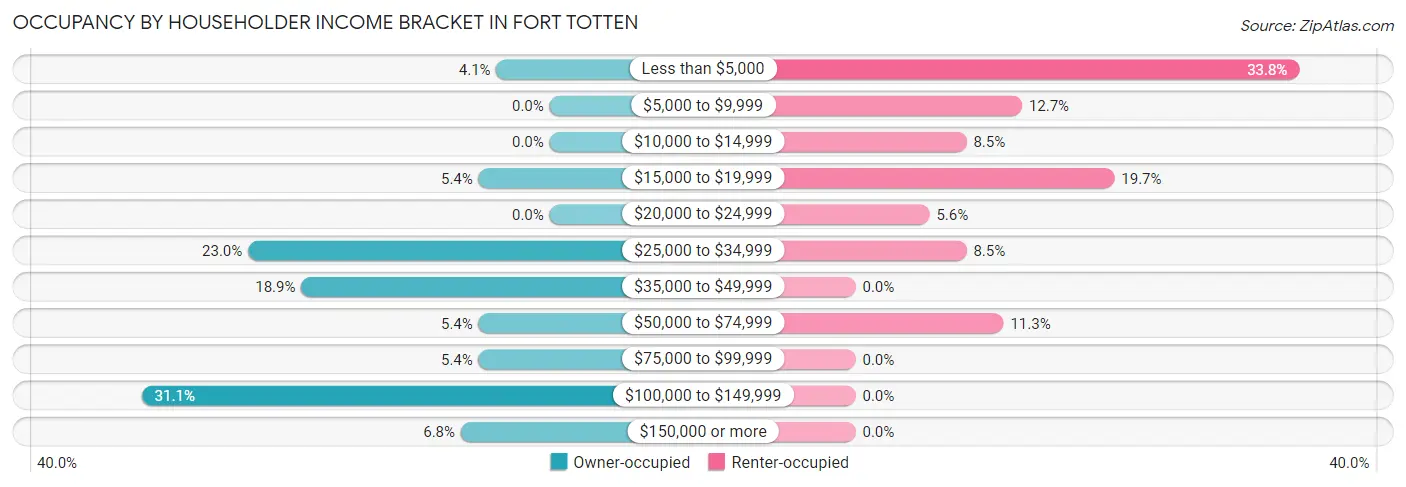
| Income Bracket | Owner-occupied | Renter-occupied |
| Less than $5,000 | 3 (4.1%) | 24 (33.8%) |
| $5,000 to $9,999 | 0 (0.0%) | 9 (12.7%) |
| $10,000 to $14,999 | 0 (0.0%) | 6 (8.5%) |
| $15,000 to $19,999 | 4 (5.4%) | 14 (19.7%) |
| $20,000 to $24,999 | 0 (0.0%) | 4 (5.6%) |
| $25,000 to $34,999 | 17 (23.0%) | 6 (8.5%) |
| $35,000 to $49,999 | 14 (18.9%) | 0 (0.0%) |
| $50,000 to $74,999 | 4 (5.4%) | 8 (11.3%) |
| $75,000 to $99,999 | 4 (5.4%) | 0 (0.0%) |
| $100,000 to $149,999 | 23 (31.1%) | 0 (0.0%) |
| $150,000 or more | 5 (6.8%) | 0 (0.0%) |
| Total | 74 (100.0%) | 71 (100.0%) |
Monthly Housing Cost Tiers in Fort Totten
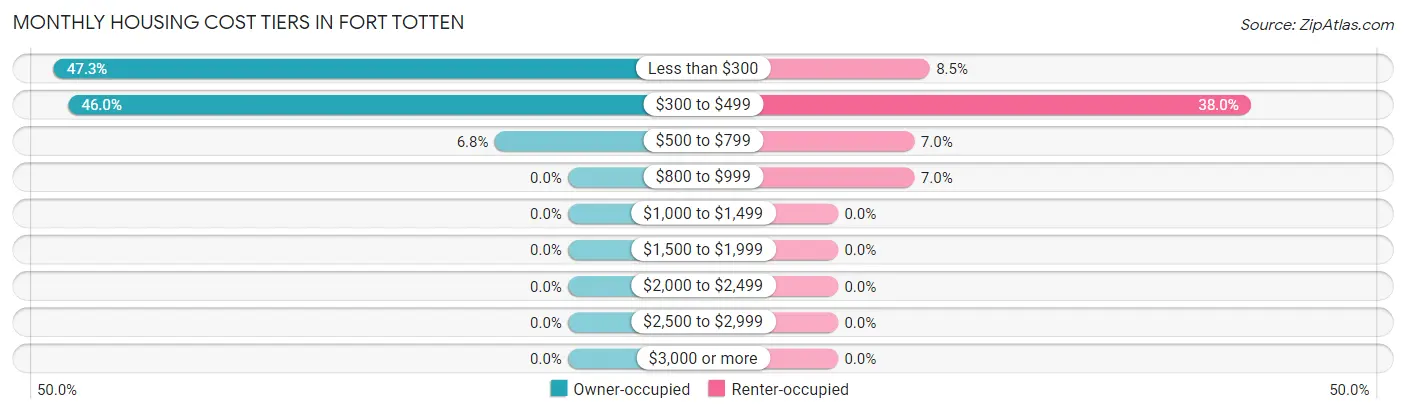
| Monthly Cost | Owner-occupied | Renter-occupied |
| Less than $300 | 35 (47.3%) | 6 (8.5%) |
| $300 to $499 | 34 (46.0%) | 27 (38.0%) |
| $500 to $799 | 5 (6.8%) | 5 (7.0%) |
| $800 to $999 | 0 (0.0%) | 5 (7.0%) |
| $1,000 to $1,499 | 0 (0.0%) | 0 (0.0%) |
| $1,500 to $1,999 | 0 (0.0%) | 0 (0.0%) |
| $2,000 to $2,499 | 0 (0.0%) | 0 (0.0%) |
| $2,500 to $2,999 | 0 (0.0%) | 0 (0.0%) |
| $3,000 or more | 0 (0.0%) | 0 (0.0%) |
| Total | 74 (100.0%) | 71 (100.0%) |
Physical Housing Characteristics in Fort Totten
Housing Structures in Fort Totten
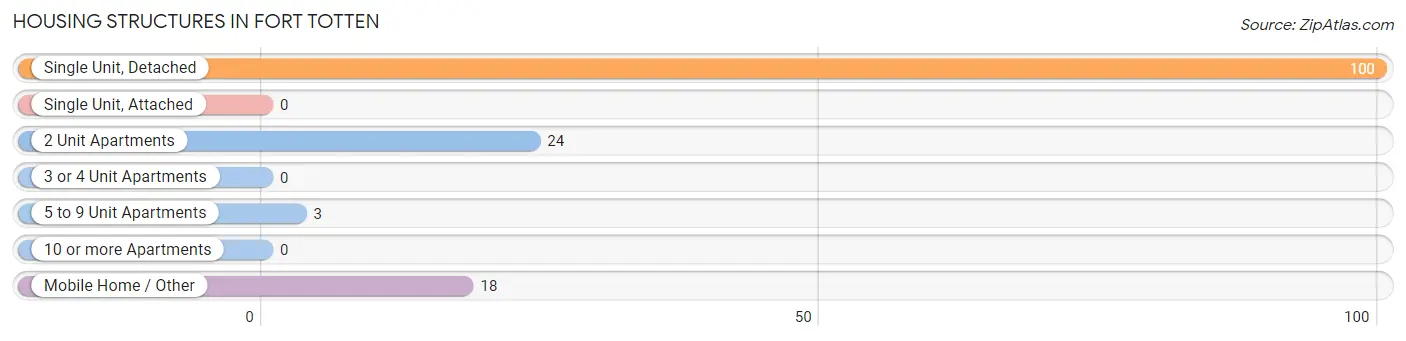
| Structure Type | # Housing Units | % Housing Units |
| Single Unit, Detached | 100 | 69.0% |
| Single Unit, Attached | 0 | 0.0% |
| 2 Unit Apartments | 24 | 16.6% |
| 3 or 4 Unit Apartments | 0 | 0.0% |
| 5 to 9 Unit Apartments | 3 | 2.1% |
| 10 or more Apartments | 0 | 0.0% |
| Mobile Home / Other | 18 | 12.4% |
| Total | 145 | 100.0% |
Housing Structures by Occupancy in Fort Totten
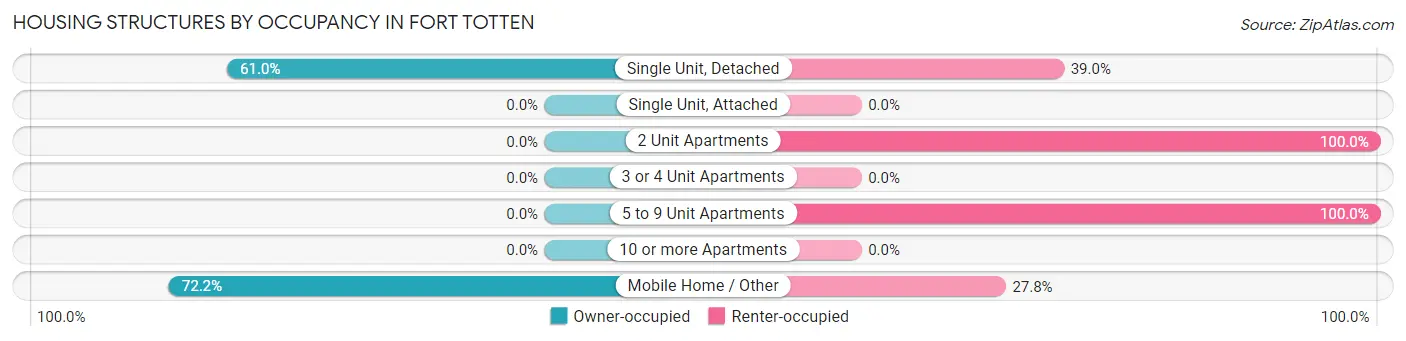
| Structure Type | Owner-occupied | Renter-occupied |
| Single Unit, Detached | 61 (61.0%) | 39 (39.0%) |
| Single Unit, Attached | 0 (0.0%) | 0 (0.0%) |
| 2 Unit Apartments | 0 (0.0%) | 24 (100.0%) |
| 3 or 4 Unit Apartments | 0 (0.0%) | 0 (0.0%) |
| 5 to 9 Unit Apartments | 0 (0.0%) | 3 (100.0%) |
| 10 or more Apartments | 0 (0.0%) | 0 (0.0%) |
| Mobile Home / Other | 13 (72.2%) | 5 (27.8%) |
| Total | 74 (51.0%) | 71 (49.0%) |
Housing Structures by Number of Rooms in Fort Totten
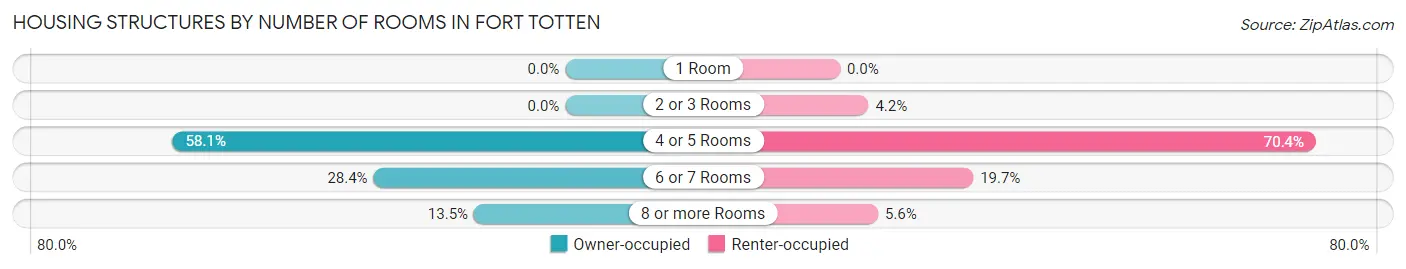
| Number of Rooms | Owner-occupied | Renter-occupied |
| 1 Room | 0 (0.0%) | 0 (0.0%) |
| 2 or 3 Rooms | 0 (0.0%) | 3 (4.2%) |
| 4 or 5 Rooms | 43 (58.1%) | 50 (70.4%) |
| 6 or 7 Rooms | 21 (28.4%) | 14 (19.7%) |
| 8 or more Rooms | 10 (13.5%) | 4 (5.6%) |
| Total | 74 (100.0%) | 71 (100.0%) |
Housing Structure by Heating Type in Fort Totten
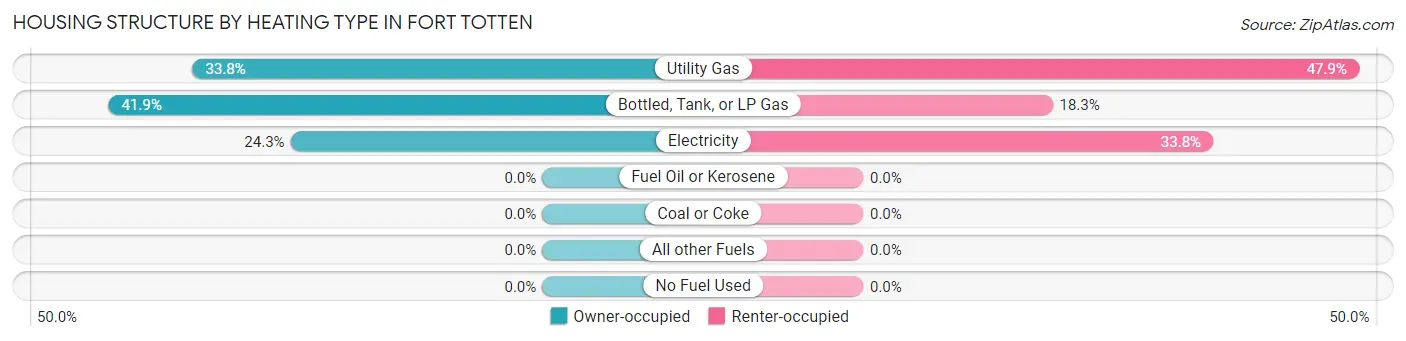
| Heating Type | Owner-occupied | Renter-occupied |
| Utility Gas | 25 (33.8%) | 34 (47.9%) |
| Bottled, Tank, or LP Gas | 31 (41.9%) | 13 (18.3%) |
| Electricity | 18 (24.3%) | 24 (33.8%) |
| Fuel Oil or Kerosene | 0 (0.0%) | 0 (0.0%) |
| Coal or Coke | 0 (0.0%) | 0 (0.0%) |
| All other Fuels | 0 (0.0%) | 0 (0.0%) |
| No Fuel Used | 0 (0.0%) | 0 (0.0%) |
| Total | 74 (100.0%) | 71 (100.0%) |
Household Vehicle Usage in Fort Totten
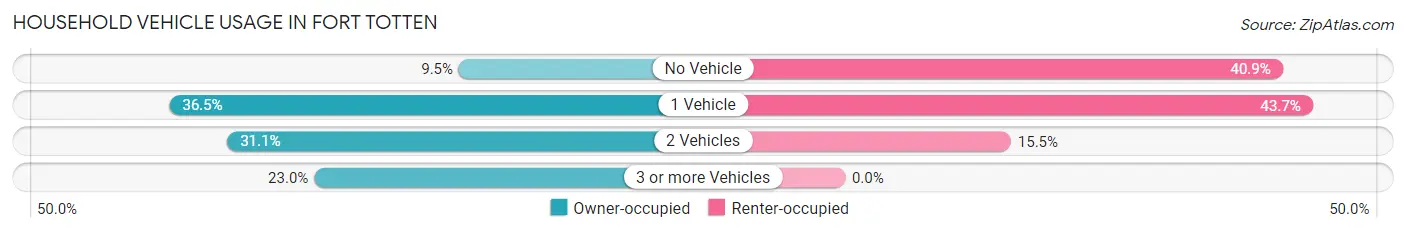
| Vehicles per Household | Owner-occupied | Renter-occupied |
| No Vehicle | 7 (9.5%) | 29 (40.8%) |
| 1 Vehicle | 27 (36.5%) | 31 (43.7%) |
| 2 Vehicles | 23 (31.1%) | 11 (15.5%) |
| 3 or more Vehicles | 17 (23.0%) | 0 (0.0%) |
| Total | 74 (100.0%) | 71 (100.0%) |
Real Estate & Mortgages in Fort Totten
Real Estate and Mortgage Overview in Fort Totten
| Characteristic | Without Mortgage | With Mortgage |
| Housing Units | 74 | 0 |
| Median Property Value | $36,200 | $0 |
| Median Household Income | - | - |
| Monthly Housing Costs | $307 | $0 |
| Real Estate Taxes | - | - |
Property Value by Mortgage Status in Fort Totten
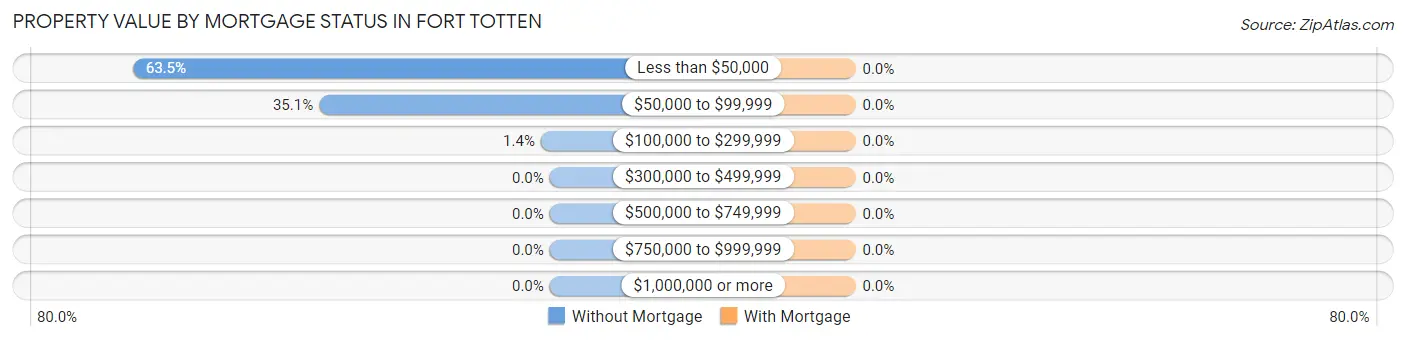
| Property Value | Without Mortgage | With Mortgage |
| Less than $50,000 | 47 (63.5%) | 0 (0.0%) |
| $50,000 to $99,999 | 26 (35.1%) | 0 (0.0%) |
| $100,000 to $299,999 | 1 (1.3%) | 0 (0.0%) |
| $300,000 to $499,999 | 0 (0.0%) | 0 (0.0%) |
| $500,000 to $749,999 | 0 (0.0%) | 0 (0.0%) |
| $750,000 to $999,999 | 0 (0.0%) | 0 (0.0%) |
| $1,000,000 or more | 0 (0.0%) | 0 (0.0%) |
| Total | 74 (100.0%) | 0 (0.0%) |
Household Income by Mortgage Status in Fort Totten
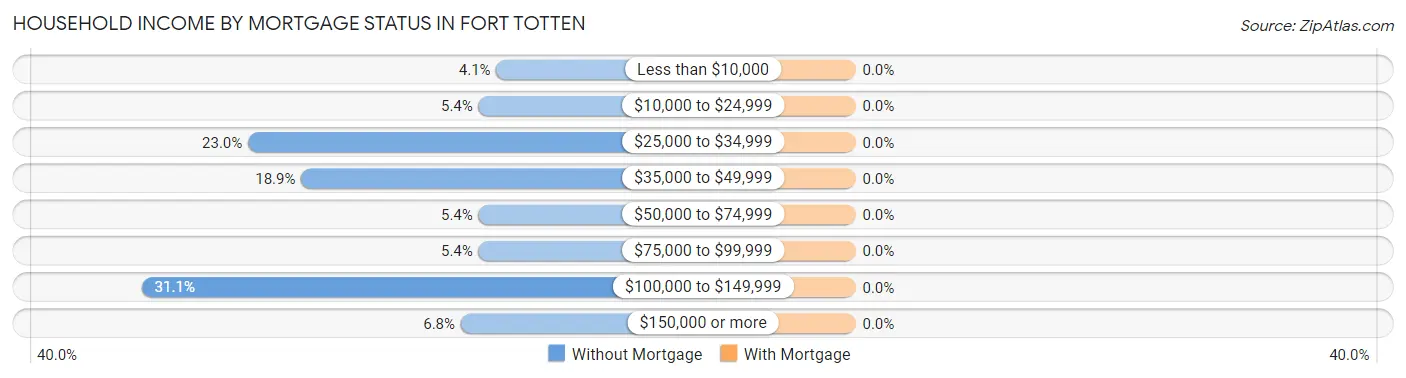
| Household Income | Without Mortgage | With Mortgage |
| Less than $10,000 | 3 (4.1%) | 0 (0.0%) |
| $10,000 to $24,999 | 4 (5.4%) | 0 (0.0%) |
| $25,000 to $34,999 | 17 (23.0%) | 0 (0.0%) |
| $35,000 to $49,999 | 14 (18.9%) | 0 (0.0%) |
| $50,000 to $74,999 | 4 (5.4%) | 0 (0.0%) |
| $75,000 to $99,999 | 4 (5.4%) | 0 (0.0%) |
| $100,000 to $149,999 | 23 (31.1%) | 0 (0.0%) |
| $150,000 or more | 5 (6.8%) | 0 (0.0%) |
| Total | 74 (100.0%) | 0 (0.0%) |
Property Value to Household Income Ratio in Fort Totten
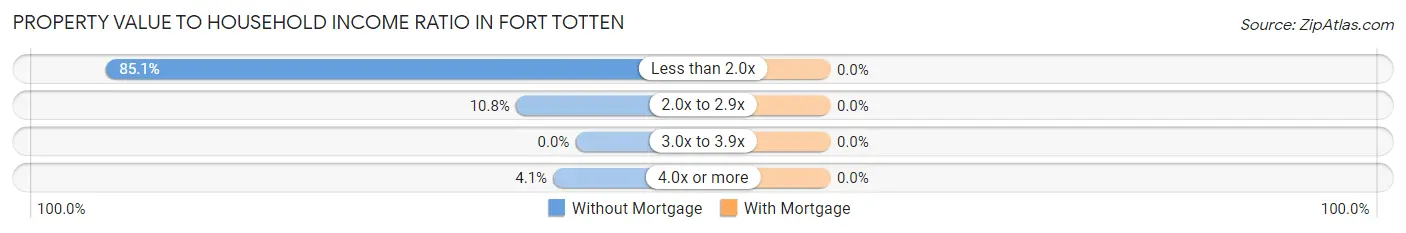
| Value-to-Income Ratio | Without Mortgage | With Mortgage |
| Less than 2.0x | 63 (85.1%) | 0 (0.0%) |
| 2.0x to 2.9x | 8 (10.8%) | 0 (0.0%) |
| 3.0x to 3.9x | 0 (0.0%) | 0 (0.0%) |
| 4.0x or more | 3 (4.1%) | 0 (0.0%) |
| Total | 74 (100.0%) | 0 (0.0%) |
Real Estate Taxes by Mortgage Status in Fort Totten
| Property Taxes | Without Mortgage | With Mortgage |
| Less than $800 | 0 (0.0%) | 0 (0.0%) |
| $800 to $1,499 | 0 (0.0%) | 0 (0.0%) |
| $800 to $1,499 | 0 (0.0%) | 0 (0.0%) |
| Total | 74 (100.0%) | 0 (0.0%) |
Health & Disability in Fort Totten
Health Insurance Coverage by Age in Fort Totten
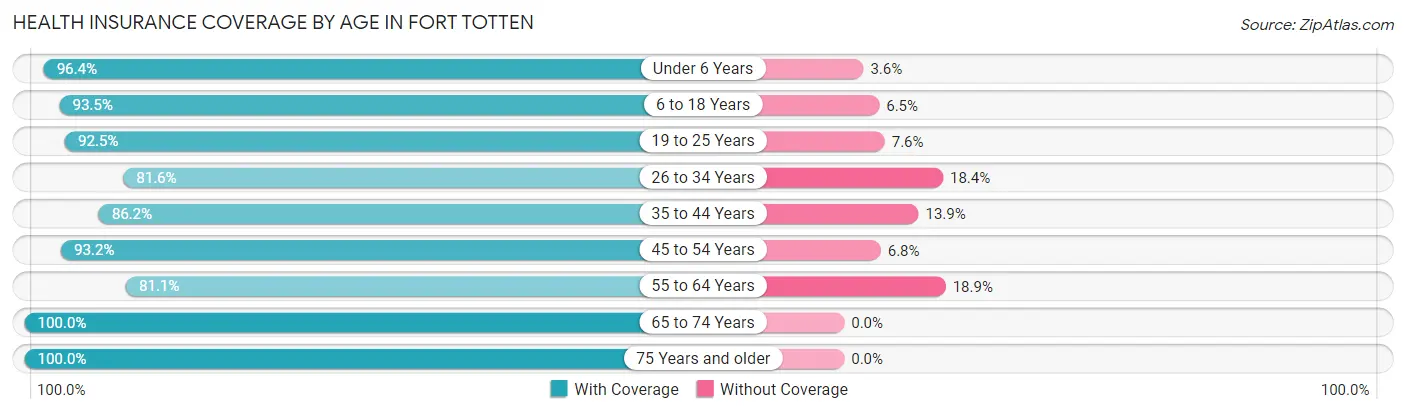
| Age Bracket | With Coverage | Without Coverage |
| Under 6 Years | 269 (96.4%) | 10 (3.6%) |
| 6 to 18 Years | 344 (93.5%) | 24 (6.5%) |
| 19 to 25 Years | 98 (92.4%) | 8 (7.5%) |
| 26 to 34 Years | 31 (81.6%) | 7 (18.4%) |
| 35 to 44 Years | 56 (86.2%) | 9 (13.9%) |
| 45 to 54 Years | 96 (93.2%) | 7 (6.8%) |
| 55 to 64 Years | 30 (81.1%) | 7 (18.9%) |
| 65 to 74 Years | 25 (100.0%) | 0 (0.0%) |
| 75 Years and older | 9 (100.0%) | 0 (0.0%) |
| Total | 958 (93.0%) | 72 (7.0%) |
Health Insurance Coverage by Citizenship Status in Fort Totten
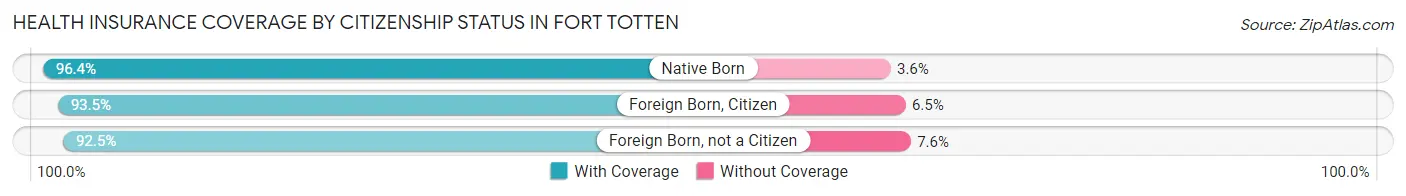
| Citizenship Status | With Coverage | Without Coverage |
| Native Born | 269 (96.4%) | 10 (3.6%) |
| Foreign Born, Citizen | 344 (93.5%) | 24 (6.5%) |
| Foreign Born, not a Citizen | 98 (92.4%) | 8 (7.5%) |
Health Insurance Coverage by Household Income in Fort Totten
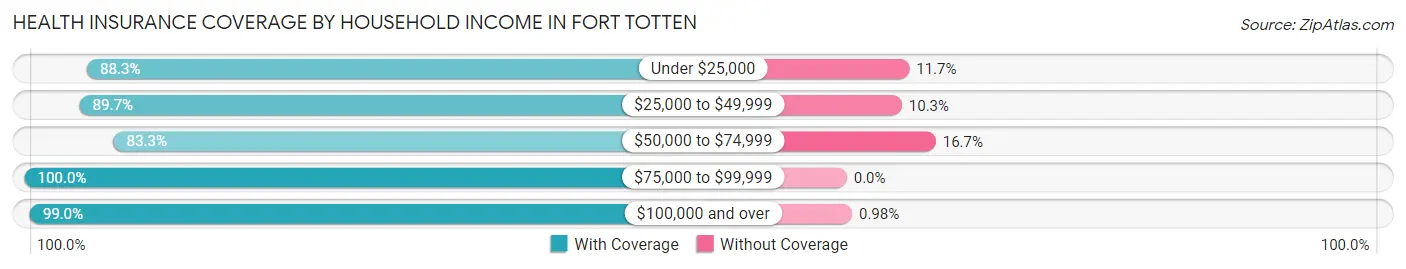
| Household Income | With Coverage | Without Coverage |
| Under $25,000 | 294 (88.3%) | 39 (11.7%) |
| $25,000 to $49,999 | 139 (89.7%) | 16 (10.3%) |
| $50,000 to $74,999 | 65 (83.3%) | 13 (16.7%) |
| $75,000 to $99,999 | 55 (100.0%) | 0 (0.0%) |
| $100,000 and over | 405 (99.0%) | 4 (1.0%) |
Public vs Private Health Insurance Coverage by Age in Fort Totten
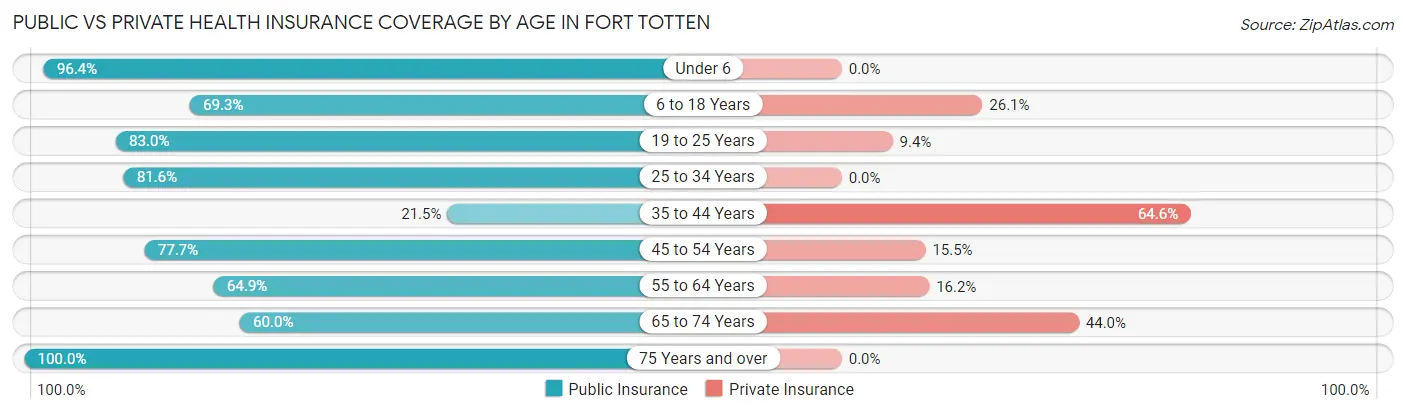
| Age Bracket | Public Insurance | Private Insurance |
| Under 6 | 269 (96.4%) | 0 (0.0%) |
| 6 to 18 Years | 255 (69.3%) | 96 (26.1%) |
| 19 to 25 Years | 88 (83.0%) | 10 (9.4%) |
| 25 to 34 Years | 31 (81.6%) | 0 (0.0%) |
| 35 to 44 Years | 14 (21.5%) | 42 (64.6%) |
| 45 to 54 Years | 80 (77.7%) | 16 (15.5%) |
| 55 to 64 Years | 24 (64.9%) | 6 (16.2%) |
| 65 to 74 Years | 15 (60.0%) | 11 (44.0%) |
| 75 Years and over | 9 (100.0%) | 0 (0.0%) |
| Total | 785 (76.2%) | 181 (17.6%) |
Disability Status by Sex by Age in Fort Totten
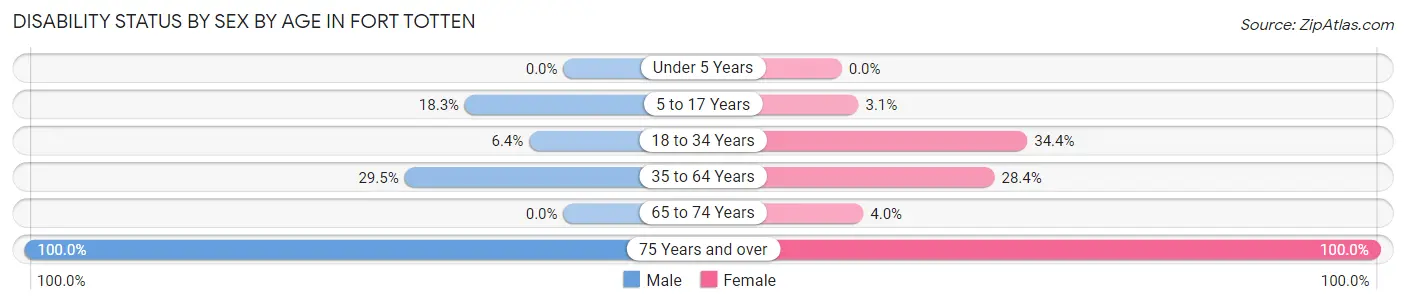
| Age Bracket | Male | Female |
| Under 5 Years | 0 (0.0%) | 0 (0.0%) |
| 5 to 17 Years | 36 (18.3%) | 6 (3.1%) |
| 18 to 34 Years | 4 (6.4%) | 31 (34.4%) |
| 35 to 64 Years | 23 (29.5%) | 36 (28.3%) |
| 65 to 74 Years | 0 (0.0%) | 1 (4.0%) |
| 75 Years and over | 5 (100.0%) | 4 (100.0%) |
Disability Class by Sex by Age in Fort Totten
Disability Class: Hearing Difficulty
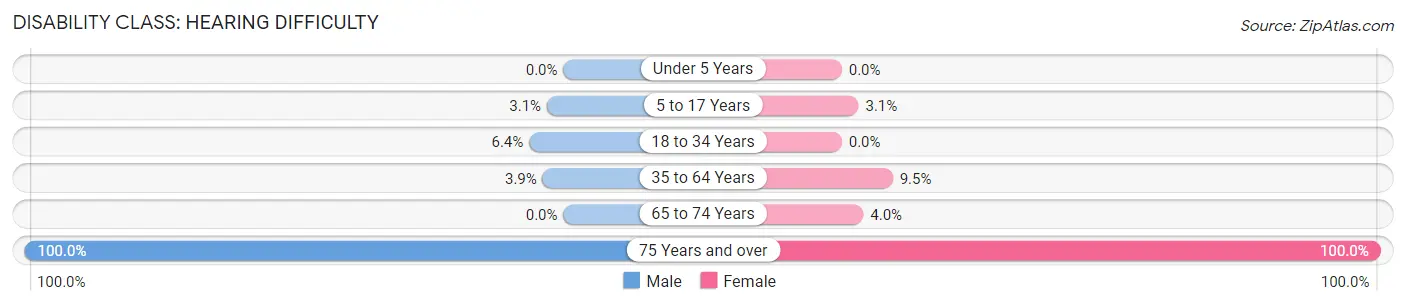
| Age Bracket | Male | Female |
| Under 5 Years | 0 (0.0%) | 0 (0.0%) |
| 5 to 17 Years | 6 (3.0%) | 6 (3.1%) |
| 18 to 34 Years | 4 (6.4%) | 0 (0.0%) |
| 35 to 64 Years | 3 (3.8%) | 12 (9.5%) |
| 65 to 74 Years | 0 (0.0%) | 1 (4.0%) |
| 75 Years and over | 5 (100.0%) | 4 (100.0%) |
Disability Class: Vision Difficulty
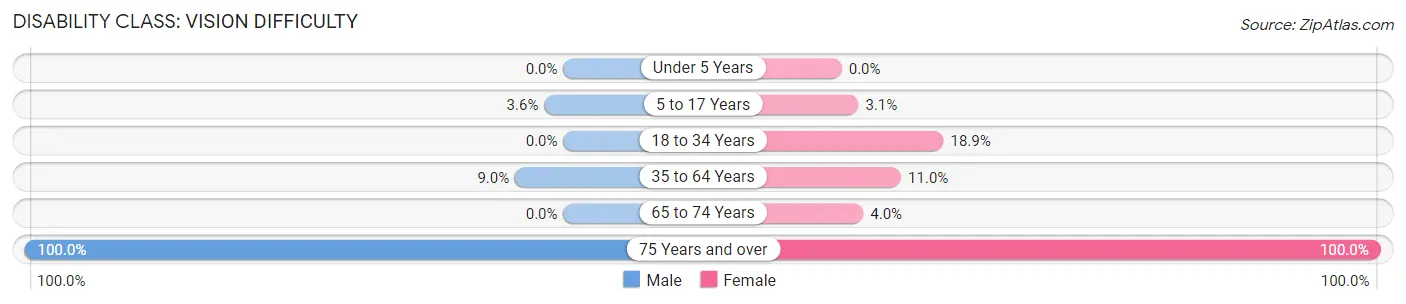
| Age Bracket | Male | Female |
| Under 5 Years | 0 (0.0%) | 0 (0.0%) |
| 5 to 17 Years | 7 (3.5%) | 6 (3.1%) |
| 18 to 34 Years | 0 (0.0%) | 17 (18.9%) |
| 35 to 64 Years | 7 (9.0%) | 14 (11.0%) |
| 65 to 74 Years | 0 (0.0%) | 1 (4.0%) |
| 75 Years and over | 5 (100.0%) | 4 (100.0%) |
Disability Class: Cognitive Difficulty
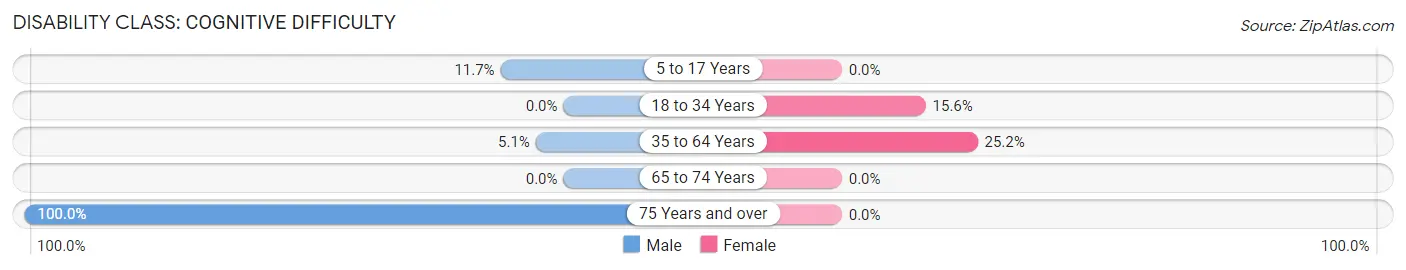
| Age Bracket | Male | Female |
| 5 to 17 Years | 23 (11.7%) | 0 (0.0%) |
| 18 to 34 Years | 0 (0.0%) | 14 (15.6%) |
| 35 to 64 Years | 4 (5.1%) | 32 (25.2%) |
| 65 to 74 Years | 0 (0.0%) | 0 (0.0%) |
| 75 Years and over | 5 (100.0%) | 0 (0.0%) |
Disability Class: Ambulatory Difficulty
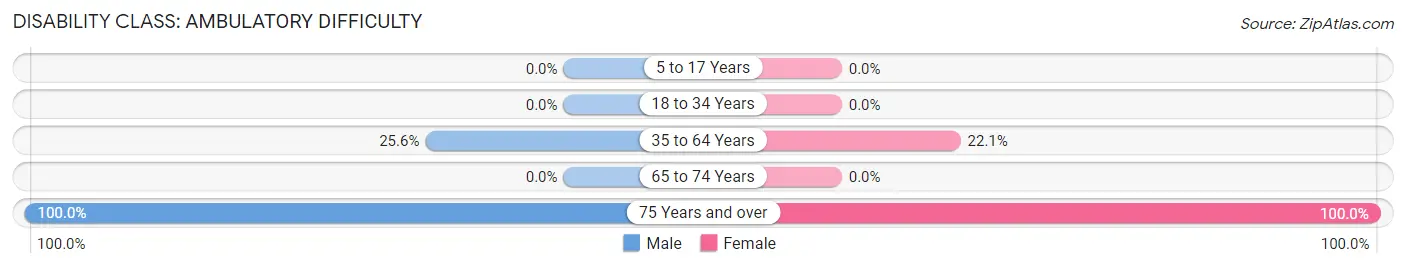
| Age Bracket | Male | Female |
| 5 to 17 Years | 0 (0.0%) | 0 (0.0%) |
| 18 to 34 Years | 0 (0.0%) | 0 (0.0%) |
| 35 to 64 Years | 20 (25.6%) | 28 (22.1%) |
| 65 to 74 Years | 0 (0.0%) | 0 (0.0%) |
| 75 Years and over | 5 (100.0%) | 4 (100.0%) |
Disability Class: Self-Care Difficulty
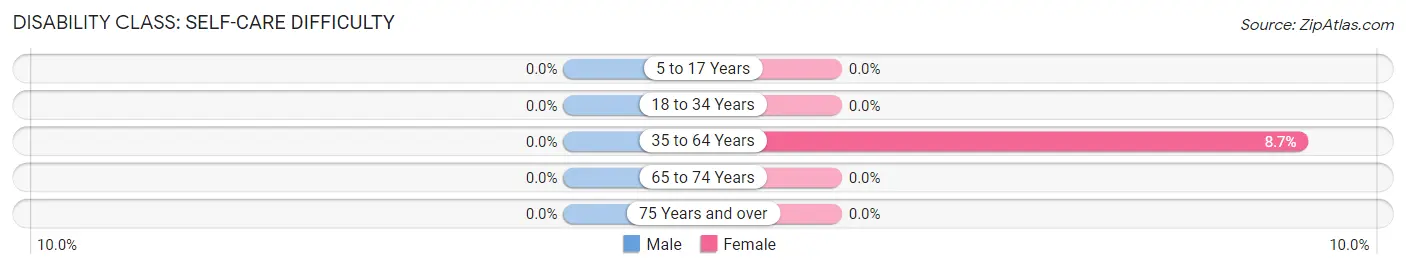
| Age Bracket | Male | Female |
| 5 to 17 Years | 0 (0.0%) | 0 (0.0%) |
| 18 to 34 Years | 0 (0.0%) | 0 (0.0%) |
| 35 to 64 Years | 0 (0.0%) | 11 (8.7%) |
| 65 to 74 Years | 0 (0.0%) | 0 (0.0%) |
| 75 Years and over | 0 (0.0%) | 0 (0.0%) |
Technology Access in Fort Totten
Computing Device Access in Fort Totten
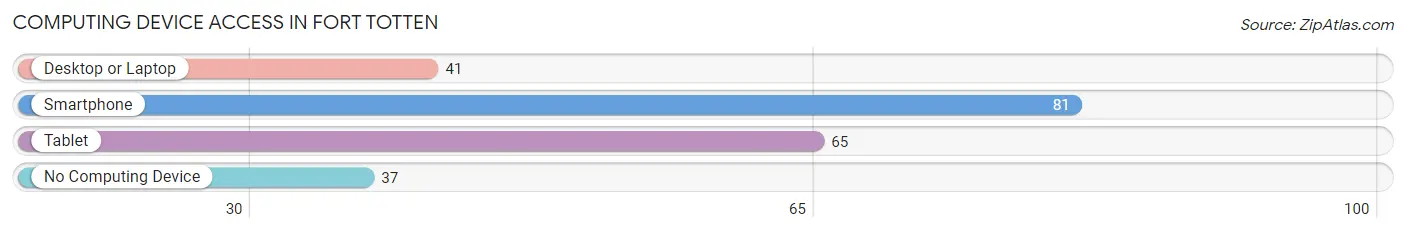
| Device Type | # Households | % Households |
| Desktop or Laptop | 41 | 28.3% |
| Smartphone | 81 | 55.9% |
| Tablet | 65 | 44.8% |
| No Computing Device | 37 | 25.5% |
| Total | 145 | 100.0% |
Internet Access in Fort Totten
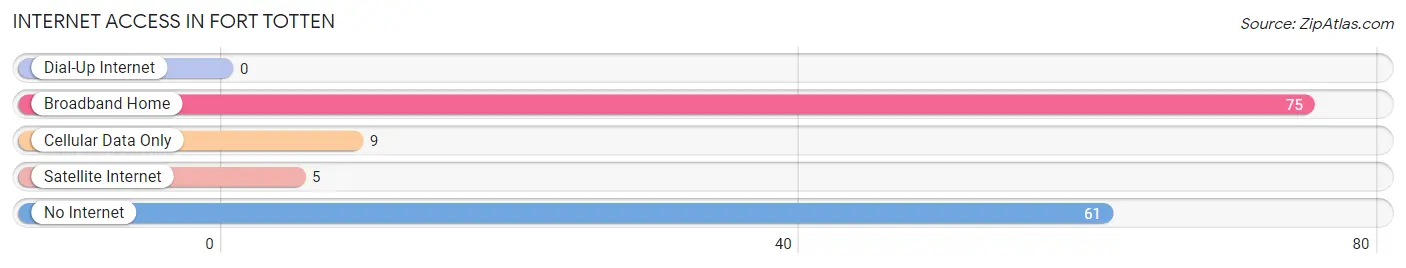
| Internet Type | # Households | % Households |
| Dial-Up Internet | 0 | 0.0% |
| Broadband Home | 75 | 51.7% |
| Cellular Data Only | 9 | 6.2% |
| Satellite Internet | 5 | 3.5% |
| No Internet | 61 | 42.1% |
| Total | 145 | 100.0% |
Fort Totten Summary
Fort Totten is a small unincorporated community located in the Spirit Lake Indian Reservation in Benson County, North Dakota. It is located approximately 10 miles north of Devils Lake and is home to the Spirit Lake Tribe. The community was named after General George Crook's Fort Totten, which was located nearby.
History
Fort Totten was established in 1867 as a military post to protect the Spirit Lake Tribe from hostile Sioux and Chippewa Indians. The fort was named after General George Crook, who was in charge of the military operations in the area. The fort was abandoned in 1877, but the community of Fort Totten remained.
In 1884, the Spirit Lake Tribe was relocated to the Fort Totten Reservation. The reservation was established by the United States government to provide a safe haven for the tribe. The reservation was originally 1,200 acres, but was later expanded to over 10,000 acres.
The community of Fort Totten was incorporated in 1887. The town was home to a variety of businesses, including a hotel, a general store, a post office, a blacksmith shop, and a saloon. The town also had a school, a church, and a jail.
In the early 1900s, the town began to decline. The population decreased and businesses began to close. In the 1950s, the town was revitalized with the construction of a new school and the opening of a casino.
Geography
Fort Totten is located in the Spirit Lake Indian Reservation in Benson County, North Dakota. The town is situated on the banks of the Spirit Lake, which is part of the Devils Lake Basin. The town is located approximately 10 miles north of Devils Lake and is surrounded by rolling hills and prairies.
The climate in Fort Totten is continental, with cold winters and hot summers. The average annual temperature is 45°F (7°C). The average annual precipitation is 17 inches (43 cm).
Economy
The economy of Fort Totten is largely based on tourism and the Spirit Lake Casino. The casino is the largest employer in the town and provides jobs for many of the residents. Other businesses in the town include a grocery store, a gas station, a hardware store, and a restaurant.
The town is also home to a variety of small businesses, including a bakery, a barber shop, a beauty salon, and a gift shop. The town also has a post office and a library.
Demographics
As of the 2010 census, the population of Fort Totten was 1,093. The population is predominantly Native American, with the majority of the population being members of the Spirit Lake Tribe. The median age of the population is 33.7 years.
The median household income in Fort Totten is $30,000. The median home value is $90,000. The town has a poverty rate of 28.3%.
Conclusion
Fort Totten is a small unincorporated community located in the Spirit Lake Indian Reservation in Benson County, North Dakota. The town was established in 1867 as a military post and was later incorporated in 1887. The town is home to the Spirit Lake Tribe and is largely supported by tourism and the Spirit Lake Casino. The population of Fort Totten is predominantly Native American, with the majority of the population being members of the Spirit Lake Tribe. The median household income in Fort Totten is $30,000 and the median home value is $90,000.
Common Questions
What is Per Capita Income in Fort Totten?
Per Capita income in Fort Totten is $8,232.
What is the Median Family Income in Fort Totten?
Median Family Income in Fort Totten is $27,500.
What is the Median Household income in Fort Totten?
Median Household Income in Fort Totten is $30,234.
What is Inequality or Gini Index in Fort Totten?
Inequality or Gini Index in Fort Totten is 0.54.
What is the Total Population of Fort Totten?
Total Population of Fort Totten is 1,042.
What is the Total Male Population of Fort Totten?
Total Male Population of Fort Totten is 472.
What is the Total Female Population of Fort Totten?
Total Female Population of Fort Totten is 570.
What is the Ratio of Males per 100 Females in Fort Totten?
There are 82.81 Males per 100 Females in Fort Totten.
What is the Ratio of Females per 100 Males in Fort Totten?
There are 120.76 Females per 100 Males in Fort Totten.
What is the Median Population Age in Fort Totten?
Median Population Age in Fort Totten is 14.1 Years.
What is the Average Family Size in Fort Totten
Average Family Size in Fort Totten is 7.6 People.
What is the Average Household Size in Fort Totten
Average Household Size in Fort Totten is 7.1 People.
How Large is the Labor Force in Fort Totten?
There are 162 People in the Labor Forcein in Fort Totten.
What is the Percentage of People in the Labor Force in Fort Totten?
35.2% of People are in the Labor Force in Fort Totten.
What is the Unemployment Rate in Fort Totten?
Unemployment Rate in Fort Totten is 6.2%.