Oakvale, WV Map & Demographics
Oakvale Map
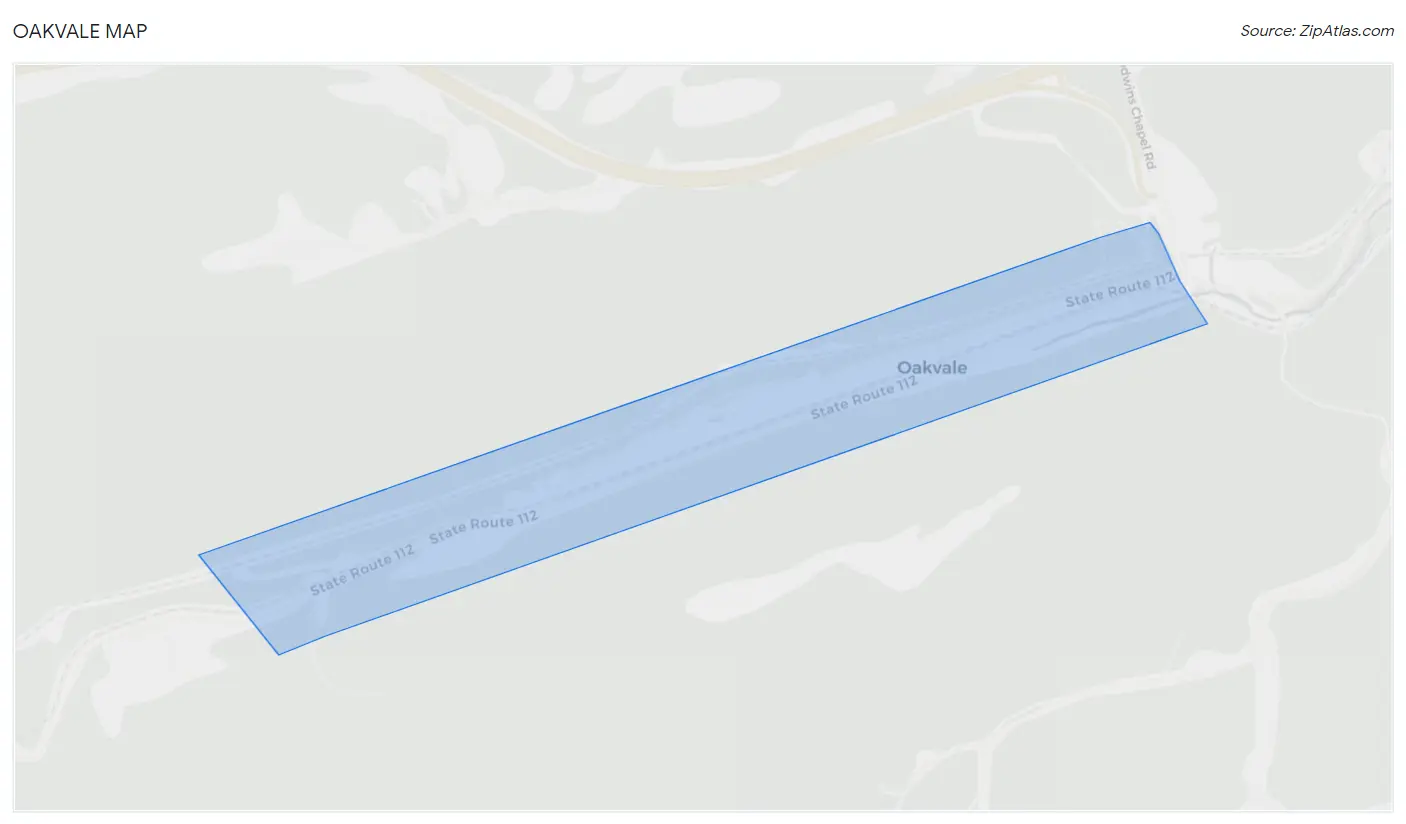
Oakvale Overview
$14,063
PER CAPITA INCOME
24.5%
WAGE / INCOME GAP [ % ]
75.5¢/ $1
WAGE / INCOME GAP [ $ ]
$9,380
FAMILY INCOME DEFICIT
0.48
INEQUALITY / GINI INDEX
214
TOTAL POPULATION
101
MALE POPULATION
113
FEMALE POPULATION
89.38
MALES / 100 FEMALES
111.88
FEMALES / 100 MALES
11.8
MEDIAN AGE
4.3
AVG FAMILY SIZE
4.3
AVG HOUSEHOLD SIZE
60
LABOR FORCE [ PEOPLE ]
65.2%
PERCENT IN LABOR FORCE
11.7%
UNEMPLOYMENT RATE
Oakvale Area Codes
Income in Oakvale
Income Overview in Oakvale
| Characteristic | Number | Measure |
| Per Capita Income | 214 | $14,063 |
| Median Family Income | 47 | $0 |
| Mean Family Income | 47 | $52,638 |
| Median Household Income | 50 | $0 |
| Mean Household Income | 50 | $52,336 |
| Income Deficit | 47 | $9,380 |
| Wage / Income Gap (%) | 214 | 24.51% |
| Wage / Income Gap ($) | 214 | 75.49¢ per $1 |
| Gini / Inequality Index | 214 | 0.48 |
Earnings by Sex in Oakvale
Average Earnings in Oakvale are $27,212, $34,773 for men and $26,250 for women, a difference of 24.5%.
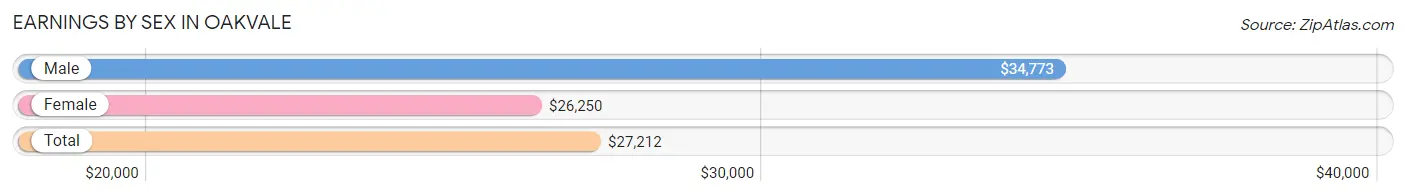
| Sex | Number | Average Earnings |
| Male | 20 (35.7%) | $34,773 |
| Female | 36 (64.3%) | $26,250 |
| Total | 56 (100.0%) | $27,212 |
Earnings by Sex by Income Bracket in Oakvale
The most common earnings brackets in Oakvale are $30,000 to $34,999 for men (11 | 55.0%) and $25,000 to $29,999 for women (26 | 72.2%).
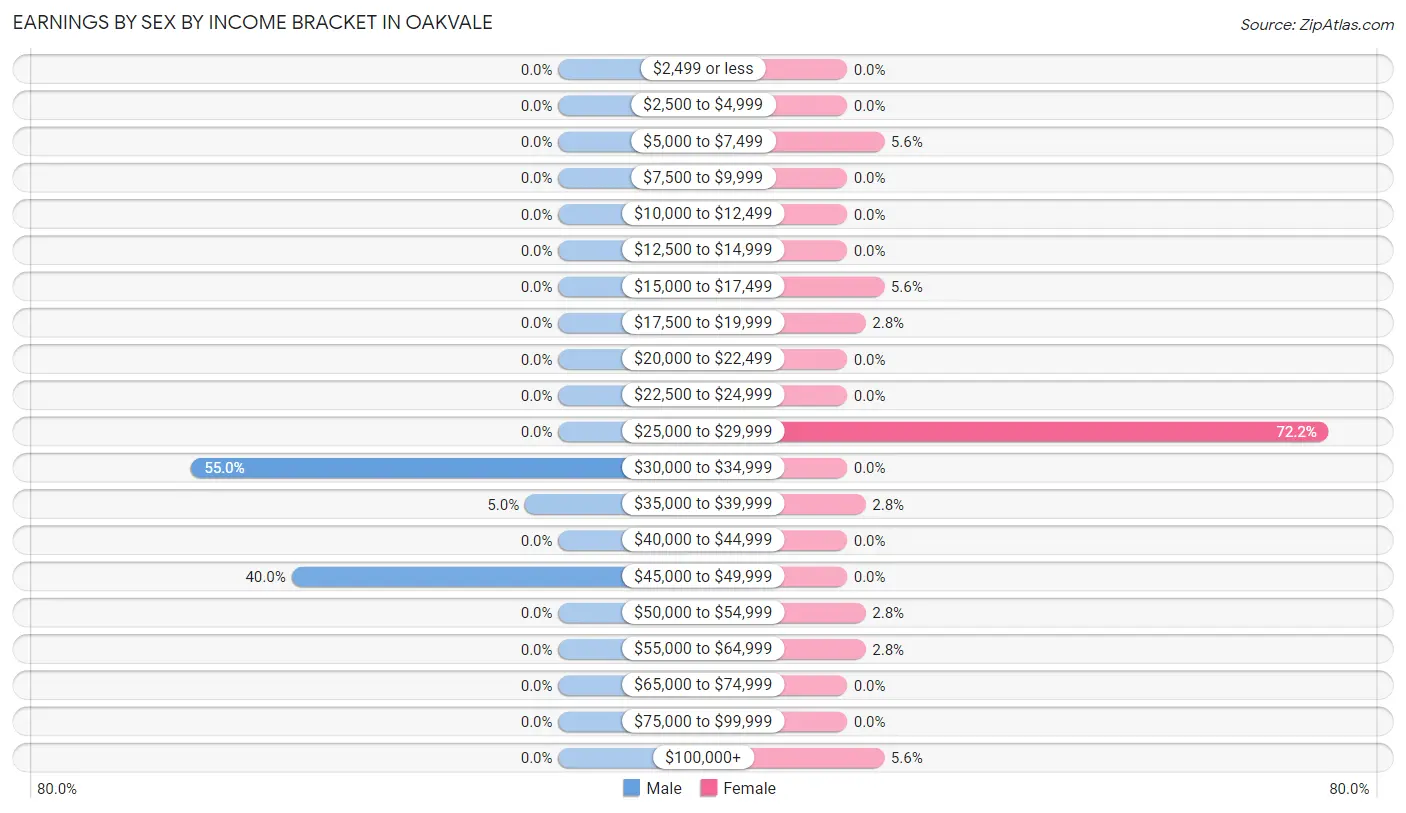
| Income | Male | Female |
| $2,499 or less | 0 (0.0%) | 0 (0.0%) |
| $2,500 to $4,999 | 0 (0.0%) | 0 (0.0%) |
| $5,000 to $7,499 | 0 (0.0%) | 2 (5.6%) |
| $7,500 to $9,999 | 0 (0.0%) | 0 (0.0%) |
| $10,000 to $12,499 | 0 (0.0%) | 0 (0.0%) |
| $12,500 to $14,999 | 0 (0.0%) | 0 (0.0%) |
| $15,000 to $17,499 | 0 (0.0%) | 2 (5.6%) |
| $17,500 to $19,999 | 0 (0.0%) | 1 (2.8%) |
| $20,000 to $22,499 | 0 (0.0%) | 0 (0.0%) |
| $22,500 to $24,999 | 0 (0.0%) | 0 (0.0%) |
| $25,000 to $29,999 | 0 (0.0%) | 26 (72.2%) |
| $30,000 to $34,999 | 11 (55.0%) | 0 (0.0%) |
| $35,000 to $39,999 | 1 (5.0%) | 1 (2.8%) |
| $40,000 to $44,999 | 0 (0.0%) | 0 (0.0%) |
| $45,000 to $49,999 | 8 (40.0%) | 0 (0.0%) |
| $50,000 to $54,999 | 0 (0.0%) | 1 (2.8%) |
| $55,000 to $64,999 | 0 (0.0%) | 1 (2.8%) |
| $65,000 to $74,999 | 0 (0.0%) | 0 (0.0%) |
| $75,000 to $99,999 | 0 (0.0%) | 0 (0.0%) |
| $100,000+ | 0 (0.0%) | 2 (5.6%) |
| Total | 20 (100.0%) | 36 (100.0%) |
Earnings by Sex by Educational Attainment in Oakvale
Average earnings in Oakvale are $34,773 for men and $26,346 for women, a difference of 24.2%. Men with an educational attainment of high school diploma enjoy the highest average annual earnings of $34,773, while those with high school diploma education earn the least with $34,773. Women with an educational attainment of high school diploma earn the most with the average annual earnings of $26,250, while those with high school diploma education have the smallest earnings of $26,250.
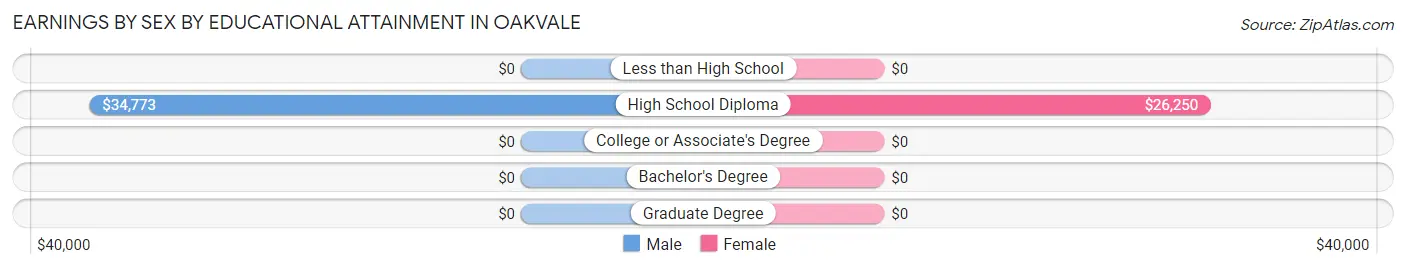
| Educational Attainment | Male Income | Female Income |
| Less than High School | - | - |
| High School Diploma | $34,773 | $26,250 |
| College or Associate's Degree | - | - |
| Bachelor's Degree | - | - |
| Graduate Degree | - | - |
| Total | $34,773 | $26,346 |
Family Income in Oakvale
Family Income Brackets in Oakvale
According to the Oakvale family income data, there are 27 families falling into the $25,000 to $34,999 income range, which is the most common income bracket and makes up 57.5% of all families.
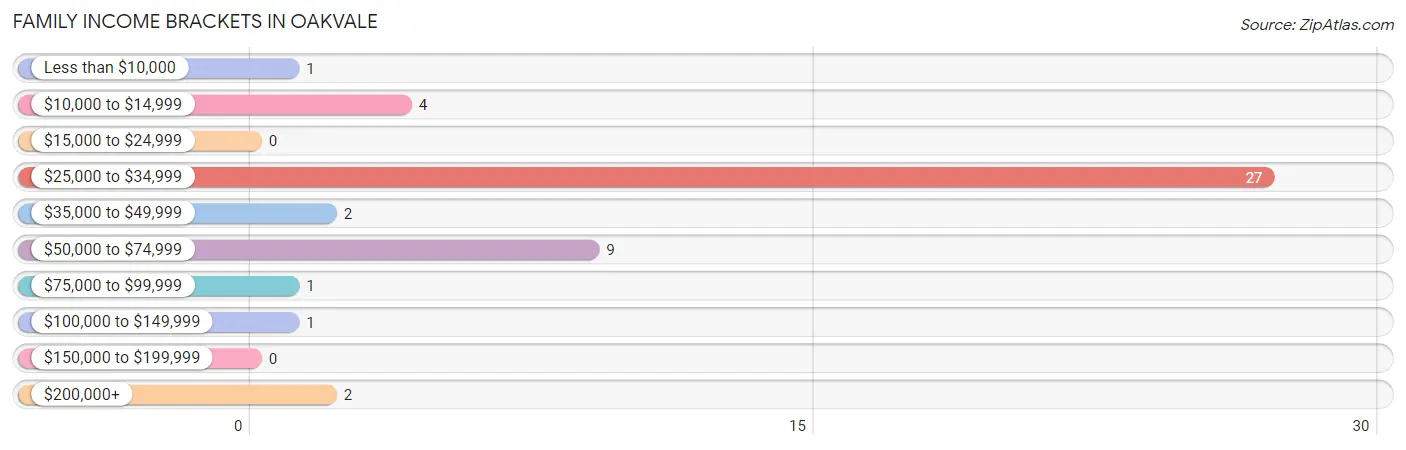
| Income Bracket | # Families | % Families |
| Less than $10,000 | 1 | 2.1% |
| $10,000 to $14,999 | 4 | 8.5% |
| $15,000 to $24,999 | 0 | 0.0% |
| $25,000 to $34,999 | 27 | 57.4% |
| $35,000 to $49,999 | 2 | 4.3% |
| $50,000 to $74,999 | 9 | 19.1% |
| $75,000 to $99,999 | 1 | 2.1% |
| $100,000 to $149,999 | 1 | 2.1% |
| $150,000 to $199,999 | 0 | 0.0% |
| $200,000+ | 2 | 4.3% |
Family Income by Famaliy Size in Oakvale
2-person families (11 | 23.4%) account for the highest median family income in Oakvale with $60,750 per family, while 2-person families (11 | 23.4%) have the highest median income of $30,375 per family member.
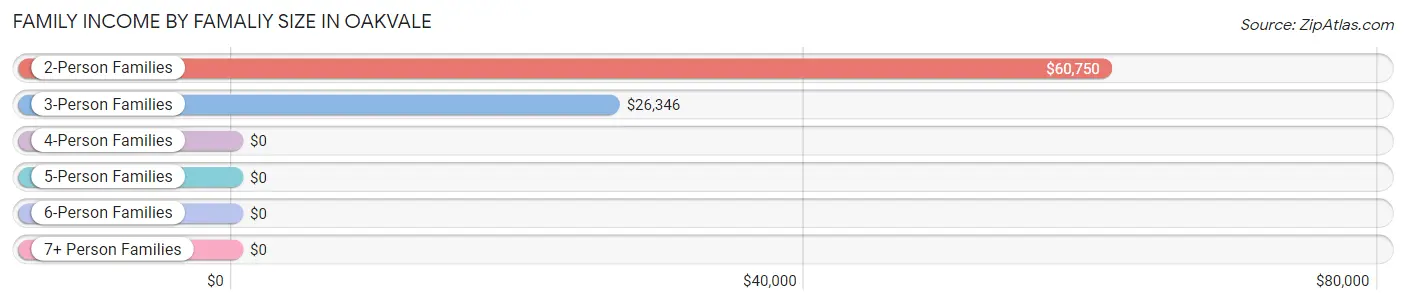
| Income Bracket | # Families | Median Income |
| 2-Person Families | 11 (23.4%) | $60,750 |
| 3-Person Families | 32 (68.1%) | $26,346 |
| 4-Person Families | 3 (6.4%) | $0 |
| 5-Person Families | 0 (0.0%) | $0 |
| 6-Person Families | 1 (2.1%) | $0 |
| 7+ Person Families | 0 (0.0%) | $0 |
| Total | 47 (100.0%) | $0 |
Family Income by Number of Earners in Oakvale
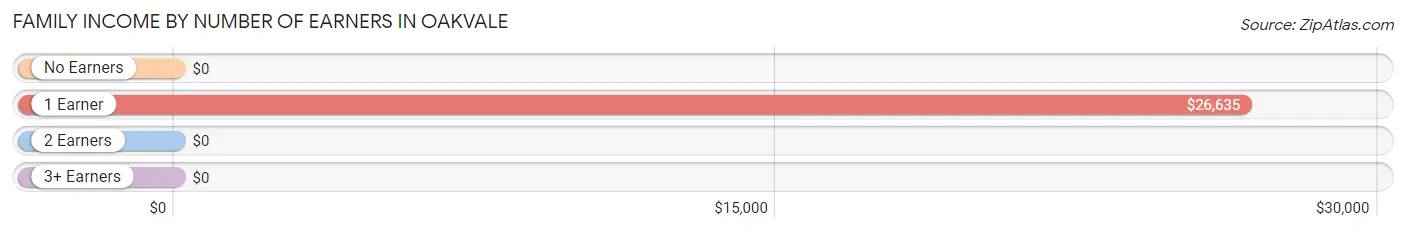
| Number of Earners | # Families | Median Income |
| No Earners | 11 (23.4%) | $0 |
| 1 Earner | 34 (72.3%) | $26,635 |
| 2 Earners | 2 (4.3%) | $0 |
| 3+ Earners | 0 (0.0%) | $0 |
| Total | 47 (100.0%) | $0 |
Household Income in Oakvale
Household Income Brackets in Oakvale
With 27 households falling in the category, the $25,000 to $34,999 income range is the most frequent in Oakvale, accounting for 54.0% of all households.
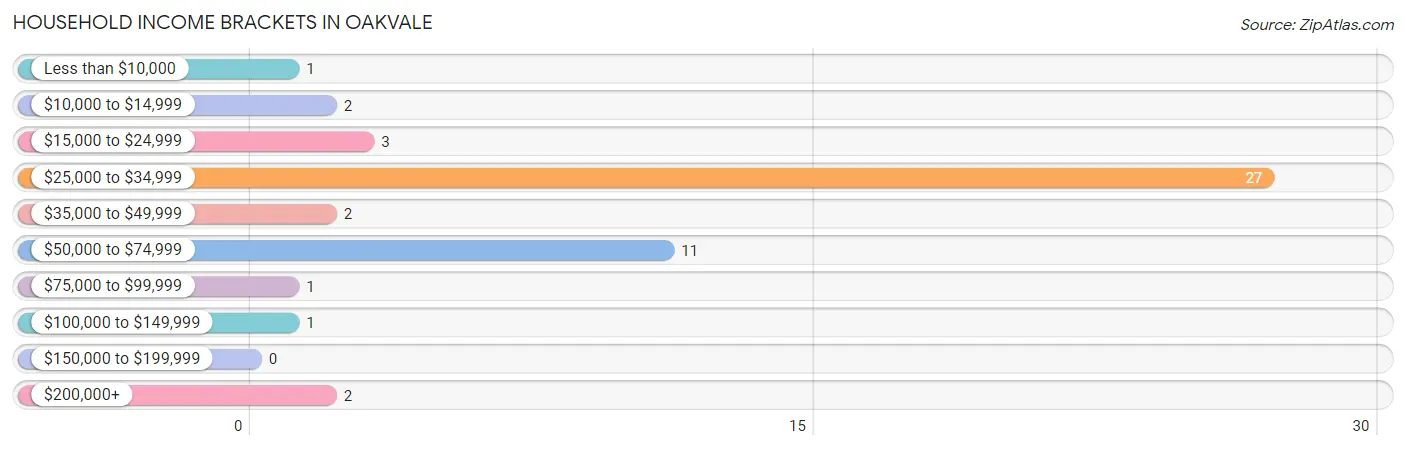
| Income Bracket | # Households | % Households |
| Less than $10,000 | 1 | 2.0% |
| $10,000 to $14,999 | 2 | 4.0% |
| $15,000 to $24,999 | 3 | 6.0% |
| $25,000 to $34,999 | 27 | 54.0% |
| $35,000 to $49,999 | 2 | 4.0% |
| $50,000 to $74,999 | 11 | 22.0% |
| $75,000 to $99,999 | 1 | 2.0% |
| $100,000 to $149,999 | 1 | 2.0% |
| $150,000 to $199,999 | 0 | 0.0% |
| $200,000+ | 2 | 4.0% |
Household Income by Householder Age in Oakvale
The median household income in Oakvale is $0, with the highest median household income of $61,250 found in the 65+ years age bracket for the primary householder. A total of 7 households (14.0%) fall into this category.
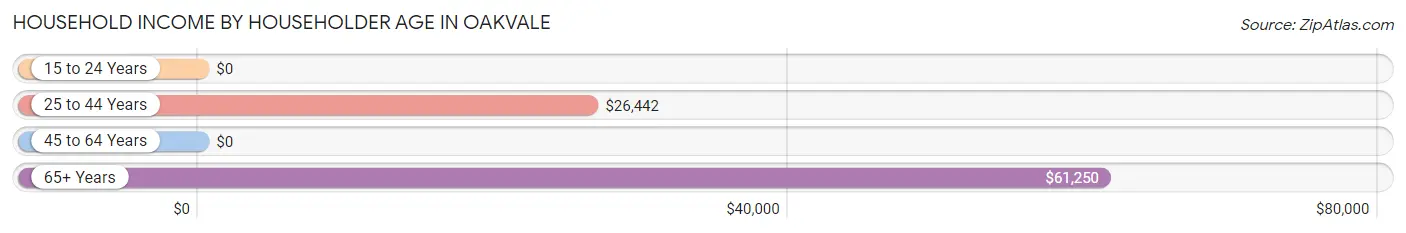
| Income Bracket | # Households | Median Income |
| 15 to 24 Years | 0 (0.0%) | $0 |
| 25 to 44 Years | 30 (60.0%) | $26,442 |
| 45 to 64 Years | 13 (26.0%) | $0 |
| 65+ Years | 7 (14.0%) | $61,250 |
| Total | 50 (100.0%) | $0 |
Poverty in Oakvale
Income Below Poverty by Sex and Age in Oakvale
With 3.1% poverty level for males and 12.4% for females among the residents of Oakvale, 18 to 24 year old males and 15 year old females are the most vulnerable to poverty, with 1 males (100.0%) and 2 females (100.0%) in their respective age groups living below the poverty level.
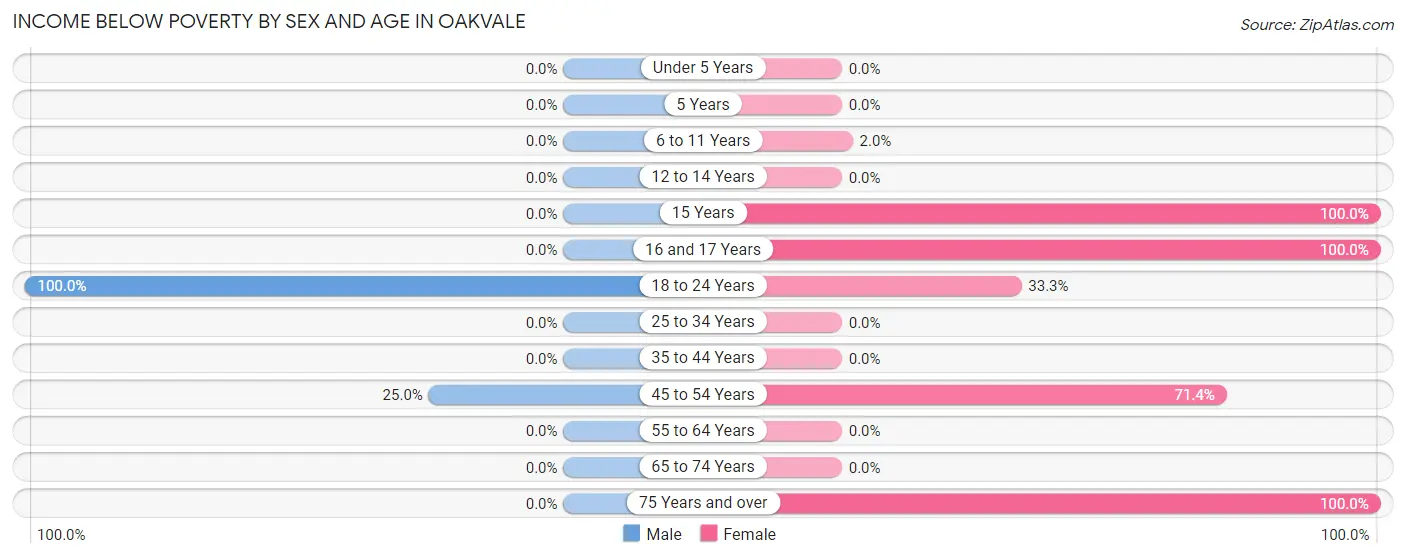
| Age Bracket | Male | Female |
| Under 5 Years | 0 (0.0%) | 0 (0.0%) |
| 5 Years | 0 (0.0%) | 0 (0.0%) |
| 6 to 11 Years | 0 (0.0%) | 1 (2.0%) |
| 12 to 14 Years | 0 (0.0%) | 0 (0.0%) |
| 15 Years | 0 (0.0%) | 2 (100.0%) |
| 16 and 17 Years | 0 (0.0%) | 2 (100.0%) |
| 18 to 24 Years | 1 (100.0%) | 2 (33.3%) |
| 25 to 34 Years | 0 (0.0%) | 0 (0.0%) |
| 35 to 44 Years | 0 (0.0%) | 0 (0.0%) |
| 45 to 54 Years | 2 (25.0%) | 5 (71.4%) |
| 55 to 64 Years | 0 (0.0%) | 0 (0.0%) |
| 65 to 74 Years | 0 (0.0%) | 0 (0.0%) |
| 75 Years and over | 0 (0.0%) | 2 (100.0%) |
| Total | 3 (3.1%) | 14 (12.4%) |
Income Above Poverty by Sex and Age in Oakvale
According to the poverty statistics in Oakvale, males aged under 5 years and females aged 25 to 34 years are the age groups that are most secure financially, with 100.0% of males and 100.0% of females in these age groups living above the poverty line.
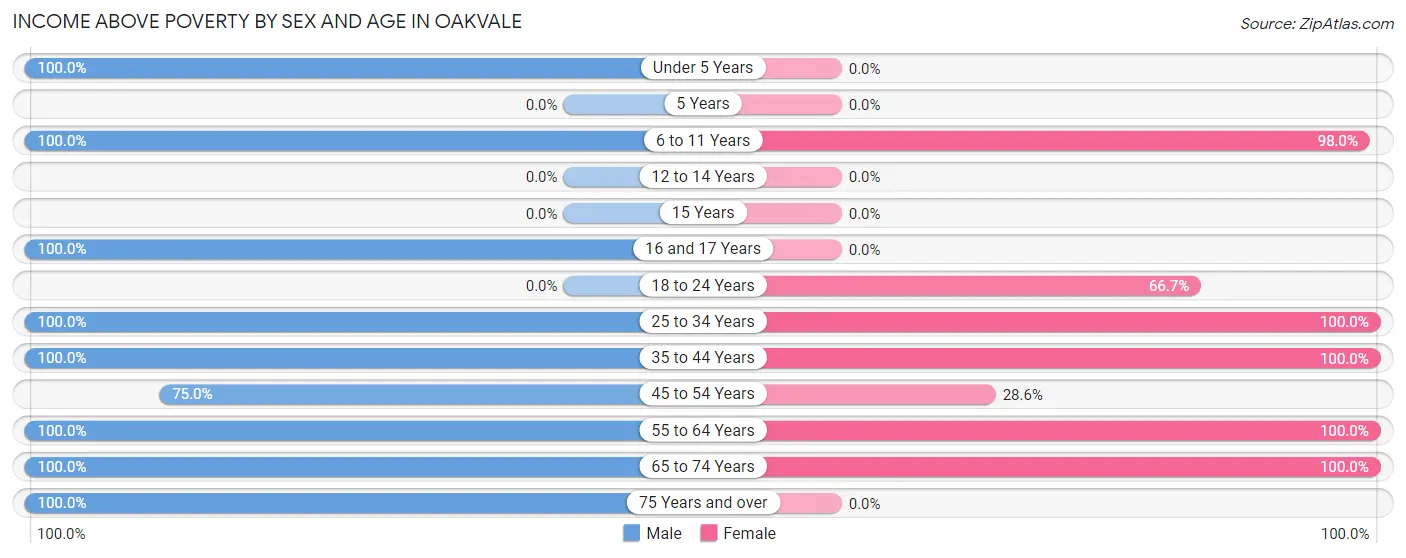
| Age Bracket | Male | Female |
| Under 5 Years | 3 (100.0%) | 0 (0.0%) |
| 5 Years | 0 (0.0%) | 0 (0.0%) |
| 6 to 11 Years | 62 (100.0%) | 49 (98.0%) |
| 12 to 14 Years | 0 (0.0%) | 0 (0.0%) |
| 15 Years | 0 (0.0%) | 0 (0.0%) |
| 16 and 17 Years | 1 (100.0%) | 0 (0.0%) |
| 18 to 24 Years | 0 (0.0%) | 4 (66.7%) |
| 25 to 34 Years | 13 (100.0%) | 4 (100.0%) |
| 35 to 44 Years | 1 (100.0%) | 27 (100.0%) |
| 45 to 54 Years | 6 (75.0%) | 2 (28.6%) |
| 55 to 64 Years | 2 (100.0%) | 8 (100.0%) |
| 65 to 74 Years | 1 (100.0%) | 5 (100.0%) |
| 75 Years and over | 4 (100.0%) | 0 (0.0%) |
| Total | 93 (96.9%) | 99 (87.6%) |
Income Below Poverty Among Married-Couple Families in Oakvale
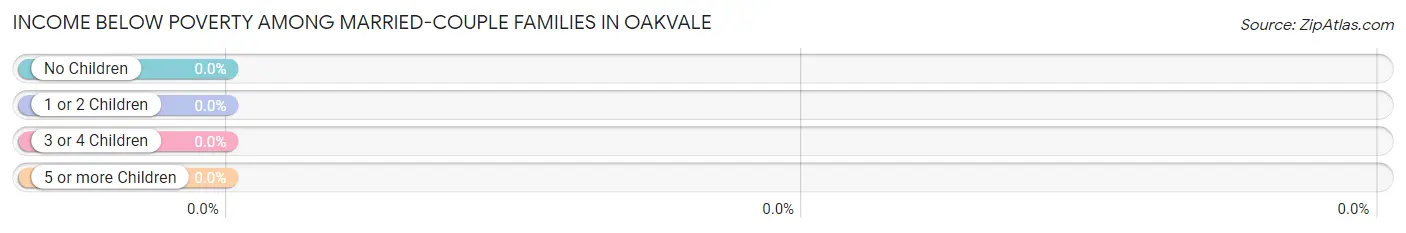
| Children | Above Poverty | Below Poverty |
| No Children | 7 (100.0%) | 0 (0.0%) |
| 1 or 2 Children | 2 (100.0%) | 0 (0.0%) |
| 3 or 4 Children | 1 (100.0%) | 0 (0.0%) |
| 5 or more Children | 0 (0.0%) | 0 (0.0%) |
| Total | 10 (100.0%) | 0 (0.0%) |
Income Below Poverty Among Single-Parent Households in Oakvale
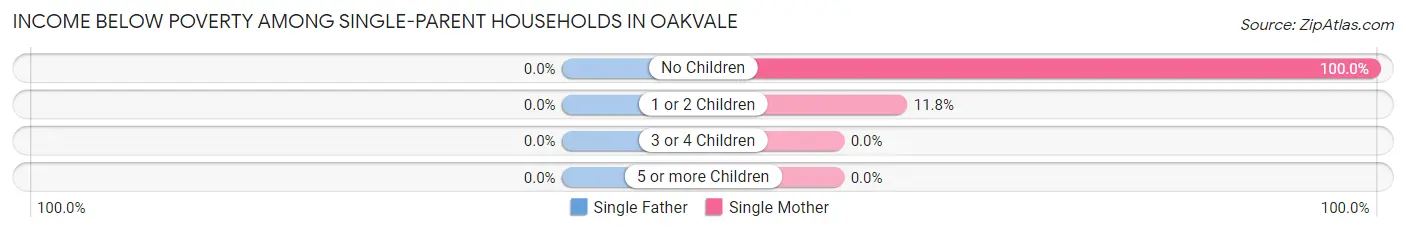
| Children | Single Father | Single Mother |
| No Children | 0 (0.0%) | 1 (100.0%) |
| 1 or 2 Children | 0 (0.0%) | 4 (11.8%) |
| 3 or 4 Children | 0 (0.0%) | 0 (0.0%) |
| 5 or more Children | 0 (0.0%) | 0 (0.0%) |
| Total | 0 (0.0%) | 5 (14.3%) |
Income Below Poverty Among Married-Couple vs Single-Parent Households in Oakvale
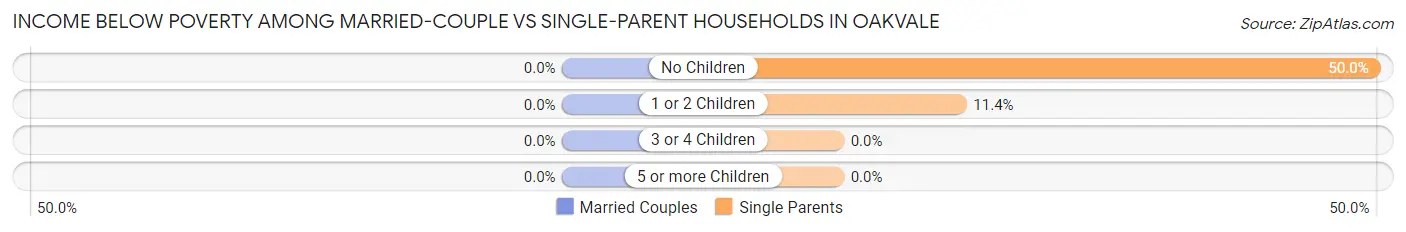
| Children | Married-Couple Families | Single-Parent Households |
| No Children | 0 (0.0%) | 1 (50.0%) |
| 1 or 2 Children | 0 (0.0%) | 4 (11.4%) |
| 3 or 4 Children | 0 (0.0%) | 0 (0.0%) |
| 5 or more Children | 0 (0.0%) | 0 (0.0%) |
| Total | 0 (0.0%) | 5 (13.5%) |
Race in Oakvale
The most populous races in Oakvale are White / Caucasian (210 | 98.1%), Asian (3 | 1.4%), and Native / Alaskan (1 | 0.5%).
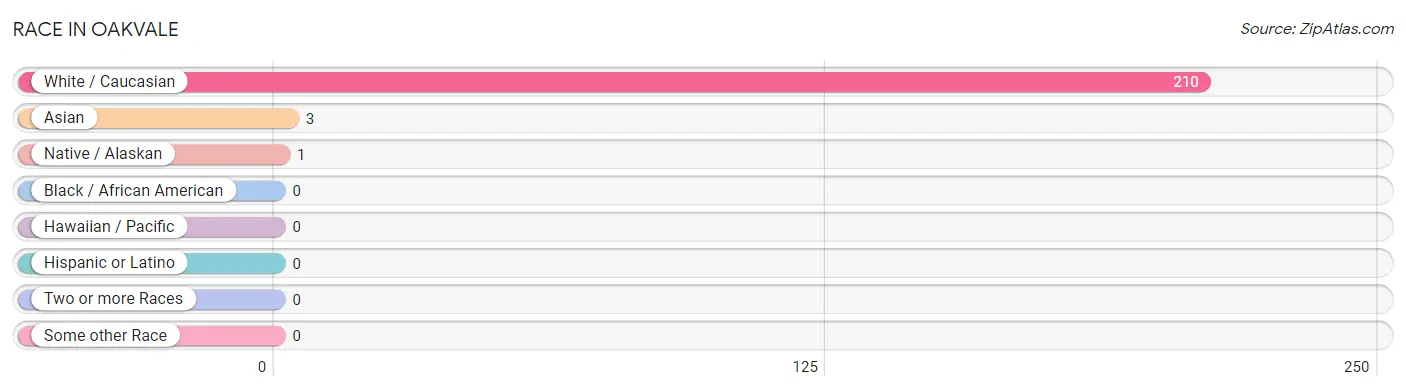
| Race | # Population | % Population |
| Asian | 3 | 1.4% |
| Black / African American | 0 | 0.0% |
| Hawaiian / Pacific | 0 | 0.0% |
| Hispanic or Latino | 0 | 0.0% |
| Native / Alaskan | 1 | 0.5% |
| White / Caucasian | 210 | 98.1% |
| Two or more Races | 0 | 0.0% |
| Some other Race | 0 | 0.0% |
| Total | 214 | 100.0% |
Ancestry in Oakvale
The most populous ancestries reported in Oakvale are English (133 | 62.2%), American (42 | 19.6%), Irish (10 | 4.7%), Korean (3 | 1.4%), and German (2 | 0.9%), together accounting for 88.8% of all Oakvale residents.
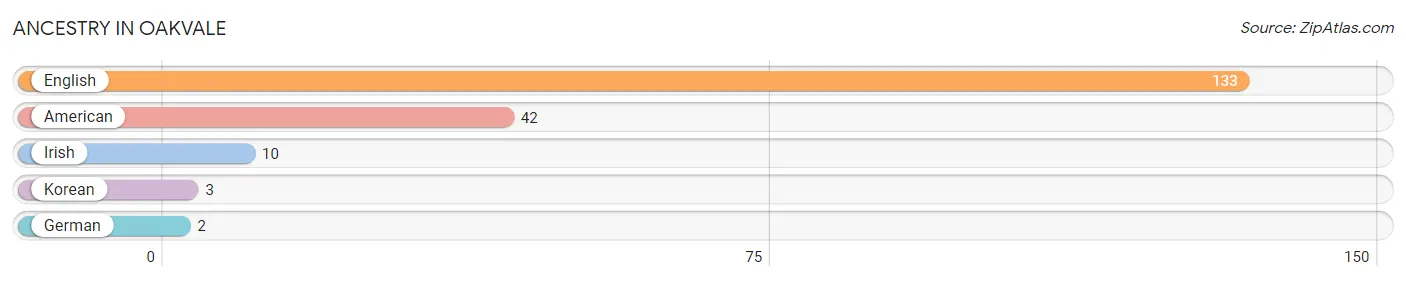
| Ancestry | # Population | % Population |
| American | 42 | 19.6% |
| English | 133 | 62.2% |
| German | 2 | 0.9% |
| Irish | 10 | 4.7% |
| Korean | 3 | 1.4% | View All 5 Rows |
Immigrants in Oakvale
The most numerous immigrant groups reported in Oakvale came from Asia (3 | 1.4%), Philippines (3 | 1.4%), and South Eastern Asia (3 | 1.4%), together accounting for 4.2% of all Oakvale residents.
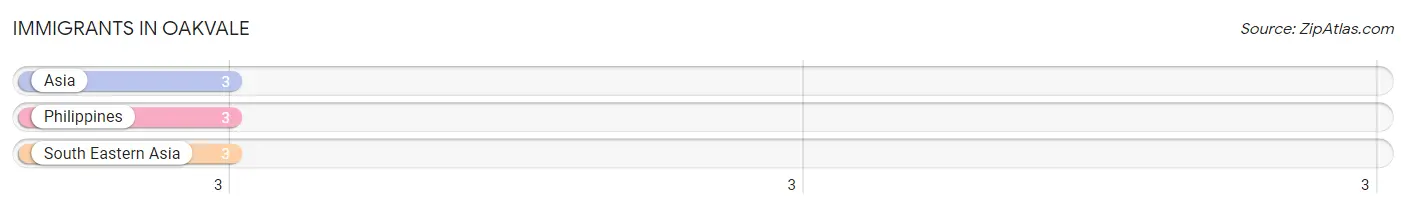
| Immigration Origin | # Population | % Population |
| Asia | 3 | 1.4% |
| Philippines | 3 | 1.4% |
| South Eastern Asia | 3 | 1.4% | View All 3 Rows |
Sex and Age in Oakvale
Sex and Age in Oakvale
The most populous age groups in Oakvale are 10 to 14 Years (51 | 50.5%) for men and 5 to 9 Years (48 | 42.5%) for women.
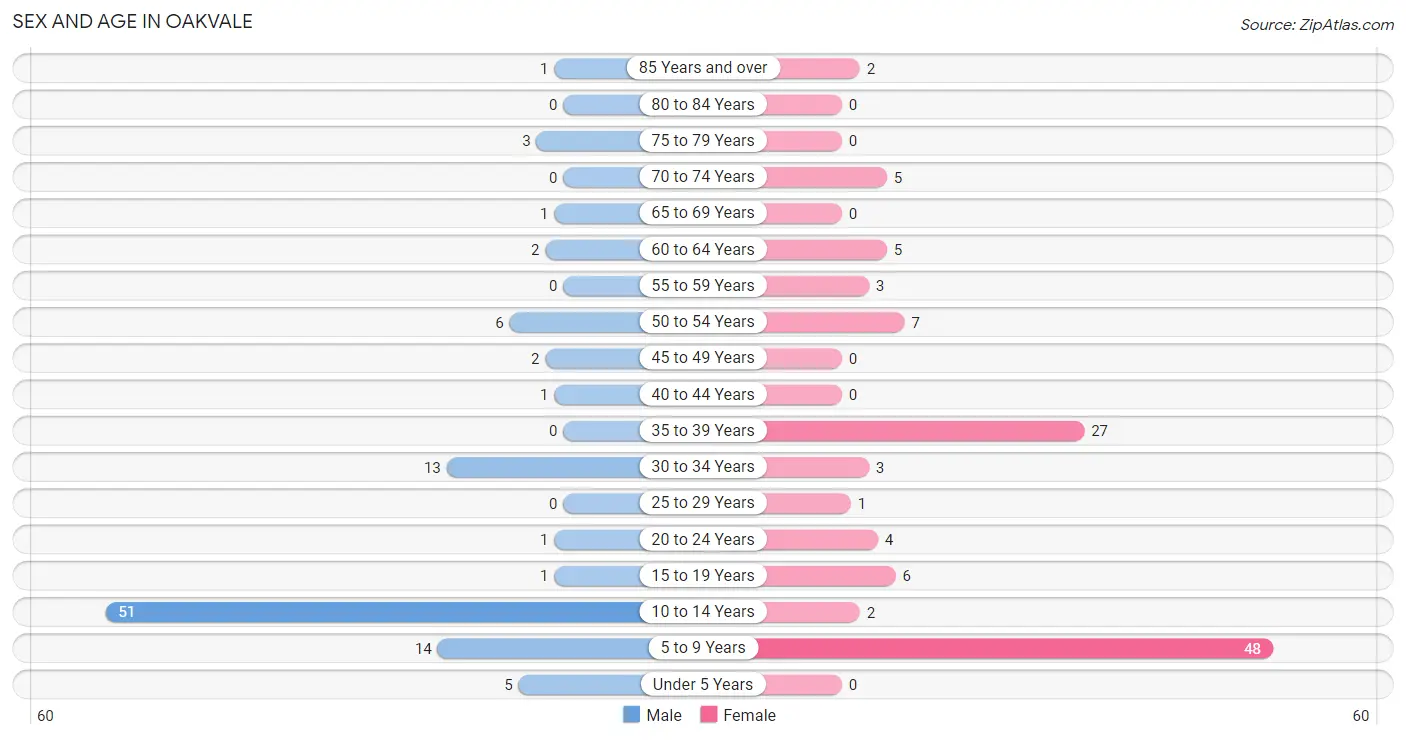
| Age Bracket | Male | Female |
| Under 5 Years | 5 (5.0%) | 0 (0.0%) |
| 5 to 9 Years | 14 (13.9%) | 48 (42.5%) |
| 10 to 14 Years | 51 (50.5%) | 2 (1.8%) |
| 15 to 19 Years | 1 (1.0%) | 6 (5.3%) |
| 20 to 24 Years | 1 (1.0%) | 4 (3.5%) |
| 25 to 29 Years | 0 (0.0%) | 1 (0.9%) |
| 30 to 34 Years | 13 (12.9%) | 3 (2.6%) |
| 35 to 39 Years | 0 (0.0%) | 27 (23.9%) |
| 40 to 44 Years | 1 (1.0%) | 0 (0.0%) |
| 45 to 49 Years | 2 (2.0%) | 0 (0.0%) |
| 50 to 54 Years | 6 (5.9%) | 7 (6.2%) |
| 55 to 59 Years | 0 (0.0%) | 3 (2.6%) |
| 60 to 64 Years | 2 (2.0%) | 5 (4.4%) |
| 65 to 69 Years | 1 (1.0%) | 0 (0.0%) |
| 70 to 74 Years | 0 (0.0%) | 5 (4.4%) |
| 75 to 79 Years | 3 (3.0%) | 0 (0.0%) |
| 80 to 84 Years | 0 (0.0%) | 0 (0.0%) |
| 85 Years and over | 1 (1.0%) | 2 (1.8%) |
| Total | 101 (100.0%) | 113 (100.0%) |
Families and Households in Oakvale
Median Family Size in Oakvale
The median family size in Oakvale is 4.28 persons per family, with single male/father families (2 | 4.3%) accounting for the largest median family size of 7.5 persons per family. On the other hand, married-couple families (10 | 21.3%) represent the smallest median family size with 2.60 persons per family.
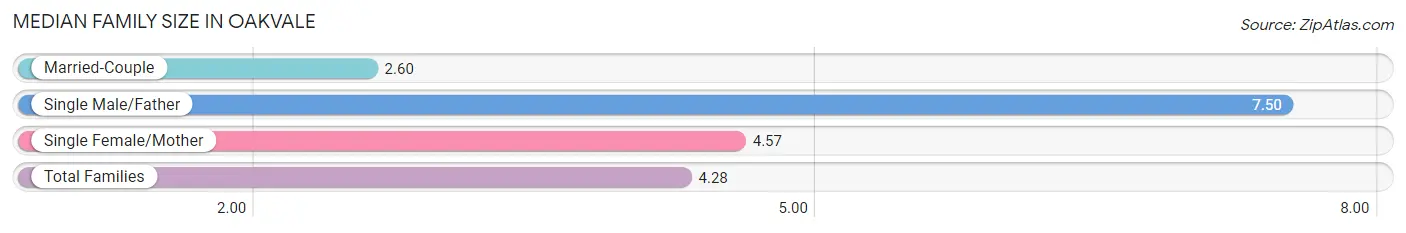
| Family Type | # Families | Family Size |
| Married-Couple | 10 (21.3%) | 2.60 |
| Single Male/Father | 2 (4.3%) | 7.50 |
| Single Female/Mother | 35 (74.5%) | 4.57 |
| Total Families | 47 (100.0%) | 4.28 |
Median Household Size in Oakvale
The median household size in Oakvale is 4.28 persons per household, with single male/father households (2 | 4.0%) accounting for the largest median household size of 8 persons per household. non-family households (3 | 6.0%) represent the smallest median household size with 1.00 persons per household.
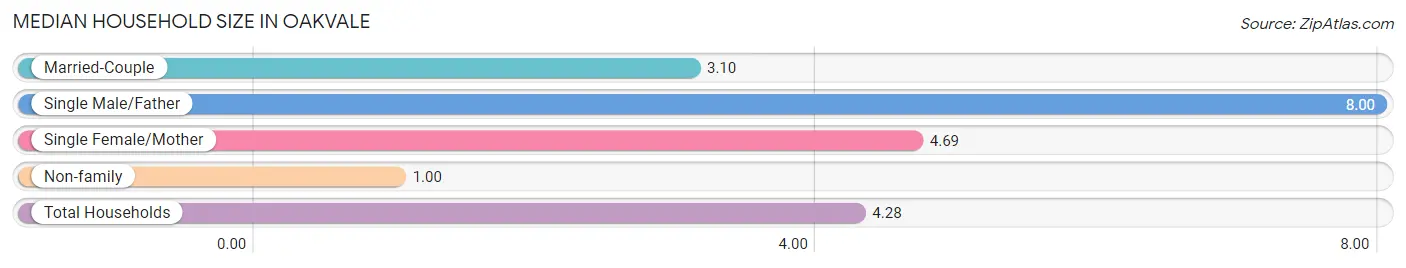
| Household Type | # Households | Household Size |
| Married-Couple | 10 (20.0%) | 3.10 |
| Single Male/Father | 2 (4.0%) | 8.00 |
| Single Female/Mother | 35 (70.0%) | 4.69 |
| Non-family | 3 (6.0%) | 1.00 |
| Total Households | 50 (100.0%) | 4.28 |
Household Size by Marriage Status in Oakvale
Out of a total of 50 households in Oakvale, 47 (94.0%) are family households, while 3 (6.0%) are nonfamily households. The most numerous type of family households are 3-person households, comprising 31, and the most common type of nonfamily households are 1-person households, comprising 3.
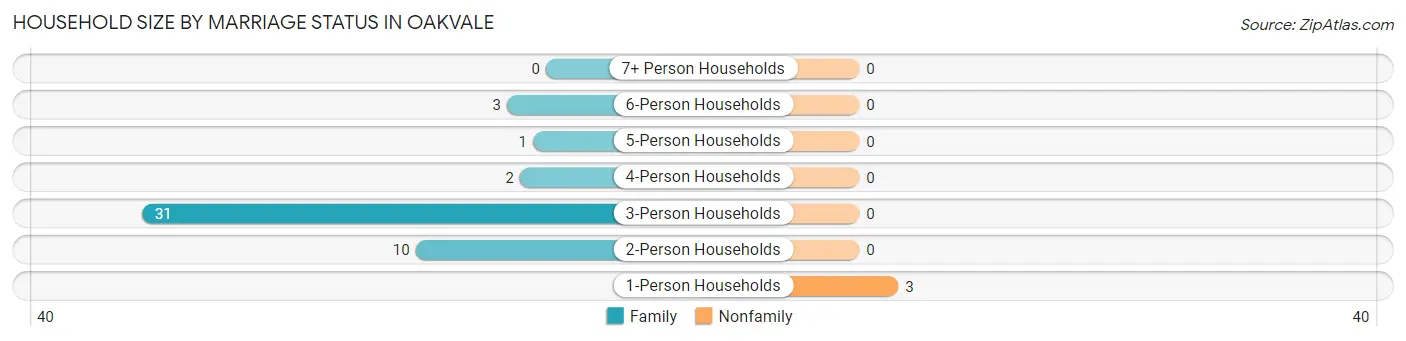
| Household Size | Family Households | Nonfamily Households |
| 1-Person Households | - | 3 (6.0%) |
| 2-Person Households | 10 (20.0%) | 0 (0.0%) |
| 3-Person Households | 31 (62.0%) | 0 (0.0%) |
| 4-Person Households | 2 (4.0%) | 0 (0.0%) |
| 5-Person Households | 1 (2.0%) | 0 (0.0%) |
| 6-Person Households | 3 (6.0%) | 0 (0.0%) |
| 7+ Person Households | 0 (0.0%) | 0 (0.0%) |
| Total | 47 (94.0%) | 3 (6.0%) |
Female Fertility in Oakvale
Fertility by Age in Oakvale
| Age Bracket | Women with Births | Births / 1,000 Women |
| 15 to 19 years | 0 (0.0%) | 0.0 |
| 20 to 34 years | 0 (0.0%) | 0.0 |
| 35 to 50 years | 0 (0.0%) | 0.0 |
| Total | 0 (0.0%) | 0.0 |
Fertility by Age by Marriage Status in Oakvale
| Age Bracket | Married | Unmarried |
| 15 to 19 years | 0 (0.0%) | 0 (0.0%) |
| 20 to 34 years | 0 (0.0%) | 0 (0.0%) |
| 35 to 50 years | 0 (0.0%) | 0 (0.0%) |
| Total | 0 (0.0%) | 0 (0.0%) |
Fertility by Education in Oakvale
| Educational Attainment | Women with Births | Births / 1,000 Women |
| Less than High School | 0 (0.0%) | 0.0 |
| High School Diploma | 0 (0.0%) | 0.0 |
| College or Associate's Degree | 0 (0.0%) | 0.0 |
| Bachelor's Degree | 0 (0.0%) | 0.0 |
| Graduate Degree | 0 (0.0%) | 0.0 |
| Total | 0 (0.0%) | 0.0 |
Fertility by Education by Marriage Status in Oakvale
| Educational Attainment | Married | Unmarried |
| Less than High School | 0 (0.0%) | 0 (0.0%) |
| High School Diploma | 0 (0.0%) | 0 (0.0%) |
| College or Associate's Degree | 0 (0.0%) | 0 (0.0%) |
| Bachelor's Degree | 0 (0.0%) | 0 (0.0%) |
| Graduate Degree | 0 (0.0%) | 0 (0.0%) |
| Total | 0 (0.0%) | 0 (0.0%) |
Employment Characteristics in Oakvale
Employment by Class of Employer in Oakvale
Among the 53 employed individuals in Oakvale, private company employees (50 | 94.3%), state government employees (2 | 3.8%), and self-employed (incorporated) (1 | 1.9%) make up the most common classes of employment.
| Employer Class | # Employees | % Employees |
| Private Company Employees | 50 | 94.3% |
| Self-Employed (Incorporated) | 1 | 1.9% |
| Self-Employed (Not Incorporated) | 0 | 0.0% |
| Not-for-profit Organizations | 0 | 0.0% |
| Local Government Employees | 0 | 0.0% |
| State Government Employees | 2 | 3.8% |
| Federal Government Employees | 0 | 0.0% |
| Unpaid Family Workers | 0 | 0.0% |
| Total | 53 | 100.0% |
Employment Status by Age in Oakvale
According to the labor force statistics for Oakvale, out of the total population over 16 years of age (92), 65.2% or 60 individuals are in the labor force, with 11.7% or 7 of them unemployed. The age group with the highest labor force participation rate is 35 to 44 years, with 100.0% or 28 individuals in the labor force. Within the labor force, the 20 to 24 years age range has the highest percentage of unemployed individuals, with 100.0% or 4 of them being unemployed.
| Age Bracket | In Labor Force | Unemployed |
| 16 to 19 Years | 0 (0.0%) | 0 (0.0%) |
| 20 to 24 Years | 4 (80.0%) | 4 (100.0%) |
| 25 to 29 Years | 0 (0.0%) | 0 (0.0%) |
| 30 to 34 Years | 13 (81.3%) | 0 (0.0%) |
| 35 to 44 Years | 28 (100.0%) | 0 (0.0%) |
| 45 to 54 Years | 11 (73.3%) | 3 (27.3%) |
| 55 to 59 Years | 3 (100.0%) | 0 (0.0%) |
| 60 to 64 Years | 1 (14.3%) | 0 (0.0%) |
| 65 to 74 Years | 0 (0.0%) | 0 (0.0%) |
| 75 Years and over | 0 (0.0%) | 0 (0.0%) |
| Total | 60 (65.2%) | 7 (11.7%) |
Employment Status by Educational Attainment in Oakvale
According to labor force statistics for Oakvale, 80.0% of individuals (56) out of the total population between 25 and 64 years of age (70) are in the labor force, with 5.4% or 3 of them being unemployed. The group with the highest labor force participation rate are those with the educational attainment of high school diploma, with 85.9% or 55 individuals in the labor force. Within the labor force, individuals with high school diploma education have the highest percentage of unemployment, with 5.5% or 3 of them being unemployed.
| Educational Attainment | In Labor Force | Unemployed |
| Less than High School | 0 (0.0%) | 0 (0.0%) |
| High School Diploma | 55 (85.9%) | 4 (5.5%) |
| College / Associate Degree | 0 (0.0%) | 0 (0.0%) |
| Bachelor's Degree or higher | 1 (33.3%) | 0 (0.0%) |
| Total | 56 (80.0%) | 4 (5.4%) |
Employment Occupations by Sex in Oakvale
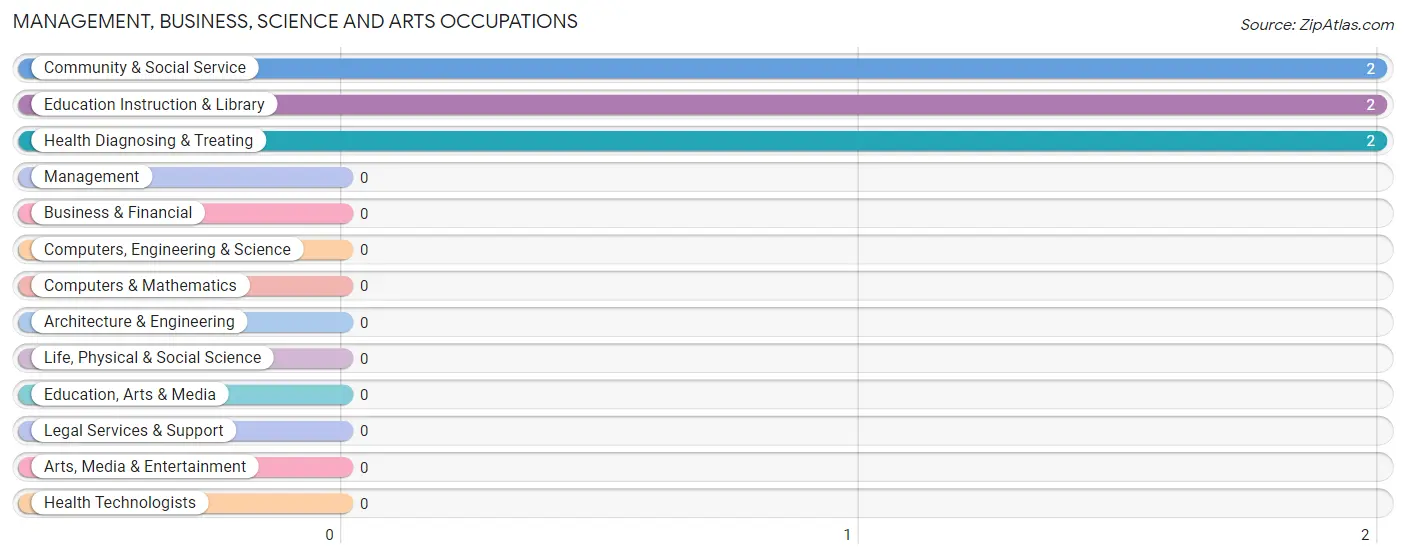
Management, Business, Science and Arts Occupations
The most common Management, Business, Science and Arts occupations in Oakvale are Community & Social Service (2 | 3.8%), Education Instruction & Library (2 | 3.8%), and Health Diagnosing & Treating (2 | 3.8%).
Management, Business, Science and Arts Occupations by Sex
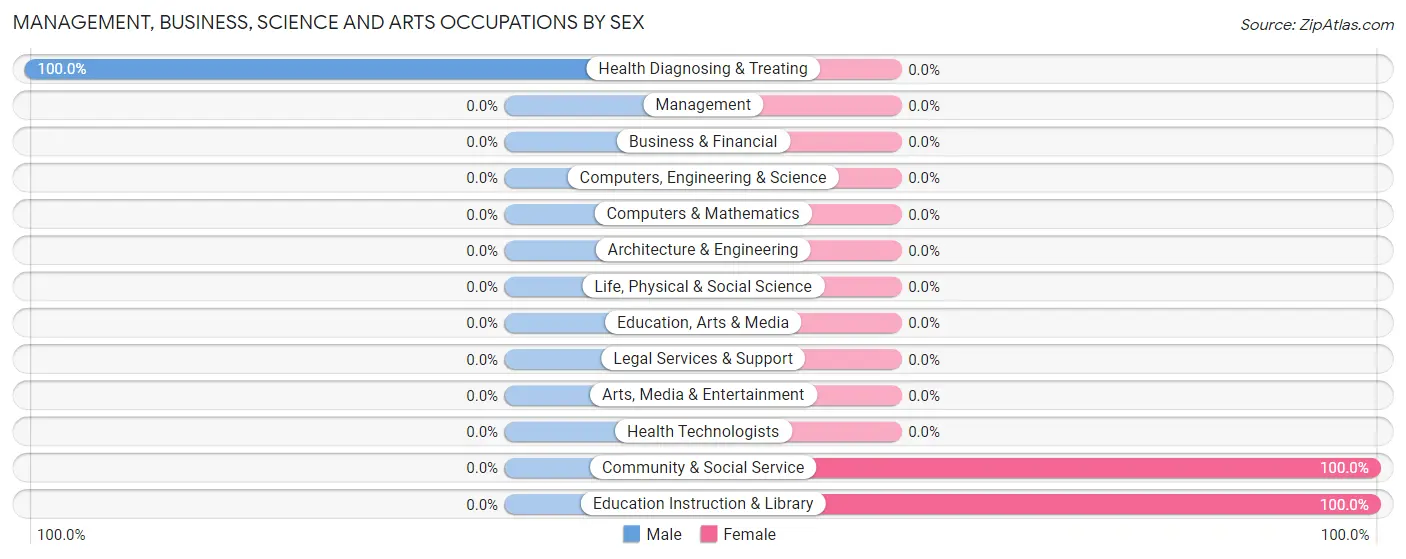
| Occupation | Male | Female |
| Management | 0 (0.0%) | 0 (0.0%) |
| Business & Financial | 0 (0.0%) | 0 (0.0%) |
| Computers, Engineering & Science | 0 (0.0%) | 0 (0.0%) |
| Computers & Mathematics | 0 (0.0%) | 0 (0.0%) |
| Architecture & Engineering | 0 (0.0%) | 0 (0.0%) |
| Life, Physical & Social Science | 0 (0.0%) | 0 (0.0%) |
| Community & Social Service | 0 (0.0%) | 2 (100.0%) |
| Education, Arts & Media | 0 (0.0%) | 0 (0.0%) |
| Legal Services & Support | 0 (0.0%) | 0 (0.0%) |
| Education Instruction & Library | 0 (0.0%) | 2 (100.0%) |
| Arts, Media & Entertainment | 0 (0.0%) | 0 (0.0%) |
| Health Diagnosing & Treating | 2 (100.0%) | 0 (0.0%) |
| Health Technologists | 0 (0.0%) | 0 (0.0%) |
| Total (Category) | 2 (50.0%) | 2 (50.0%) |
| Total (Overall) | 20 (37.7%) | 33 (62.3%) |
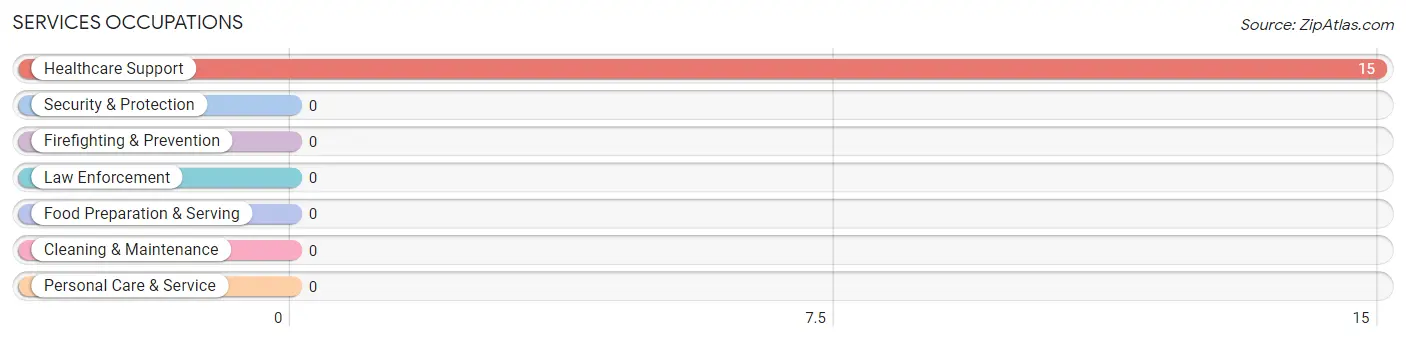
Services Occupations
The most common Services occupations in Oakvale are , and Healthcare Support (15 | 28.3%).
Services Occupations by Sex
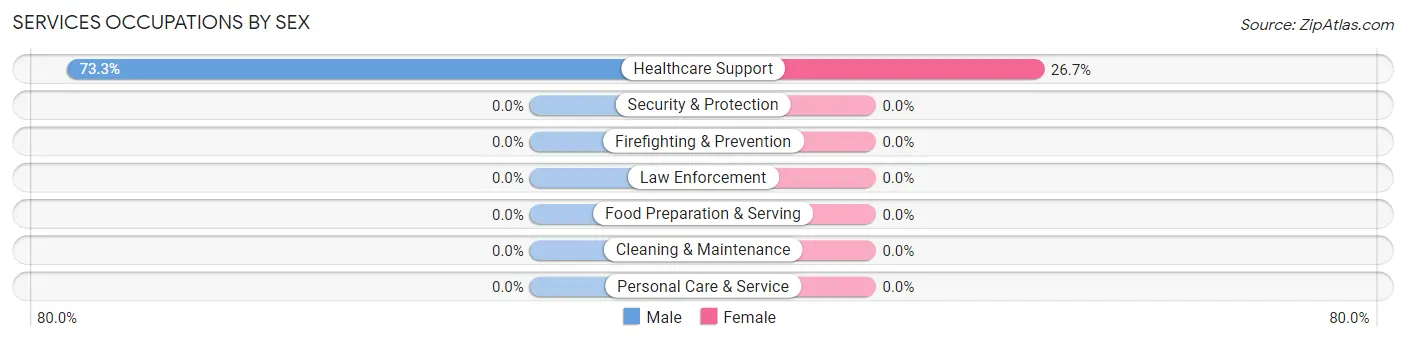
| Occupation | Male | Female |
| Healthcare Support | 11 (73.3%) | 4 (26.7%) |
| Security & Protection | 0 (0.0%) | 0 (0.0%) |
| Firefighting & Prevention | 0 (0.0%) | 0 (0.0%) |
| Law Enforcement | 0 (0.0%) | 0 (0.0%) |
| Food Preparation & Serving | 0 (0.0%) | 0 (0.0%) |
| Cleaning & Maintenance | 0 (0.0%) | 0 (0.0%) |
| Personal Care & Service | 0 (0.0%) | 0 (0.0%) |
| Total (Category) | 11 (73.3%) | 4 (26.7%) |
| Total (Overall) | 20 (37.7%) | 33 (62.3%) |
Sales and Office Occupations
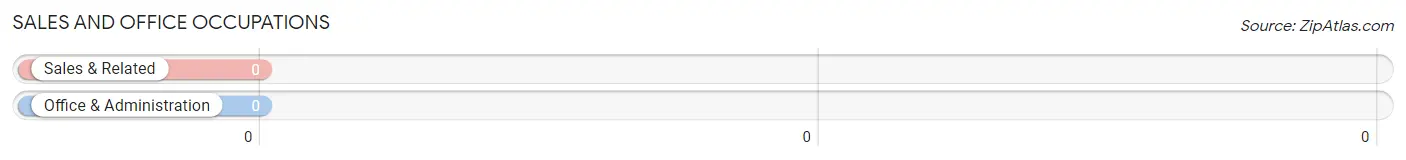
Sales and Office Occupations by Sex
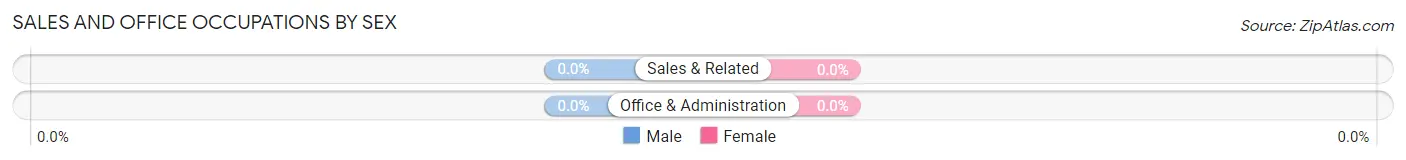
| Occupation | Male | Female |
| Sales & Related | 0 (0.0%) | 0 (0.0%) |
| Office & Administration | 0 (0.0%) | 0 (0.0%) |
| Total (Category) | 0 (0.0%) | 0 (0.0%) |
| Total (Overall) | 20 (37.7%) | 33 (62.3%) |
Natural Resources, Construction and Maintenance Occupations
The most common Natural Resources, Construction and Maintenance occupations in Oakvale are , and Construction & Extraction (1 | 1.9%).
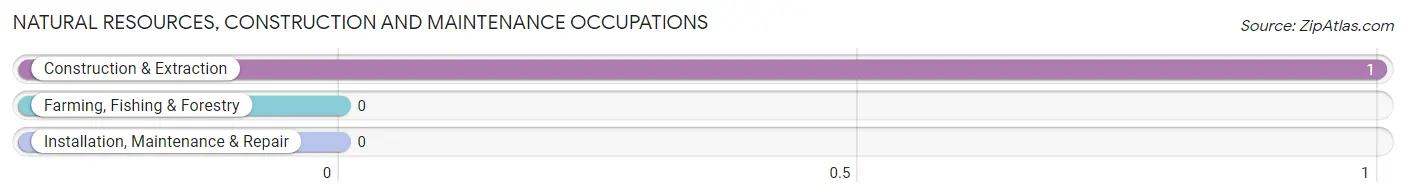
Natural Resources, Construction and Maintenance Occupations by Sex
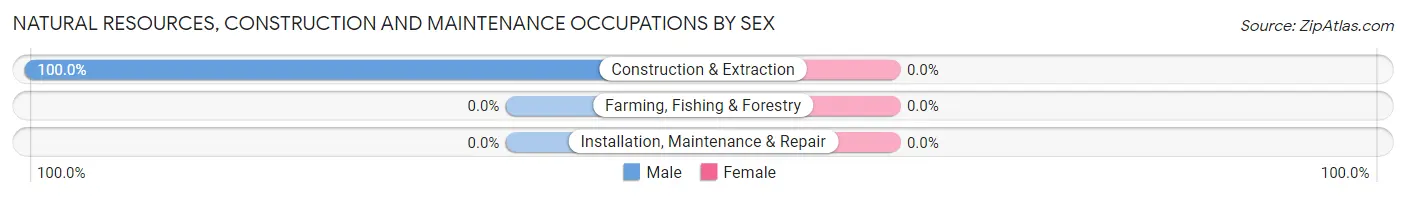
| Occupation | Male | Female |
| Farming, Fishing & Forestry | 0 (0.0%) | 0 (0.0%) |
| Construction & Extraction | 1 (100.0%) | 0 (0.0%) |
| Installation, Maintenance & Repair | 0 (0.0%) | 0 (0.0%) |
| Total (Category) | 1 (100.0%) | 0 (0.0%) |
| Total (Overall) | 20 (37.7%) | 33 (62.3%) |
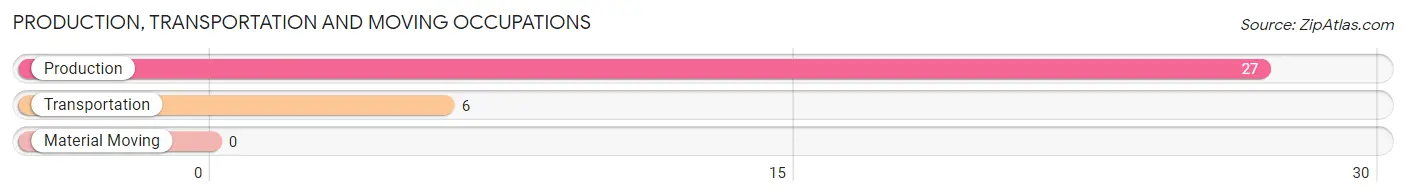
Production, Transportation and Moving Occupations
The most common Production, Transportation and Moving occupations in Oakvale are Production (27 | 50.9%), and Transportation (6 | 11.3%).
Production, Transportation and Moving Occupations by Sex
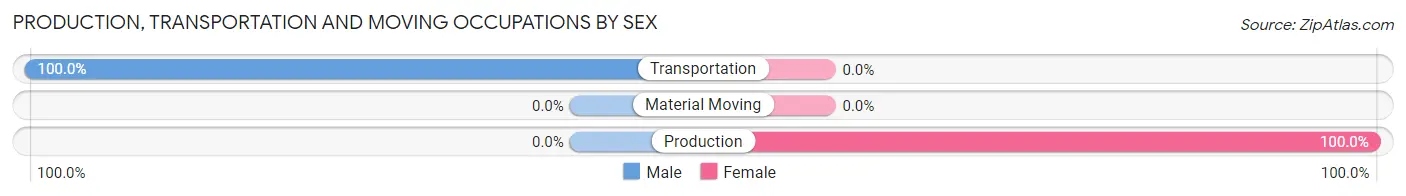
| Occupation | Male | Female |
| Production | 0 (0.0%) | 27 (100.0%) |
| Transportation | 6 (100.0%) | 0 (0.0%) |
| Material Moving | 0 (0.0%) | 0 (0.0%) |
| Total (Category) | 6 (18.2%) | 27 (81.8%) |
| Total (Overall) | 20 (37.7%) | 33 (62.3%) |
Employment Industries by Sex in Oakvale
Employment Industries in Oakvale
The major employment industries in Oakvale include Manufacturing (27 | 50.9%), Health Care & Social Assistance (16 | 30.2%), Retail Trade (6 | 11.3%), Public Administration (2 | 3.8%), and Administrative & Support (1 | 1.9%).
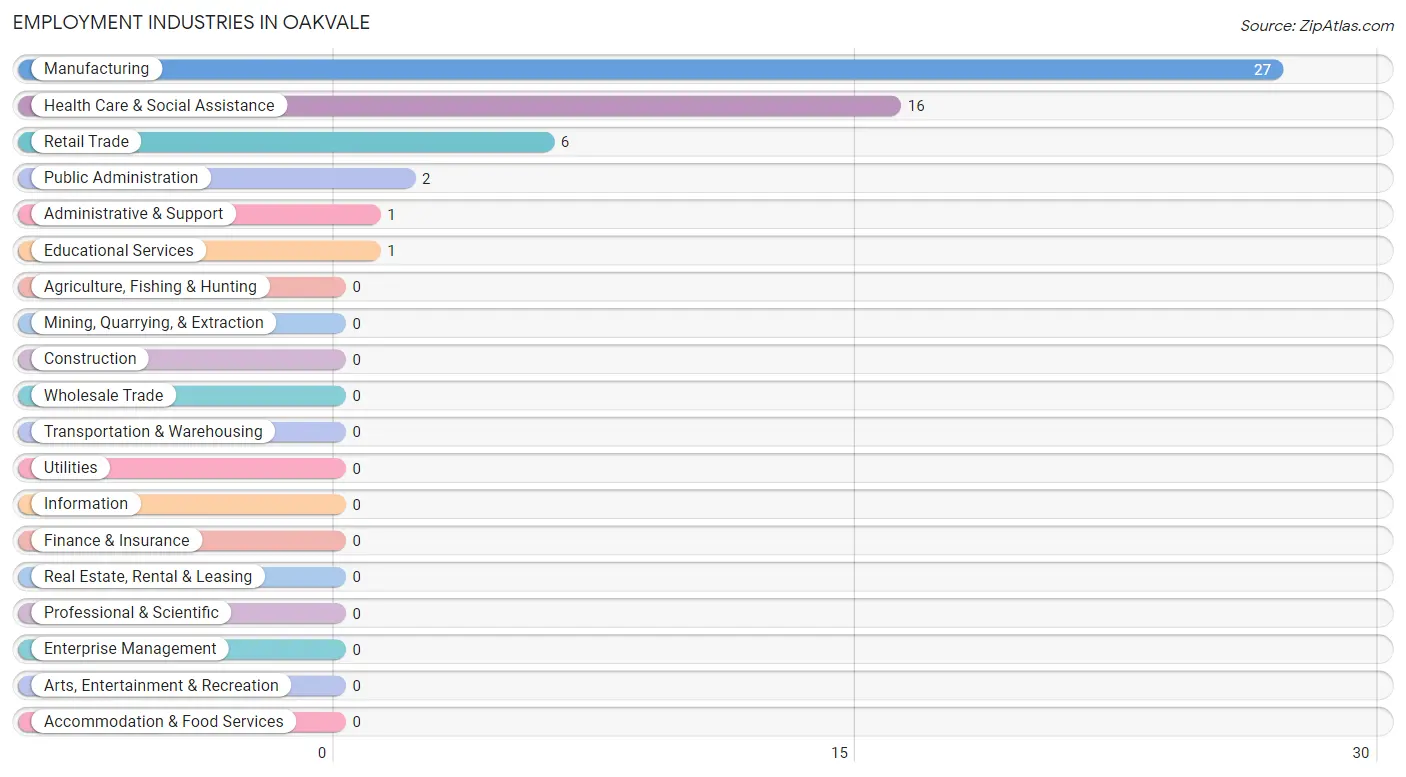
Employment Industries by Sex in Oakvale
The Oakvale industries that see more men than women are Retail Trade (100.0%), Administrative & Support (100.0%), and Health Care & Social Assistance (81.2%), whereas the industries that tend to have a higher number of women are Manufacturing (100.0%), Educational Services (100.0%), and Public Administration (100.0%).
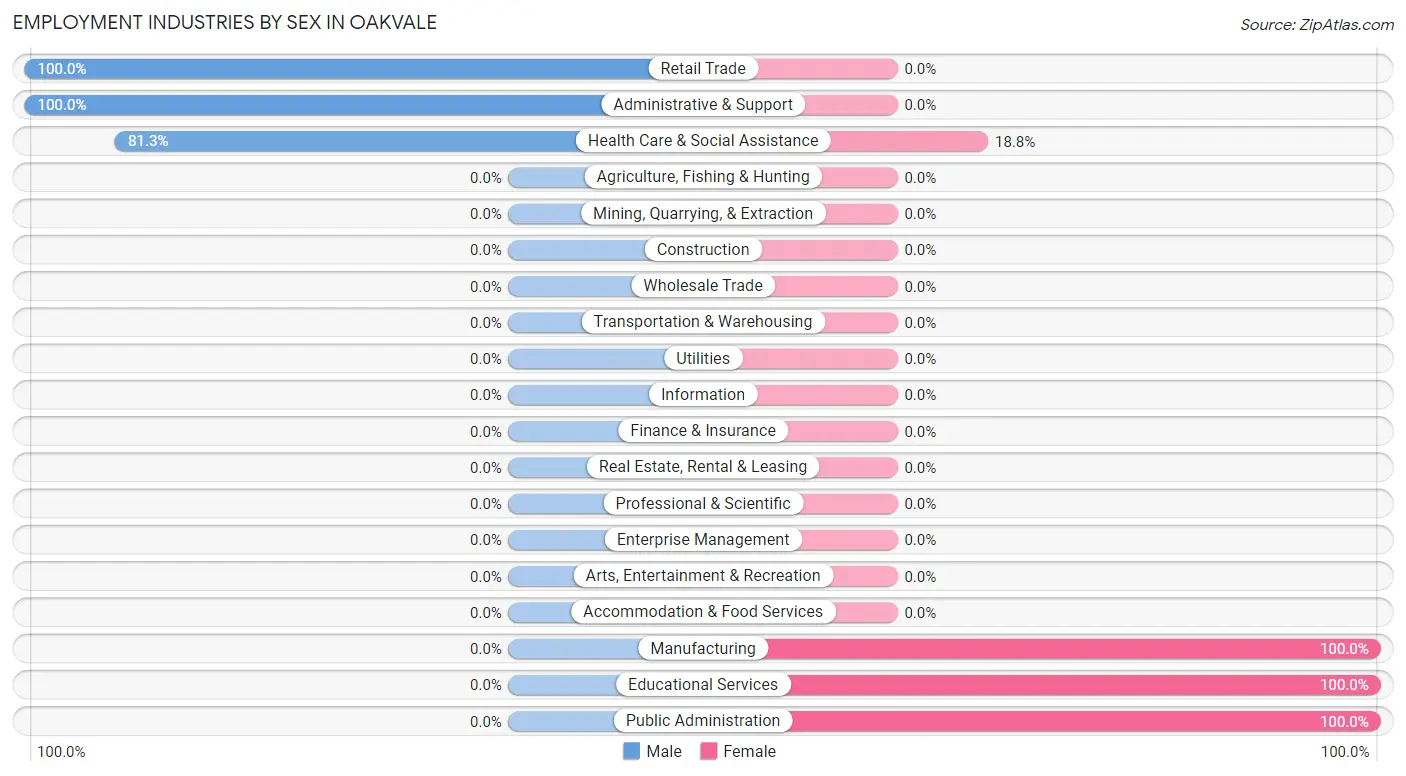
| Industry | Male | Female |
| Agriculture, Fishing & Hunting | 0 (0.0%) | 0 (0.0%) |
| Mining, Quarrying, & Extraction | 0 (0.0%) | 0 (0.0%) |
| Construction | 0 (0.0%) | 0 (0.0%) |
| Manufacturing | 0 (0.0%) | 27 (100.0%) |
| Wholesale Trade | 0 (0.0%) | 0 (0.0%) |
| Retail Trade | 6 (100.0%) | 0 (0.0%) |
| Transportation & Warehousing | 0 (0.0%) | 0 (0.0%) |
| Utilities | 0 (0.0%) | 0 (0.0%) |
| Information | 0 (0.0%) | 0 (0.0%) |
| Finance & Insurance | 0 (0.0%) | 0 (0.0%) |
| Real Estate, Rental & Leasing | 0 (0.0%) | 0 (0.0%) |
| Professional & Scientific | 0 (0.0%) | 0 (0.0%) |
| Enterprise Management | 0 (0.0%) | 0 (0.0%) |
| Administrative & Support | 1 (100.0%) | 0 (0.0%) |
| Educational Services | 0 (0.0%) | 1 (100.0%) |
| Health Care & Social Assistance | 13 (81.2%) | 3 (18.8%) |
| Arts, Entertainment & Recreation | 0 (0.0%) | 0 (0.0%) |
| Accommodation & Food Services | 0 (0.0%) | 0 (0.0%) |
| Public Administration | 0 (0.0%) | 2 (100.0%) |
| Total | 20 (37.7%) | 33 (62.3%) |
Education in Oakvale
School Enrollment in Oakvale
The most common levels of schooling among the 28 students in Oakvale are elementary school (13 | 46.4%), nursery / preschool (7 | 25.0%), and high school (5 | 17.9%).
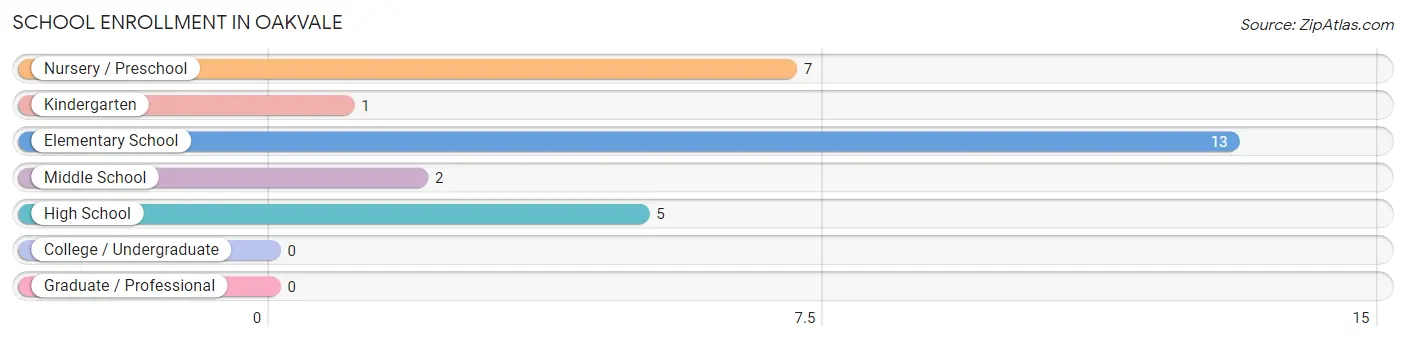
| School Level | # Students | % Students |
| Nursery / Preschool | 7 | 25.0% |
| Kindergarten | 1 | 3.6% |
| Elementary School | 13 | 46.4% |
| Middle School | 2 | 7.1% |
| High School | 5 | 17.9% |
| College / Undergraduate | 0 | 0.0% |
| Graduate / Professional | 0 | 0.0% |
| Total | 28 | 100.0% |
School Enrollment by Age by Funding Source in Oakvale
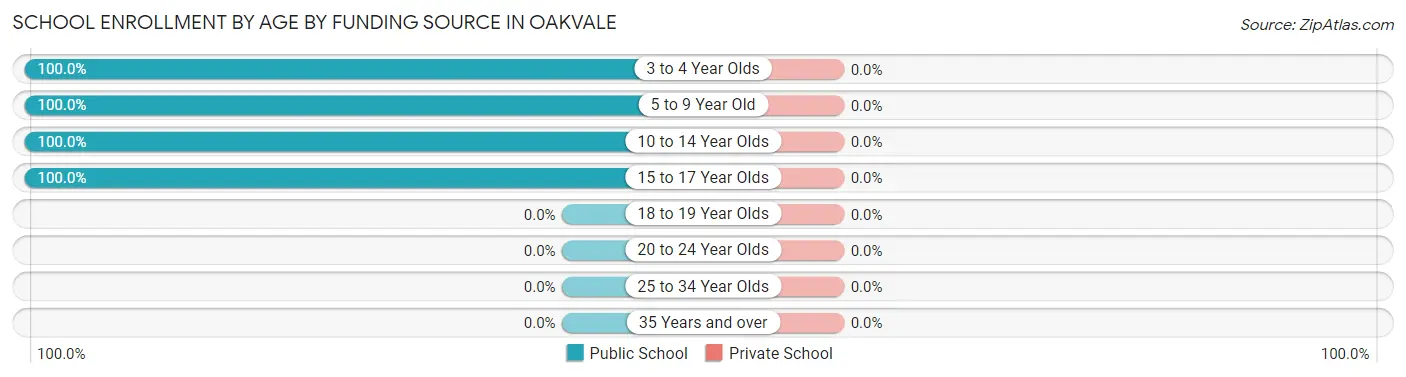
| Age Bracket | Public School | Private School |
| 3 to 4 Year Olds | 4 (100.0%) | 0 (0.0%) |
| 5 to 9 Year Old | 17 (100.0%) | 0 (0.0%) |
| 10 to 14 Year Olds | 2 (100.0%) | 0 (0.0%) |
| 15 to 17 Year Olds | 5 (100.0%) | 0 (0.0%) |
| 18 to 19 Year Olds | 0 (0.0%) | 0 (0.0%) |
| 20 to 24 Year Olds | 0 (0.0%) | 0 (0.0%) |
| 25 to 34 Year Olds | 0 (0.0%) | 0 (0.0%) |
| 35 Years and over | 0 (0.0%) | 0 (0.0%) |
| Total | 28 (100.0%) | 0 (0.0%) |
Educational Attainment by Field of Study in Oakvale
Business (3 | 50.0%), psychology (2 | 33.3%), and education (1 | 16.7%) are the most common fields of study among 6 individuals in Oakvale who have obtained a bachelor's degree or higher.
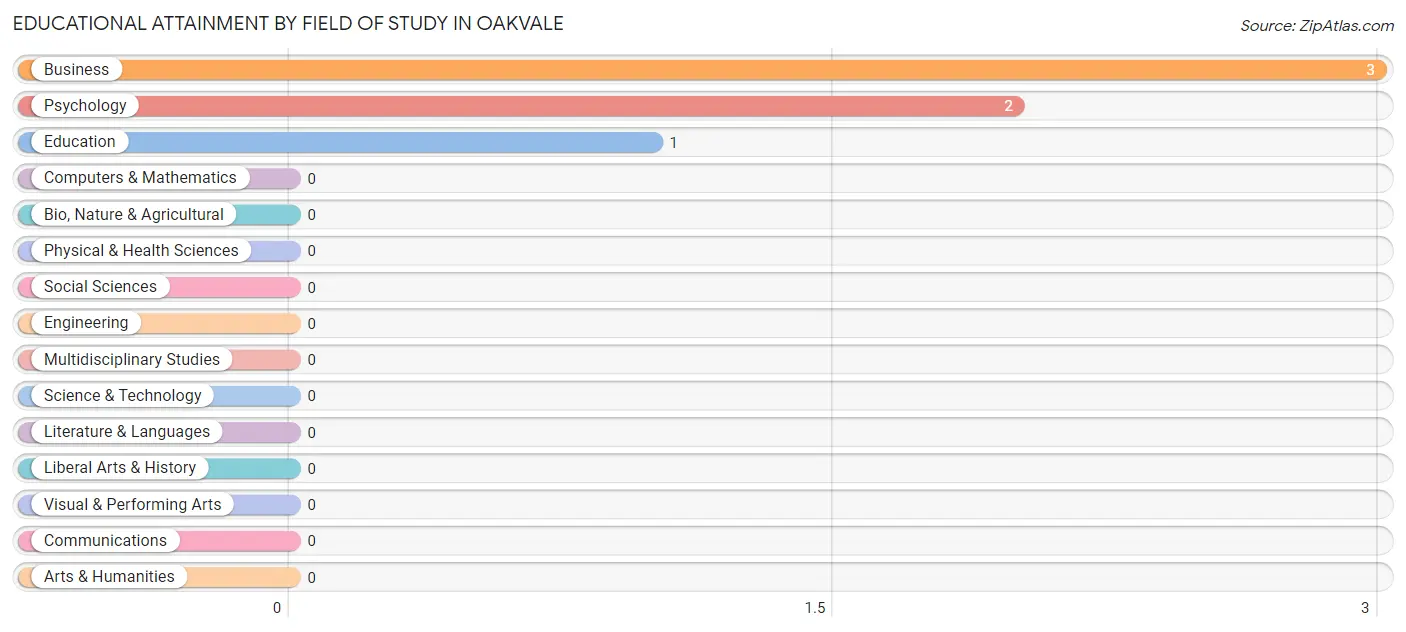
| Field of Study | # Graduates | % Graduates |
| Computers & Mathematics | 0 | 0.0% |
| Bio, Nature & Agricultural | 0 | 0.0% |
| Physical & Health Sciences | 0 | 0.0% |
| Psychology | 2 | 33.3% |
| Social Sciences | 0 | 0.0% |
| Engineering | 0 | 0.0% |
| Multidisciplinary Studies | 0 | 0.0% |
| Science & Technology | 0 | 0.0% |
| Business | 3 | 50.0% |
| Education | 1 | 16.7% |
| Literature & Languages | 0 | 0.0% |
| Liberal Arts & History | 0 | 0.0% |
| Visual & Performing Arts | 0 | 0.0% |
| Communications | 0 | 0.0% |
| Arts & Humanities | 0 | 0.0% |
| Total | 6 | 100.0% |
Transportation & Commute in Oakvale
Vehicle Availability by Sex in Oakvale
The most prevalent vehicle ownership categories in Oakvale are males with 2 vehicles (14, accounting for 70.0%) and females with 2 vehicles (1, making up 42.4%).
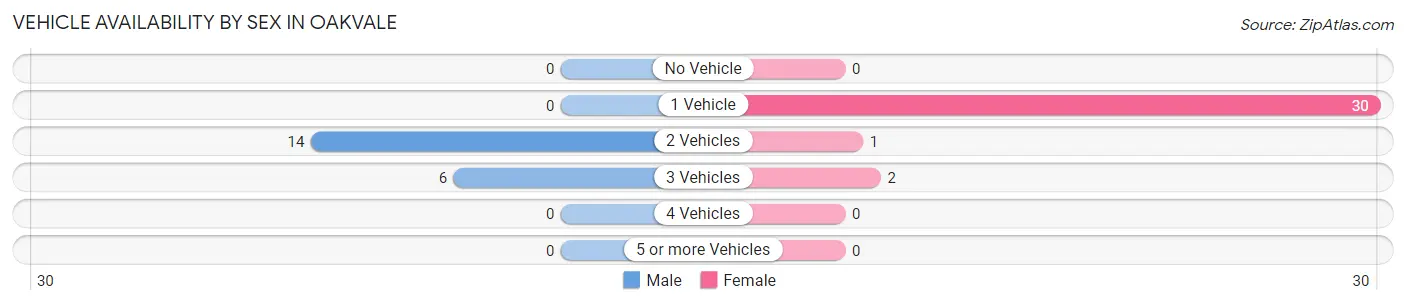
| Vehicles Available | Male | Female |
| No Vehicle | 0 (0.0%) | 0 (0.0%) |
| 1 Vehicle | 0 (0.0%) | 30 (90.9%) |
| 2 Vehicles | 14 (70.0%) | 1 (3.0%) |
| 3 Vehicles | 6 (30.0%) | 2 (6.1%) |
| 4 Vehicles | 0 (0.0%) | 0 (0.0%) |
| 5 or more Vehicles | 0 (0.0%) | 0 (0.0%) |
| Total | 20 (100.0%) | 33 (100.0%) |
Commute Time in Oakvale
The most frequently occuring commute durations in Oakvale are 45 to 59 minutes (27 commuters, 52.9%), 25 to 29 minutes (12 commuters, 23.5%), and 20 to 24 minutes (7 commuters, 13.7%).
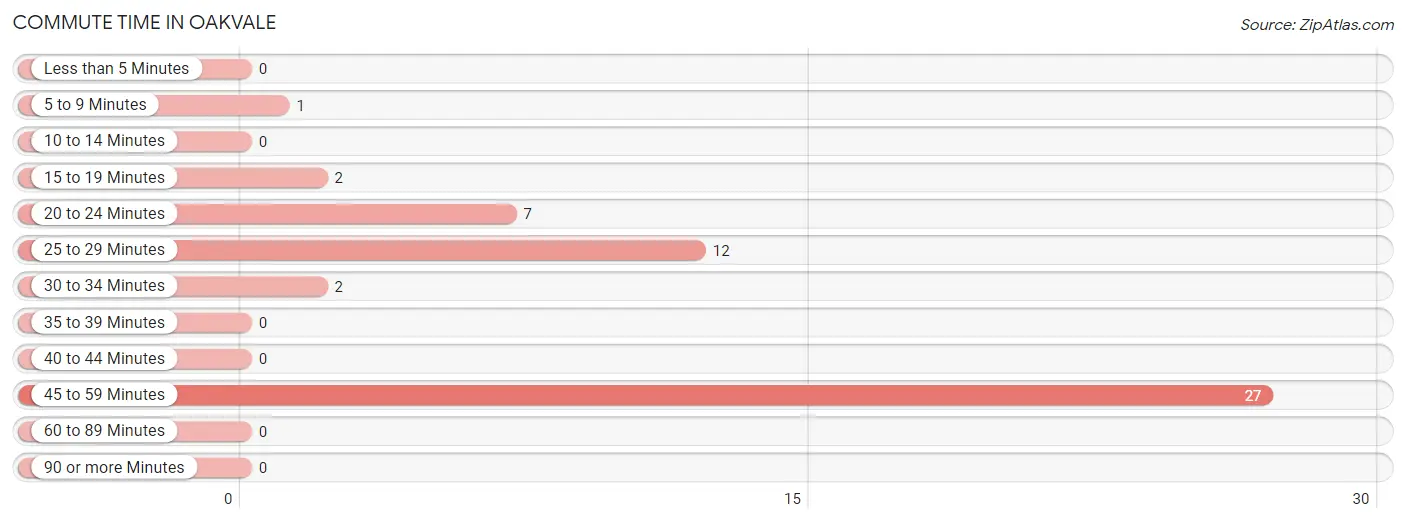
| Commute Time | # Commuters | % Commuters |
| Less than 5 Minutes | 0 | 0.0% |
| 5 to 9 Minutes | 1 | 2.0% |
| 10 to 14 Minutes | 0 | 0.0% |
| 15 to 19 Minutes | 2 | 3.9% |
| 20 to 24 Minutes | 7 | 13.7% |
| 25 to 29 Minutes | 12 | 23.5% |
| 30 to 34 Minutes | 2 | 3.9% |
| 35 to 39 Minutes | 0 | 0.0% |
| 40 to 44 Minutes | 0 | 0.0% |
| 45 to 59 Minutes | 27 | 52.9% |
| 60 to 89 Minutes | 0 | 0.0% |
| 90 or more Minutes | 0 | 0.0% |
Commute Time by Sex in Oakvale
The most common commute times in Oakvale are 25 to 29 minutes (11 commuters, 55.0%) for males and 45 to 59 minutes (26 commuters, 83.9%) for females.
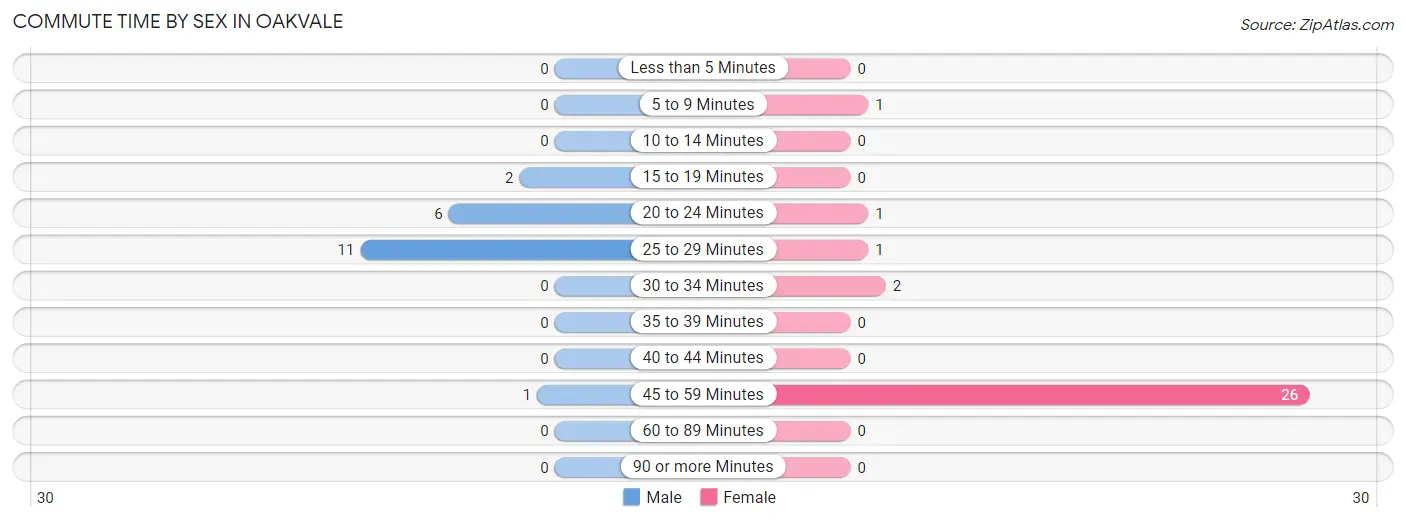
| Commute Time | Male | Female |
| Less than 5 Minutes | 0 (0.0%) | 0 (0.0%) |
| 5 to 9 Minutes | 0 (0.0%) | 1 (3.2%) |
| 10 to 14 Minutes | 0 (0.0%) | 0 (0.0%) |
| 15 to 19 Minutes | 2 (10.0%) | 0 (0.0%) |
| 20 to 24 Minutes | 6 (30.0%) | 1 (3.2%) |
| 25 to 29 Minutes | 11 (55.0%) | 1 (3.2%) |
| 30 to 34 Minutes | 0 (0.0%) | 2 (6.5%) |
| 35 to 39 Minutes | 0 (0.0%) | 0 (0.0%) |
| 40 to 44 Minutes | 0 (0.0%) | 0 (0.0%) |
| 45 to 59 Minutes | 1 (5.0%) | 26 (83.9%) |
| 60 to 89 Minutes | 0 (0.0%) | 0 (0.0%) |
| 90 or more Minutes | 0 (0.0%) | 0 (0.0%) |
Time of Departure to Work by Sex in Oakvale
The most frequent times of departure to work in Oakvale are 6:30 AM to 6:59 AM (11, 55.0%) for males and 5:00 AM to 5:29 AM (26, 83.9%) for females.
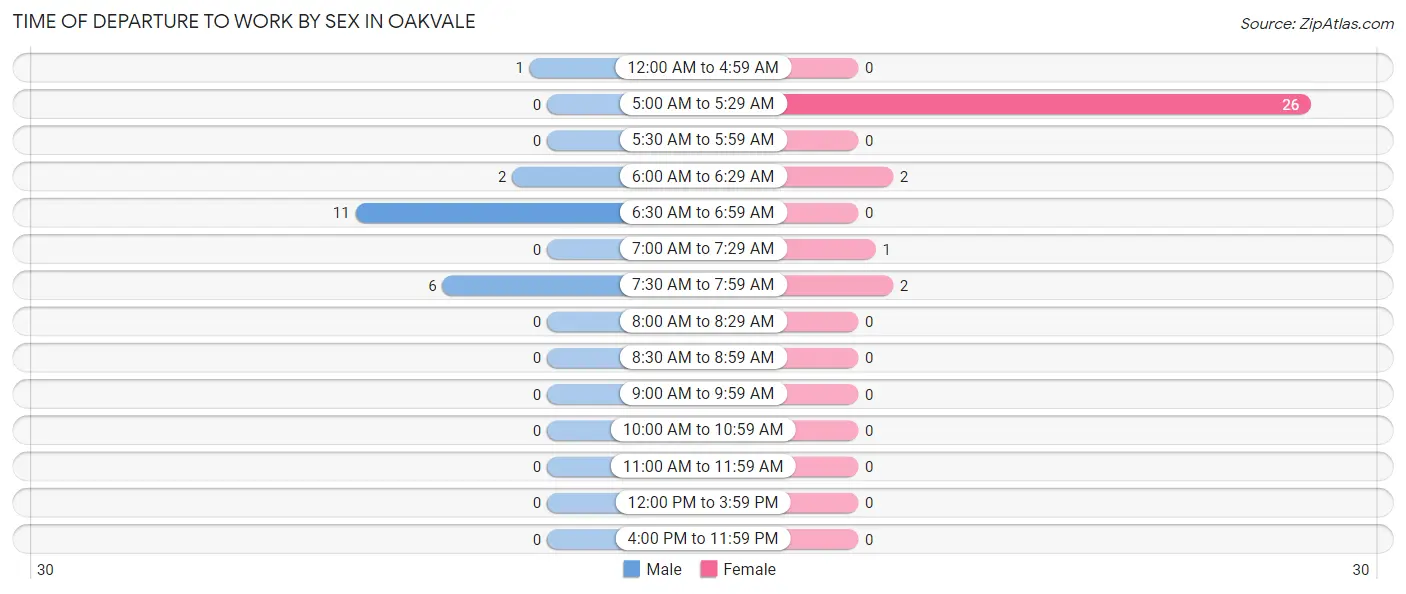
| Time of Departure | Male | Female |
| 12:00 AM to 4:59 AM | 1 (5.0%) | 0 (0.0%) |
| 5:00 AM to 5:29 AM | 0 (0.0%) | 26 (83.9%) |
| 5:30 AM to 5:59 AM | 0 (0.0%) | 0 (0.0%) |
| 6:00 AM to 6:29 AM | 2 (10.0%) | 2 (6.5%) |
| 6:30 AM to 6:59 AM | 11 (55.0%) | 0 (0.0%) |
| 7:00 AM to 7:29 AM | 0 (0.0%) | 1 (3.2%) |
| 7:30 AM to 7:59 AM | 6 (30.0%) | 2 (6.5%) |
| 8:00 AM to 8:29 AM | 0 (0.0%) | 0 (0.0%) |
| 8:30 AM to 8:59 AM | 0 (0.0%) | 0 (0.0%) |
| 9:00 AM to 9:59 AM | 0 (0.0%) | 0 (0.0%) |
| 10:00 AM to 10:59 AM | 0 (0.0%) | 0 (0.0%) |
| 11:00 AM to 11:59 AM | 0 (0.0%) | 0 (0.0%) |
| 12:00 PM to 3:59 PM | 0 (0.0%) | 0 (0.0%) |
| 4:00 PM to 11:59 PM | 0 (0.0%) | 0 (0.0%) |
| Total | 20 (100.0%) | 31 (100.0%) |
Housing Occupancy in Oakvale
Occupancy by Ownership in Oakvale
Of the total 50 dwellings in Oakvale, owner-occupied units account for 19 (38.0%), while renter-occupied units make up 31 (62.0%).
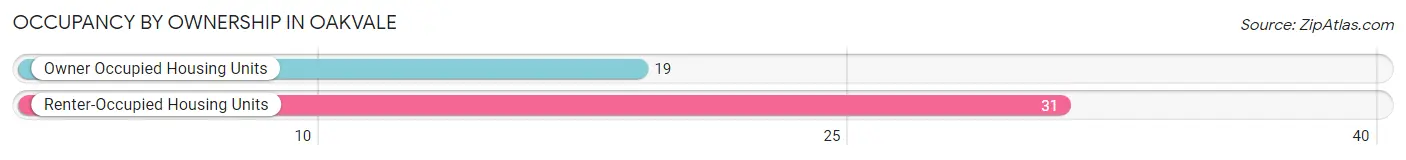
| Occupancy | # Housing Units | % Housing Units |
| Owner Occupied Housing Units | 19 | 38.0% |
| Renter-Occupied Housing Units | 31 | 62.0% |
| Total Occupied Housing Units | 50 | 100.0% |
Occupancy by Household Size in Oakvale
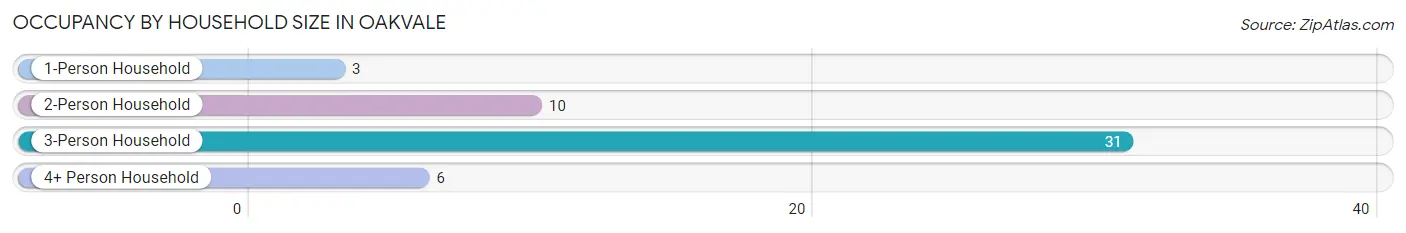
| Household Size | # Housing Units | % Housing Units |
| 1-Person Household | 3 | 6.0% |
| 2-Person Household | 10 | 20.0% |
| 3-Person Household | 31 | 62.0% |
| 4+ Person Household | 6 | 12.0% |
| Total Housing Units | 50 | 100.0% |
Occupancy by Ownership by Household Size in Oakvale
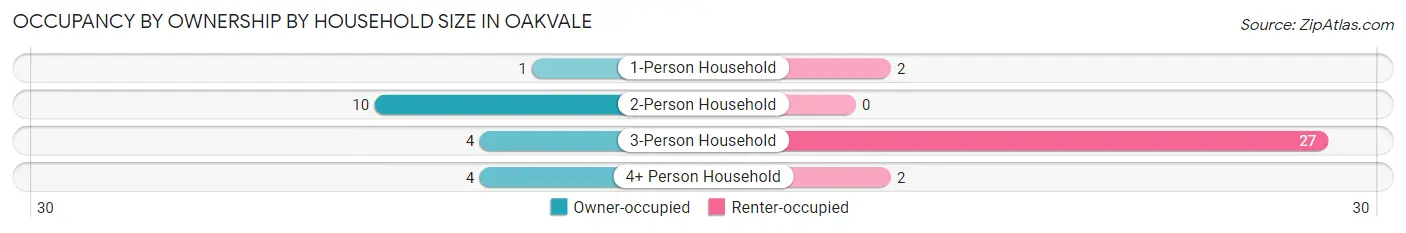
| Household Size | Owner-occupied | Renter-occupied |
| 1-Person Household | 1 (33.3%) | 2 (66.7%) |
| 2-Person Household | 10 (100.0%) | 0 (0.0%) |
| 3-Person Household | 4 (12.9%) | 27 (87.1%) |
| 4+ Person Household | 4 (66.7%) | 2 (33.3%) |
| Total Housing Units | 19 (38.0%) | 31 (62.0%) |
Occupancy by Educational Attainment in Oakvale
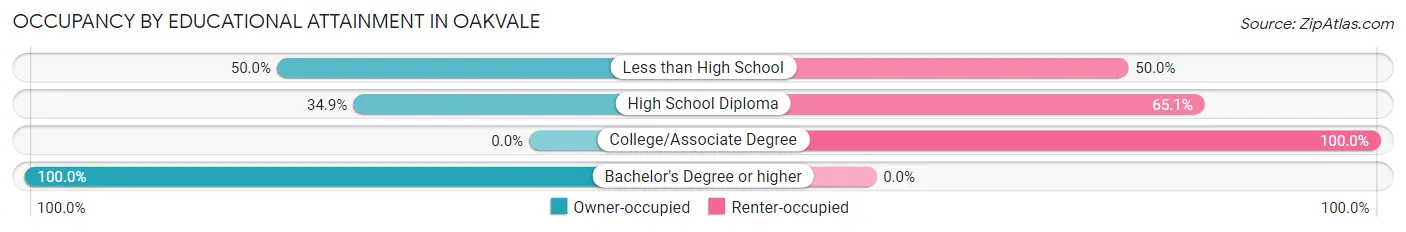
| Household Size | Owner-occupied | Renter-occupied |
| Less than High School | 1 (50.0%) | 1 (50.0%) |
| High School Diploma | 15 (34.9%) | 28 (65.1%) |
| College/Associate Degree | 0 (0.0%) | 2 (100.0%) |
| Bachelor's Degree or higher | 3 (100.0%) | 0 (0.0%) |
Occupancy by Age of Householder in Oakvale
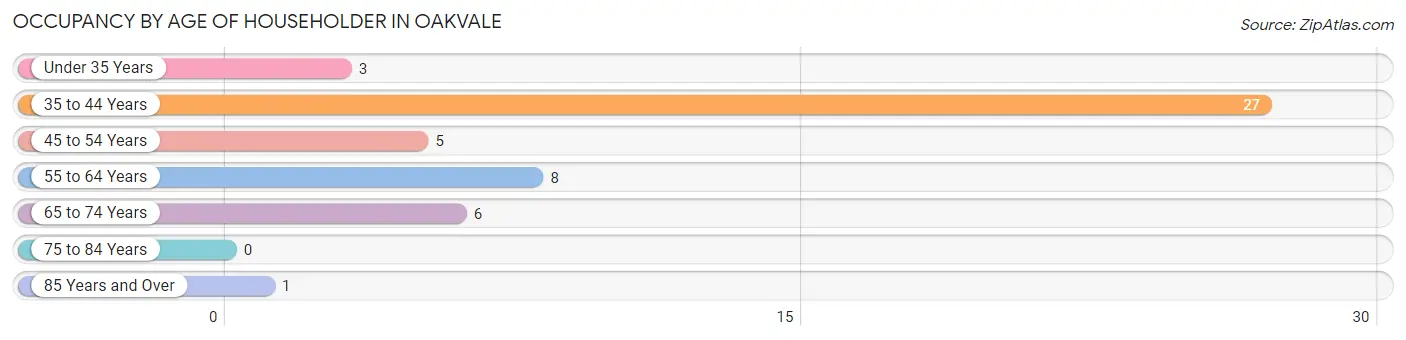
| Age Bracket | # Households | % Households |
| Under 35 Years | 3 | 6.0% |
| 35 to 44 Years | 27 | 54.0% |
| 45 to 54 Years | 5 | 10.0% |
| 55 to 64 Years | 8 | 16.0% |
| 65 to 74 Years | 6 | 12.0% |
| 75 to 84 Years | 0 | 0.0% |
| 85 Years and Over | 1 | 2.0% |
| Total | 50 | 100.0% |
Housing Finances in Oakvale
Median Income by Occupancy in Oakvale
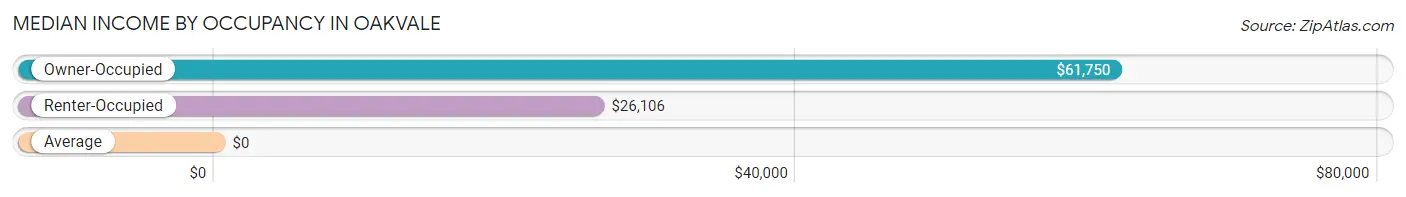
| Occupancy Type | # Households | Median Income |
| Owner-Occupied | 19 (38.0%) | $61,750 |
| Renter-Occupied | 31 (62.0%) | $26,106 |
| Average | 50 (100.0%) | $0 |
Occupancy by Householder Income Bracket in Oakvale
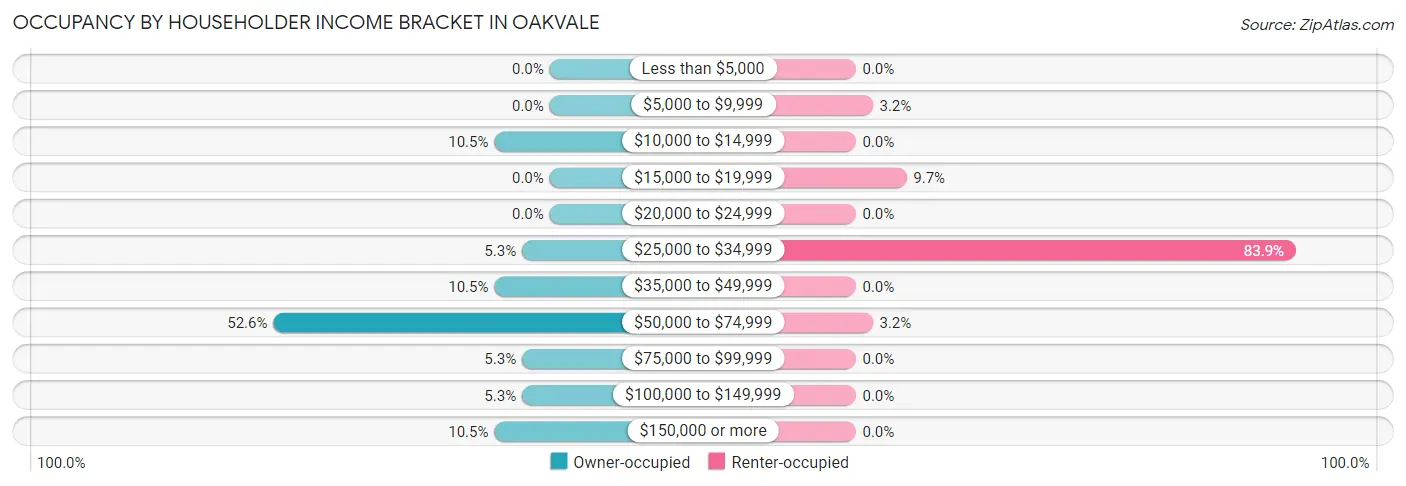
| Income Bracket | Owner-occupied | Renter-occupied |
| Less than $5,000 | 0 (0.0%) | 0 (0.0%) |
| $5,000 to $9,999 | 0 (0.0%) | 1 (3.2%) |
| $10,000 to $14,999 | 2 (10.5%) | 0 (0.0%) |
| $15,000 to $19,999 | 0 (0.0%) | 3 (9.7%) |
| $20,000 to $24,999 | 0 (0.0%) | 0 (0.0%) |
| $25,000 to $34,999 | 1 (5.3%) | 26 (83.9%) |
| $35,000 to $49,999 | 2 (10.5%) | 0 (0.0%) |
| $50,000 to $74,999 | 10 (52.6%) | 1 (3.2%) |
| $75,000 to $99,999 | 1 (5.3%) | 0 (0.0%) |
| $100,000 to $149,999 | 1 (5.3%) | 0 (0.0%) |
| $150,000 or more | 2 (10.5%) | 0 (0.0%) |
| Total | 19 (100.0%) | 31 (100.0%) |
Monthly Housing Cost Tiers in Oakvale
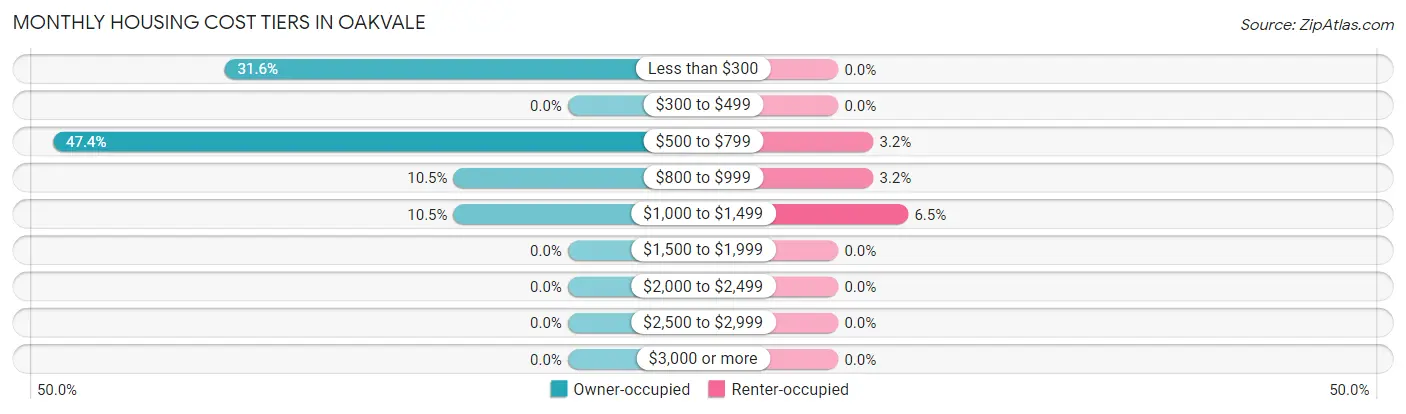
| Monthly Cost | Owner-occupied | Renter-occupied |
| Less than $300 | 6 (31.6%) | 0 (0.0%) |
| $300 to $499 | 0 (0.0%) | 0 (0.0%) |
| $500 to $799 | 9 (47.4%) | 1 (3.2%) |
| $800 to $999 | 2 (10.5%) | 1 (3.2%) |
| $1,000 to $1,499 | 2 (10.5%) | 2 (6.5%) |
| $1,500 to $1,999 | 0 (0.0%) | 0 (0.0%) |
| $2,000 to $2,499 | 0 (0.0%) | 0 (0.0%) |
| $2,500 to $2,999 | 0 (0.0%) | 0 (0.0%) |
| $3,000 or more | 0 (0.0%) | 0 (0.0%) |
| Total | 19 (100.0%) | 31 (100.0%) |
Physical Housing Characteristics in Oakvale
Housing Structures in Oakvale
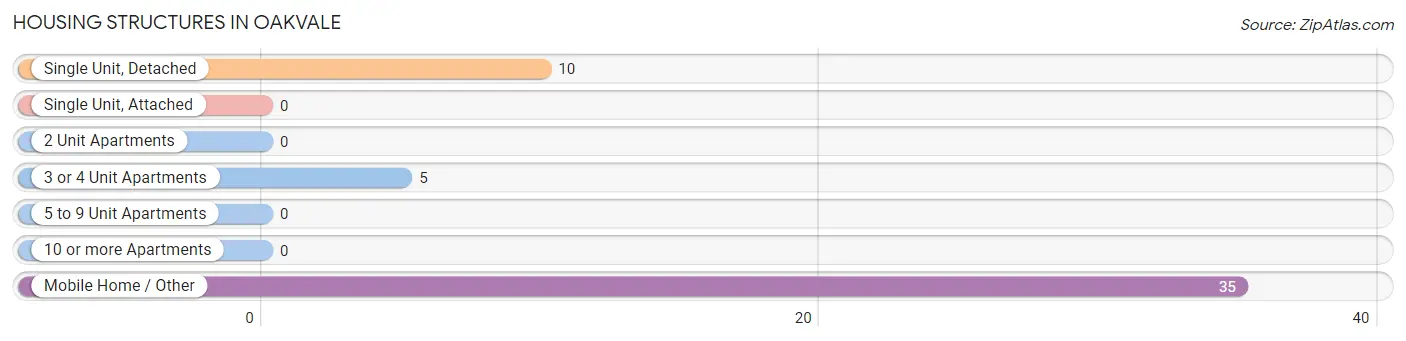
| Structure Type | # Housing Units | % Housing Units |
| Single Unit, Detached | 10 | 20.0% |
| Single Unit, Attached | 0 | 0.0% |
| 2 Unit Apartments | 0 | 0.0% |
| 3 or 4 Unit Apartments | 5 | 10.0% |
| 5 to 9 Unit Apartments | 0 | 0.0% |
| 10 or more Apartments | 0 | 0.0% |
| Mobile Home / Other | 35 | 70.0% |
| Total | 50 | 100.0% |
Housing Structures by Occupancy in Oakvale
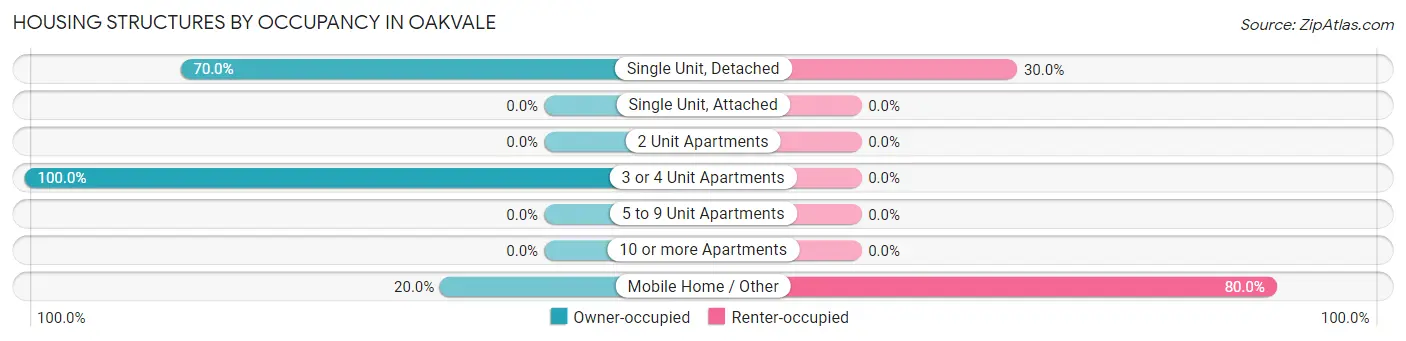
| Structure Type | Owner-occupied | Renter-occupied |
| Single Unit, Detached | 7 (70.0%) | 3 (30.0%) |
| Single Unit, Attached | 0 (0.0%) | 0 (0.0%) |
| 2 Unit Apartments | 0 (0.0%) | 0 (0.0%) |
| 3 or 4 Unit Apartments | 5 (100.0%) | 0 (0.0%) |
| 5 to 9 Unit Apartments | 0 (0.0%) | 0 (0.0%) |
| 10 or more Apartments | 0 (0.0%) | 0 (0.0%) |
| Mobile Home / Other | 7 (20.0%) | 28 (80.0%) |
| Total | 19 (38.0%) | 31 (62.0%) |
Housing Structures by Number of Rooms in Oakvale
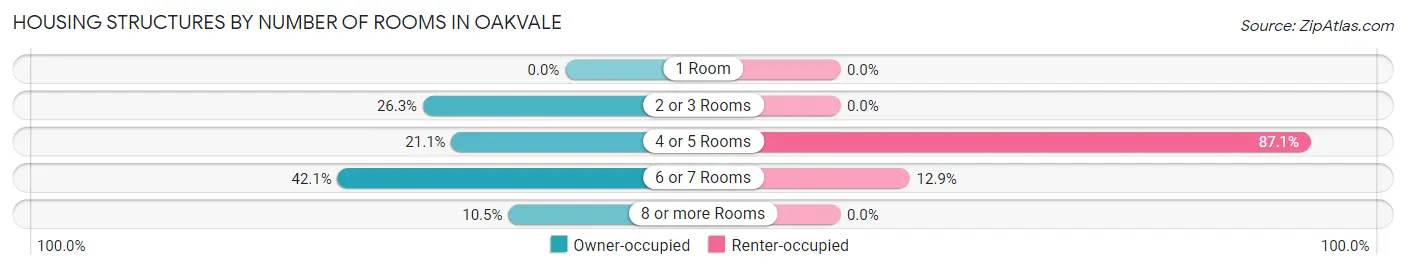
| Number of Rooms | Owner-occupied | Renter-occupied |
| 1 Room | 0 (0.0%) | 0 (0.0%) |
| 2 or 3 Rooms | 5 (26.3%) | 0 (0.0%) |
| 4 or 5 Rooms | 4 (21.0%) | 27 (87.1%) |
| 6 or 7 Rooms | 8 (42.1%) | 4 (12.9%) |
| 8 or more Rooms | 2 (10.5%) | 0 (0.0%) |
| Total | 19 (100.0%) | 31 (100.0%) |
Housing Structure by Heating Type in Oakvale
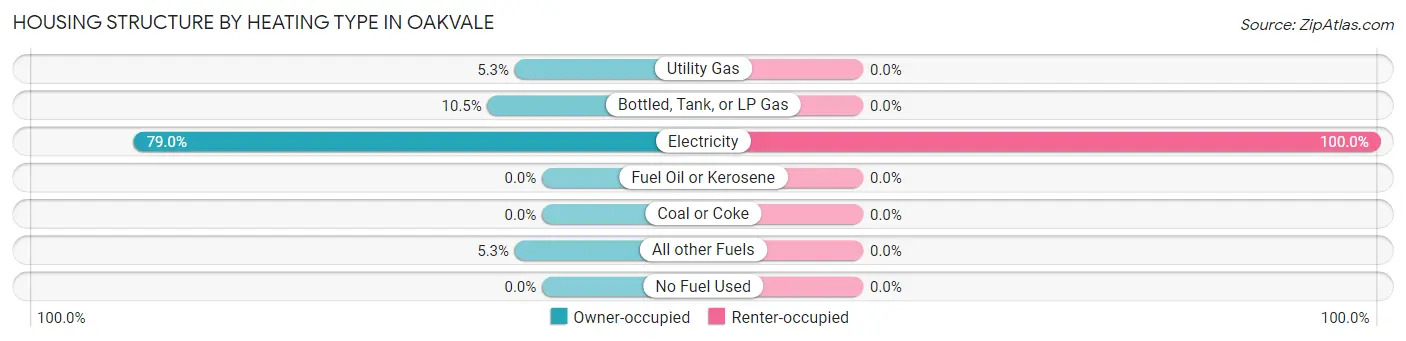
| Heating Type | Owner-occupied | Renter-occupied |
| Utility Gas | 1 (5.3%) | 0 (0.0%) |
| Bottled, Tank, or LP Gas | 2 (10.5%) | 0 (0.0%) |
| Electricity | 15 (78.9%) | 31 (100.0%) |
| Fuel Oil or Kerosene | 0 (0.0%) | 0 (0.0%) |
| Coal or Coke | 0 (0.0%) | 0 (0.0%) |
| All other Fuels | 1 (5.3%) | 0 (0.0%) |
| No Fuel Used | 0 (0.0%) | 0 (0.0%) |
| Total | 19 (100.0%) | 31 (100.0%) |
Household Vehicle Usage in Oakvale
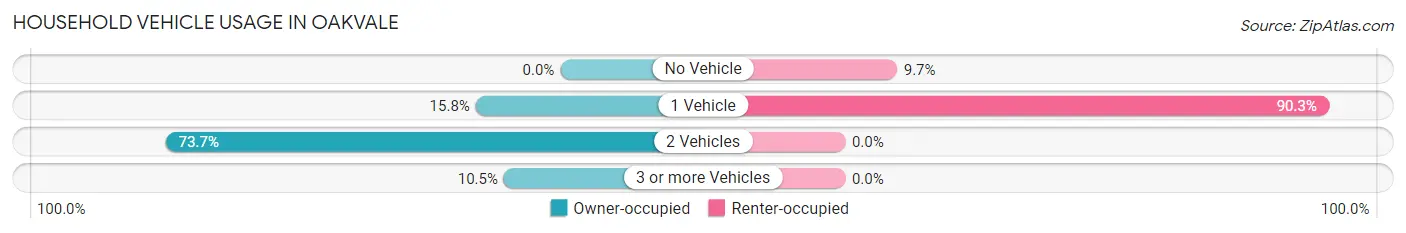
| Vehicles per Household | Owner-occupied | Renter-occupied |
| No Vehicle | 0 (0.0%) | 3 (9.7%) |
| 1 Vehicle | 3 (15.8%) | 28 (90.3%) |
| 2 Vehicles | 14 (73.7%) | 0 (0.0%) |
| 3 or more Vehicles | 2 (10.5%) | 0 (0.0%) |
| Total | 19 (100.0%) | 31 (100.0%) |
Real Estate & Mortgages in Oakvale
Real Estate and Mortgage Overview in Oakvale
| Characteristic | Without Mortgage | With Mortgage |
| Housing Units | 16 | 3 |
| Median Property Value | - | - |
| Median Household Income | $62,000 | $0 |
| Monthly Housing Costs | $533 | $0 |
| Real Estate Taxes | - | - |
Property Value by Mortgage Status in Oakvale
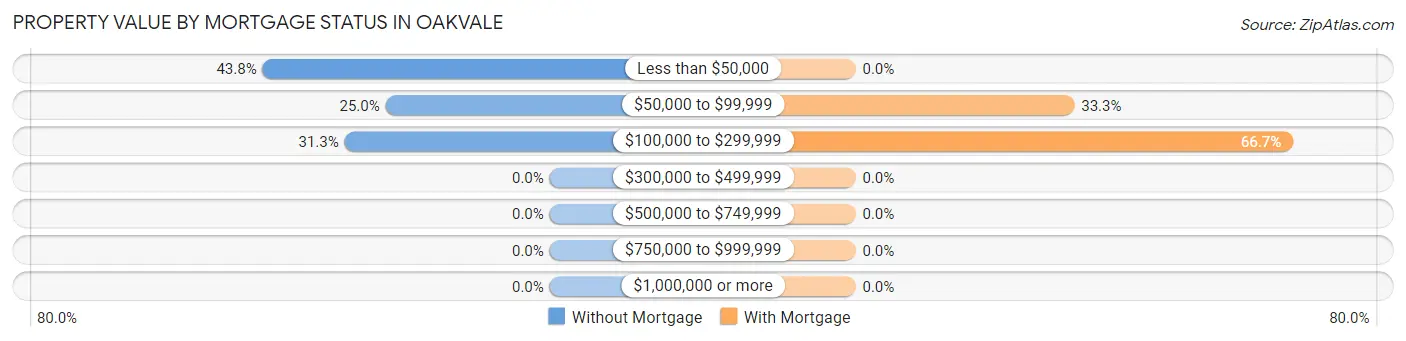
| Property Value | Without Mortgage | With Mortgage |
| Less than $50,000 | 7 (43.8%) | 0 (0.0%) |
| $50,000 to $99,999 | 4 (25.0%) | 1 (33.3%) |
| $100,000 to $299,999 | 5 (31.2%) | 2 (66.7%) |
| $300,000 to $499,999 | 0 (0.0%) | 0 (0.0%) |
| $500,000 to $749,999 | 0 (0.0%) | 0 (0.0%) |
| $750,000 to $999,999 | 0 (0.0%) | 0 (0.0%) |
| $1,000,000 or more | 0 (0.0%) | 0 (0.0%) |
| Total | 16 (100.0%) | 3 (100.0%) |
Household Income by Mortgage Status in Oakvale
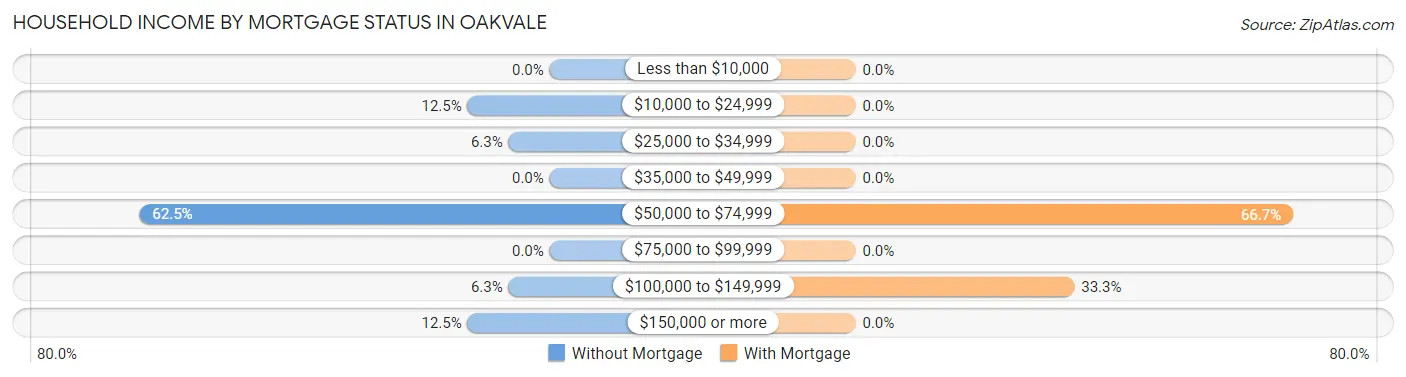
| Household Income | Without Mortgage | With Mortgage |
| Less than $10,000 | 0 (0.0%) | 0 (0.0%) |
| $10,000 to $24,999 | 2 (12.5%) | 0 (0.0%) |
| $25,000 to $34,999 | 1 (6.2%) | 0 (0.0%) |
| $35,000 to $49,999 | 0 (0.0%) | 0 (0.0%) |
| $50,000 to $74,999 | 10 (62.5%) | 2 (66.7%) |
| $75,000 to $99,999 | 0 (0.0%) | 0 (0.0%) |
| $100,000 to $149,999 | 1 (6.2%) | 1 (33.3%) |
| $150,000 or more | 2 (12.5%) | 0 (0.0%) |
| Total | 16 (100.0%) | 3 (100.0%) |
Property Value to Household Income Ratio in Oakvale
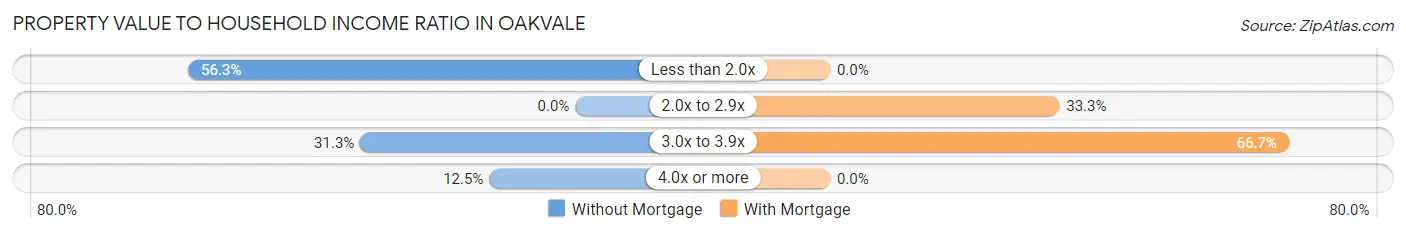
| Value-to-Income Ratio | Without Mortgage | With Mortgage |
| Less than 2.0x | 9 (56.2%) | 0 (0.0%) |
| 2.0x to 2.9x | 0 (0.0%) | 1 (33.3%) |
| 3.0x to 3.9x | 5 (31.2%) | 2 (66.7%) |
| 4.0x or more | 2 (12.5%) | 0 (0.0%) |
| Total | 16 (100.0%) | 3 (100.0%) |
Real Estate Taxes by Mortgage Status in Oakvale
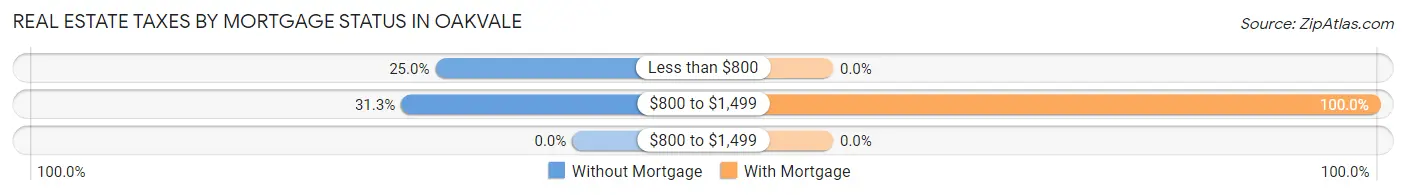
| Property Taxes | Without Mortgage | With Mortgage |
| Less than $800 | 4 (25.0%) | 0 (0.0%) |
| $800 to $1,499 | 5 (31.2%) | 3 (100.0%) |
| $800 to $1,499 | 0 (0.0%) | 0 (0.0%) |
| Total | 16 (100.0%) | 3 (100.0%) |
Health & Disability in Oakvale
Health Insurance Coverage by Age in Oakvale
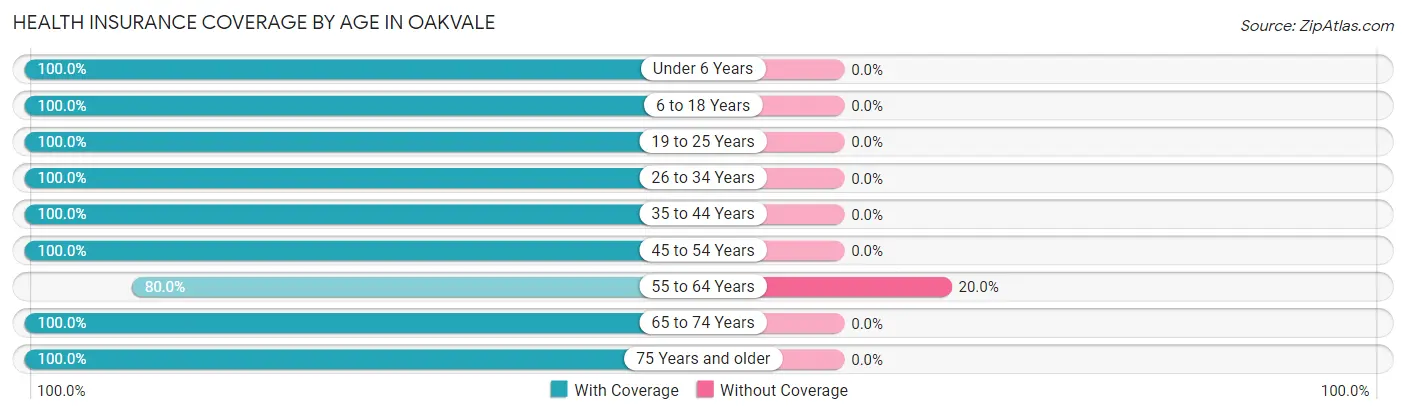
| Age Bracket | With Coverage | Without Coverage |
| Under 6 Years | 8 (100.0%) | 0 (0.0%) |
| 6 to 18 Years | 117 (100.0%) | 0 (0.0%) |
| 19 to 25 Years | 7 (100.0%) | 0 (0.0%) |
| 26 to 34 Years | 17 (100.0%) | 0 (0.0%) |
| 35 to 44 Years | 28 (100.0%) | 0 (0.0%) |
| 45 to 54 Years | 15 (100.0%) | 0 (0.0%) |
| 55 to 64 Years | 8 (80.0%) | 2 (20.0%) |
| 65 to 74 Years | 6 (100.0%) | 0 (0.0%) |
| 75 Years and older | 6 (100.0%) | 0 (0.0%) |
| Total | 212 (99.1%) | 2 (0.9%) |
Health Insurance Coverage by Citizenship Status in Oakvale
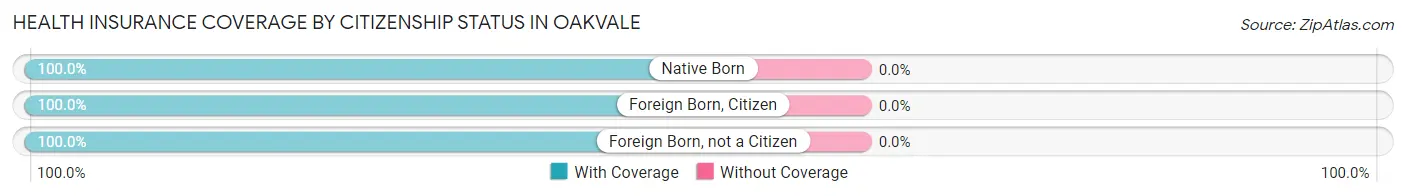
| Citizenship Status | With Coverage | Without Coverage |
| Native Born | 8 (100.0%) | 0 (0.0%) |
| Foreign Born, Citizen | 117 (100.0%) | 0 (0.0%) |
| Foreign Born, not a Citizen | 7 (100.0%) | 0 (0.0%) |
Health Insurance Coverage by Household Income in Oakvale
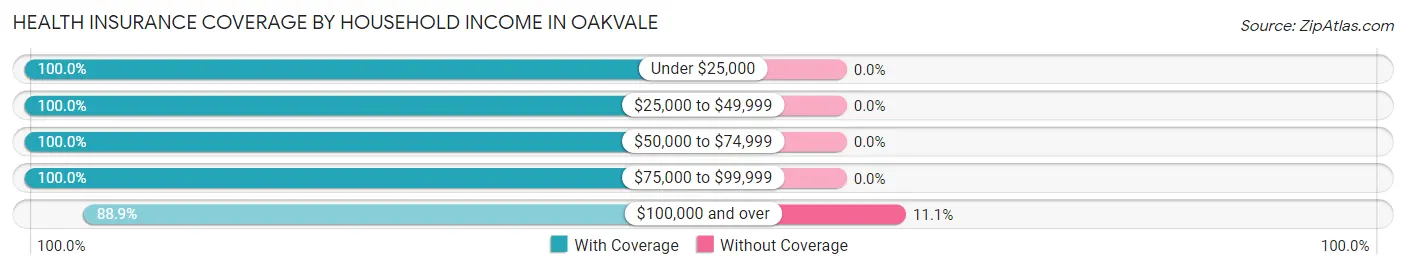
| Household Income | With Coverage | Without Coverage |
| Under $25,000 | 17 (100.0%) | 0 (0.0%) |
| $25,000 to $49,999 | 137 (100.0%) | 0 (0.0%) |
| $50,000 to $74,999 | 36 (100.0%) | 0 (0.0%) |
| $75,000 to $99,999 | 6 (100.0%) | 0 (0.0%) |
| $100,000 and over | 16 (88.9%) | 2 (11.1%) |
Public vs Private Health Insurance Coverage by Age in Oakvale
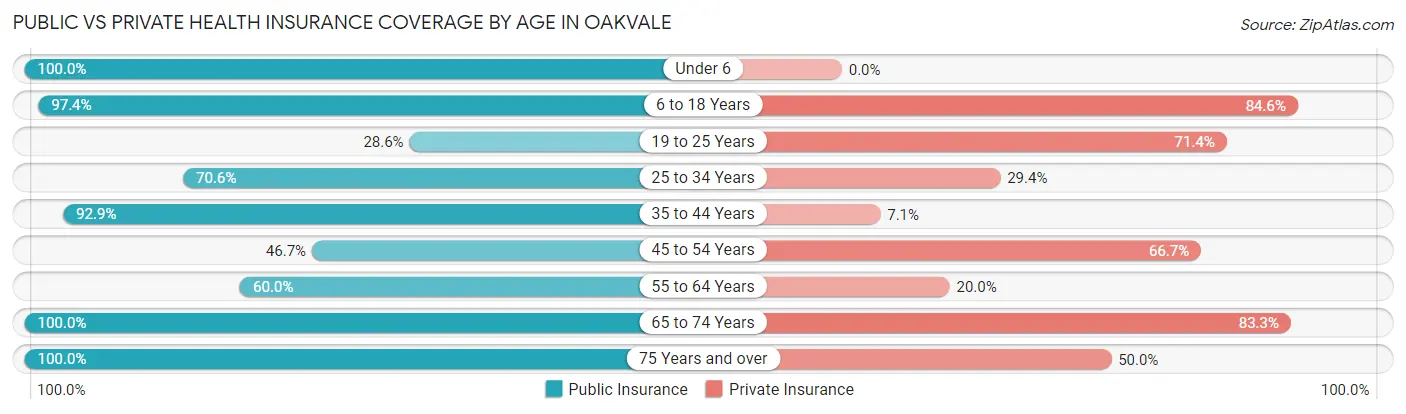
| Age Bracket | Public Insurance | Private Insurance |
| Under 6 | 8 (100.0%) | 0 (0.0%) |
| 6 to 18 Years | 114 (97.4%) | 99 (84.6%) |
| 19 to 25 Years | 2 (28.6%) | 5 (71.4%) |
| 25 to 34 Years | 12 (70.6%) | 5 (29.4%) |
| 35 to 44 Years | 26 (92.9%) | 2 (7.1%) |
| 45 to 54 Years | 7 (46.7%) | 10 (66.7%) |
| 55 to 64 Years | 6 (60.0%) | 2 (20.0%) |
| 65 to 74 Years | 6 (100.0%) | 5 (83.3%) |
| 75 Years and over | 6 (100.0%) | 3 (50.0%) |
| Total | 187 (87.4%) | 131 (61.2%) |
Disability Status by Sex by Age in Oakvale
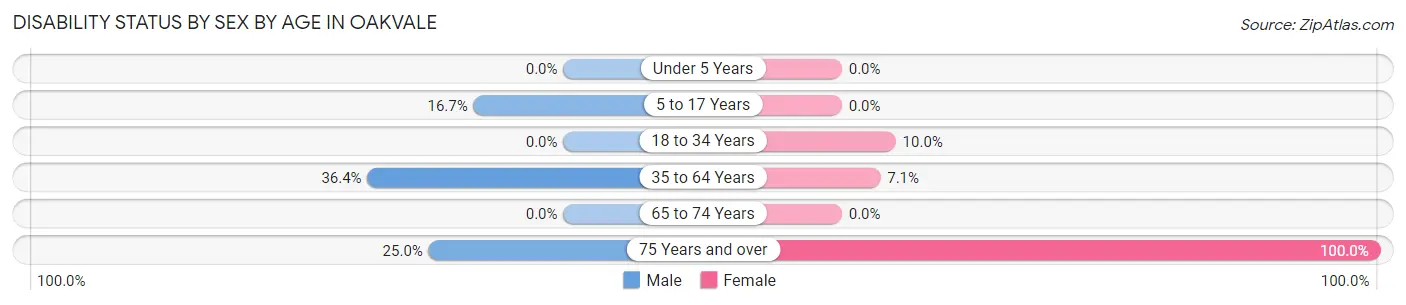
| Age Bracket | Male | Female |
| Under 5 Years | 0 (0.0%) | 0 (0.0%) |
| 5 to 17 Years | 11 (16.7%) | 0 (0.0%) |
| 18 to 34 Years | 0 (0.0%) | 1 (10.0%) |
| 35 to 64 Years | 4 (36.4%) | 3 (7.1%) |
| 65 to 74 Years | 0 (0.0%) | 0 (0.0%) |
| 75 Years and over | 1 (25.0%) | 2 (100.0%) |
Disability Class by Sex by Age in Oakvale
Disability Class: Hearing Difficulty
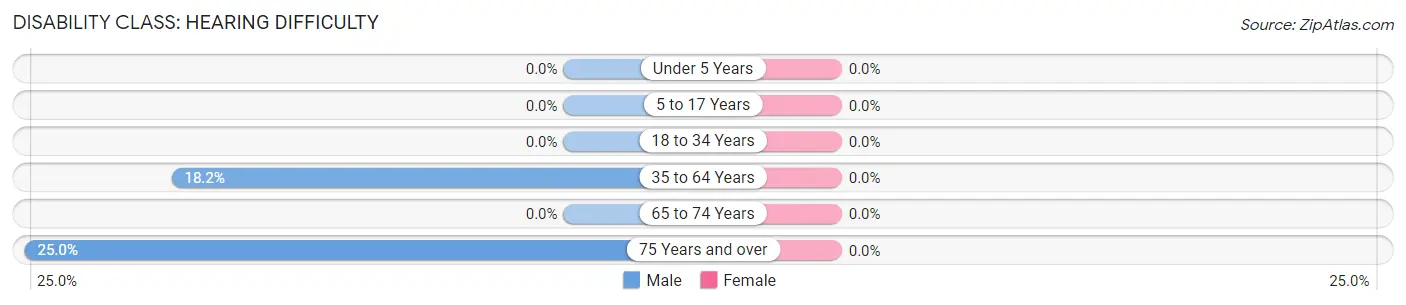
| Age Bracket | Male | Female |
| Under 5 Years | 0 (0.0%) | 0 (0.0%) |
| 5 to 17 Years | 0 (0.0%) | 0 (0.0%) |
| 18 to 34 Years | 0 (0.0%) | 0 (0.0%) |
| 35 to 64 Years | 2 (18.2%) | 0 (0.0%) |
| 65 to 74 Years | 0 (0.0%) | 0 (0.0%) |
| 75 Years and over | 1 (25.0%) | 0 (0.0%) |
Disability Class: Vision Difficulty
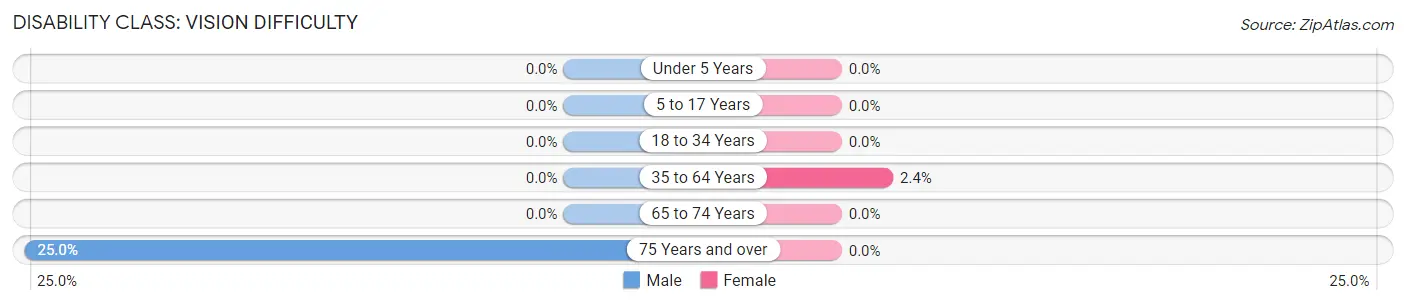
| Age Bracket | Male | Female |
| Under 5 Years | 0 (0.0%) | 0 (0.0%) |
| 5 to 17 Years | 0 (0.0%) | 0 (0.0%) |
| 18 to 34 Years | 0 (0.0%) | 0 (0.0%) |
| 35 to 64 Years | 0 (0.0%) | 1 (2.4%) |
| 65 to 74 Years | 0 (0.0%) | 0 (0.0%) |
| 75 Years and over | 1 (25.0%) | 0 (0.0%) |
Disability Class: Cognitive Difficulty
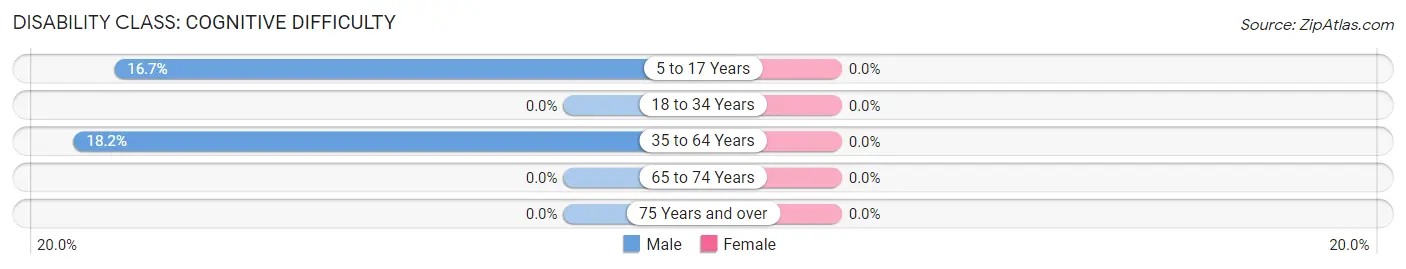
| Age Bracket | Male | Female |
| 5 to 17 Years | 11 (16.7%) | 0 (0.0%) |
| 18 to 34 Years | 0 (0.0%) | 0 (0.0%) |
| 35 to 64 Years | 2 (18.2%) | 0 (0.0%) |
| 65 to 74 Years | 0 (0.0%) | 0 (0.0%) |
| 75 Years and over | 0 (0.0%) | 0 (0.0%) |
Disability Class: Ambulatory Difficulty
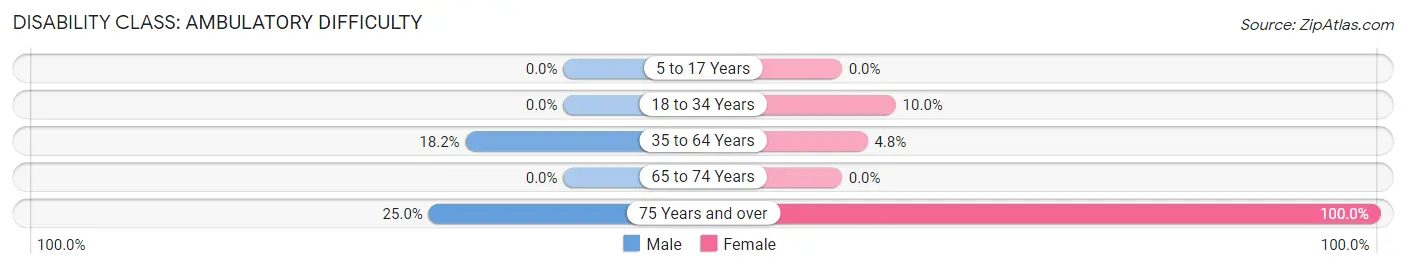
| Age Bracket | Male | Female |
| 5 to 17 Years | 0 (0.0%) | 0 (0.0%) |
| 18 to 34 Years | 0 (0.0%) | 1 (10.0%) |
| 35 to 64 Years | 2 (18.2%) | 2 (4.8%) |
| 65 to 74 Years | 0 (0.0%) | 0 (0.0%) |
| 75 Years and over | 1 (25.0%) | 2 (100.0%) |
Disability Class: Self-Care Difficulty
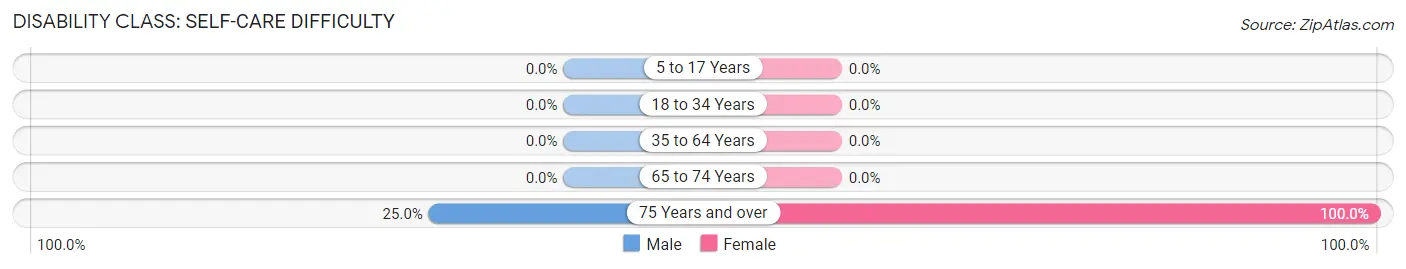
| Age Bracket | Male | Female |
| 5 to 17 Years | 0 (0.0%) | 0 (0.0%) |
| 18 to 34 Years | 0 (0.0%) | 0 (0.0%) |
| 35 to 64 Years | 0 (0.0%) | 0 (0.0%) |
| 65 to 74 Years | 0 (0.0%) | 0 (0.0%) |
| 75 Years and over | 1 (25.0%) | 2 (100.0%) |
Technology Access in Oakvale
Computing Device Access in Oakvale
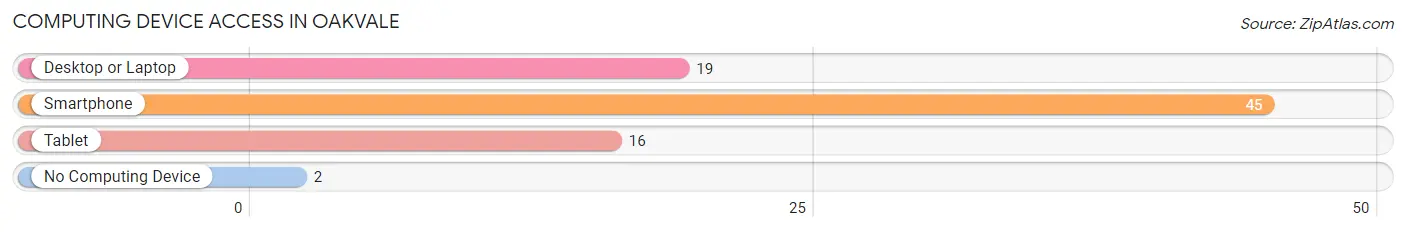
| Device Type | # Households | % Households |
| Desktop or Laptop | 19 | 38.0% |
| Smartphone | 45 | 90.0% |
| Tablet | 16 | 32.0% |
| No Computing Device | 2 | 4.0% |
| Total | 50 | 100.0% |
Internet Access in Oakvale
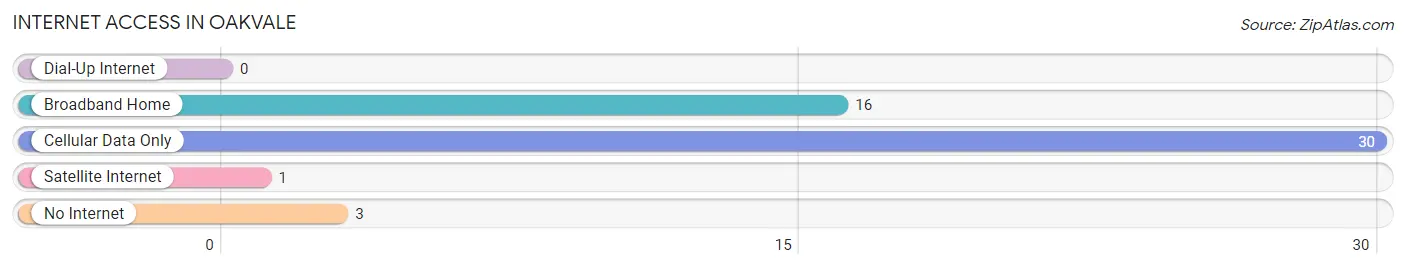
| Internet Type | # Households | % Households |
| Dial-Up Internet | 0 | 0.0% |
| Broadband Home | 16 | 32.0% |
| Cellular Data Only | 30 | 60.0% |
| Satellite Internet | 1 | 2.0% |
| No Internet | 3 | 6.0% |
| Total | 50 | 100.0% |
Oakvale Summary
History
The small town of Oakvale, West Virginia is located in the southern part of the state, in Mercer County. It was founded in 1883 by a group of settlers from the nearby town of Princeton. The town was named after the nearby Oakvale Creek, which was named for the abundance of oak trees in the area.
The town was originally a farming community, with the main crops being corn, wheat, and tobacco. The town also had a few small businesses, such as a general store, a blacksmith, and a post office.
In the early 1900s, the town began to grow and develop. The railroad came to town in 1906, and the town began to attract more businesses and residents. The town also had a school, a bank, and a few churches.
In the 1920s, the town began to decline. The Great Depression hit the town hard, and many of the businesses and residents left. The town was able to survive, however, and by the 1950s, it had begun to recover.
The town continued to grow and develop throughout the 20th century. In the 1970s, the town was incorporated, and it has since become a popular tourist destination. The town is home to several historic sites, including the Oakvale Historic District, which is listed on the National Register of Historic Places.
Geography
Oakvale is located in the southern part of Mercer County, West Virginia. It is situated in the Appalachian Mountains, and is surrounded by rolling hills and forests. The town is located near the Bluestone River, which is a tributary of the New River.
The town has a total area of 1.2 square miles, all of which is land. The town has a humid subtropical climate, with hot, humid summers and mild winters.
Economy
The economy of Oakvale is largely based on tourism. The town is home to several historic sites, including the Oakvale Historic District, which is listed on the National Register of Historic Places. The town also has several restaurants, shops, and other businesses that cater to tourists.
The town also has a few small manufacturing businesses, such as a furniture factory and a woodworking shop. The town also has a few small farms, which produce corn, wheat, and tobacco.
Demographics
As of the 2010 census, the population of Oakvale was 1,845. The town has a population density of 1,521 people per square mile. The median age of the population is 44.7 years, and the median household income is $35,938.
The town is predominantly white, with 92.3% of the population being white. The town also has a small African American population, with 4.2% of the population being African American. The town also has a small Hispanic population, with 1.3% of the population being Hispanic.
Conclusion
Oakvale, West Virginia is a small town located in the southern part of Mercer County. The town was founded in 1883, and has since become a popular tourist destination. The town has a humid subtropical climate, and is home to several historic sites. The economy of the town is largely based on tourism, and the town also has a few small manufacturing businesses and farms. The population of the town is predominantly white, with a small African American and Hispanic population.
Common Questions
What is Per Capita Income in Oakvale?
Per Capita income in Oakvale is $14,063.
What is Income or Wage Gap in Oakvale?
Income or Wage Gap in Oakvale is 24.5%.
Women in Oakvale earn 75.5 cents for every dollar earned by a man.
What is Family Income Deficit in Oakvale?
Family Income Deficit in Oakvale is $9,380.
Families that are below poverty line in Oakvale earn $9,380 less on average than the poverty threshold level.
What is Inequality or Gini Index in Oakvale?
Inequality or Gini Index in Oakvale is 0.48.
What is the Total Population of Oakvale?
Total Population of Oakvale is 214.
What is the Total Male Population of Oakvale?
Total Male Population of Oakvale is 101.
What is the Total Female Population of Oakvale?
Total Female Population of Oakvale is 113.
What is the Ratio of Males per 100 Females in Oakvale?
There are 89.38 Males per 100 Females in Oakvale.
What is the Ratio of Females per 100 Males in Oakvale?
There are 111.88 Females per 100 Males in Oakvale.
What is the Median Population Age in Oakvale?
Median Population Age in Oakvale is 11.8 Years.
What is the Average Family Size in Oakvale
Average Family Size in Oakvale is 4.3 People.
What is the Average Household Size in Oakvale
Average Household Size in Oakvale is 4.3 People.
How Large is the Labor Force in Oakvale?
There are 60 People in the Labor Forcein in Oakvale.
What is the Percentage of People in the Labor Force in Oakvale?
65.2% of People are in the Labor Force in Oakvale.
What is the Unemployment Rate in Oakvale?
Unemployment Rate in Oakvale is 11.7%.