Fort Green Springs, FL Map & Demographics
Fort Green Springs Map
Fort Green Springs Overview
$17,520
PER CAPITA INCOME
$38,672
AVG FAMILY INCOME
$76,078
AVG HOUSEHOLD INCOME
0.23
INEQUALITY / GINI INDEX
573
TOTAL POPULATION
281
MALE POPULATION
292
FEMALE POPULATION
96.23
MALES / 100 FEMALES
103.91
FEMALES / 100 MALES
14.1
MEDIAN AGE
3.5
AVG FAMILY SIZE
4.4
AVG HOUSEHOLD SIZE
208
LABOR FORCE [ PEOPLE ]
82.2%
PERCENT IN LABOR FORCE
Income in Fort Green Springs
Income Overview in Fort Green Springs
Per Capita Income in Fort Green Springs is $17,520, while median incomes of families and households are $38,672 and $76,078 respectively.
| Characteristic | Number | Measure |
| Per Capita Income | 573 | $17,520 |
| Median Family Income | 131 | $38,672 |
| Mean Family Income | 131 | $47,646 |
| Median Household Income | 131 | $76,078 |
| Mean Household Income | 131 | $72,368 |
| Income Deficit | 131 | $0 |
| Wage / Income Gap (%) | 573 | 0.00% |
| Wage / Income Gap ($) | 573 | 100.00¢ per $1 |
| Gini / Inequality Index | 573 | 0.23 |
Earnings by Sex in Fort Green Springs
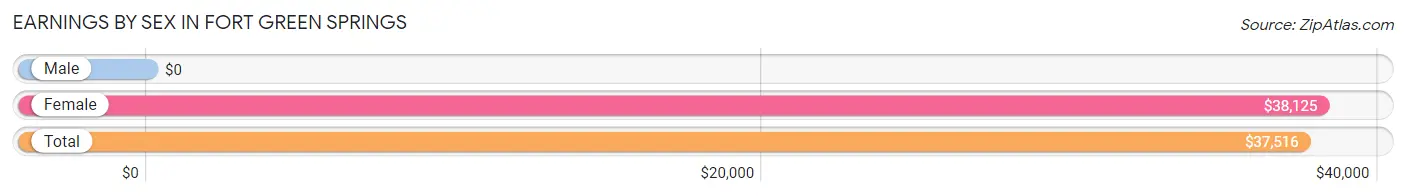
| Sex | Number | Average Earnings |
| Male | 103 (46.2%) | $0 |
| Female | 120 (53.8%) | $38,125 |
| Total | 223 (100.0%) | $37,516 |
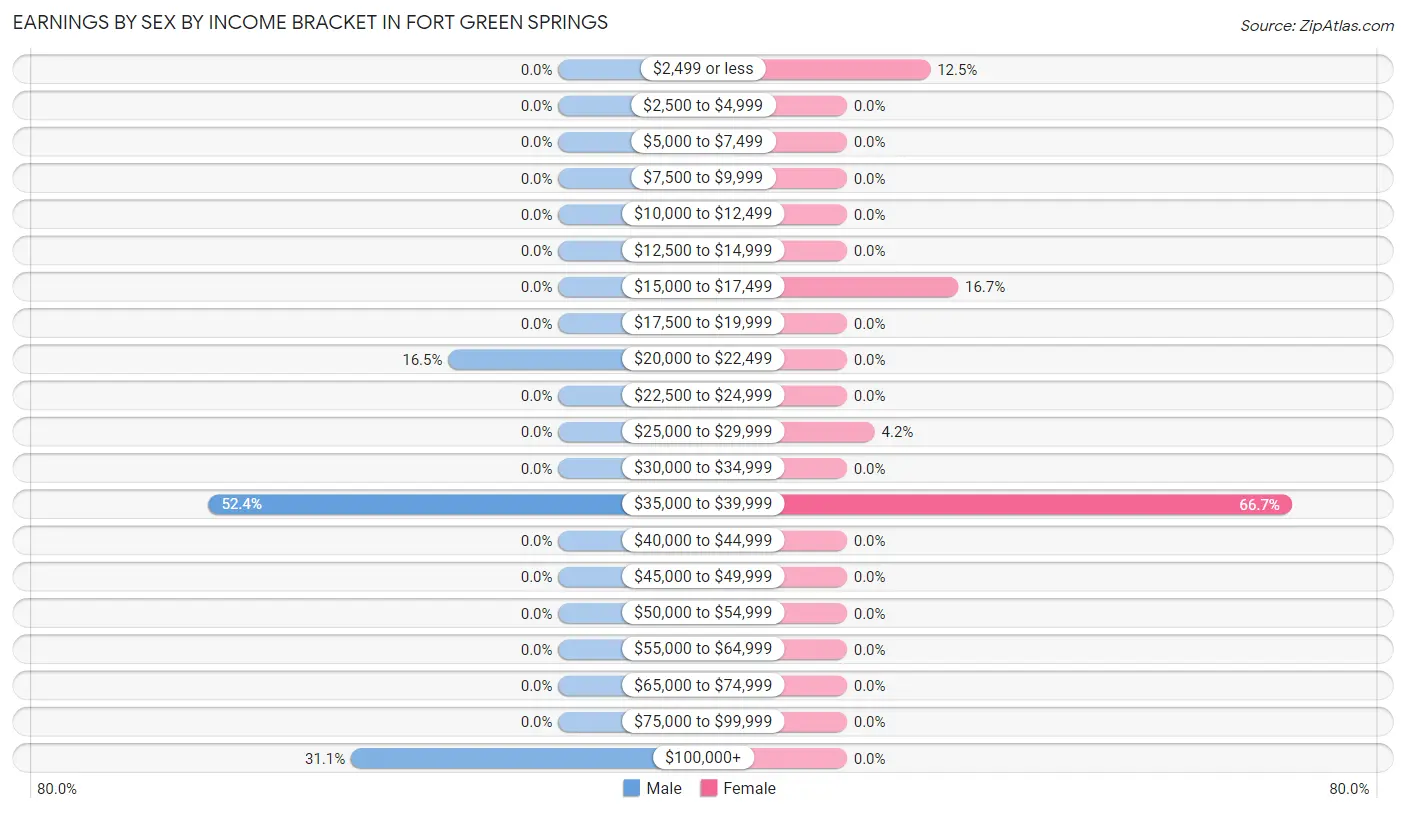
Earnings by Sex by Income Bracket in Fort Green Springs
The most common earnings brackets in Fort Green Springs are $35,000 to $39,999 for men (54 | 52.4%) and $35,000 to $39,999 for women (80 | 66.7%).
| Income | Male | Female |
| $2,499 or less | 0 (0.0%) | 15 (12.5%) |
| $2,500 to $4,999 | 0 (0.0%) | 0 (0.0%) |
| $5,000 to $7,499 | 0 (0.0%) | 0 (0.0%) |
| $7,500 to $9,999 | 0 (0.0%) | 0 (0.0%) |
| $10,000 to $12,499 | 0 (0.0%) | 0 (0.0%) |
| $12,500 to $14,999 | 0 (0.0%) | 0 (0.0%) |
| $15,000 to $17,499 | 0 (0.0%) | 20 (16.7%) |
| $17,500 to $19,999 | 0 (0.0%) | 0 (0.0%) |
| $20,000 to $22,499 | 17 (16.5%) | 0 (0.0%) |
| $22,500 to $24,999 | 0 (0.0%) | 0 (0.0%) |
| $25,000 to $29,999 | 0 (0.0%) | 5 (4.2%) |
| $30,000 to $34,999 | 0 (0.0%) | 0 (0.0%) |
| $35,000 to $39,999 | 54 (52.4%) | 80 (66.7%) |
| $40,000 to $44,999 | 0 (0.0%) | 0 (0.0%) |
| $45,000 to $49,999 | 0 (0.0%) | 0 (0.0%) |
| $50,000 to $54,999 | 0 (0.0%) | 0 (0.0%) |
| $55,000 to $64,999 | 0 (0.0%) | 0 (0.0%) |
| $65,000 to $74,999 | 0 (0.0%) | 0 (0.0%) |
| $75,000 to $99,999 | 0 (0.0%) | 0 (0.0%) |
| $100,000+ | 32 (31.1%) | 0 (0.0%) |
| Total | 103 (100.0%) | 120 (100.0%) |
Earnings by Sex by Educational Attainment in Fort Green Springs
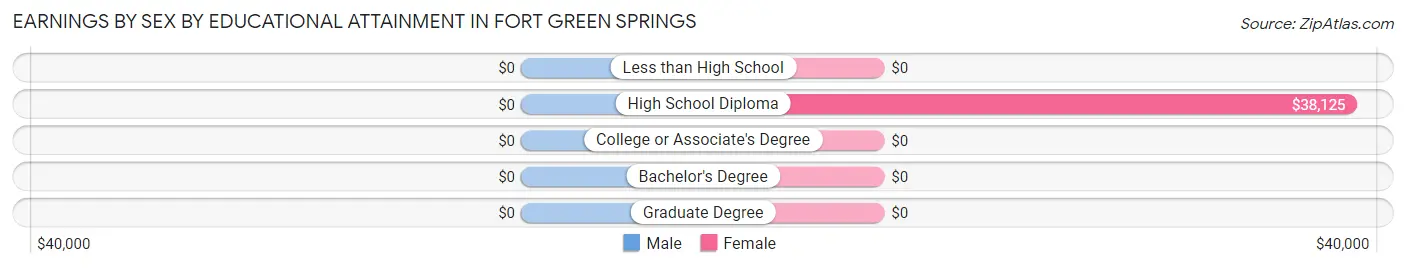
| Educational Attainment | Male Income | Female Income |
| Less than High School | - | - |
| High School Diploma | - | - |
| College or Associate's Degree | - | - |
| Bachelor's Degree | - | - |
| Graduate Degree | - | - |
| Total | - | - |
Family Income in Fort Green Springs
Family Income Brackets in Fort Green Springs
According to the Fort Green Springs family income data, there are 80 families falling into the $35,000 to $49,999 income range, which is the most common income bracket and makes up 61.1% of all families.
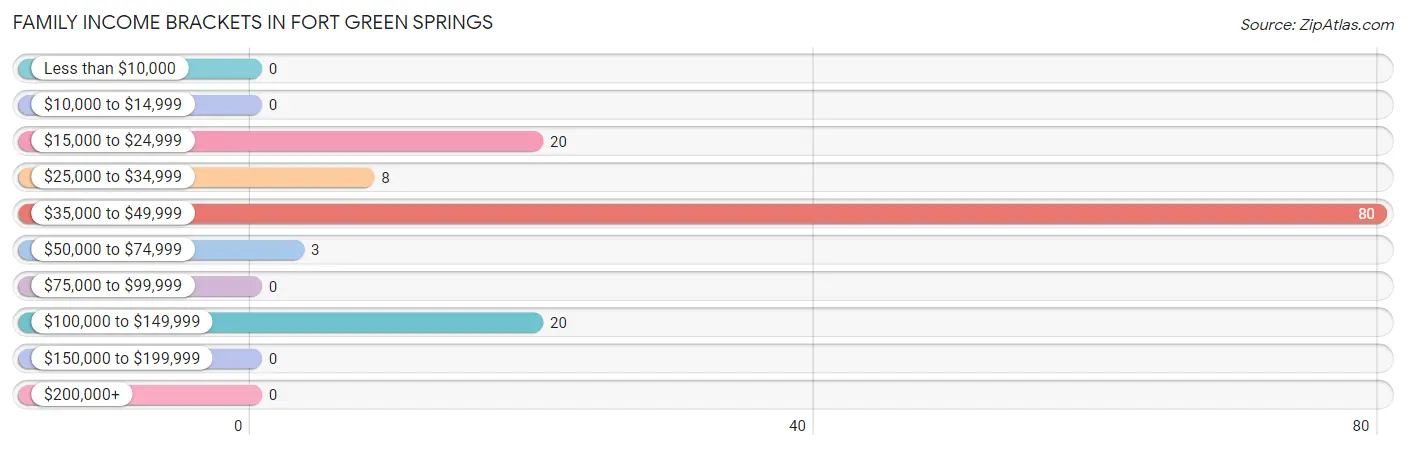
| Income Bracket | # Families | % Families |
| Less than $10,000 | 0 | 0.0% |
| $10,000 to $14,999 | 0 | 0.0% |
| $15,000 to $24,999 | 20 | 15.3% |
| $25,000 to $34,999 | 8 | 6.1% |
| $35,000 to $49,999 | 80 | 61.1% |
| $50,000 to $74,999 | 3 | 2.3% |
| $75,000 to $99,999 | 0 | 0.0% |
| $100,000 to $149,999 | 20 | 15.3% |
| $150,000 to $199,999 | 0 | 0.0% |
| $200,000+ | 0 | 0.0% |
Family Income by Famaliy Size in Fort Green Springs
5-person families (98 | 74.8%) account for the highest median family income in Fort Green Springs with $39,031 per family, while 5-person families (98 | 74.8%) have the highest median income of $7,806 per family member.
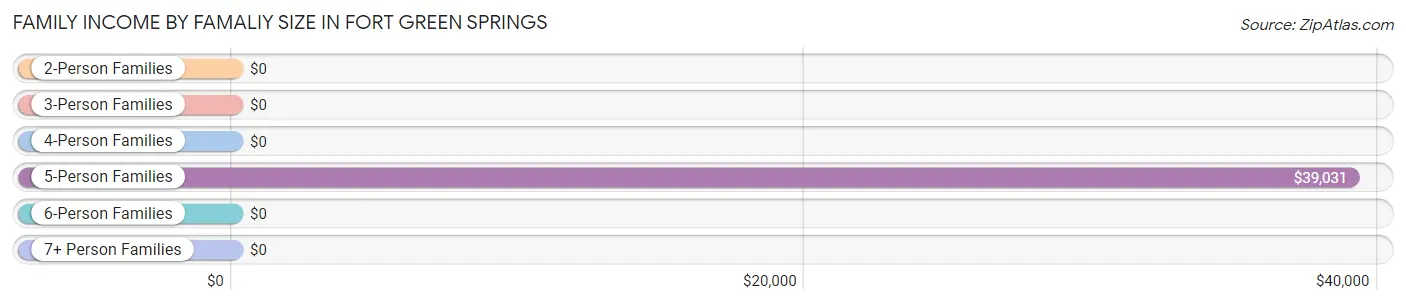
| Income Bracket | # Families | Median Income |
| 2-Person Families | 13 (9.9%) | $0 |
| 3-Person Families | 20 (15.3%) | $0 |
| 4-Person Families | 0 (0.0%) | $0 |
| 5-Person Families | 98 (74.8%) | $39,031 |
| 6-Person Families | 0 (0.0%) | $0 |
| 7+ Person Families | 0 (0.0%) | $0 |
| Total | 131 (100.0%) | $38,672 |
Family Income by Number of Earners in Fort Green Springs
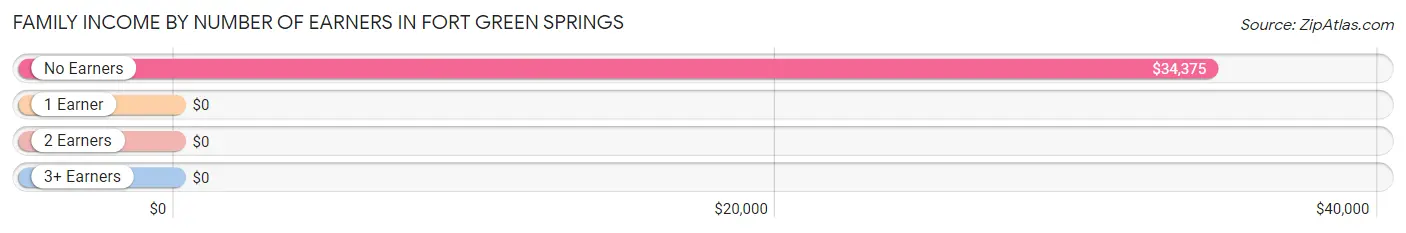
| Number of Earners | # Families | Median Income |
| No Earners | 12 (9.2%) | $34,375 |
| 1 Earner | 100 (76.3%) | $0 |
| 2 Earners | 19 (14.5%) | $0 |
| 3+ Earners | 0 (0.0%) | $0 |
| Total | 131 (100.0%) | $38,672 |
Household Income in Fort Green Springs
Household Income Brackets in Fort Green Springs
With 80 households falling in the category, the $75,000 to $99,999 income range is the most frequent in Fort Green Springs, accounting for 61.1% of all households.
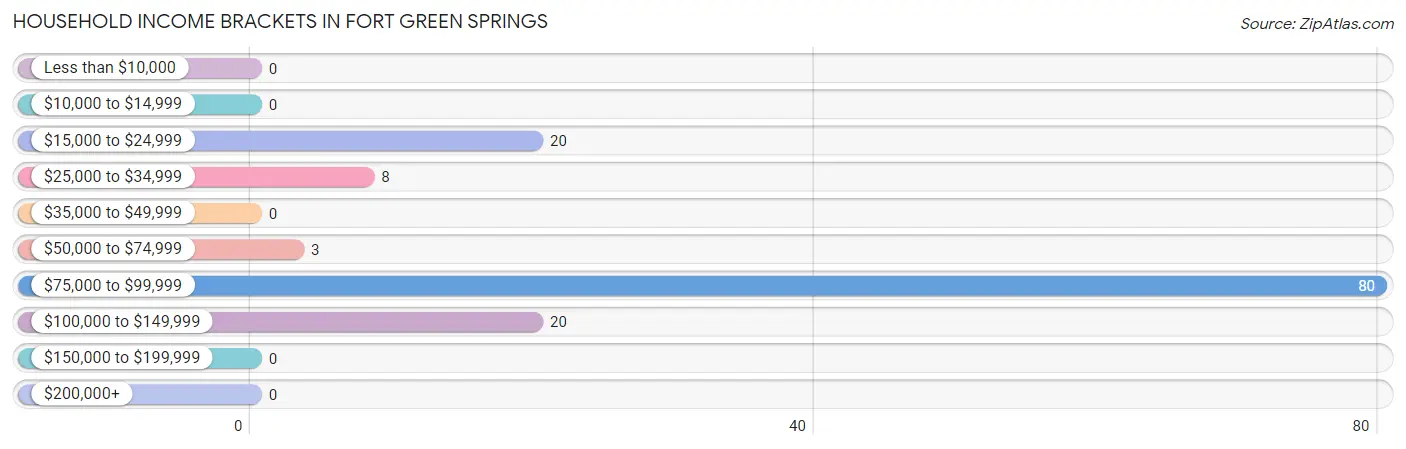
| Income Bracket | # Households | % Households |
| Less than $10,000 | 0 | 0.0% |
| $10,000 to $14,999 | 0 | 0.0% |
| $15,000 to $24,999 | 20 | 15.3% |
| $25,000 to $34,999 | 8 | 6.1% |
| $35,000 to $49,999 | 0 | 0.0% |
| $50,000 to $74,999 | 3 | 2.3% |
| $75,000 to $99,999 | 80 | 61.1% |
| $100,000 to $149,999 | 20 | 15.3% |
| $150,000 to $199,999 | 0 | 0.0% |
| $200,000+ | 0 | 0.0% |
Household Income by Householder Age in Fort Green Springs
| Income Bracket | # Households | Median Income |
| 15 to 24 Years | 0 (0.0%) | $0 |
| 25 to 44 Years | 95 (72.5%) | $0 |
| 45 to 64 Years | 32 (24.4%) | $0 |
| 65+ Years | 4 (3.0%) | $0 |
| Total | 131 (100.0%) | $76,078 |
Poverty in Fort Green Springs
Income Below Poverty by Sex and Age in Fort Green Springs
With 15.6% poverty level for males and 10.6% for females among the residents of Fort Green Springs, 6 to 11 year old males and 15 year old females are the most vulnerable to poverty, with 38 males (58.5%) and 11 females (100.0%) in their respective age groups living below the poverty level.
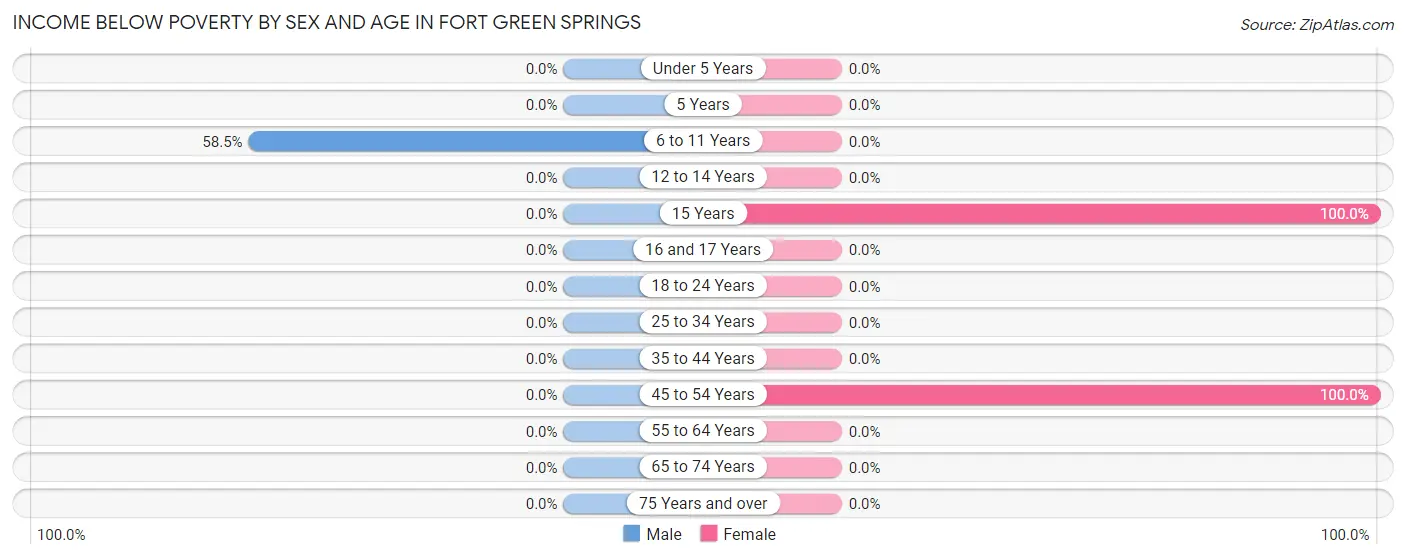
| Age Bracket | Male | Female |
| Under 5 Years | 0 (0.0%) | 0 (0.0%) |
| 5 Years | 0 (0.0%) | 0 (0.0%) |
| 6 to 11 Years | 38 (58.5%) | 0 (0.0%) |
| 12 to 14 Years | 0 (0.0%) | 0 (0.0%) |
| 15 Years | 0 (0.0%) | 11 (100.0%) |
| 16 and 17 Years | 0 (0.0%) | 0 (0.0%) |
| 18 to 24 Years | 0 (0.0%) | 0 (0.0%) |
| 25 to 34 Years | 0 (0.0%) | 0 (0.0%) |
| 35 to 44 Years | 0 (0.0%) | 0 (0.0%) |
| 45 to 54 Years | 0 (0.0%) | 20 (100.0%) |
| 55 to 64 Years | 0 (0.0%) | 0 (0.0%) |
| 65 to 74 Years | 0 (0.0%) | 0 (0.0%) |
| 75 Years and over | 0 (0.0%) | 0 (0.0%) |
| Total | 38 (15.6%) | 31 (10.6%) |
Income Above Poverty by Sex and Age in Fort Green Springs
According to the poverty statistics in Fort Green Springs, males aged under 5 years and females aged 5 years are the age groups that are most secure financially, with 100.0% of males and 100.0% of females in these age groups living above the poverty line.
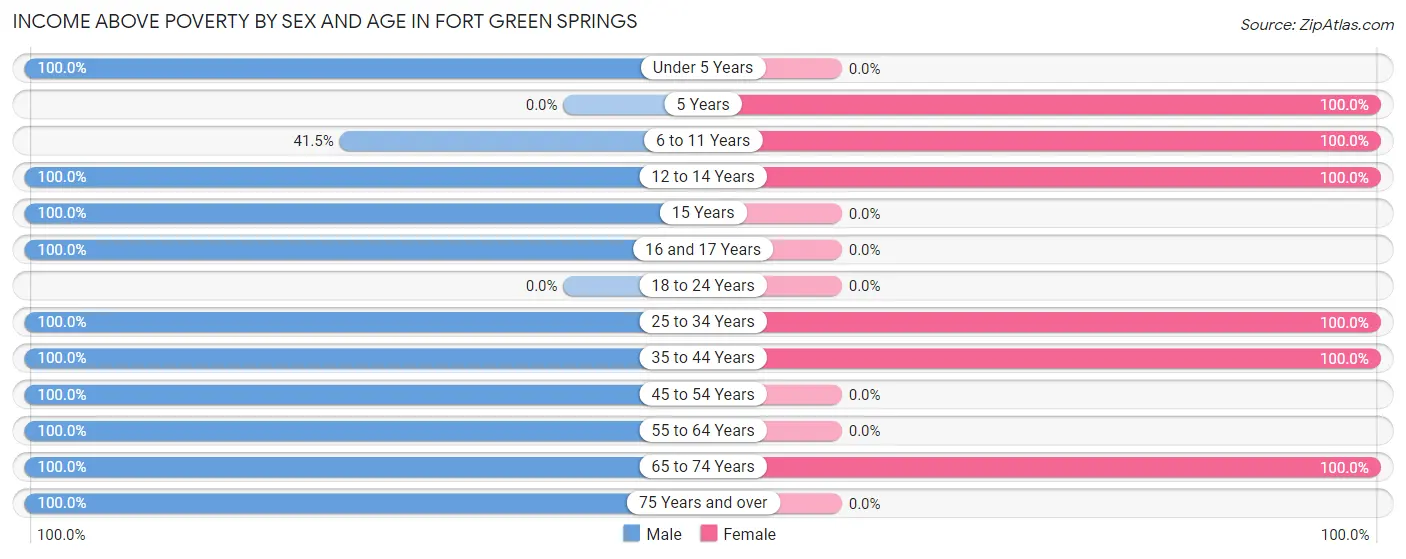
| Age Bracket | Male | Female |
| Under 5 Years | 44 (100.0%) | 0 (0.0%) |
| 5 Years | 0 (0.0%) | 63 (100.0%) |
| 6 to 11 Years | 27 (41.5%) | 6 (100.0%) |
| 12 to 14 Years | 3 (100.0%) | 87 (100.0%) |
| 15 Years | 3 (100.0%) | 0 (0.0%) |
| 16 and 17 Years | 13 (100.0%) | 0 (0.0%) |
| 18 to 24 Years | 0 (0.0%) | 0 (0.0%) |
| 25 to 34 Years | 71 (100.0%) | 15 (100.0%) |
| 35 to 44 Years | 28 (100.0%) | 89 (100.0%) |
| 45 to 54 Years | 4 (100.0%) | 0 (0.0%) |
| 55 to 64 Years | 8 (100.0%) | 0 (0.0%) |
| 65 to 74 Years | 3 (100.0%) | 1 (100.0%) |
| 75 Years and over | 1 (100.0%) | 0 (0.0%) |
| Total | 205 (84.4%) | 261 (89.4%) |
Income Below Poverty Among Married-Couple Families in Fort Green Springs
| Children | Above Poverty | Below Poverty |
| No Children | 5 (100.0%) | 0 (0.0%) |
| 1 or 2 Children | 0 (0.0%) | 0 (0.0%) |
| 3 or 4 Children | 18 (100.0%) | 0 (0.0%) |
| 5 or more Children | 0 (0.0%) | 0 (0.0%) |
| Total | 23 (100.0%) | 0 (0.0%) |
Income Below Poverty Among Single-Parent Households in Fort Green Springs
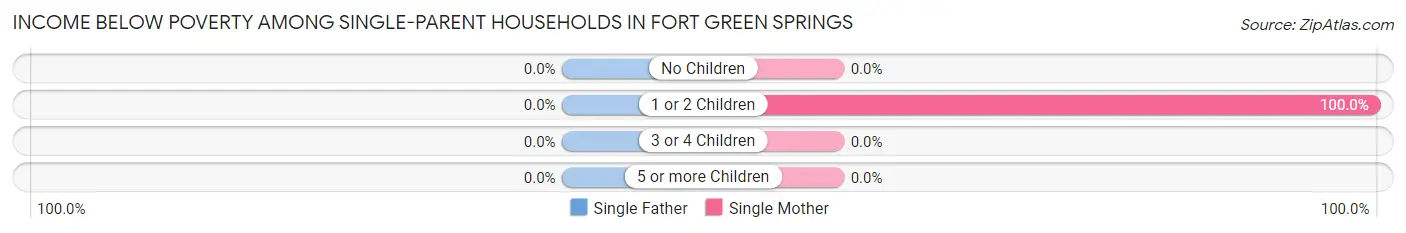
| Children | Single Father | Single Mother |
| No Children | 0 (0.0%) | 0 (0.0%) |
| 1 or 2 Children | 0 (0.0%) | 20 (100.0%) |
| 3 or 4 Children | 0 (0.0%) | 0 (0.0%) |
| 5 or more Children | 0 (0.0%) | 0 (0.0%) |
| Total | 0 (0.0%) | 20 (20.0%) |
Income Below Poverty Among Married-Couple vs Single-Parent Households in Fort Green Springs
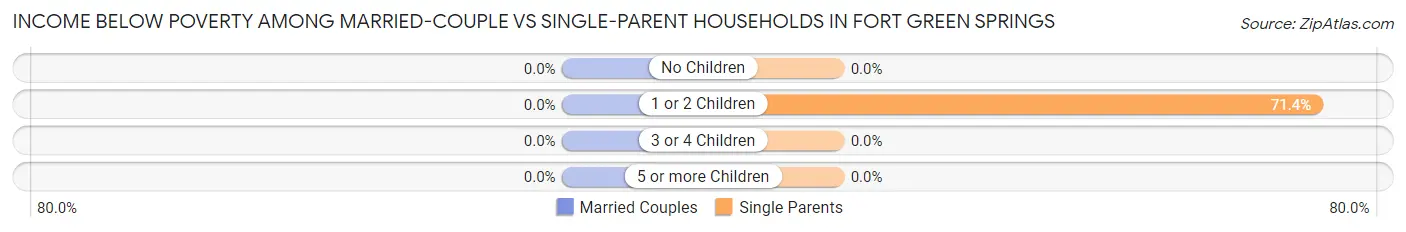
| Children | Married-Couple Families | Single-Parent Households |
| No Children | 0 (0.0%) | 0 (0.0%) |
| 1 or 2 Children | 0 (0.0%) | 20 (71.4%) |
| 3 or 4 Children | 0 (0.0%) | 0 (0.0%) |
| 5 or more Children | 0 (0.0%) | 0 (0.0%) |
| Total | 0 (0.0%) | 20 (18.5%) |
Race in Fort Green Springs
The most populous races in Fort Green Springs are White / Caucasian (556 | 97.0%), Hispanic or Latino (105 | 18.3%), and Two or more Races (17 | 3.0%).
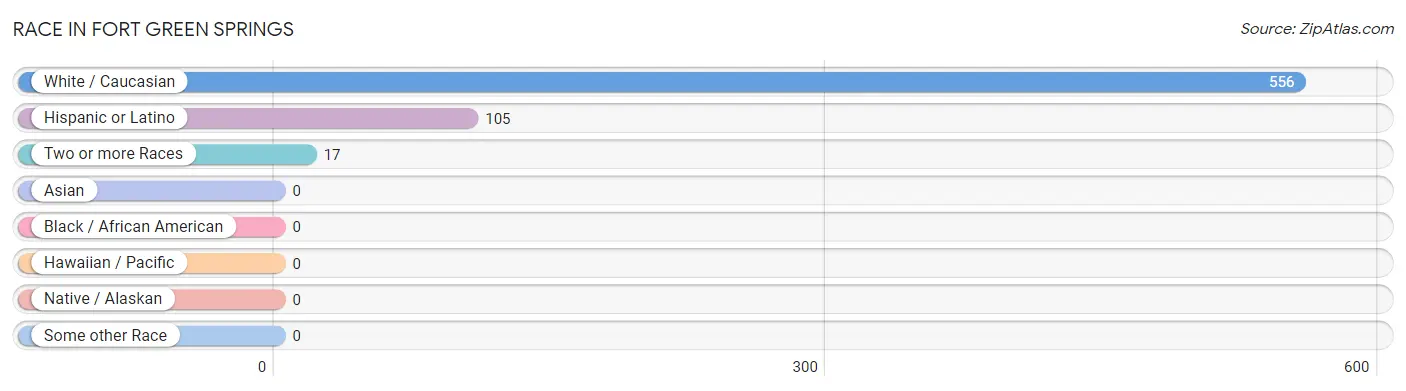
| Race | # Population | % Population |
| Asian | 0 | 0.0% |
| Black / African American | 0 | 0.0% |
| Hawaiian / Pacific | 0 | 0.0% |
| Hispanic or Latino | 105 | 18.3% |
| Native / Alaskan | 0 | 0.0% |
| White / Caucasian | 556 | 97.0% |
| Two or more Races | 17 | 3.0% |
| Some other Race | 0 | 0.0% |
| Total | 573 | 100.0% |
Ancestry in Fort Green Springs
The most populous ancestries reported in Fort Green Springs are Mexican (105 | 18.3%), Ukrainian (13 | 2.3%), English (4 | 0.7%), and Italian (1 | 0.2%), together accounting for 21.5% of all Fort Green Springs residents.
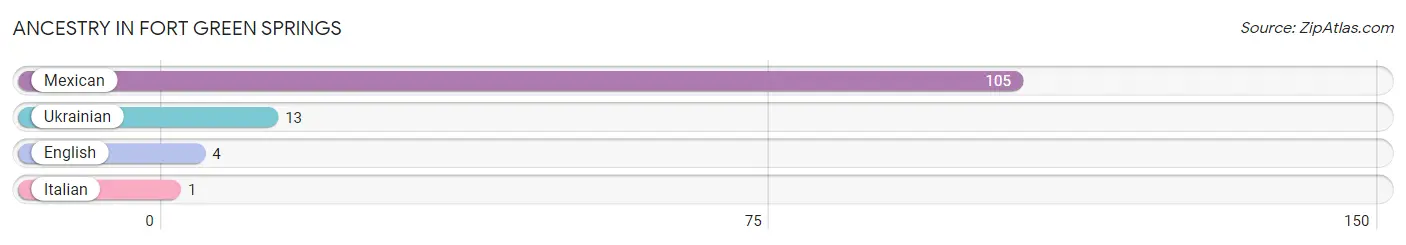
| Ancestry | # Population | % Population |
| English | 4 | 0.7% |
| Italian | 1 | 0.2% |
| Mexican | 105 | 18.3% |
| Ukrainian | 13 | 2.3% | View All 4 Rows |
Immigrants in Fort Green Springs

| Immigration Origin | # Population | % Population | View All 0 Rows |
Sex and Age in Fort Green Springs
Sex and Age in Fort Green Springs
The most populous age groups in Fort Green Springs are 10 to 14 Years (55 | 19.6%) for men and 10 to 14 Years (93 | 31.9%) for women.
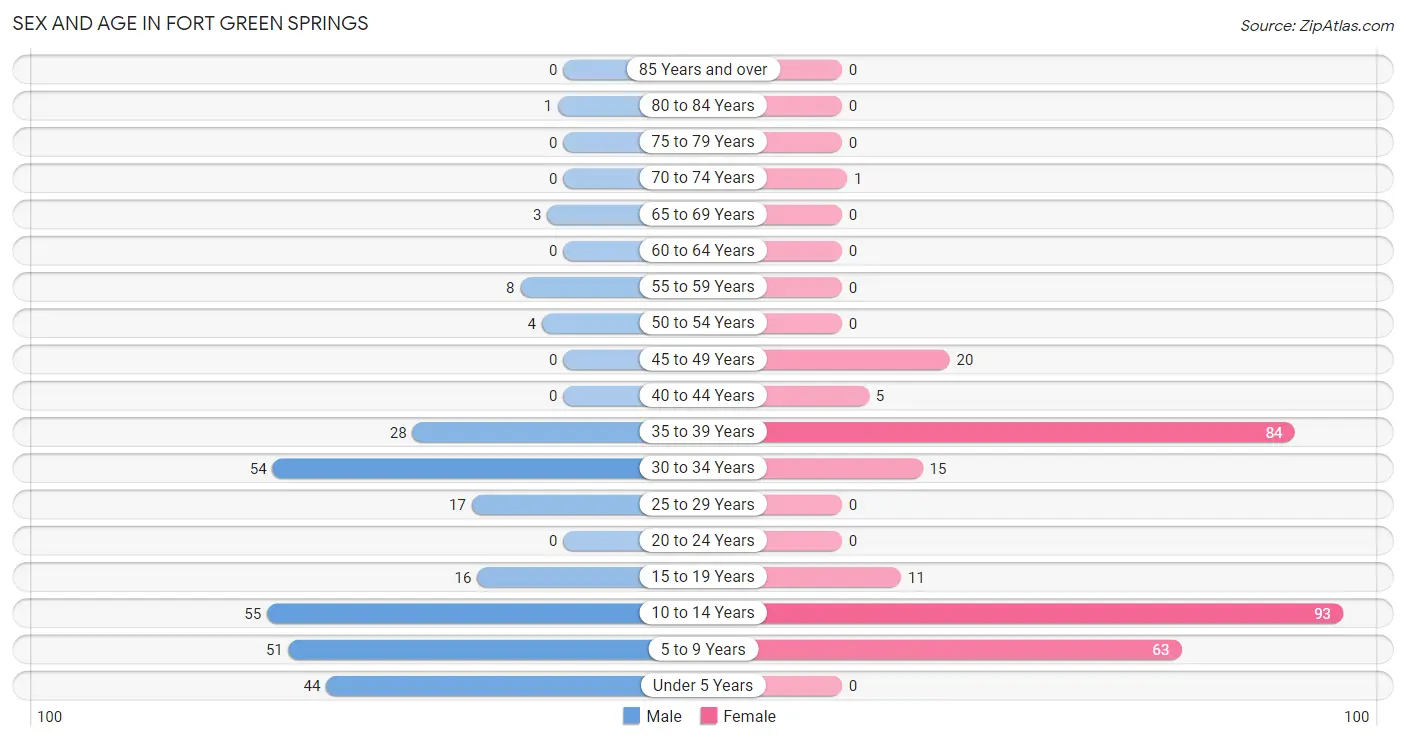
| Age Bracket | Male | Female |
| Under 5 Years | 44 (15.7%) | 0 (0.0%) |
| 5 to 9 Years | 51 (18.1%) | 63 (21.6%) |
| 10 to 14 Years | 55 (19.6%) | 93 (31.9%) |
| 15 to 19 Years | 16 (5.7%) | 11 (3.8%) |
| 20 to 24 Years | 0 (0.0%) | 0 (0.0%) |
| 25 to 29 Years | 17 (6.0%) | 0 (0.0%) |
| 30 to 34 Years | 54 (19.2%) | 15 (5.1%) |
| 35 to 39 Years | 28 (10.0%) | 84 (28.8%) |
| 40 to 44 Years | 0 (0.0%) | 5 (1.7%) |
| 45 to 49 Years | 0 (0.0%) | 20 (6.9%) |
| 50 to 54 Years | 4 (1.4%) | 0 (0.0%) |
| 55 to 59 Years | 8 (2.9%) | 0 (0.0%) |
| 60 to 64 Years | 0 (0.0%) | 0 (0.0%) |
| 65 to 69 Years | 3 (1.1%) | 0 (0.0%) |
| 70 to 74 Years | 0 (0.0%) | 1 (0.3%) |
| 75 to 79 Years | 0 (0.0%) | 0 (0.0%) |
| 80 to 84 Years | 1 (0.4%) | 0 (0.0%) |
| 85 Years and over | 0 (0.0%) | 0 (0.0%) |
| Total | 281 (100.0%) | 292 (100.0%) |
Families and Households in Fort Green Springs
Median Family Size in Fort Green Springs
The median family size in Fort Green Springs is 3.46 persons per family, with married-couple families (23 | 17.6%) accounting for the largest median family size of 5 persons per family. On the other hand, single male/father families (8 | 6.1%) represent the smallest median family size with 1.75 persons per family.
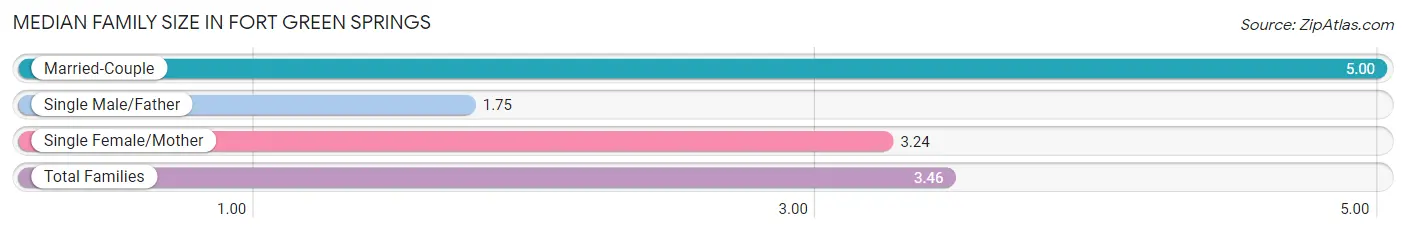
| Family Type | # Families | Family Size |
| Married-Couple | 23 (17.6%) | 5.00 |
| Single Male/Father | 8 (6.1%) | 1.75 |
| Single Female/Mother | 100 (76.3%) | 3.24 |
| Total Families | 131 (100.0%) | 3.46 |
Median Household Size in Fort Green Springs
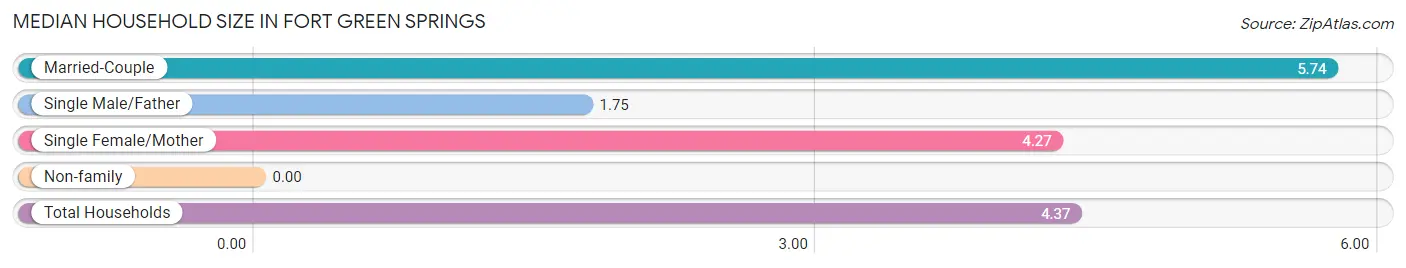
| Household Type | # Households | Household Size |
| Married-Couple | 23 (17.6%) | 5.74 |
| Single Male/Father | 8 (6.1%) | 1.75 |
| Single Female/Mother | 100 (76.3%) | 4.27 |
| Non-family | 0 (0.0%) | - |
| Total Households | 131 (100.0%) | 4.37 |
Household Size by Marriage Status in Fort Green Springs
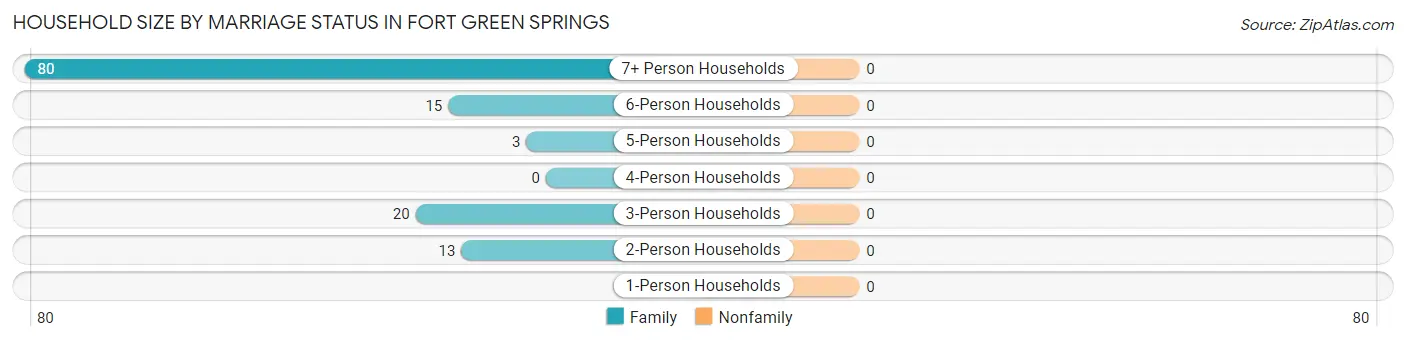
| Household Size | Family Households | Nonfamily Households |
| 1-Person Households | - | 0 (0.0%) |
| 2-Person Households | 13 (9.9%) | 0 (0.0%) |
| 3-Person Households | 20 (15.3%) | 0 (0.0%) |
| 4-Person Households | 0 (0.0%) | 0 (0.0%) |
| 5-Person Households | 3 (2.3%) | 0 (0.0%) |
| 6-Person Households | 15 (11.5%) | 0 (0.0%) |
| 7+ Person Households | 80 (61.1%) | 0 (0.0%) |
| Total | 131 (100.0%) | 0 (0.0%) |
Female Fertility in Fort Green Springs
Fertility by Age in Fort Green Springs
Average fertility rate in Fort Green Springs is 593.0 births per 1,000 women. Women in the age bracket of 35 to 50 years have the highest fertility rate with 734.0 births per 1,000 women. Women in the age bracket of 35 to 50 years acount for 100.0% of all women with births.
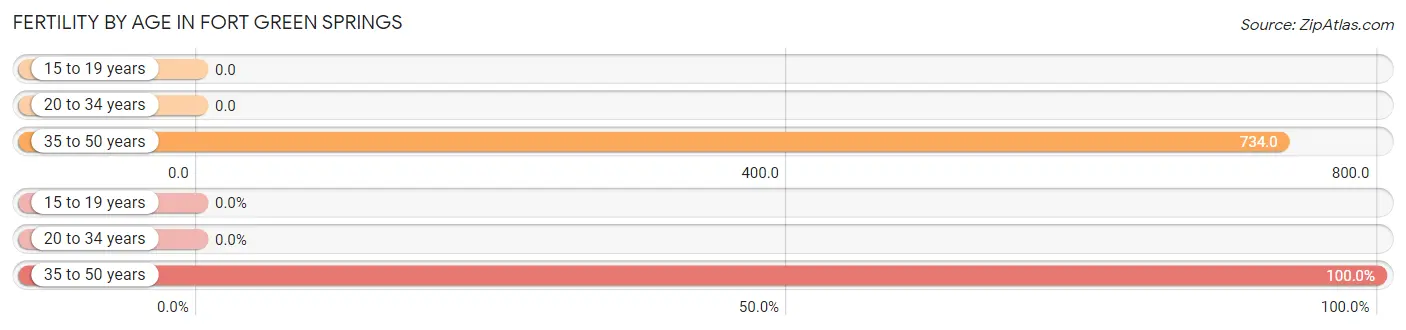
| Age Bracket | Women with Births | Births / 1,000 Women |
| 15 to 19 years | 0 (0.0%) | 0.0 |
| 20 to 34 years | 0 (0.0%) | 0.0 |
| 35 to 50 years | 80 (100.0%) | 734.0 |
| Total | 80 (100.0%) | 593.0 |
Fertility by Age by Marriage Status in Fort Green Springs
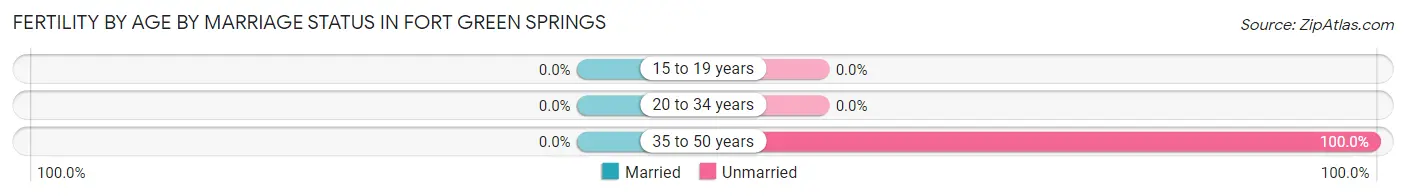
| Age Bracket | Married | Unmarried |
| 15 to 19 years | 0 (0.0%) | 0 (0.0%) |
| 20 to 34 years | 0 (0.0%) | 0 (0.0%) |
| 35 to 50 years | 0 (0.0%) | 80 (100.0%) |
| Total | 0 (0.0%) | 80 (100.0%) |
Fertility by Education in Fort Green Springs
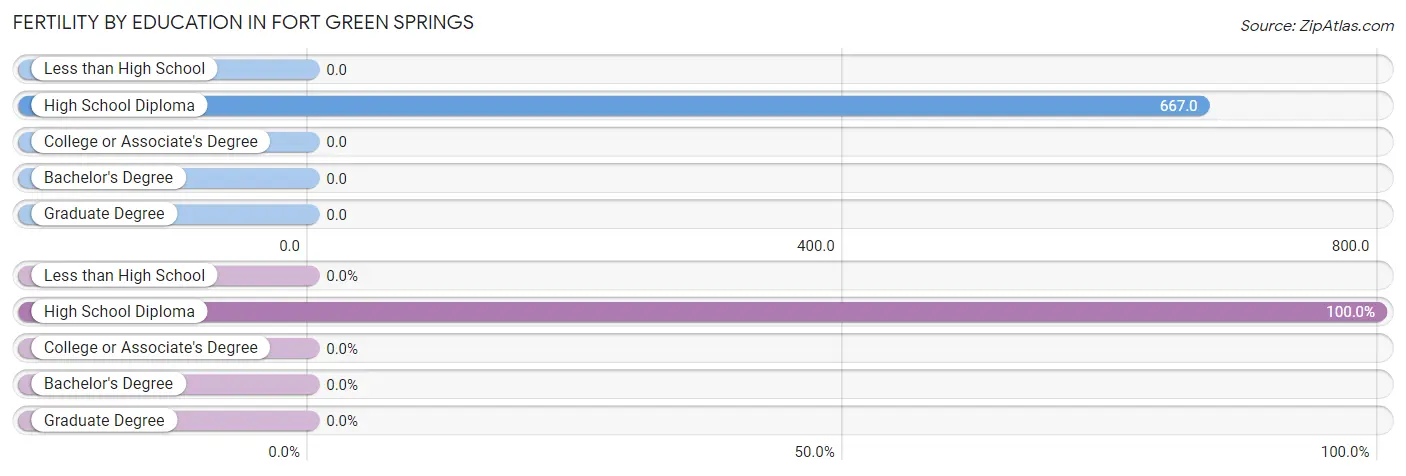
| Educational Attainment | Women with Births | Births / 1,000 Women |
| Less than High School | 0 (0.0%) | 0.0 |
| High School Diploma | 80 (100.0%) | 667.0 |
| College or Associate's Degree | 0 (0.0%) | 0.0 |
| Bachelor's Degree | 0 (0.0%) | 0.0 |
| Graduate Degree | 0 (0.0%) | 0.0 |
| Total | 80 (100.0%) | 593.0 |
Fertility by Education by Marriage Status in Fort Green Springs
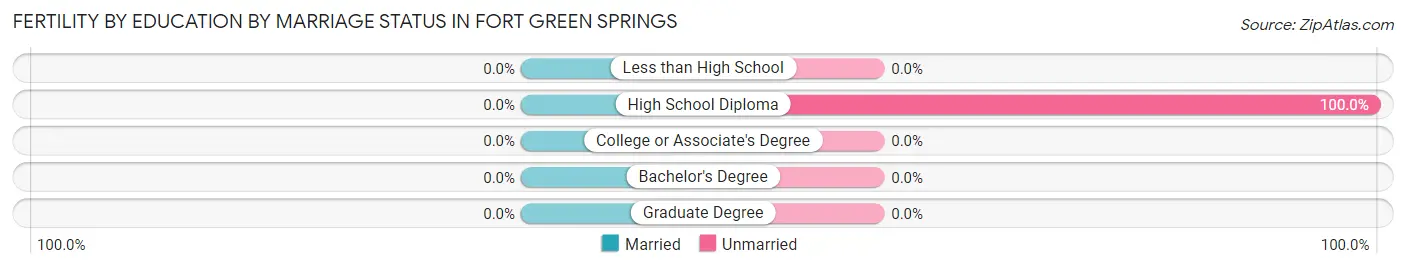
| Educational Attainment | Married | Unmarried |
| Less than High School | 0 (0.0%) | 0 (0.0%) |
| High School Diploma | 0 (0.0%) | 80 (100.0%) |
| College or Associate's Degree | 0 (0.0%) | 0 (0.0%) |
| Bachelor's Degree | 0 (0.0%) | 0 (0.0%) |
| Graduate Degree | 0 (0.0%) | 0 (0.0%) |
| Total | 0 (0.0%) | 80 (100.0%) |
Employment Characteristics in Fort Green Springs
Employment by Class of Employer in Fort Green Springs
Among the 208 employed individuals in Fort Green Springs, private company employees (188 | 90.4%), and not-for-profit organizations (20 | 9.6%) make up the most common classes of employment.
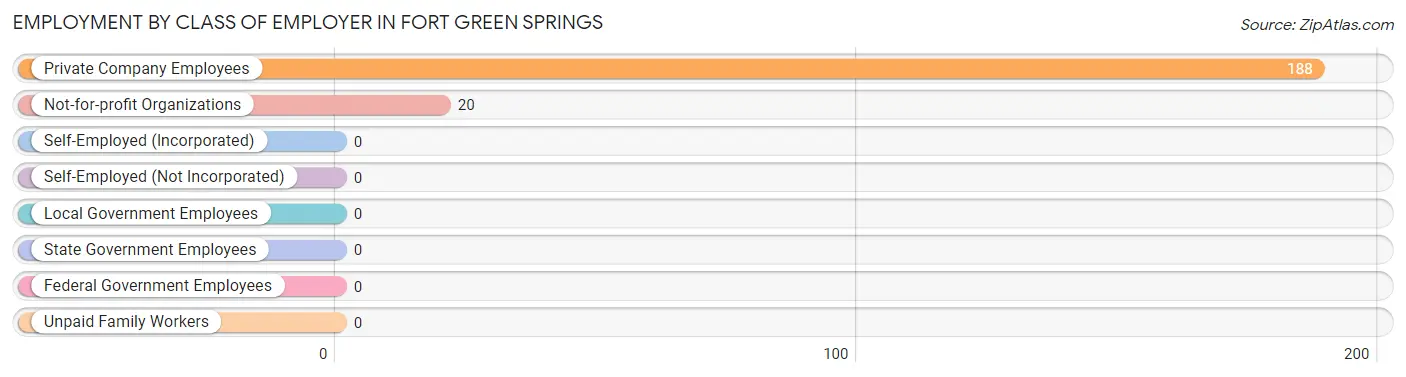
| Employer Class | # Employees | % Employees |
| Private Company Employees | 188 | 90.4% |
| Self-Employed (Incorporated) | 0 | 0.0% |
| Self-Employed (Not Incorporated) | 0 | 0.0% |
| Not-for-profit Organizations | 20 | 9.6% |
| Local Government Employees | 0 | 0.0% |
| State Government Employees | 0 | 0.0% |
| Federal Government Employees | 0 | 0.0% |
| Unpaid Family Workers | 0 | 0.0% |
| Total | 208 | 100.0% |
Employment Status by Age in Fort Green Springs
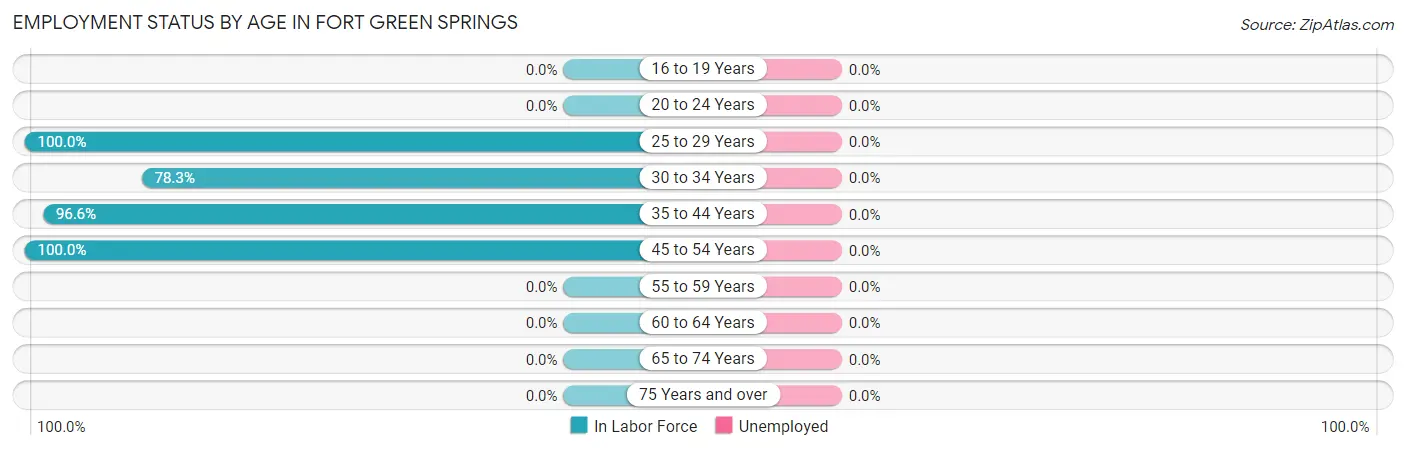
| Age Bracket | In Labor Force | Unemployed |
| 16 to 19 Years | 0 (0.0%) | 0 (0.0%) |
| 20 to 24 Years | 0 (0.0%) | 0 (0.0%) |
| 25 to 29 Years | 17 (100.0%) | 0 (0.0%) |
| 30 to 34 Years | 54 (78.3%) | 0 (0.0%) |
| 35 to 44 Years | 113 (96.6%) | 0 (0.0%) |
| 45 to 54 Years | 24 (100.0%) | 0 (0.0%) |
| 55 to 59 Years | 0 (0.0%) | 0 (0.0%) |
| 60 to 64 Years | 0 (0.0%) | 0 (0.0%) |
| 65 to 74 Years | 0 (0.0%) | 0 (0.0%) |
| 75 Years and over | 0 (0.0%) | 0 (0.0%) |
| Total | 208 (82.2%) | 0 (0.0%) |
Employment Status by Educational Attainment in Fort Green Springs
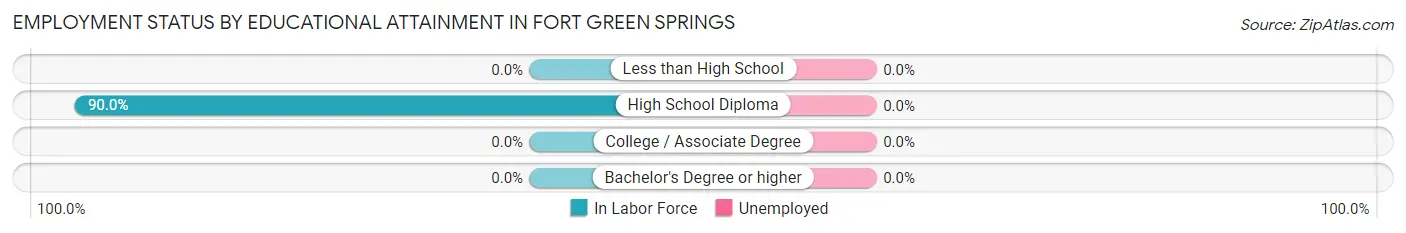
| Educational Attainment | In Labor Force | Unemployed |
| Less than High School | 0 (0.0%) | 0 (0.0%) |
| High School Diploma | 208 (90.0%) | 0 (0.0%) |
| College / Associate Degree | 0 (0.0%) | 0 (0.0%) |
| Bachelor's Degree or higher | 0 (0.0%) | 0 (0.0%) |
| Total | 208 (88.5%) | 0 (0.0%) |
Employment Occupations by Sex in Fort Green Springs
Management, Business, Science and Arts Occupations
The most common Management, Business, Science and Arts occupations in Fort Green Springs are Community & Social Service (20 | 9.6%), and Education Instruction & Library (20 | 9.6%).
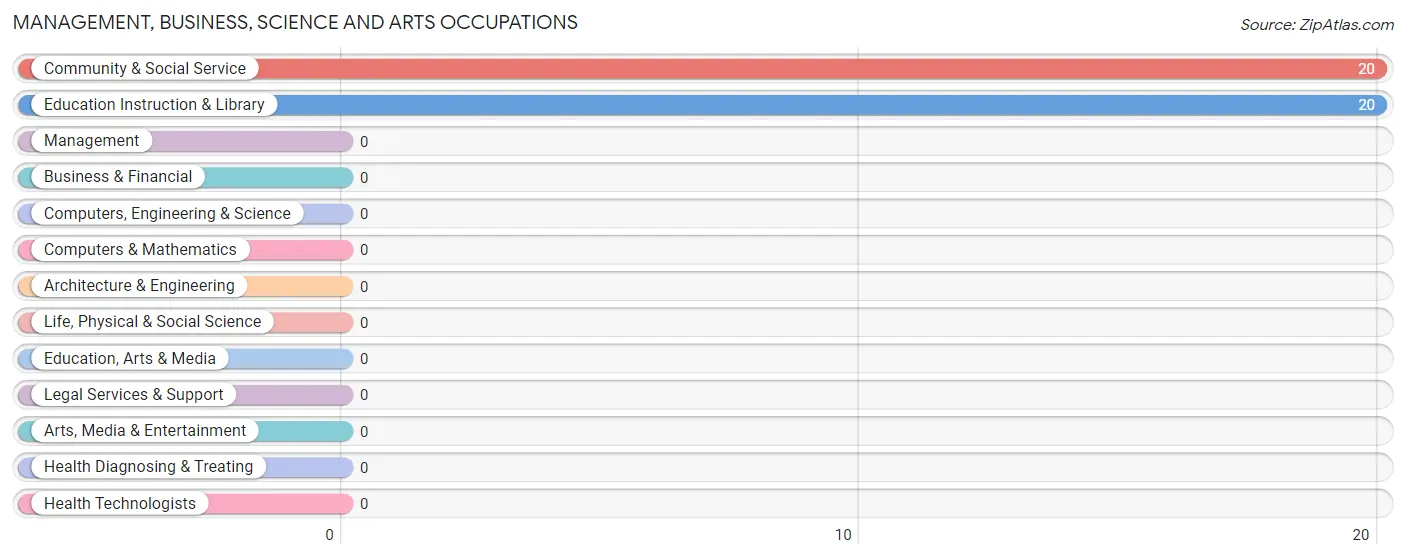
Management, Business, Science and Arts Occupations by Sex
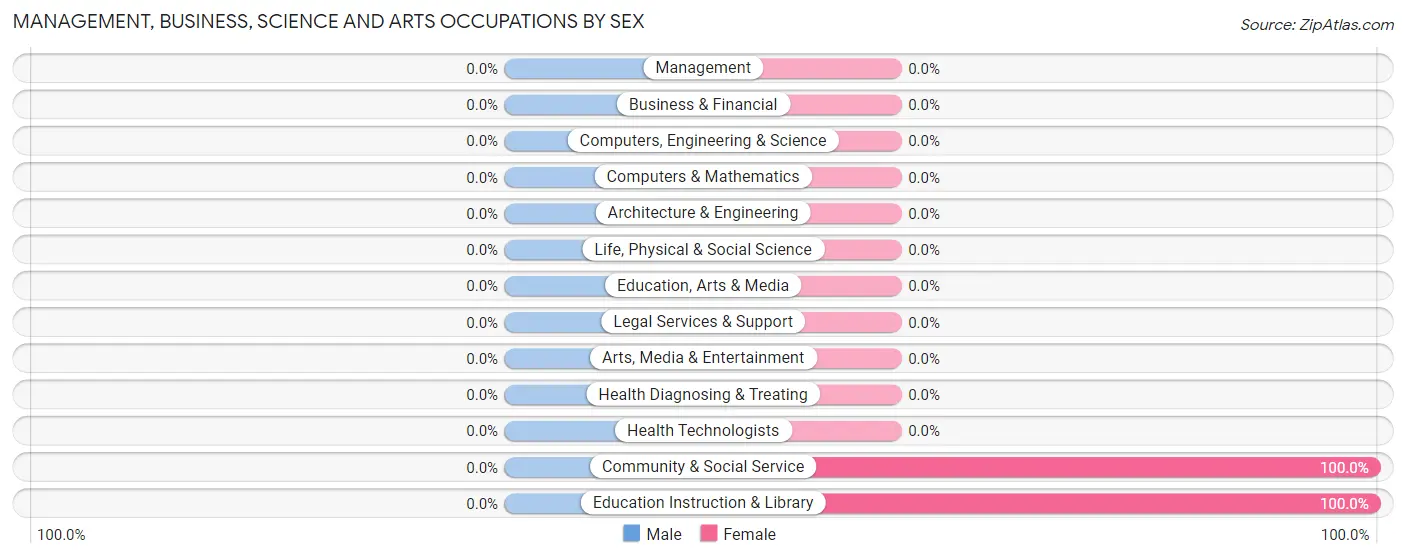
| Occupation | Male | Female |
| Management | 0 (0.0%) | 0 (0.0%) |
| Business & Financial | 0 (0.0%) | 0 (0.0%) |
| Computers, Engineering & Science | 0 (0.0%) | 0 (0.0%) |
| Computers & Mathematics | 0 (0.0%) | 0 (0.0%) |
| Architecture & Engineering | 0 (0.0%) | 0 (0.0%) |
| Life, Physical & Social Science | 0 (0.0%) | 0 (0.0%) |
| Community & Social Service | 0 (0.0%) | 20 (100.0%) |
| Education, Arts & Media | 0 (0.0%) | 0 (0.0%) |
| Legal Services & Support | 0 (0.0%) | 0 (0.0%) |
| Education Instruction & Library | 0 (0.0%) | 20 (100.0%) |
| Arts, Media & Entertainment | 0 (0.0%) | 0 (0.0%) |
| Health Diagnosing & Treating | 0 (0.0%) | 0 (0.0%) |
| Health Technologists | 0 (0.0%) | 0 (0.0%) |
| Total (Category) | 0 (0.0%) | 20 (100.0%) |
| Total (Overall) | 103 (49.5%) | 105 (50.5%) |
Services Occupations
Services Occupations by Sex
| Occupation | Male | Female |
| Healthcare Support | 0 (0.0%) | 0 (0.0%) |
| Security & Protection | 0 (0.0%) | 0 (0.0%) |
| Firefighting & Prevention | 0 (0.0%) | 0 (0.0%) |
| Law Enforcement | 0 (0.0%) | 0 (0.0%) |
| Food Preparation & Serving | 0 (0.0%) | 0 (0.0%) |
| Cleaning & Maintenance | 0 (0.0%) | 0 (0.0%) |
| Personal Care & Service | 0 (0.0%) | 0 (0.0%) |
| Total (Category) | 0 (0.0%) | 0 (0.0%) |
| Total (Overall) | 103 (49.5%) | 105 (50.5%) |
Sales and Office Occupations
The most common Sales and Office occupations in Fort Green Springs are , and Sales & Related (85 | 40.9%).
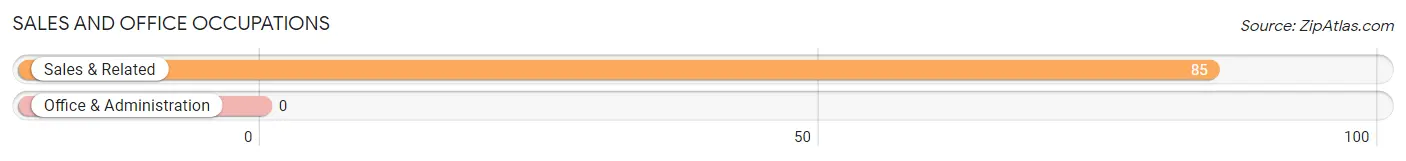
Sales and Office Occupations by Sex
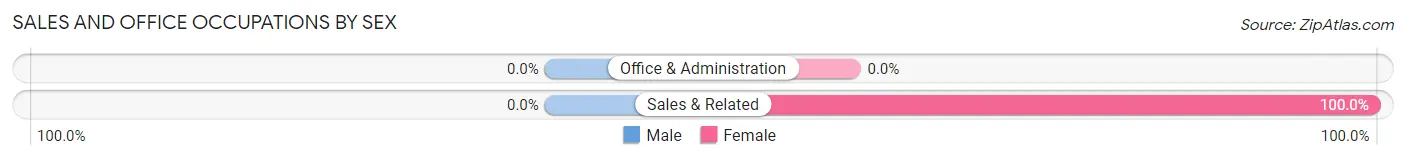
| Occupation | Male | Female |
| Sales & Related | 0 (0.0%) | 85 (100.0%) |
| Office & Administration | 0 (0.0%) | 0 (0.0%) |
| Total (Category) | 0 (0.0%) | 85 (100.0%) |
| Total (Overall) | 103 (49.5%) | 105 (50.5%) |
Natural Resources, Construction and Maintenance Occupations
The most common Natural Resources, Construction and Maintenance occupations in Fort Green Springs are , and Farming, Fishing & Forestry (17 | 8.2%).
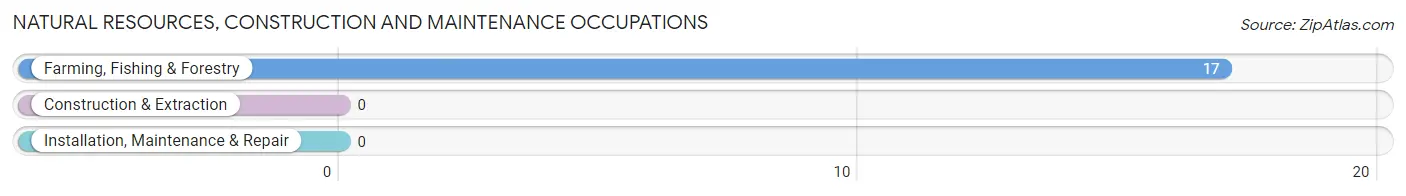
Natural Resources, Construction and Maintenance Occupations by Sex
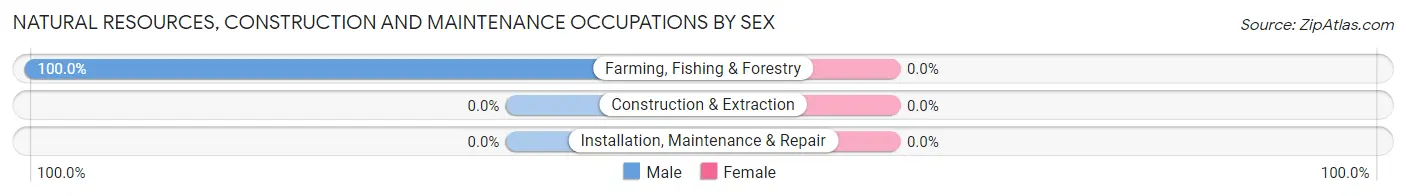
| Occupation | Male | Female |
| Farming, Fishing & Forestry | 17 (100.0%) | 0 (0.0%) |
| Construction & Extraction | 0 (0.0%) | 0 (0.0%) |
| Installation, Maintenance & Repair | 0 (0.0%) | 0 (0.0%) |
| Total (Category) | 17 (100.0%) | 0 (0.0%) |
| Total (Overall) | 103 (49.5%) | 105 (50.5%) |
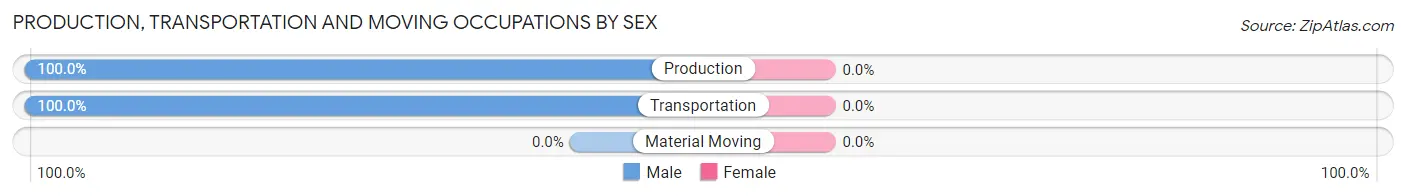
Production, Transportation and Moving Occupations
The most common Production, Transportation and Moving occupations in Fort Green Springs are Transportation (54 | 26.0%), and Production (32 | 15.4%).
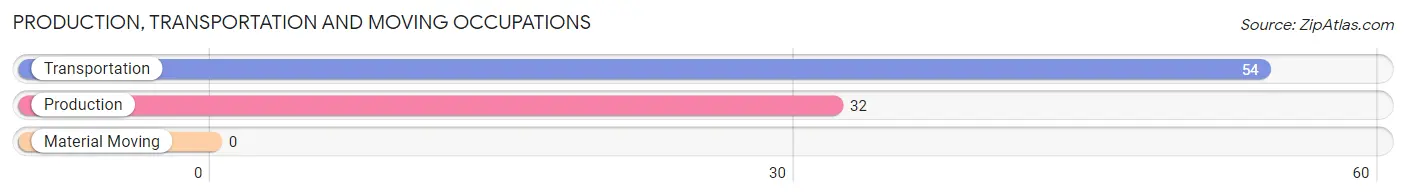
Production, Transportation and Moving Occupations by Sex
| Occupation | Male | Female |
| Production | 32 (100.0%) | 0 (0.0%) |
| Transportation | 54 (100.0%) | 0 (0.0%) |
| Material Moving | 0 (0.0%) | 0 (0.0%) |
| Total (Category) | 86 (100.0%) | 0 (0.0%) |
| Total (Overall) | 103 (49.5%) | 105 (50.5%) |
Employment Industries by Sex in Fort Green Springs
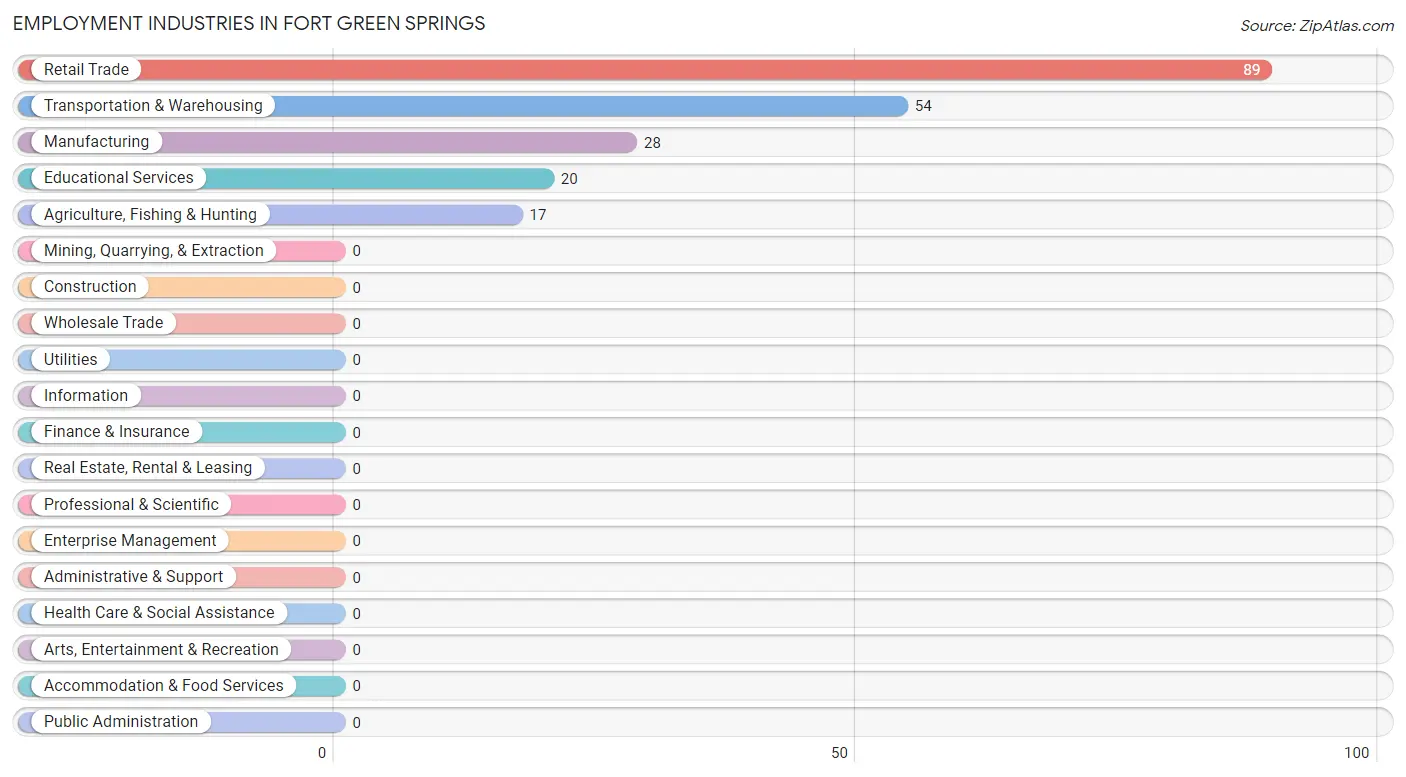
Employment Industries in Fort Green Springs
The major employment industries in Fort Green Springs include Retail Trade (89 | 42.8%), Transportation & Warehousing (54 | 26.0%), Manufacturing (28 | 13.5%), Educational Services (20 | 9.6%), and Agriculture, Fishing & Hunting (17 | 8.2%).
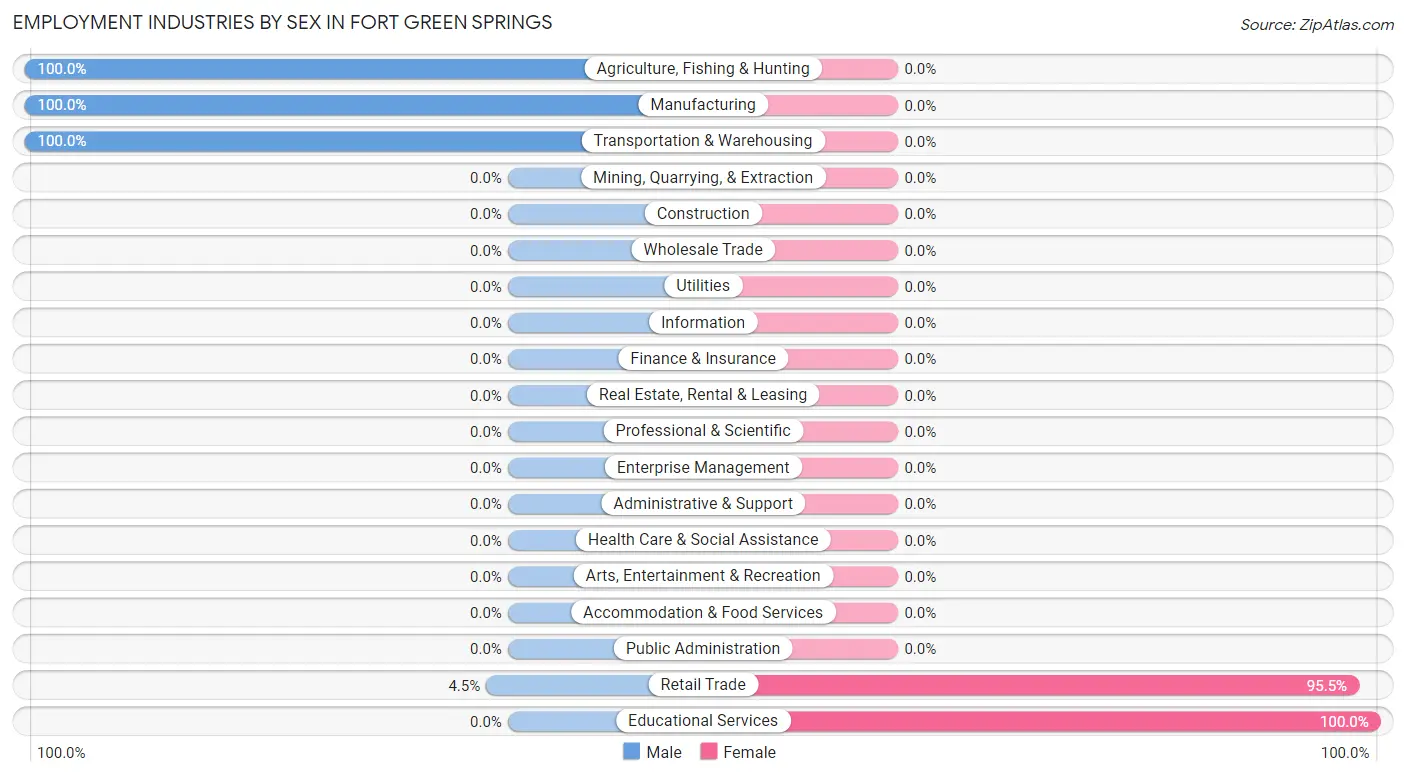
Employment Industries by Sex in Fort Green Springs
The Fort Green Springs industries that see more men than women are Agriculture, Fishing & Hunting (100.0%), Manufacturing (100.0%), and Transportation & Warehousing (100.0%), whereas the industries that tend to have a higher number of women are Educational Services (100.0%), and Retail Trade (95.5%).
| Industry | Male | Female |
| Agriculture, Fishing & Hunting | 17 (100.0%) | 0 (0.0%) |
| Mining, Quarrying, & Extraction | 0 (0.0%) | 0 (0.0%) |
| Construction | 0 (0.0%) | 0 (0.0%) |
| Manufacturing | 28 (100.0%) | 0 (0.0%) |
| Wholesale Trade | 0 (0.0%) | 0 (0.0%) |
| Retail Trade | 4 (4.5%) | 85 (95.5%) |
| Transportation & Warehousing | 54 (100.0%) | 0 (0.0%) |
| Utilities | 0 (0.0%) | 0 (0.0%) |
| Information | 0 (0.0%) | 0 (0.0%) |
| Finance & Insurance | 0 (0.0%) | 0 (0.0%) |
| Real Estate, Rental & Leasing | 0 (0.0%) | 0 (0.0%) |
| Professional & Scientific | 0 (0.0%) | 0 (0.0%) |
| Enterprise Management | 0 (0.0%) | 0 (0.0%) |
| Administrative & Support | 0 (0.0%) | 0 (0.0%) |
| Educational Services | 0 (0.0%) | 20 (100.0%) |
| Health Care & Social Assistance | 0 (0.0%) | 0 (0.0%) |
| Arts, Entertainment & Recreation | 0 (0.0%) | 0 (0.0%) |
| Accommodation & Food Services | 0 (0.0%) | 0 (0.0%) |
| Public Administration | 0 (0.0%) | 0 (0.0%) |
| Total | 103 (49.5%) | 105 (50.5%) |
Education in Fort Green Springs
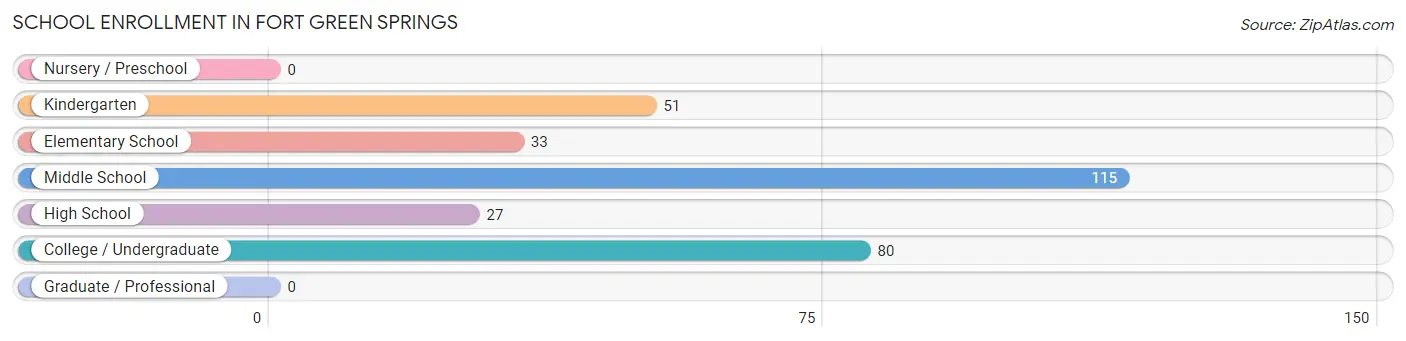
School Enrollment in Fort Green Springs
The most common levels of schooling among the 306 students in Fort Green Springs are middle school (115 | 37.6%), college / undergraduate (80 | 26.1%), and kindergarten (51 | 16.7%).
| School Level | # Students | % Students |
| Nursery / Preschool | 0 | 0.0% |
| Kindergarten | 51 | 16.7% |
| Elementary School | 33 | 10.8% |
| Middle School | 115 | 37.6% |
| High School | 27 | 8.8% |
| College / Undergraduate | 80 | 26.1% |
| Graduate / Professional | 0 | 0.0% |
| Total | 306 | 100.0% |
School Enrollment by Age by Funding Source in Fort Green Springs
Out of a total of 306 students who are enrolled in schools in Fort Green Springs, 38 (12.4%) attend a private institution, while the remaining 268 (87.6%) are enrolled in public schools. The age group of 5 to 9 year old has the highest likelihood of being enrolled in private schools, with 38 (74.5% in the age bracket) enrolled. Conversely, the age group of 10 to 14 year olds has the lowest likelihood of being enrolled in a private school, with 148 (100.0% in the age bracket) attending a public institution.
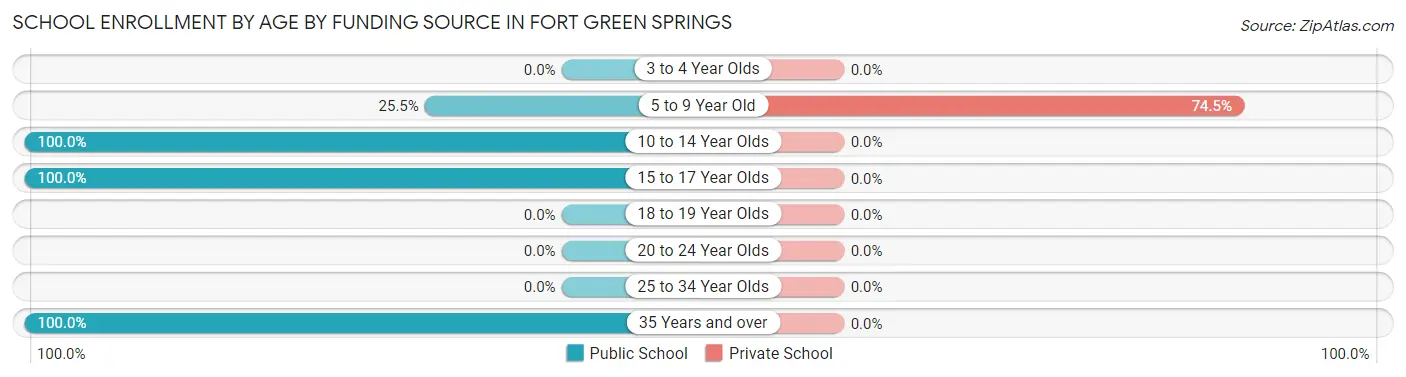
| Age Bracket | Public School | Private School |
| 3 to 4 Year Olds | 0 (0.0%) | 0 (0.0%) |
| 5 to 9 Year Old | 13 (25.5%) | 38 (74.5%) |
| 10 to 14 Year Olds | 148 (100.0%) | 0 (0.0%) |
| 15 to 17 Year Olds | 27 (100.0%) | 0 (0.0%) |
| 18 to 19 Year Olds | 0 (0.0%) | 0 (0.0%) |
| 20 to 24 Year Olds | 0 (0.0%) | 0 (0.0%) |
| 25 to 34 Year Olds | 0 (0.0%) | 0 (0.0%) |
| 35 Years and over | 80 (100.0%) | 0 (0.0%) |
| Total | 268 (87.6%) | 38 (12.4%) |
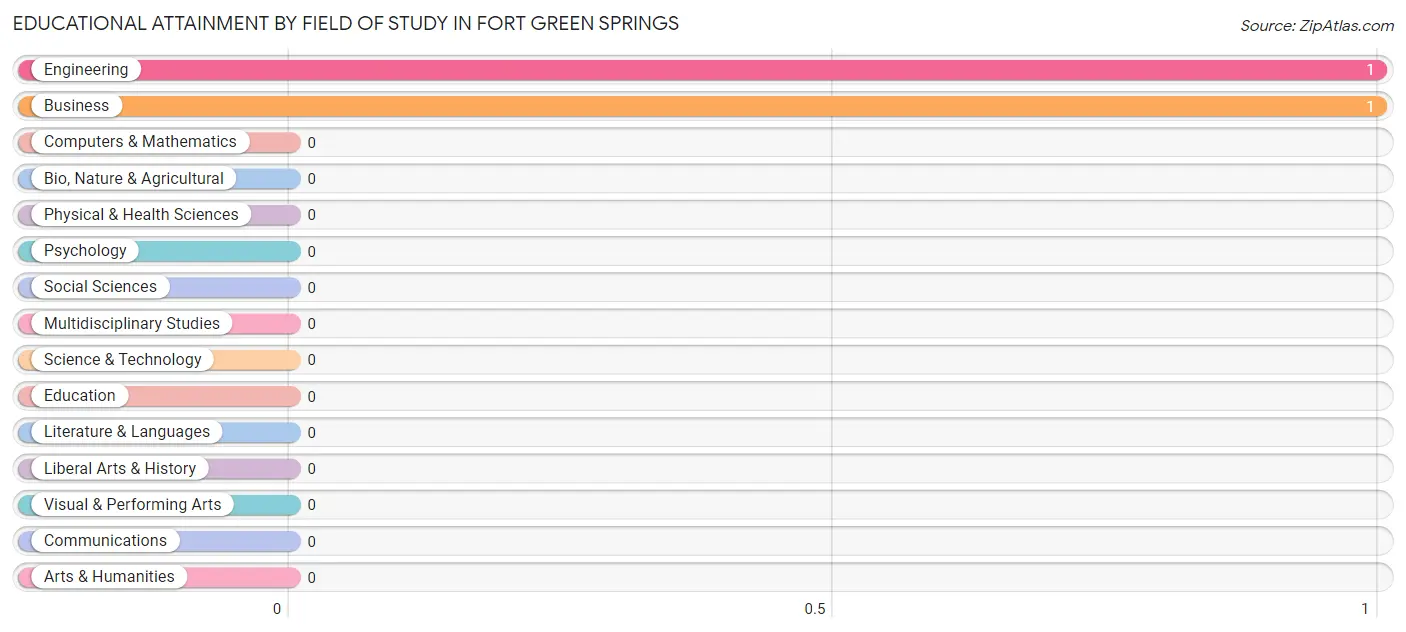
Educational Attainment by Field of Study in Fort Green Springs
Engineering (1 | 50.0%), and business (1 | 50.0%) are the most common fields of study among 2 individuals in Fort Green Springs who have obtained a bachelor's degree or higher.
| Field of Study | # Graduates | % Graduates |
| Computers & Mathematics | 0 | 0.0% |
| Bio, Nature & Agricultural | 0 | 0.0% |
| Physical & Health Sciences | 0 | 0.0% |
| Psychology | 0 | 0.0% |
| Social Sciences | 0 | 0.0% |
| Engineering | 1 | 50.0% |
| Multidisciplinary Studies | 0 | 0.0% |
| Science & Technology | 0 | 0.0% |
| Business | 1 | 50.0% |
| Education | 0 | 0.0% |
| Literature & Languages | 0 | 0.0% |
| Liberal Arts & History | 0 | 0.0% |
| Visual & Performing Arts | 0 | 0.0% |
| Communications | 0 | 0.0% |
| Arts & Humanities | 0 | 0.0% |
| Total | 2 | 100.0% |
Transportation & Commute in Fort Green Springs
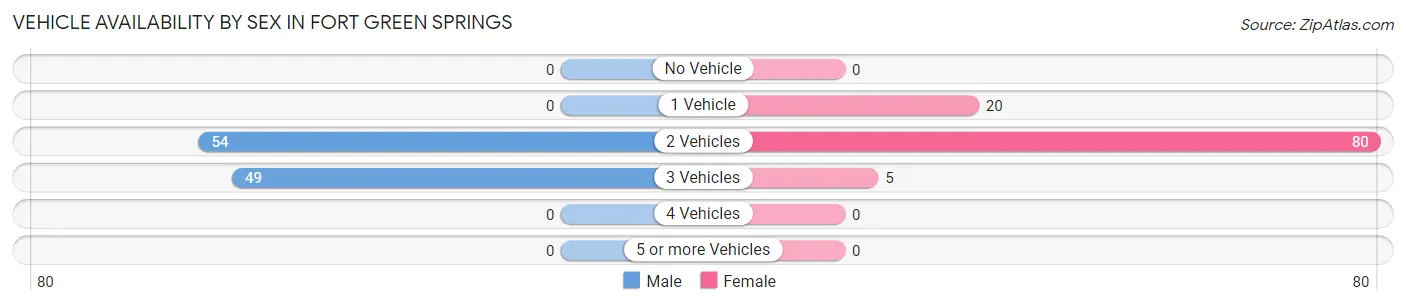
Vehicle Availability by Sex in Fort Green Springs
The most prevalent vehicle ownership categories in Fort Green Springs are males with 2 vehicles (54, accounting for 52.4%) and females with 2 vehicles (80, making up 51.4%).
| Vehicles Available | Male | Female |
| No Vehicle | 0 (0.0%) | 0 (0.0%) |
| 1 Vehicle | 0 (0.0%) | 20 (19.1%) |
| 2 Vehicles | 54 (52.4%) | 80 (76.2%) |
| 3 Vehicles | 49 (47.6%) | 5 (4.8%) |
| 4 Vehicles | 0 (0.0%) | 0 (0.0%) |
| 5 or more Vehicles | 0 (0.0%) | 0 (0.0%) |
| Total | 103 (100.0%) | 105 (100.0%) |
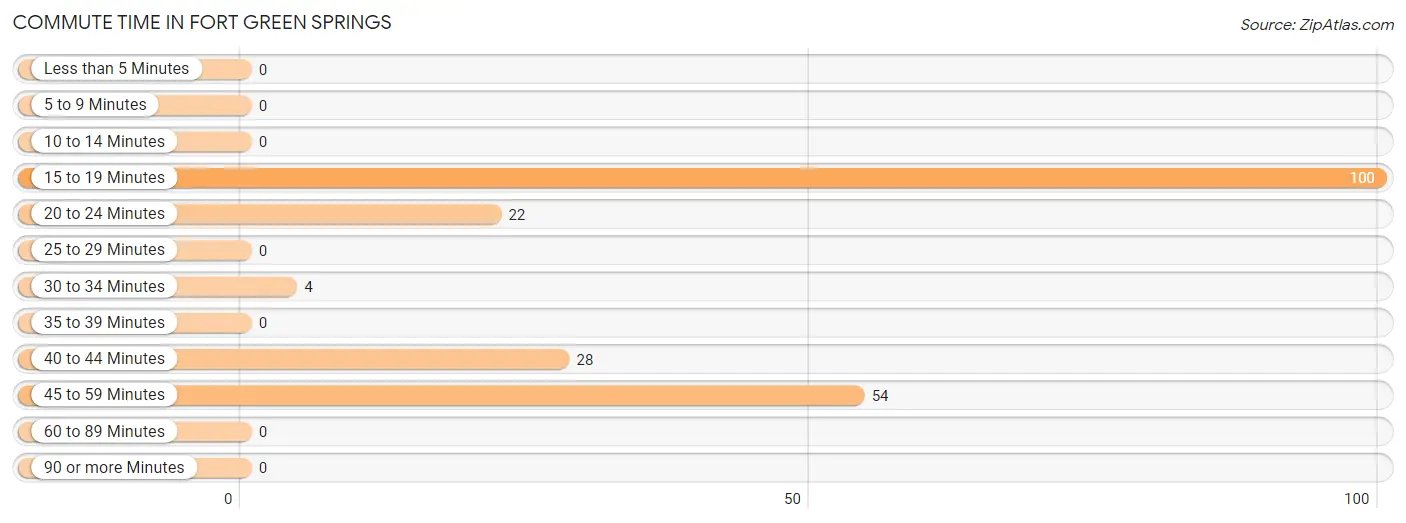
Commute Time in Fort Green Springs
The most frequently occuring commute durations in Fort Green Springs are 15 to 19 minutes (100 commuters, 48.1%), 45 to 59 minutes (54 commuters, 26.0%), and 40 to 44 minutes (28 commuters, 13.5%).
| Commute Time | # Commuters | % Commuters |
| Less than 5 Minutes | 0 | 0.0% |
| 5 to 9 Minutes | 0 | 0.0% |
| 10 to 14 Minutes | 0 | 0.0% |
| 15 to 19 Minutes | 100 | 48.1% |
| 20 to 24 Minutes | 22 | 10.6% |
| 25 to 29 Minutes | 0 | 0.0% |
| 30 to 34 Minutes | 4 | 1.9% |
| 35 to 39 Minutes | 0 | 0.0% |
| 40 to 44 Minutes | 28 | 13.5% |
| 45 to 59 Minutes | 54 | 26.0% |
| 60 to 89 Minutes | 0 | 0.0% |
| 90 or more Minutes | 0 | 0.0% |
Commute Time by Sex in Fort Green Springs
The most common commute times in Fort Green Springs are 45 to 59 minutes (54 commuters, 52.4%) for males and 15 to 19 minutes (100 commuters, 95.2%) for females.
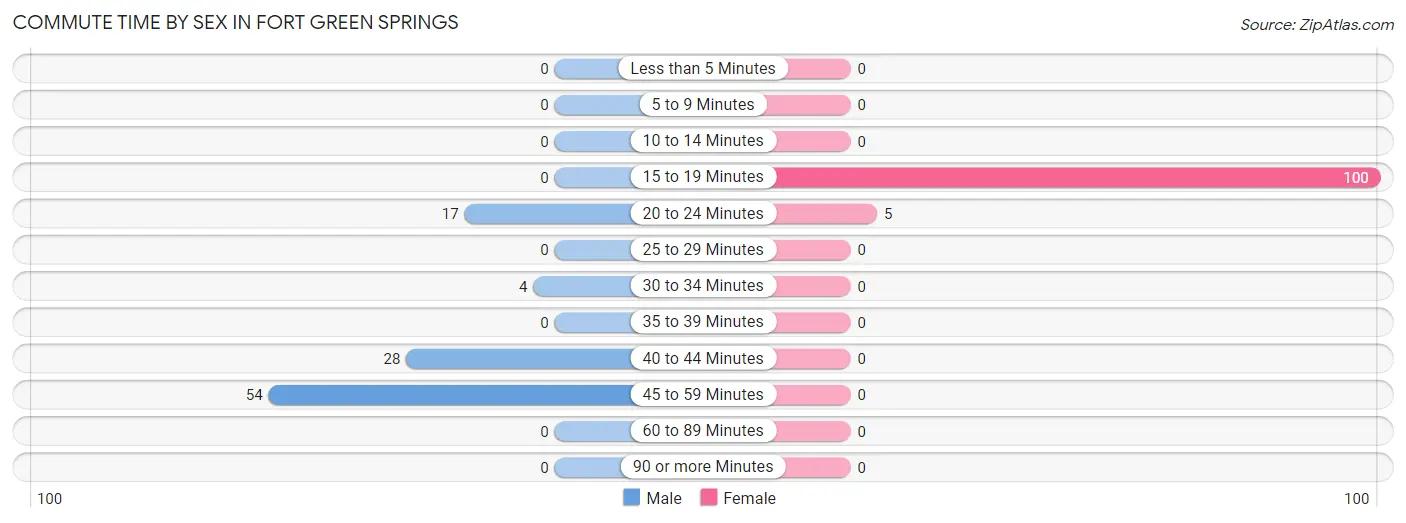
| Commute Time | Male | Female |
| Less than 5 Minutes | 0 (0.0%) | 0 (0.0%) |
| 5 to 9 Minutes | 0 (0.0%) | 0 (0.0%) |
| 10 to 14 Minutes | 0 (0.0%) | 0 (0.0%) |
| 15 to 19 Minutes | 0 (0.0%) | 100 (95.2%) |
| 20 to 24 Minutes | 17 (16.5%) | 5 (4.8%) |
| 25 to 29 Minutes | 0 (0.0%) | 0 (0.0%) |
| 30 to 34 Minutes | 4 (3.9%) | 0 (0.0%) |
| 35 to 39 Minutes | 0 (0.0%) | 0 (0.0%) |
| 40 to 44 Minutes | 28 (27.2%) | 0 (0.0%) |
| 45 to 59 Minutes | 54 (52.4%) | 0 (0.0%) |
| 60 to 89 Minutes | 0 (0.0%) | 0 (0.0%) |
| 90 or more Minutes | 0 (0.0%) | 0 (0.0%) |
Time of Departure to Work by Sex in Fort Green Springs
The most frequent times of departure to work in Fort Green Springs are 12:00 AM to 4:59 AM (82, 79.6%) for males and 7:30 AM to 7:59 AM (85, 80.9%) for females.
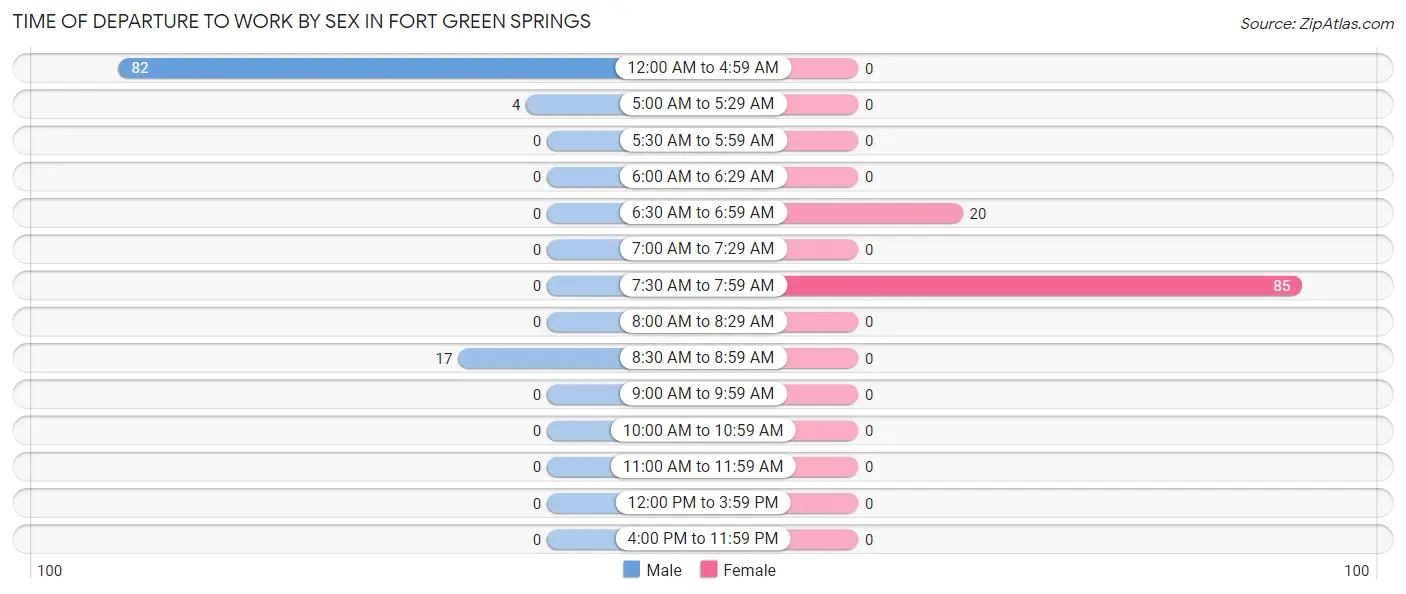
| Time of Departure | Male | Female |
| 12:00 AM to 4:59 AM | 82 (79.6%) | 0 (0.0%) |
| 5:00 AM to 5:29 AM | 4 (3.9%) | 0 (0.0%) |
| 5:30 AM to 5:59 AM | 0 (0.0%) | 0 (0.0%) |
| 6:00 AM to 6:29 AM | 0 (0.0%) | 0 (0.0%) |
| 6:30 AM to 6:59 AM | 0 (0.0%) | 20 (19.1%) |
| 7:00 AM to 7:29 AM | 0 (0.0%) | 0 (0.0%) |
| 7:30 AM to 7:59 AM | 0 (0.0%) | 85 (80.9%) |
| 8:00 AM to 8:29 AM | 0 (0.0%) | 0 (0.0%) |
| 8:30 AM to 8:59 AM | 17 (16.5%) | 0 (0.0%) |
| 9:00 AM to 9:59 AM | 0 (0.0%) | 0 (0.0%) |
| 10:00 AM to 10:59 AM | 0 (0.0%) | 0 (0.0%) |
| 11:00 AM to 11:59 AM | 0 (0.0%) | 0 (0.0%) |
| 12:00 PM to 3:59 PM | 0 (0.0%) | 0 (0.0%) |
| 4:00 PM to 11:59 PM | 0 (0.0%) | 0 (0.0%) |
| Total | 103 (100.0%) | 105 (100.0%) |
Housing Occupancy in Fort Green Springs
Occupancy by Ownership in Fort Green Springs
Of the total 131 dwellings in Fort Green Springs, owner-occupied units account for 96 (73.3%), while renter-occupied units make up 35 (26.7%).
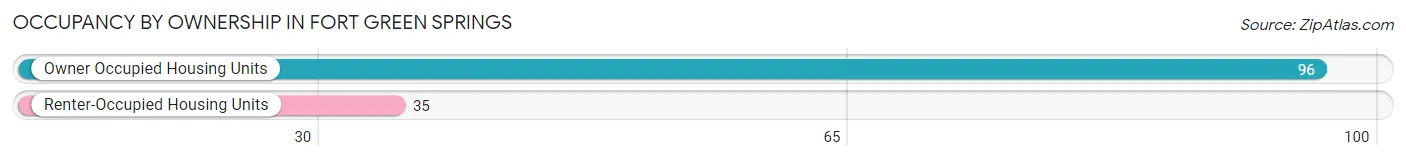
| Occupancy | # Housing Units | % Housing Units |
| Owner Occupied Housing Units | 96 | 73.3% |
| Renter-Occupied Housing Units | 35 | 26.7% |
| Total Occupied Housing Units | 131 | 100.0% |
Occupancy by Household Size in Fort Green Springs
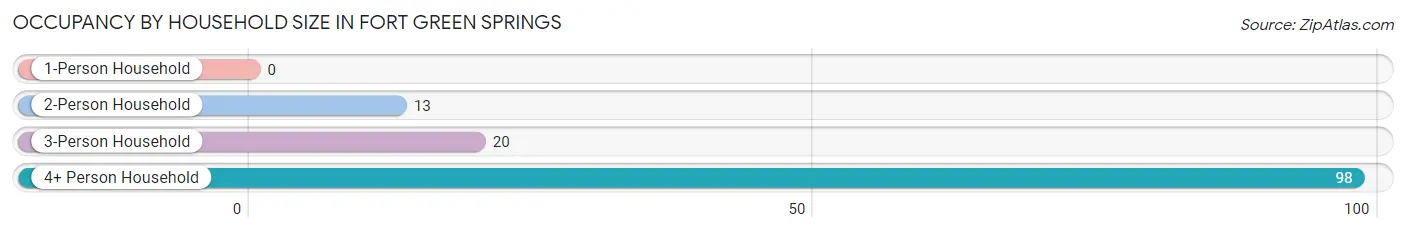
| Household Size | # Housing Units | % Housing Units |
| 1-Person Household | 0 | 0.0% |
| 2-Person Household | 13 | 9.9% |
| 3-Person Household | 20 | 15.3% |
| 4+ Person Household | 98 | 74.8% |
| Total Housing Units | 131 | 100.0% |
Occupancy by Ownership by Household Size in Fort Green Springs
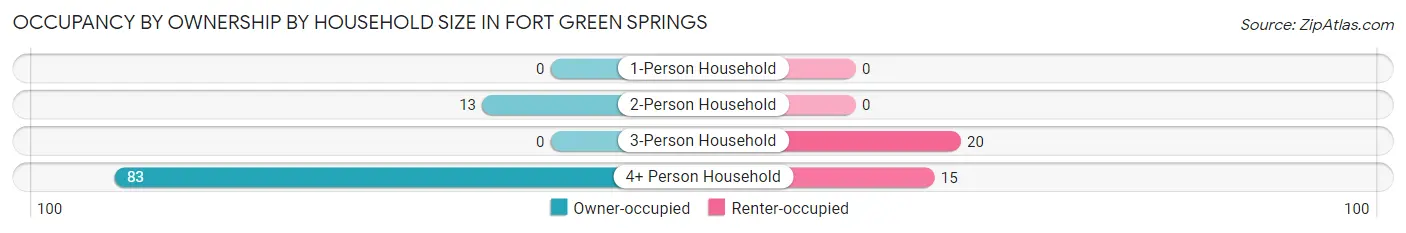
| Household Size | Owner-occupied | Renter-occupied |
| 1-Person Household | 0 (0.0%) | 0 (0.0%) |
| 2-Person Household | 13 (100.0%) | 0 (0.0%) |
| 3-Person Household | 0 (0.0%) | 20 (100.0%) |
| 4+ Person Household | 83 (84.7%) | 15 (15.3%) |
| Total Housing Units | 96 (73.3%) | 35 (26.7%) |
Occupancy by Educational Attainment in Fort Green Springs
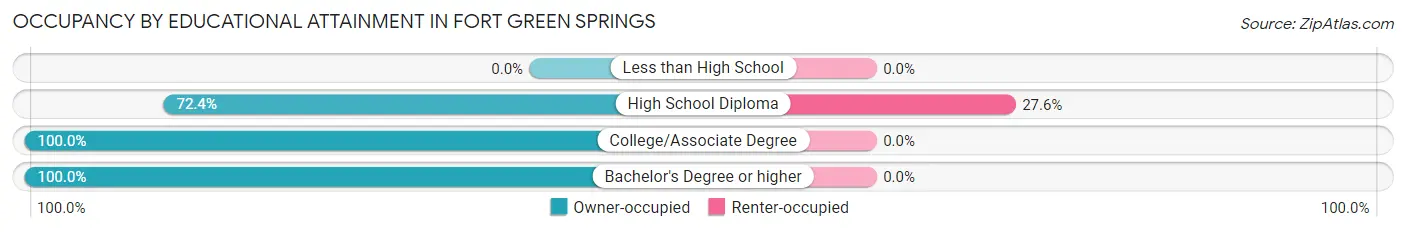
| Household Size | Owner-occupied | Renter-occupied |
| Less than High School | 0 (0.0%) | 0 (0.0%) |
| High School Diploma | 92 (72.4%) | 35 (27.6%) |
| College/Associate Degree | 3 (100.0%) | 0 (0.0%) |
| Bachelor's Degree or higher | 1 (100.0%) | 0 (0.0%) |
Occupancy by Age of Householder in Fort Green Springs
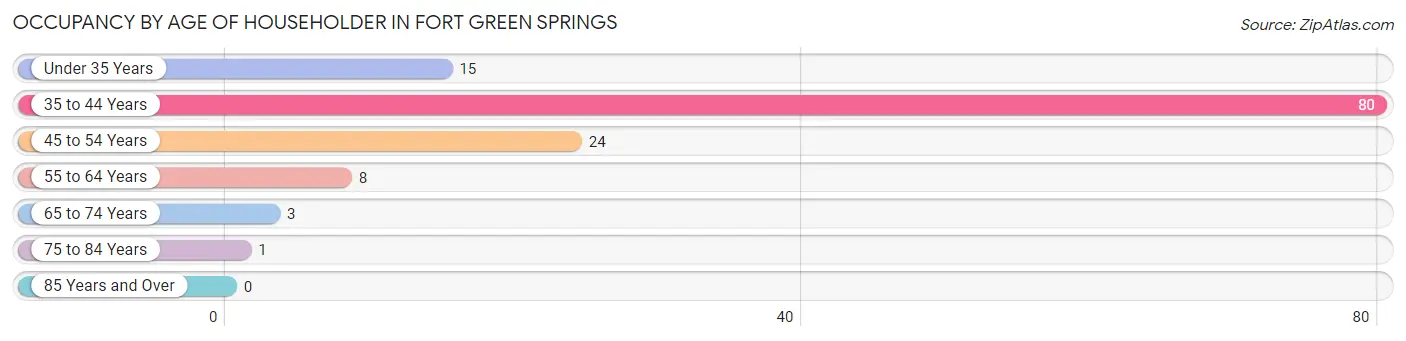
| Age Bracket | # Households | % Households |
| Under 35 Years | 15 | 11.5% |
| 35 to 44 Years | 80 | 61.1% |
| 45 to 54 Years | 24 | 18.3% |
| 55 to 64 Years | 8 | 6.1% |
| 65 to 74 Years | 3 | 2.3% |
| 75 to 84 Years | 1 | 0.8% |
| 85 Years and Over | 0 | 0.0% |
| Total | 131 | 100.0% |
Housing Finances in Fort Green Springs
Median Income by Occupancy in Fort Green Springs
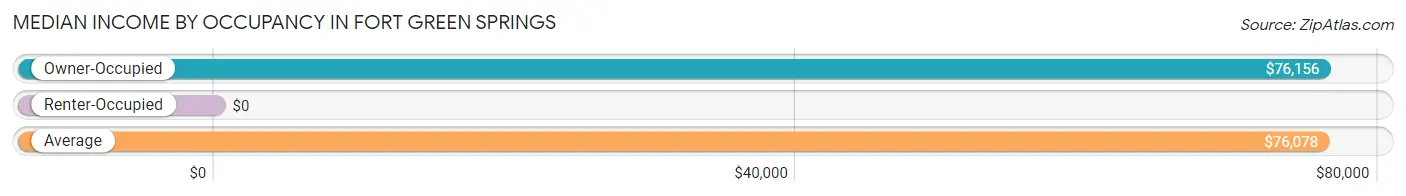
| Occupancy Type | # Households | Median Income |
| Owner-Occupied | 96 (73.3%) | $76,156 |
| Renter-Occupied | 35 (26.7%) | $0 |
| Average | 131 (100.0%) | $76,078 |
Occupancy by Householder Income Bracket in Fort Green Springs
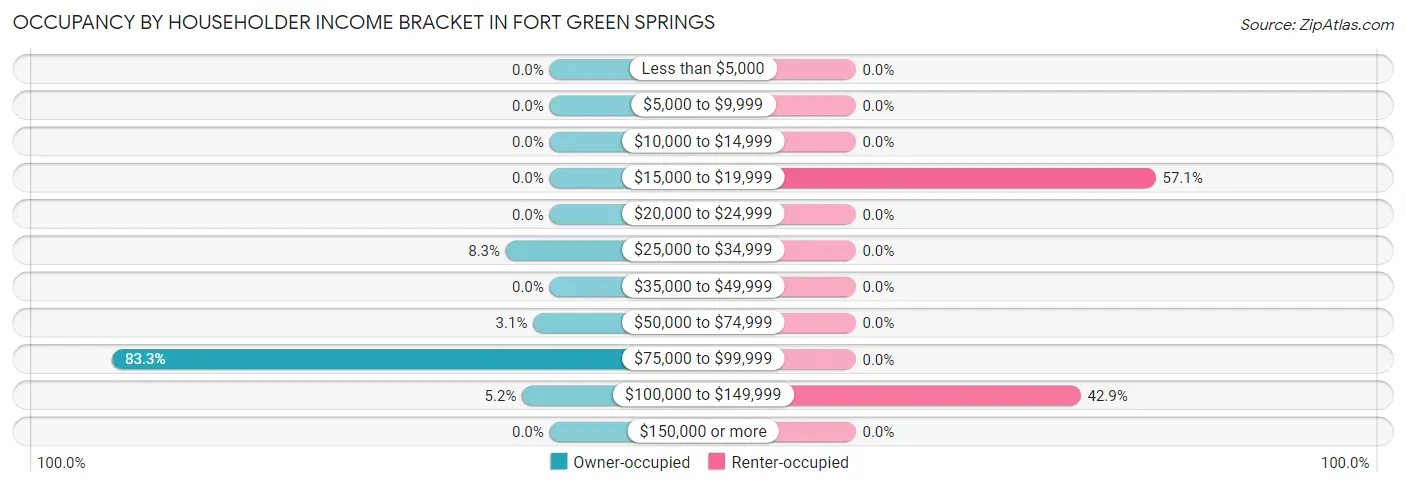
| Income Bracket | Owner-occupied | Renter-occupied |
| Less than $5,000 | 0 (0.0%) | 0 (0.0%) |
| $5,000 to $9,999 | 0 (0.0%) | 0 (0.0%) |
| $10,000 to $14,999 | 0 (0.0%) | 0 (0.0%) |
| $15,000 to $19,999 | 0 (0.0%) | 20 (57.1%) |
| $20,000 to $24,999 | 0 (0.0%) | 0 (0.0%) |
| $25,000 to $34,999 | 8 (8.3%) | 0 (0.0%) |
| $35,000 to $49,999 | 0 (0.0%) | 0 (0.0%) |
| $50,000 to $74,999 | 3 (3.1%) | 0 (0.0%) |
| $75,000 to $99,999 | 80 (83.3%) | 0 (0.0%) |
| $100,000 to $149,999 | 5 (5.2%) | 15 (42.9%) |
| $150,000 or more | 0 (0.0%) | 0 (0.0%) |
| Total | 96 (100.0%) | 35 (100.0%) |
Monthly Housing Cost Tiers in Fort Green Springs
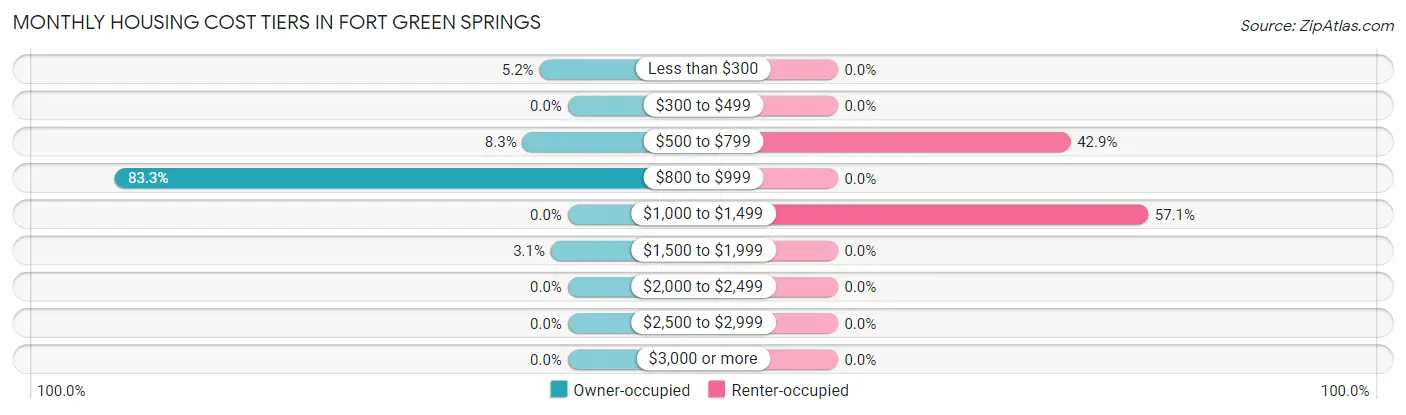
| Monthly Cost | Owner-occupied | Renter-occupied |
| Less than $300 | 5 (5.2%) | 0 (0.0%) |
| $300 to $499 | 0 (0.0%) | 0 (0.0%) |
| $500 to $799 | 8 (8.3%) | 15 (42.9%) |
| $800 to $999 | 80 (83.3%) | 0 (0.0%) |
| $1,000 to $1,499 | 0 (0.0%) | 20 (57.1%) |
| $1,500 to $1,999 | 3 (3.1%) | 0 (0.0%) |
| $2,000 to $2,499 | 0 (0.0%) | 0 (0.0%) |
| $2,500 to $2,999 | 0 (0.0%) | 0 (0.0%) |
| $3,000 or more | 0 (0.0%) | 0 (0.0%) |
| Total | 96 (100.0%) | 35 (100.0%) |
Physical Housing Characteristics in Fort Green Springs
Housing Structures in Fort Green Springs
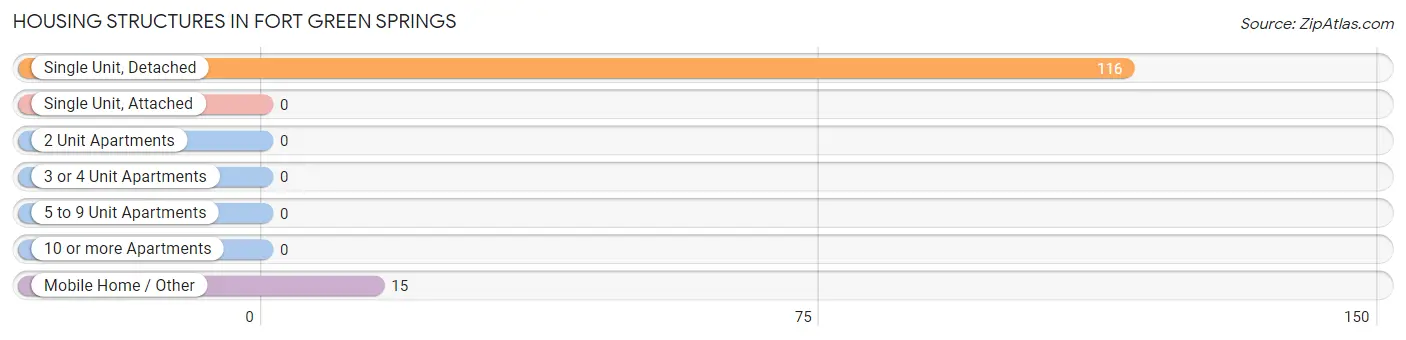
| Structure Type | # Housing Units | % Housing Units |
| Single Unit, Detached | 116 | 88.5% |
| Single Unit, Attached | 0 | 0.0% |
| 2 Unit Apartments | 0 | 0.0% |
| 3 or 4 Unit Apartments | 0 | 0.0% |
| 5 to 9 Unit Apartments | 0 | 0.0% |
| 10 or more Apartments | 0 | 0.0% |
| Mobile Home / Other | 15 | 11.5% |
| Total | 131 | 100.0% |
Housing Structures by Occupancy in Fort Green Springs
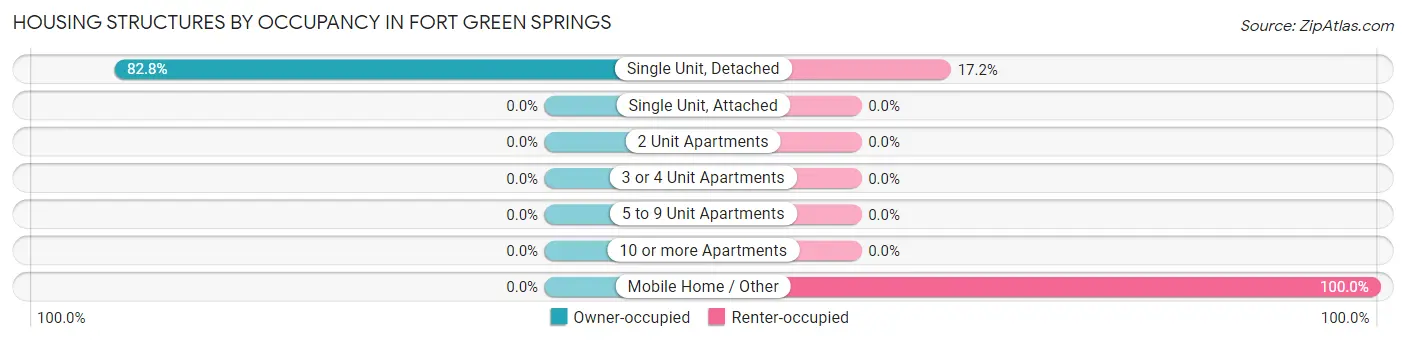
| Structure Type | Owner-occupied | Renter-occupied |
| Single Unit, Detached | 96 (82.8%) | 20 (17.2%) |
| Single Unit, Attached | 0 (0.0%) | 0 (0.0%) |
| 2 Unit Apartments | 0 (0.0%) | 0 (0.0%) |
| 3 or 4 Unit Apartments | 0 (0.0%) | 0 (0.0%) |
| 5 to 9 Unit Apartments | 0 (0.0%) | 0 (0.0%) |
| 10 or more Apartments | 0 (0.0%) | 0 (0.0%) |
| Mobile Home / Other | 0 (0.0%) | 15 (100.0%) |
| Total | 96 (73.3%) | 35 (26.7%) |
Housing Structures by Number of Rooms in Fort Green Springs
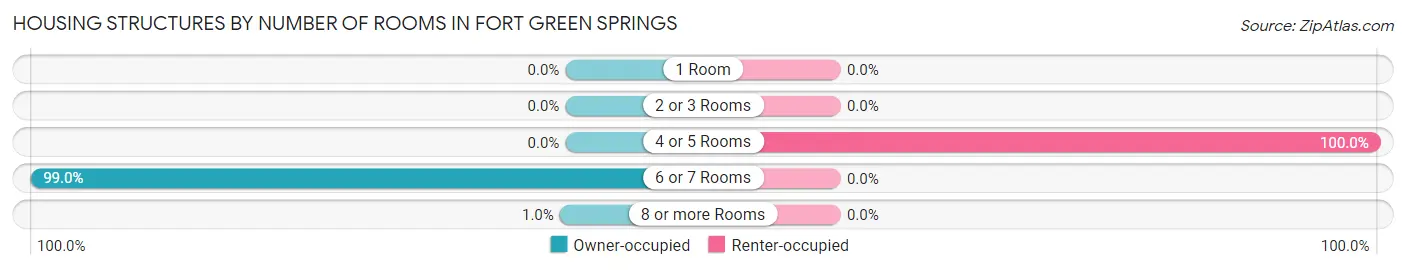
| Number of Rooms | Owner-occupied | Renter-occupied |
| 1 Room | 0 (0.0%) | 0 (0.0%) |
| 2 or 3 Rooms | 0 (0.0%) | 0 (0.0%) |
| 4 or 5 Rooms | 0 (0.0%) | 35 (100.0%) |
| 6 or 7 Rooms | 95 (99.0%) | 0 (0.0%) |
| 8 or more Rooms | 1 (1.0%) | 0 (0.0%) |
| Total | 96 (100.0%) | 35 (100.0%) |
Housing Structure by Heating Type in Fort Green Springs
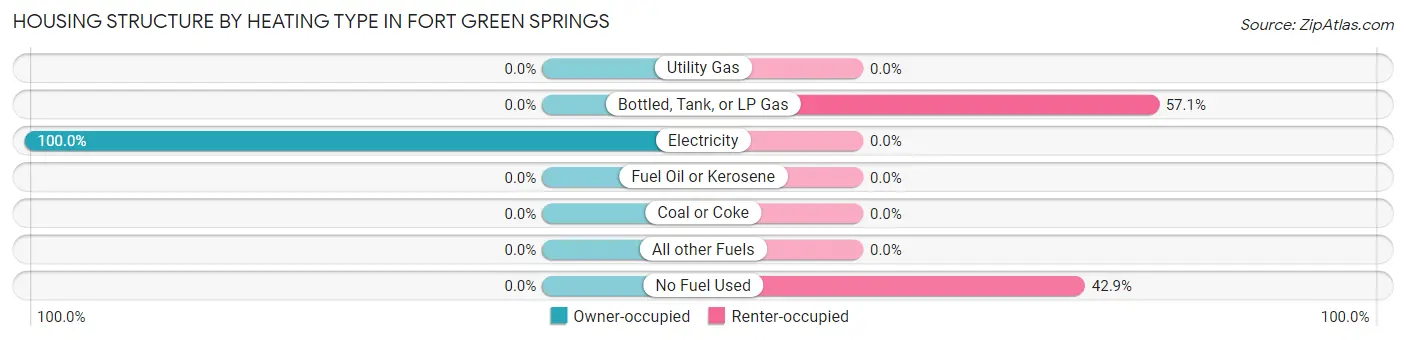
| Heating Type | Owner-occupied | Renter-occupied |
| Utility Gas | 0 (0.0%) | 0 (0.0%) |
| Bottled, Tank, or LP Gas | 0 (0.0%) | 20 (57.1%) |
| Electricity | 96 (100.0%) | 0 (0.0%) |
| Fuel Oil or Kerosene | 0 (0.0%) | 0 (0.0%) |
| Coal or Coke | 0 (0.0%) | 0 (0.0%) |
| All other Fuels | 0 (0.0%) | 0 (0.0%) |
| No Fuel Used | 0 (0.0%) | 15 (42.9%) |
| Total | 96 (100.0%) | 35 (100.0%) |
Household Vehicle Usage in Fort Green Springs
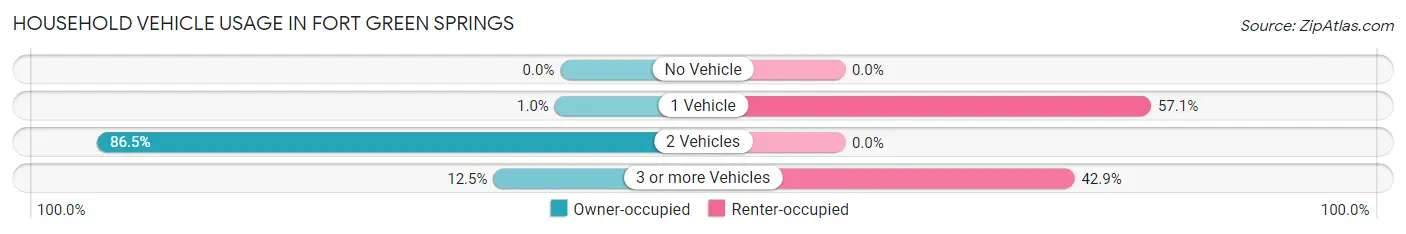
| Vehicles per Household | Owner-occupied | Renter-occupied |
| No Vehicle | 0 (0.0%) | 0 (0.0%) |
| 1 Vehicle | 1 (1.0%) | 20 (57.1%) |
| 2 Vehicles | 83 (86.5%) | 0 (0.0%) |
| 3 or more Vehicles | 12 (12.5%) | 15 (42.9%) |
| Total | 96 (100.0%) | 35 (100.0%) |
Real Estate & Mortgages in Fort Green Springs
Real Estate and Mortgage Overview in Fort Green Springs
| Characteristic | Without Mortgage | With Mortgage |
| Housing Units | 13 | 83 |
| Median Property Value | $104,700 | $0 |
| Median Household Income | - | - |
| Monthly Housing Costs | $519 | $0 |
| Real Estate Taxes | - | - |
Property Value by Mortgage Status in Fort Green Springs
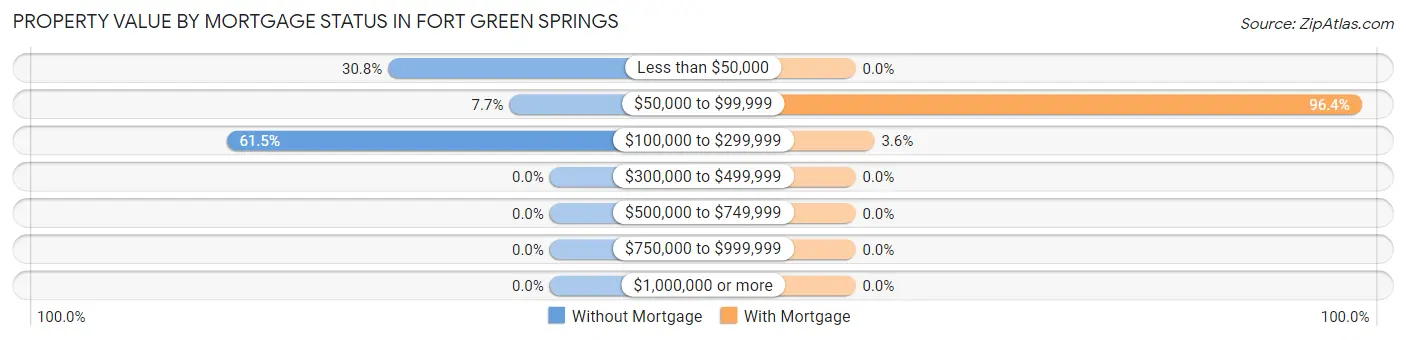
| Property Value | Without Mortgage | With Mortgage |
| Less than $50,000 | 4 (30.8%) | 0 (0.0%) |
| $50,000 to $99,999 | 1 (7.7%) | 80 (96.4%) |
| $100,000 to $299,999 | 8 (61.5%) | 3 (3.6%) |
| $300,000 to $499,999 | 0 (0.0%) | 0 (0.0%) |
| $500,000 to $749,999 | 0 (0.0%) | 0 (0.0%) |
| $750,000 to $999,999 | 0 (0.0%) | 0 (0.0%) |
| $1,000,000 or more | 0 (0.0%) | 0 (0.0%) |
| Total | 13 (100.0%) | 83 (100.0%) |
Household Income by Mortgage Status in Fort Green Springs
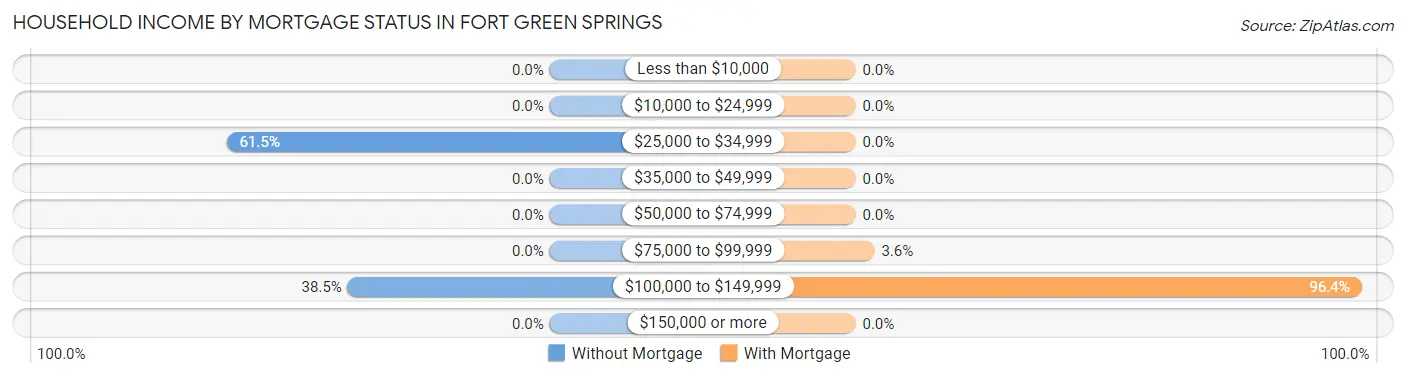
| Household Income | Without Mortgage | With Mortgage |
| Less than $10,000 | 0 (0.0%) | 0 (0.0%) |
| $10,000 to $24,999 | 0 (0.0%) | 0 (0.0%) |
| $25,000 to $34,999 | 8 (61.5%) | 0 (0.0%) |
| $35,000 to $49,999 | 0 (0.0%) | 0 (0.0%) |
| $50,000 to $74,999 | 0 (0.0%) | 0 (0.0%) |
| $75,000 to $99,999 | 0 (0.0%) | 3 (3.6%) |
| $100,000 to $149,999 | 5 (38.5%) | 80 (96.4%) |
| $150,000 or more | 0 (0.0%) | 0 (0.0%) |
| Total | 13 (100.0%) | 83 (100.0%) |
Property Value to Household Income Ratio in Fort Green Springs
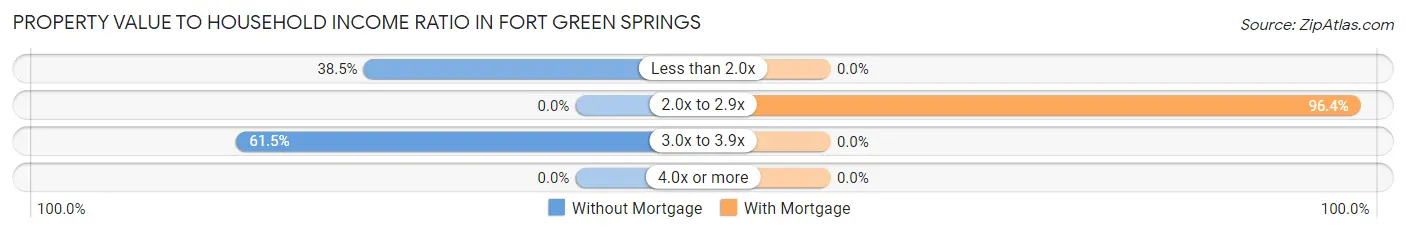
| Value-to-Income Ratio | Without Mortgage | With Mortgage |
| Less than 2.0x | 5 (38.5%) | 0 (0.0%) |
| 2.0x to 2.9x | 0 (0.0%) | 80 (96.4%) |
| 3.0x to 3.9x | 8 (61.5%) | 0 (0.0%) |
| 4.0x or more | 0 (0.0%) | 0 (0.0%) |
| Total | 13 (100.0%) | 83 (100.0%) |
Real Estate Taxes by Mortgage Status in Fort Green Springs
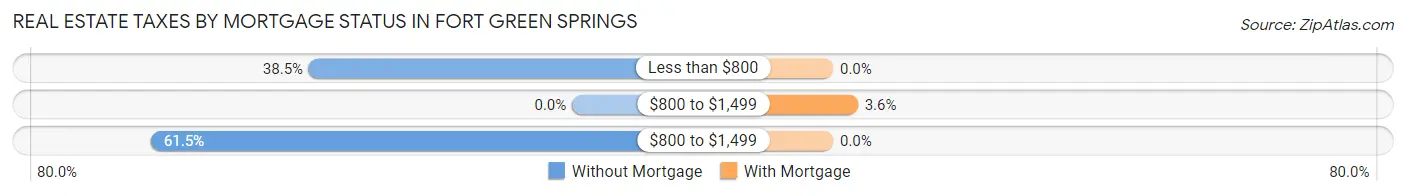
| Property Taxes | Without Mortgage | With Mortgage |
| Less than $800 | 5 (38.5%) | 0 (0.0%) |
| $800 to $1,499 | 0 (0.0%) | 3 (3.6%) |
| $800 to $1,499 | 8 (61.5%) | 0 (0.0%) |
| Total | 13 (100.0%) | 83 (100.0%) |
Health & Disability in Fort Green Springs
Health Insurance Coverage by Age in Fort Green Springs
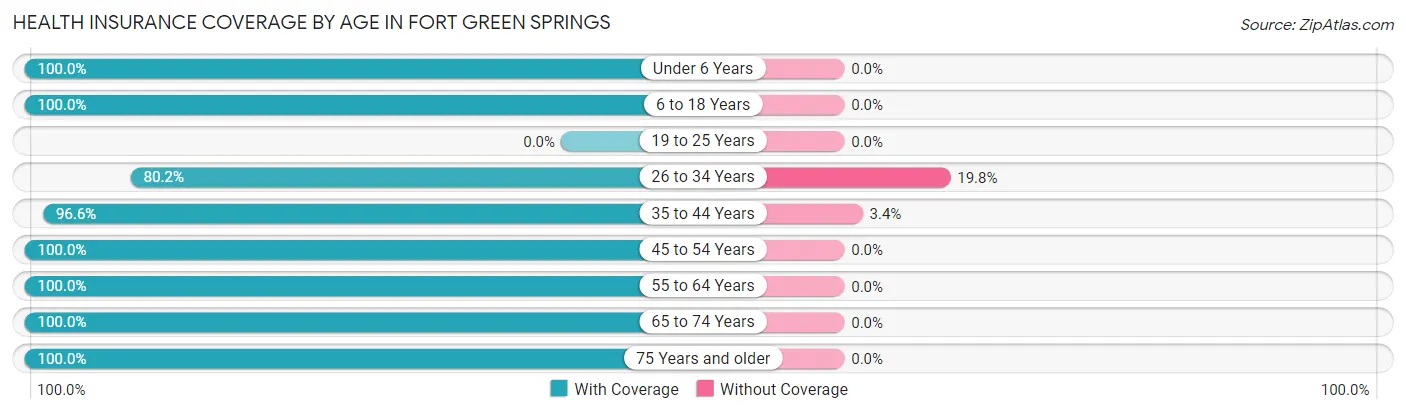
| Age Bracket | With Coverage | Without Coverage |
| Under 6 Years | 107 (100.0%) | 0 (0.0%) |
| 6 to 18 Years | 226 (100.0%) | 0 (0.0%) |
| 19 to 25 Years | 0 (0.0%) | 0 (0.0%) |
| 26 to 34 Years | 69 (80.2%) | 17 (19.8%) |
| 35 to 44 Years | 113 (96.6%) | 4 (3.4%) |
| 45 to 54 Years | 24 (100.0%) | 0 (0.0%) |
| 55 to 64 Years | 8 (100.0%) | 0 (0.0%) |
| 65 to 74 Years | 4 (100.0%) | 0 (0.0%) |
| 75 Years and older | 1 (100.0%) | 0 (0.0%) |
| Total | 552 (96.3%) | 21 (3.7%) |
Health Insurance Coverage by Citizenship Status in Fort Green Springs
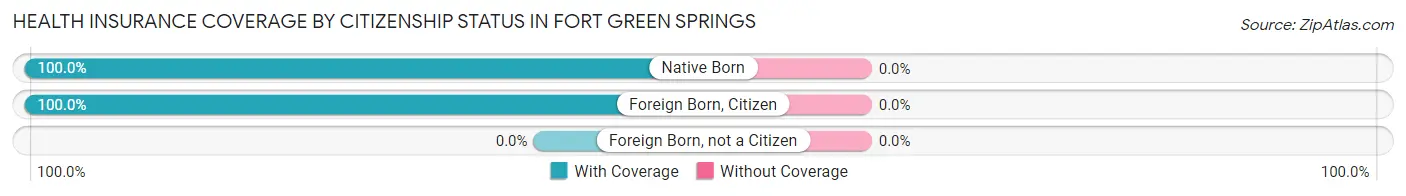
| Citizenship Status | With Coverage | Without Coverage |
| Native Born | 107 (100.0%) | 0 (0.0%) |
| Foreign Born, Citizen | 226 (100.0%) | 0 (0.0%) |
| Foreign Born, not a Citizen | 0 (0.0%) | 0 (0.0%) |
Health Insurance Coverage by Household Income in Fort Green Springs
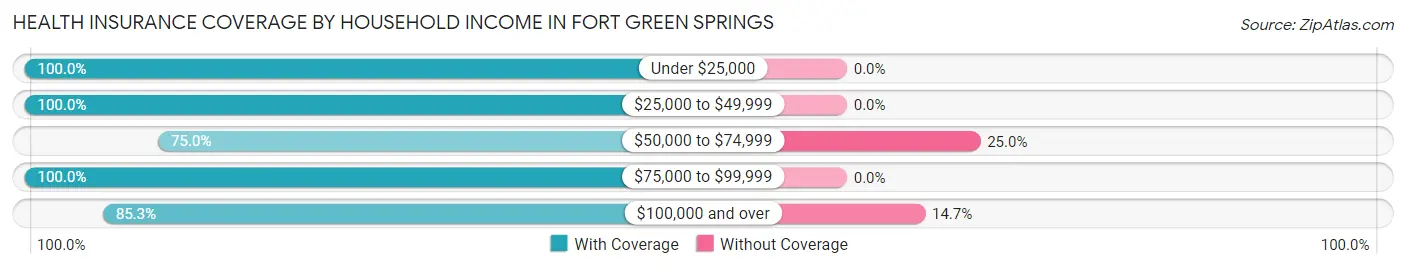
| Household Income | With Coverage | Without Coverage |
| Under $25,000 | 58 (100.0%) | 0 (0.0%) |
| $25,000 to $49,999 | 14 (100.0%) | 0 (0.0%) |
| $50,000 to $74,999 | 12 (75.0%) | 4 (25.0%) |
| $75,000 to $99,999 | 369 (100.0%) | 0 (0.0%) |
| $100,000 and over | 99 (85.3%) | 17 (14.7%) |
Public vs Private Health Insurance Coverage by Age in Fort Green Springs
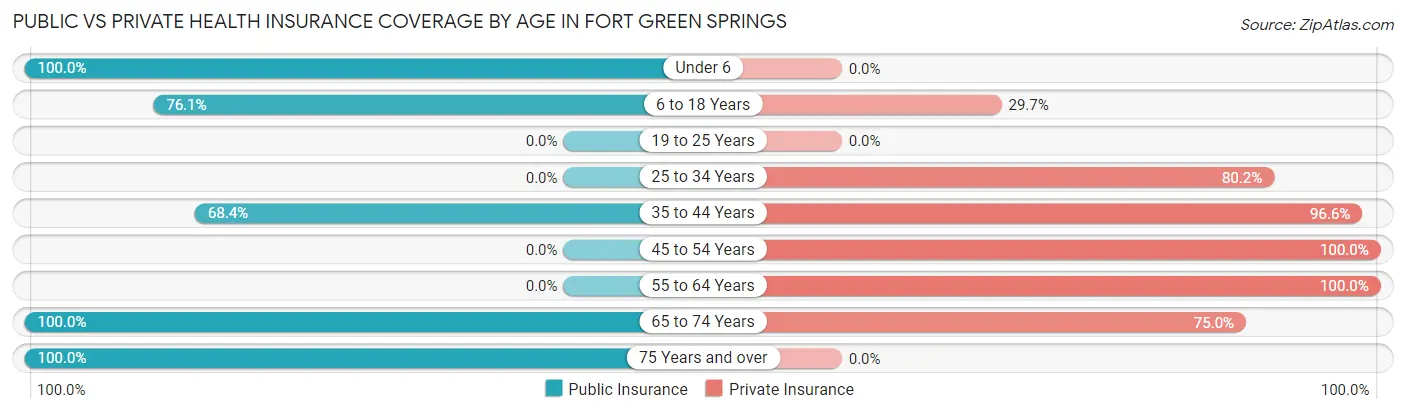
| Age Bracket | Public Insurance | Private Insurance |
| Under 6 | 107 (100.0%) | 0 (0.0%) |
| 6 to 18 Years | 172 (76.1%) | 67 (29.6%) |
| 19 to 25 Years | 0 (0.0%) | 0 (0.0%) |
| 25 to 34 Years | 0 (0.0%) | 69 (80.2%) |
| 35 to 44 Years | 80 (68.4%) | 113 (96.6%) |
| 45 to 54 Years | 0 (0.0%) | 24 (100.0%) |
| 55 to 64 Years | 0 (0.0%) | 8 (100.0%) |
| 65 to 74 Years | 4 (100.0%) | 3 (75.0%) |
| 75 Years and over | 1 (100.0%) | 0 (0.0%) |
| Total | 364 (63.5%) | 284 (49.6%) |
Disability Status by Sex by Age in Fort Green Springs
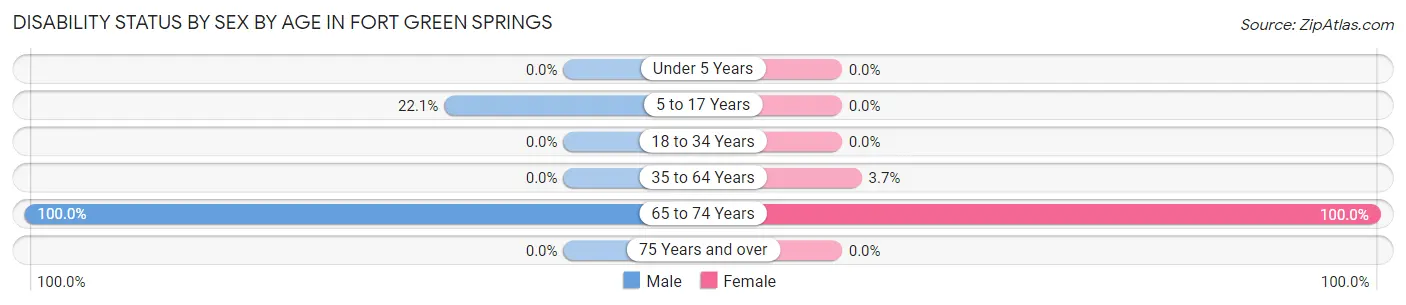
| Age Bracket | Male | Female |
| Under 5 Years | 0 (0.0%) | 0 (0.0%) |
| 5 to 17 Years | 27 (22.1%) | 0 (0.0%) |
| 18 to 34 Years | 0 (0.0%) | 0 (0.0%) |
| 35 to 64 Years | 0 (0.0%) | 4 (3.7%) |
| 65 to 74 Years | 3 (100.0%) | 1 (100.0%) |
| 75 Years and over | 0 (0.0%) | 0 (0.0%) |
Disability Class by Sex by Age in Fort Green Springs
Disability Class: Hearing Difficulty

| Age Bracket | Male | Female |
| Under 5 Years | 0 (0.0%) | 0 (0.0%) |
| 5 to 17 Years | 0 (0.0%) | 0 (0.0%) |
| 18 to 34 Years | 0 (0.0%) | 0 (0.0%) |
| 35 to 64 Years | 0 (0.0%) | 0 (0.0%) |
| 65 to 74 Years | 0 (0.0%) | 1 (100.0%) |
| 75 Years and over | 0 (0.0%) | 0 (0.0%) |
Disability Class: Vision Difficulty
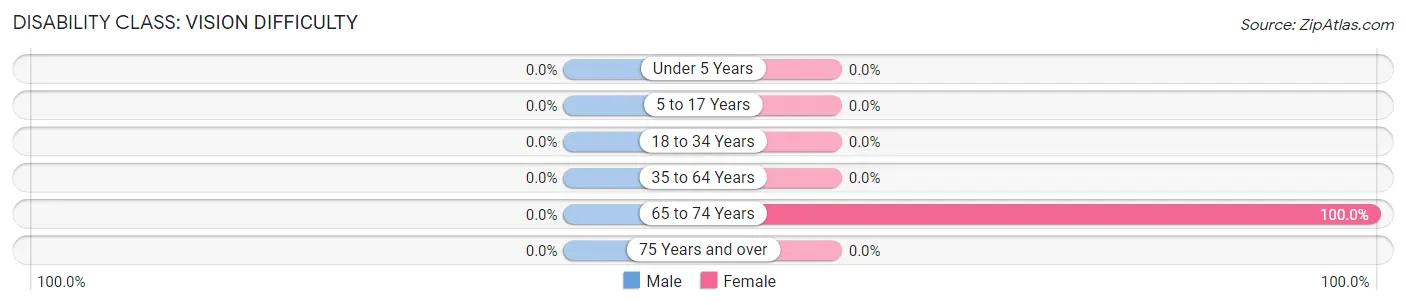
| Age Bracket | Male | Female |
| Under 5 Years | 0 (0.0%) | 0 (0.0%) |
| 5 to 17 Years | 0 (0.0%) | 0 (0.0%) |
| 18 to 34 Years | 0 (0.0%) | 0 (0.0%) |
| 35 to 64 Years | 0 (0.0%) | 0 (0.0%) |
| 65 to 74 Years | 0 (0.0%) | 1 (100.0%) |
| 75 Years and over | 0 (0.0%) | 0 (0.0%) |
Disability Class: Cognitive Difficulty
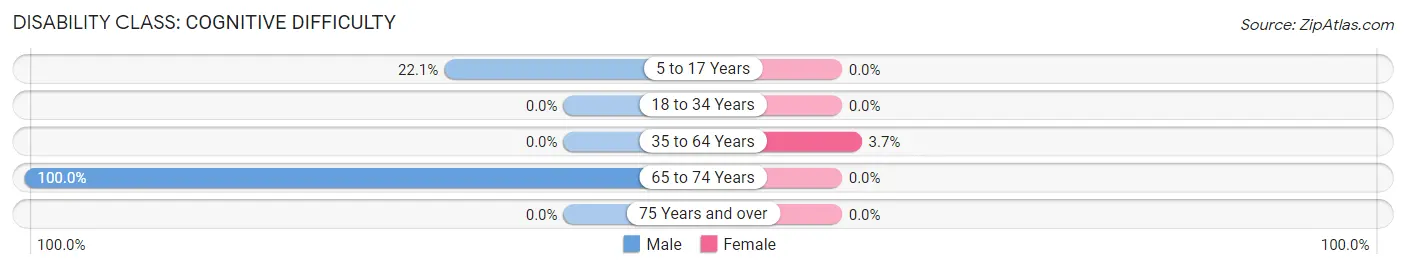
| Age Bracket | Male | Female |
| 5 to 17 Years | 27 (22.1%) | 0 (0.0%) |
| 18 to 34 Years | 0 (0.0%) | 0 (0.0%) |
| 35 to 64 Years | 0 (0.0%) | 4 (3.7%) |
| 65 to 74 Years | 3 (100.0%) | 0 (0.0%) |
| 75 Years and over | 0 (0.0%) | 0 (0.0%) |
Disability Class: Ambulatory Difficulty
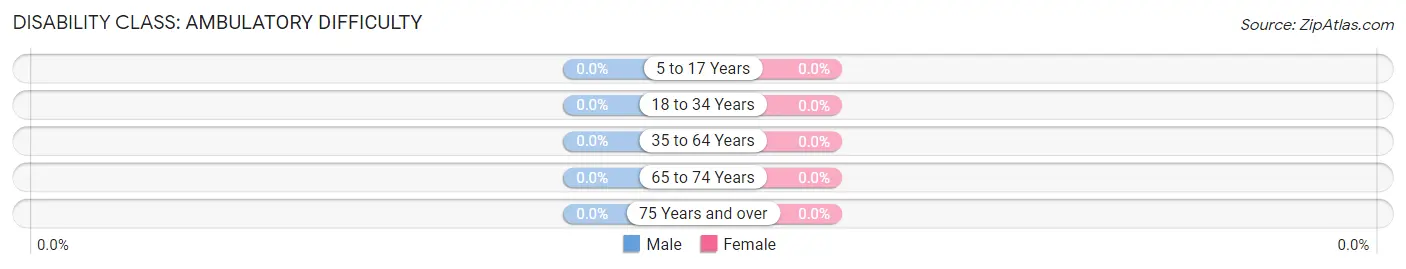
| Age Bracket | Male | Female |
| 5 to 17 Years | 0 (0.0%) | 0 (0.0%) |
| 18 to 34 Years | 0 (0.0%) | 0 (0.0%) |
| 35 to 64 Years | 0 (0.0%) | 0 (0.0%) |
| 65 to 74 Years | 0 (0.0%) | 0 (0.0%) |
| 75 Years and over | 0 (0.0%) | 0 (0.0%) |
Disability Class: Self-Care Difficulty
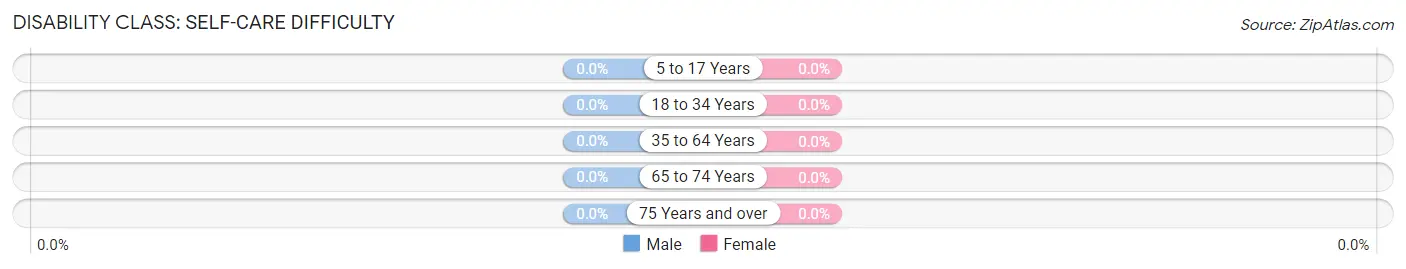
| Age Bracket | Male | Female |
| 5 to 17 Years | 0 (0.0%) | 0 (0.0%) |
| 18 to 34 Years | 0 (0.0%) | 0 (0.0%) |
| 35 to 64 Years | 0 (0.0%) | 0 (0.0%) |
| 65 to 74 Years | 0 (0.0%) | 0 (0.0%) |
| 75 Years and over | 0 (0.0%) | 0 (0.0%) |
Technology Access in Fort Green Springs
Computing Device Access in Fort Green Springs
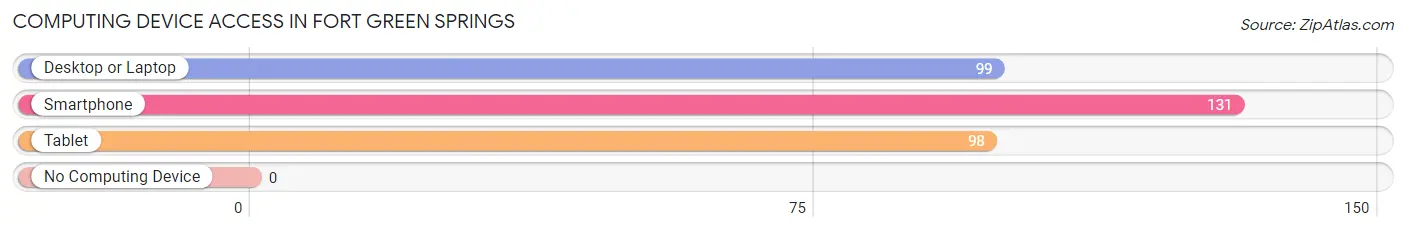
| Device Type | # Households | % Households |
| Desktop or Laptop | 99 | 75.6% |
| Smartphone | 131 | 100.0% |
| Tablet | 98 | 74.8% |
| No Computing Device | 0 | 0.0% |
| Total | 131 | 100.0% |
Internet Access in Fort Green Springs
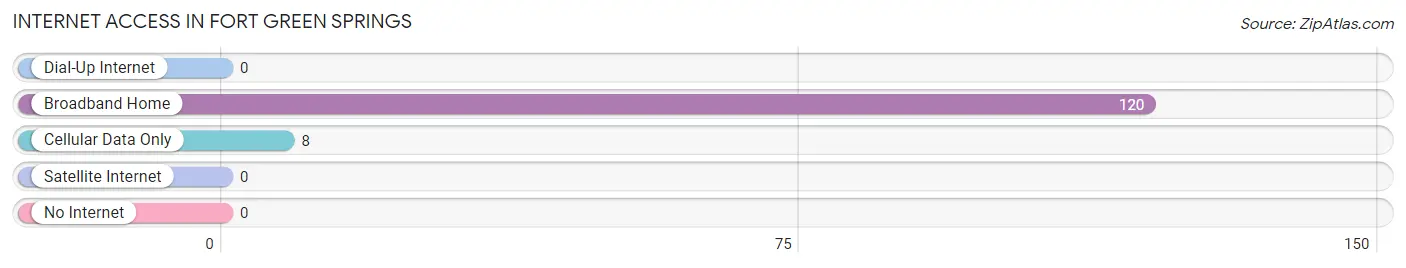
| Internet Type | # Households | % Households |
| Dial-Up Internet | 0 | 0.0% |
| Broadband Home | 120 | 91.6% |
| Cellular Data Only | 8 | 6.1% |
| Satellite Internet | 0 | 0.0% |
| No Internet | 0 | 0.0% |
| Total | 131 | 100.0% |
Fort Green Springs Summary
Green Springs, Florida is a small unincorporated community located in the northern part of Volusia County, Florida. It is situated on the banks of the St. Johns River, just south of the city of DeLand. The community is home to a population of approximately 1,000 people, and is known for its rural atmosphere and its proximity to the St. Johns River.
History
Green Springs was first settled in the late 1800s by a group of settlers from the nearby town of DeLand. The settlers were attracted to the area due to its proximity to the St. Johns River, which provided a source of fresh water and transportation. The settlers built a small community around the river, and the area became known as Green Springs.
The community grew slowly over the years, and by the early 1900s, it had become a popular destination for tourists and fishermen. The area was also known for its natural springs, which were believed to have healing properties. In the 1920s, the area was developed into a resort, and the Green Springs Hotel was built. The hotel was a popular destination for tourists and fishermen, and it remained in operation until the 1950s.
In the 1950s, the area began to decline as the popularity of the resort declined. The hotel was eventually closed, and the area became a quiet, rural community. In the 1970s, the area was revitalized when the St. Johns River was designated as a National Wild and Scenic River. This designation brought new attention to the area, and it began to attract new residents and businesses.
Geography
Green Springs is located in the northern part of Volusia County, Florida. It is situated on the banks of the St. Johns River, just south of the city of DeLand. The community is surrounded by a variety of natural features, including the St. Johns River, the Ocala National Forest, and the Green Springs State Park. The area is known for its rural atmosphere and its proximity to the St. Johns River.
Economy
Green Springs is a small, rural community with a limited economy. The primary source of employment in the area is agriculture, with many of the residents working in the farming and ranching industries. The area is also home to a number of small businesses, including restaurants, convenience stores, and other retail establishments.
Demographics
As of the 2010 census, the population of Green Springs was 1,000. The population is predominantly white, with a small percentage of African Americans and Hispanics. The median household income in the area is $37,000, and the median home value is $150,000. The area is served by the Volusia County School District, and the nearest high school is DeLand High School.
Green Springs is a small, rural community with a unique history and culture. The area is known for its natural beauty and its proximity to the St. Johns River. The area is home to a diverse population, and it is a popular destination for tourists and fishermen. The area is also home to a number of small businesses, and it is a great place to live and work.
Common Questions
What is Per Capita Income in Fort Green Springs?
Per Capita income in Fort Green Springs is $17,520.
What is the Median Family Income in Fort Green Springs?
Median Family Income in Fort Green Springs is $38,672.
What is the Median Household income in Fort Green Springs?
Median Household Income in Fort Green Springs is $76,078.
What is Inequality or Gini Index in Fort Green Springs?
Inequality or Gini Index in Fort Green Springs is 0.23.
What is the Total Population of Fort Green Springs?
Total Population of Fort Green Springs is 573.
What is the Total Male Population of Fort Green Springs?
Total Male Population of Fort Green Springs is 281.
What is the Total Female Population of Fort Green Springs?
Total Female Population of Fort Green Springs is 292.
What is the Ratio of Males per 100 Females in Fort Green Springs?
There are 96.23 Males per 100 Females in Fort Green Springs.
What is the Ratio of Females per 100 Males in Fort Green Springs?
There are 103.91 Females per 100 Males in Fort Green Springs.
What is the Median Population Age in Fort Green Springs?
Median Population Age in Fort Green Springs is 14.1 Years.
What is the Average Family Size in Fort Green Springs
Average Family Size in Fort Green Springs is 3.5 People.
What is the Average Household Size in Fort Green Springs
Average Household Size in Fort Green Springs is 4.4 People.
How Large is the Labor Force in Fort Green Springs?
There are 208 People in the Labor Forcein in Fort Green Springs.
What is the Percentage of People in the Labor Force in Fort Green Springs?
82.2% of People are in the Labor Force in Fort Green Springs.