Barrera, TX Map & Demographics
Barrera Map
Barrera Overview
$6,589
PER CAPITA INCOME
0.57
INEQUALITY / GINI INDEX
331
TOTAL POPULATION
118
MALE POPULATION
213
FEMALE POPULATION
55.40
MALES / 100 FEMALES
180.51
FEMALES / 100 MALES
13.7
MEDIAN AGE
3.3
AVG FAMILY SIZE
2.5
AVG HOUSEHOLD SIZE
68
LABOR FORCE [ PEOPLE ]
42.8%
PERCENT IN LABOR FORCE
16.2%
UNEMPLOYMENT RATE
Income in Barrera
Income Overview in Barrera
| Characteristic | Number | Measure |
| Per Capita Income | 331 | $6,589 |
| Median Family Income | 87 | $0 |
| Mean Family Income | 87 | $20,920 |
| Median Household Income | 132 | $0 |
| Mean Household Income | 132 | $16,234 |
| Income Deficit | 87 | $0 |
| Wage / Income Gap (%) | 331 | 0.00% |
| Wage / Income Gap ($) | 331 | 100.00¢ per $1 |
| Gini / Inequality Index | 331 | 0.57 |
Earnings by Sex in Barrera
| Sex | Number | Average Earnings |
| Male | 34 (50.0%) | $0 |
| Female | 34 (50.0%) | $0 |
| Total | 68 (100.0%) | $0 |
Earnings by Sex by Income Bracket in Barrera
The most common earnings brackets in Barrera are $7,500 to $9,999 for men (34 | 100.0%) and $55,000 to $64,999 for women (23 | 67.6%).
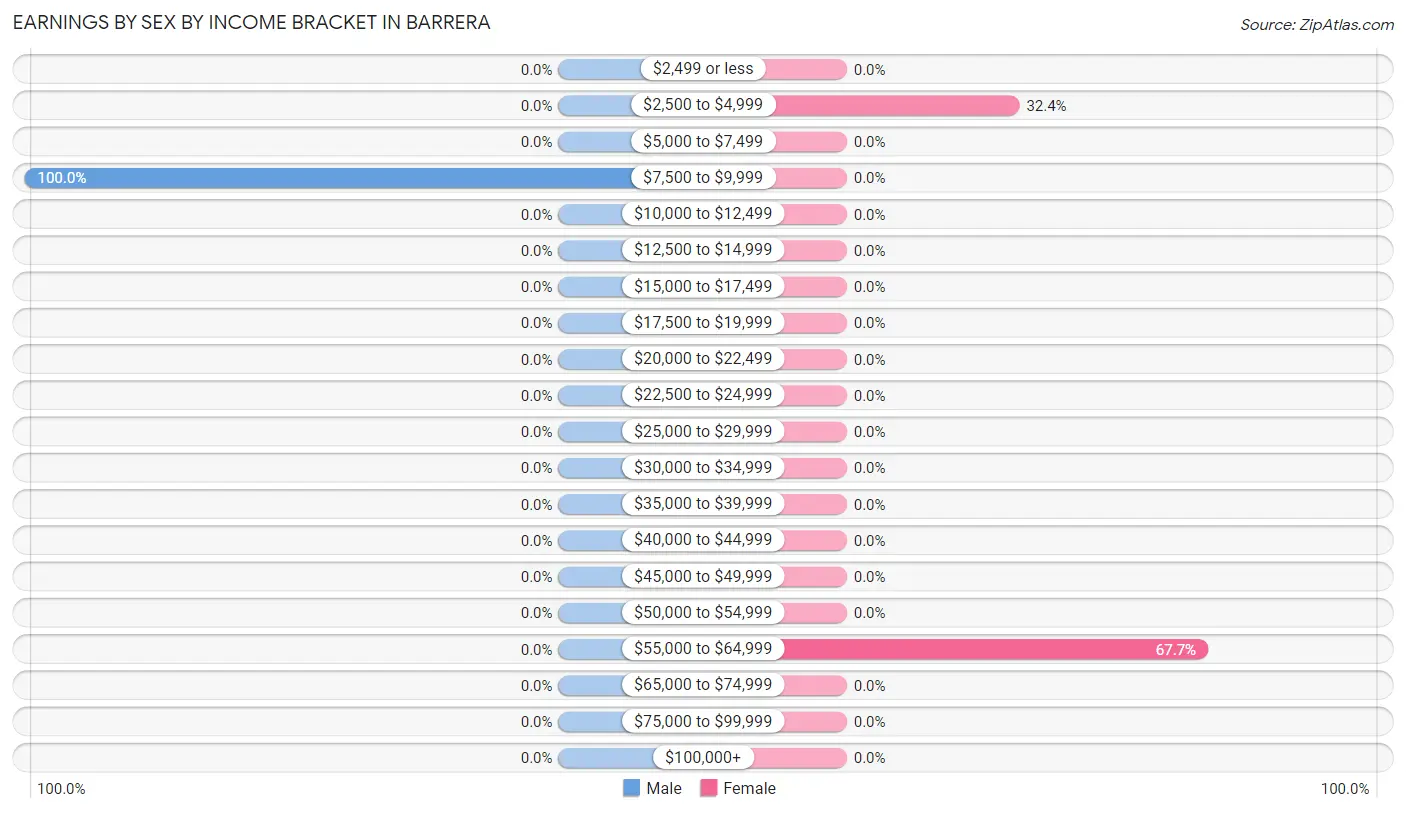
| Income | Male | Female |
| $2,499 or less | 0 (0.0%) | 0 (0.0%) |
| $2,500 to $4,999 | 0 (0.0%) | 11 (32.4%) |
| $5,000 to $7,499 | 0 (0.0%) | 0 (0.0%) |
| $7,500 to $9,999 | 34 (100.0%) | 0 (0.0%) |
| $10,000 to $12,499 | 0 (0.0%) | 0 (0.0%) |
| $12,500 to $14,999 | 0 (0.0%) | 0 (0.0%) |
| $15,000 to $17,499 | 0 (0.0%) | 0 (0.0%) |
| $17,500 to $19,999 | 0 (0.0%) | 0 (0.0%) |
| $20,000 to $22,499 | 0 (0.0%) | 0 (0.0%) |
| $22,500 to $24,999 | 0 (0.0%) | 0 (0.0%) |
| $25,000 to $29,999 | 0 (0.0%) | 0 (0.0%) |
| $30,000 to $34,999 | 0 (0.0%) | 0 (0.0%) |
| $35,000 to $39,999 | 0 (0.0%) | 0 (0.0%) |
| $40,000 to $44,999 | 0 (0.0%) | 0 (0.0%) |
| $45,000 to $49,999 | 0 (0.0%) | 0 (0.0%) |
| $50,000 to $54,999 | 0 (0.0%) | 0 (0.0%) |
| $55,000 to $64,999 | 0 (0.0%) | 23 (67.6%) |
| $65,000 to $74,999 | 0 (0.0%) | 0 (0.0%) |
| $75,000 to $99,999 | 0 (0.0%) | 0 (0.0%) |
| $100,000+ | 0 (0.0%) | 0 (0.0%) |
| Total | 34 (100.0%) | 34 (100.0%) |
Earnings by Sex by Educational Attainment in Barrera
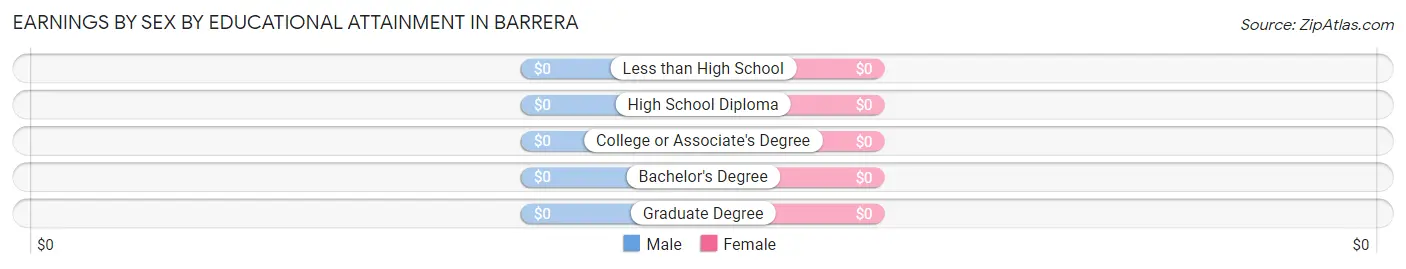
| Educational Attainment | Male Income | Female Income |
| Less than High School | - | - |
| High School Diploma | - | - |
| College or Associate's Degree | - | - |
| Bachelor's Degree | - | - |
| Graduate Degree | - | - |
| Total | - | - |
Family Income in Barrera
Family Income Brackets in Barrera
According to the Barrera family income data, there are 43 families falling into the less than $10,000 income range, which is the most common income bracket and makes up 49.4% of all families.
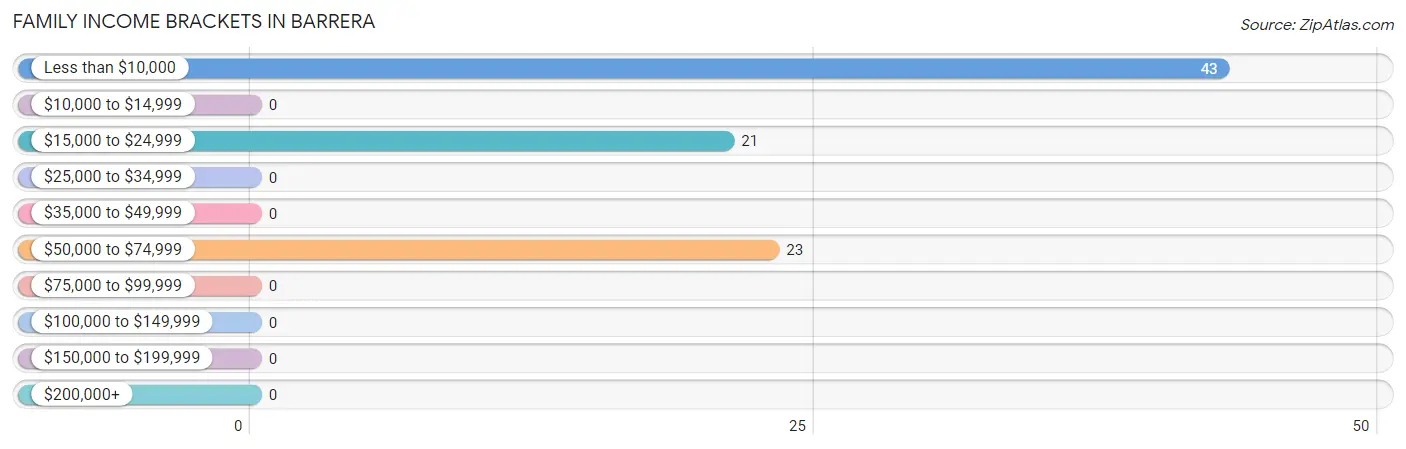
| Income Bracket | # Families | % Families |
| Less than $10,000 | 43 | 49.4% |
| $10,000 to $14,999 | 0 | 0.0% |
| $15,000 to $24,999 | 21 | 24.1% |
| $25,000 to $34,999 | 0 | 0.0% |
| $35,000 to $49,999 | 0 | 0.0% |
| $50,000 to $74,999 | 23 | 26.4% |
| $75,000 to $99,999 | 0 | 0.0% |
| $100,000 to $149,999 | 0 | 0.0% |
| $150,000 to $199,999 | 0 | 0.0% |
| $200,000+ | 0 | 0.0% |
Family Income by Famaliy Size in Barrera
| Income Bracket | # Families | Median Income |
| 2-Person Families | 21 (24.1%) | $0 |
| 3-Person Families | 66 (75.9%) | $0 |
| 4-Person Families | 0 (0.0%) | $0 |
| 5-Person Families | 0 (0.0%) | $0 |
| 6-Person Families | 0 (0.0%) | $0 |
| 7+ Person Families | 0 (0.0%) | $0 |
| Total | 87 (100.0%) | $0 |
Family Income by Number of Earners in Barrera
| Number of Earners | # Families | Median Income |
| No Earners | 64 (73.6%) | $0 |
| 1 Earner | 23 (26.4%) | $0 |
| 2 Earners | 0 (0.0%) | $0 |
| 3+ Earners | 0 (0.0%) | $0 |
| Total | 87 (100.0%) | $0 |
Household Income in Barrera
Household Income Brackets in Barrera
With 88 households falling in the category, the less than $10,000 income range is the most frequent in Barrera, accounting for 66.7% of all households.
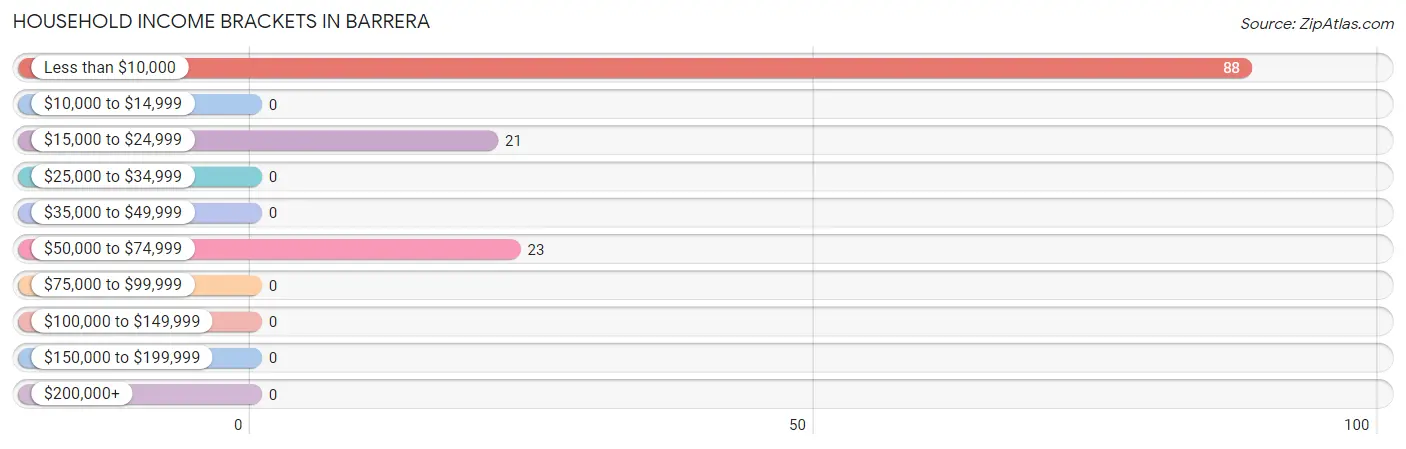
| Income Bracket | # Households | % Households |
| Less than $10,000 | 88 | 66.7% |
| $10,000 to $14,999 | 0 | 0.0% |
| $15,000 to $24,999 | 21 | 15.9% |
| $25,000 to $34,999 | 0 | 0.0% |
| $35,000 to $49,999 | 0 | 0.0% |
| $50,000 to $74,999 | 23 | 17.4% |
| $75,000 to $99,999 | 0 | 0.0% |
| $100,000 to $149,999 | 0 | 0.0% |
| $150,000 to $199,999 | 0 | 0.0% |
| $200,000+ | 0 | 0.0% |
Household Income by Householder Age in Barrera
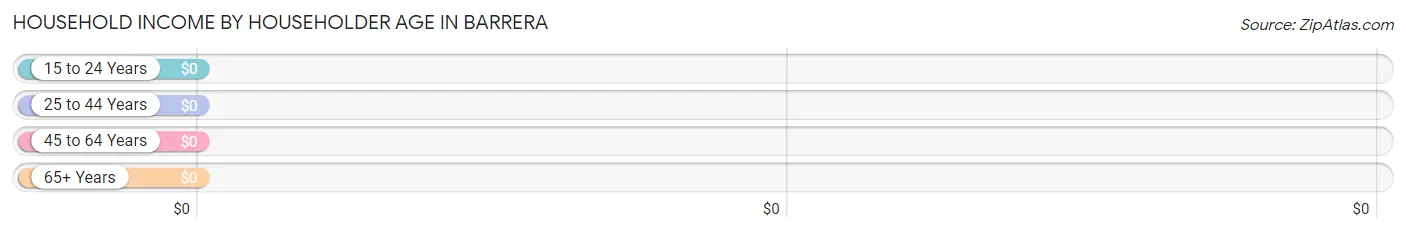
| Income Bracket | # Households | Median Income |
| 15 to 24 Years | 43 (32.6%) | $0 |
| 25 to 44 Years | 23 (17.4%) | $0 |
| 45 to 64 Years | 45 (34.1%) | $0 |
| 65+ Years | 21 (15.9%) | $0 |
| Total | 132 (100.0%) | $0 |
Poverty in Barrera
Income Below Poverty by Sex and Age in Barrera
With 82.2% poverty level for males and 54.0% for females among the residents of Barrera, under 5 year old males and under 5 year old females are the most vulnerable to poverty, with 63 males (100.0%) and 61 females (100.0%) in their respective age groups living below the poverty level.
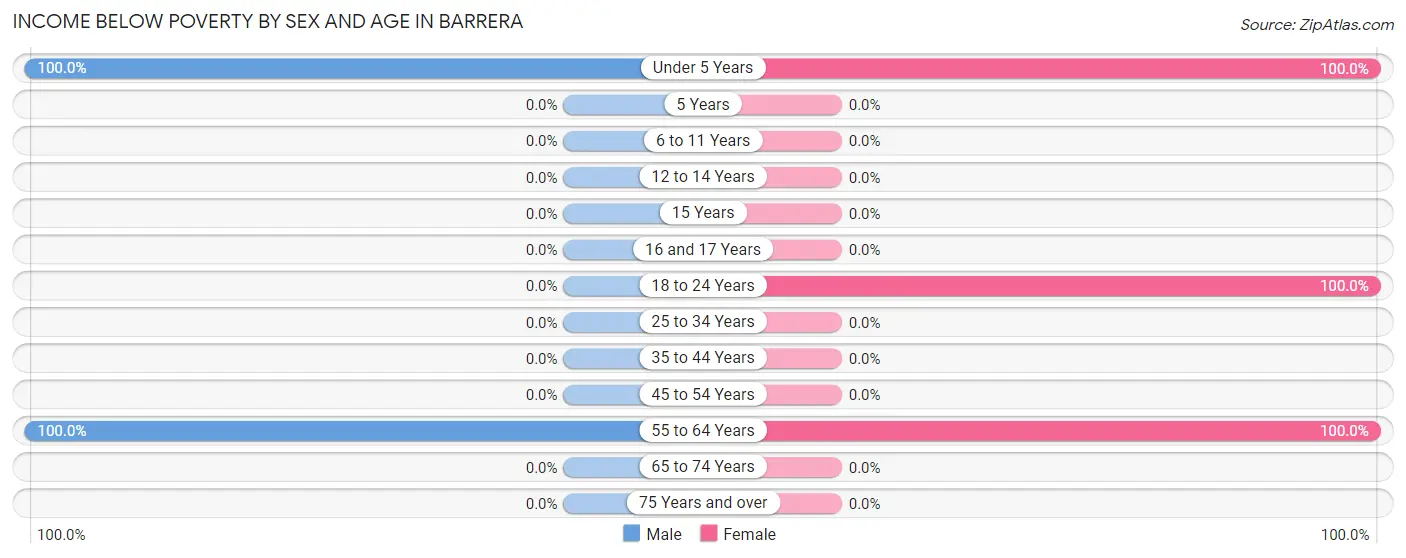
| Age Bracket | Male | Female |
| Under 5 Years | 63 (100.0%) | 61 (100.0%) |
| 5 Years | 0 (0.0%) | 0 (0.0%) |
| 6 to 11 Years | 0 (0.0%) | 0 (0.0%) |
| 12 to 14 Years | 0 (0.0%) | 0 (0.0%) |
| 15 Years | 0 (0.0%) | 0 (0.0%) |
| 16 and 17 Years | 0 (0.0%) | 0 (0.0%) |
| 18 to 24 Years | 0 (0.0%) | 43 (100.0%) |
| 25 to 34 Years | 0 (0.0%) | 0 (0.0%) |
| 35 to 44 Years | 0 (0.0%) | 0 (0.0%) |
| 45 to 54 Years | 0 (0.0%) | 0 (0.0%) |
| 55 to 64 Years | 34 (100.0%) | 11 (100.0%) |
| 65 to 74 Years | 0 (0.0%) | 0 (0.0%) |
| 75 Years and over | 0 (0.0%) | 0 (0.0%) |
| Total | 97 (82.2%) | 115 (54.0%) |
Income Above Poverty by Sex and Age in Barrera
According to the poverty statistics in Barrera, males aged 75 years and over and females aged 6 to 11 years are the age groups that are most secure financially, with 100.0% of males and 100.0% of females in these age groups living above the poverty line.
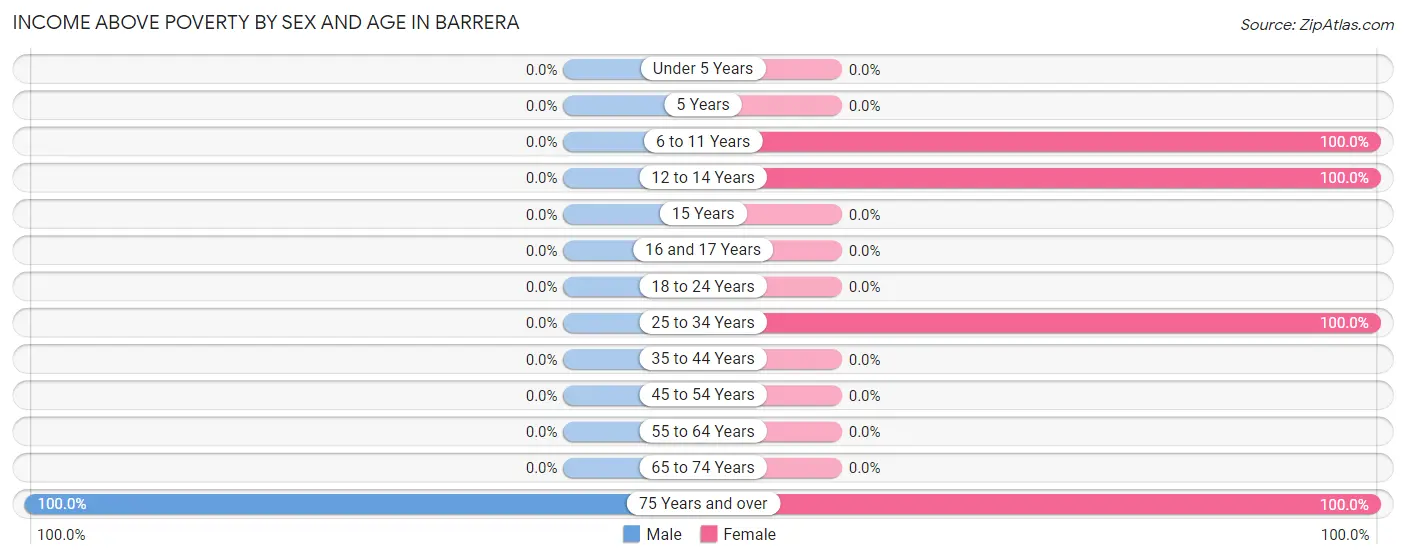
| Age Bracket | Male | Female |
| Under 5 Years | 0 (0.0%) | 0 (0.0%) |
| 5 Years | 0 (0.0%) | 0 (0.0%) |
| 6 to 11 Years | 0 (0.0%) | 24 (100.0%) |
| 12 to 14 Years | 0 (0.0%) | 24 (100.0%) |
| 15 Years | 0 (0.0%) | 0 (0.0%) |
| 16 and 17 Years | 0 (0.0%) | 0 (0.0%) |
| 18 to 24 Years | 0 (0.0%) | 0 (0.0%) |
| 25 to 34 Years | 0 (0.0%) | 23 (100.0%) |
| 35 to 44 Years | 0 (0.0%) | 0 (0.0%) |
| 45 to 54 Years | 0 (0.0%) | 0 (0.0%) |
| 55 to 64 Years | 0 (0.0%) | 0 (0.0%) |
| 65 to 74 Years | 0 (0.0%) | 0 (0.0%) |
| 75 Years and over | 21 (100.0%) | 27 (100.0%) |
| Total | 21 (17.8%) | 98 (46.0%) |
Income Below Poverty Among Married-Couple Families in Barrera
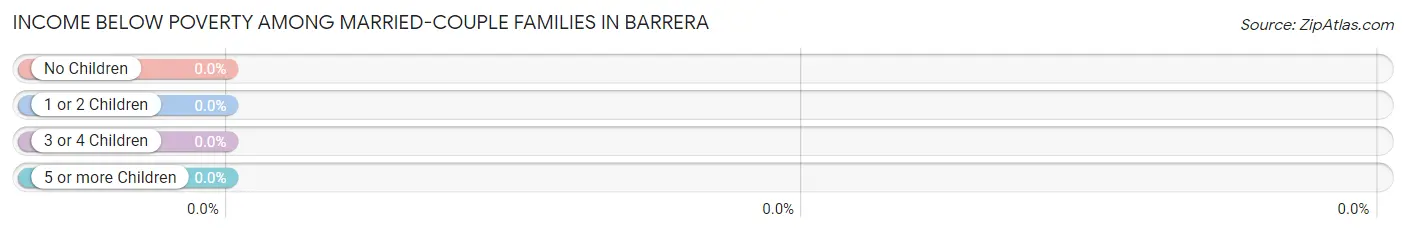
| Children | Above Poverty | Below Poverty |
| No Children | 21 (100.0%) | 0 (0.0%) |
| 1 or 2 Children | 0 (0.0%) | 0 (0.0%) |
| 3 or 4 Children | 0 (0.0%) | 0 (0.0%) |
| 5 or more Children | 0 (0.0%) | 0 (0.0%) |
| Total | 21 (100.0%) | 0 (0.0%) |
Income Below Poverty Among Single-Parent Households in Barrera
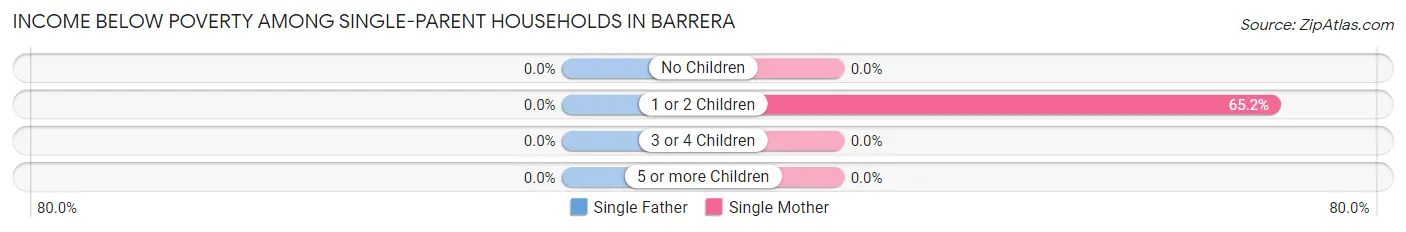
| Children | Single Father | Single Mother |
| No Children | 0 (0.0%) | 0 (0.0%) |
| 1 or 2 Children | 0 (0.0%) | 43 (65.1%) |
| 3 or 4 Children | 0 (0.0%) | 0 (0.0%) |
| 5 or more Children | 0 (0.0%) | 0 (0.0%) |
| Total | 0 (0.0%) | 43 (65.1%) |
Income Below Poverty Among Married-Couple vs Single-Parent Households in Barrera
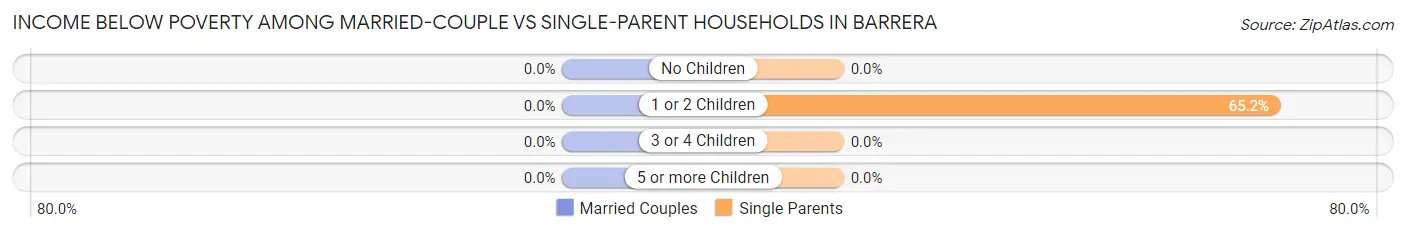
| Children | Married-Couple Families | Single-Parent Households |
| No Children | 0 (0.0%) | 0 (0.0%) |
| 1 or 2 Children | 0 (0.0%) | 43 (65.1%) |
| 3 or 4 Children | 0 (0.0%) | 0 (0.0%) |
| 5 or more Children | 0 (0.0%) | 0 (0.0%) |
| Total | 0 (0.0%) | 43 (65.1%) |
Race in Barrera
The most populous races in Barrera are Hispanic or Latino (331 | 100.0%), White / Caucasian (249 | 75.2%), and Two or more Races (82 | 24.8%).
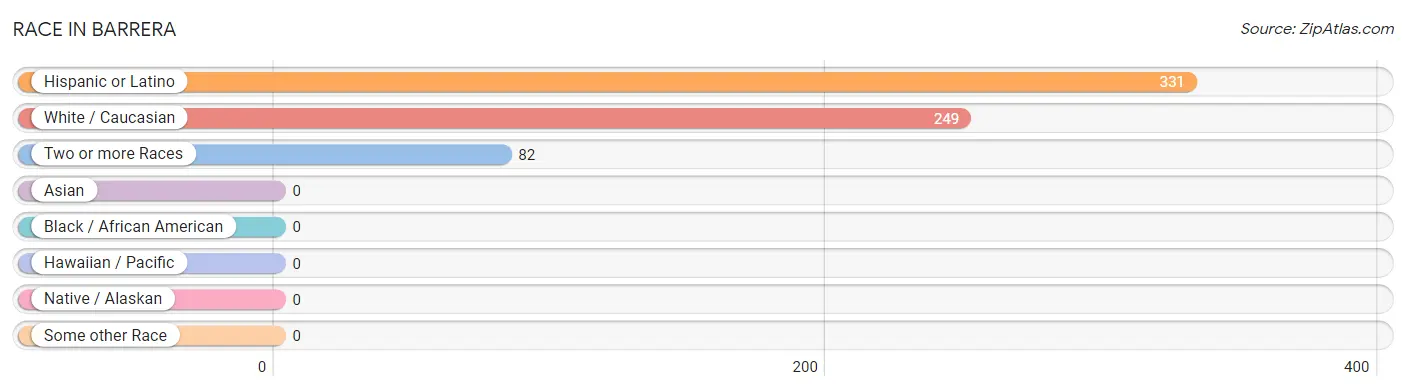
| Race | # Population | % Population |
| Asian | 0 | 0.0% |
| Black / African American | 0 | 0.0% |
| Hawaiian / Pacific | 0 | 0.0% |
| Hispanic or Latino | 331 | 100.0% |
| Native / Alaskan | 0 | 0.0% |
| White / Caucasian | 249 | 75.2% |
| Two or more Races | 82 | 24.8% |
| Some other Race | 0 | 0.0% |
| Total | 331 | 100.0% |
Ancestry in Barrera
The most populous ancestries reported in Barrera are , and Mexican (320 | 96.7%), together accounting for 96.7% of all Barrera residents.

| Ancestry | # Population | % Population |
| Mexican | 320 | 96.7% | View All 1 Rows |
Immigrants in Barrera
The most numerous immigrant groups reported in Barrera came from Central America (82 | 24.8%), Latin America (82 | 24.8%), and Mexico (82 | 24.8%), together accounting for 74.3% of all Barrera residents.
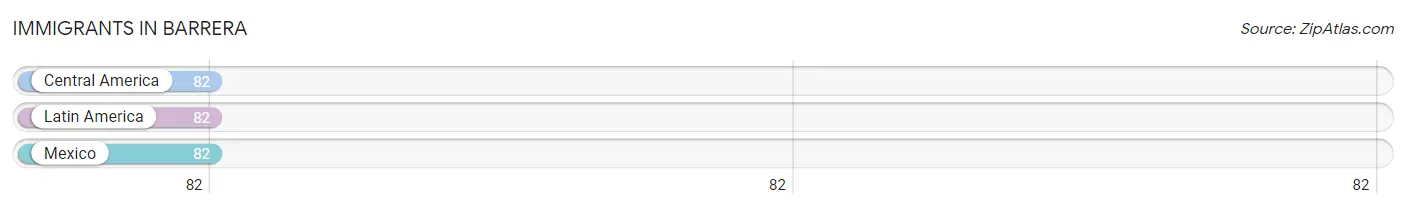
| Immigration Origin | # Population | % Population |
| Central America | 82 | 24.8% |
| Latin America | 82 | 24.8% |
| Mexico | 82 | 24.8% | View All 3 Rows |
Sex and Age in Barrera
Sex and Age in Barrera
The most populous age groups in Barrera are Under 5 Years (63 | 53.4%) for men and Under 5 Years (61 | 28.6%) for women.
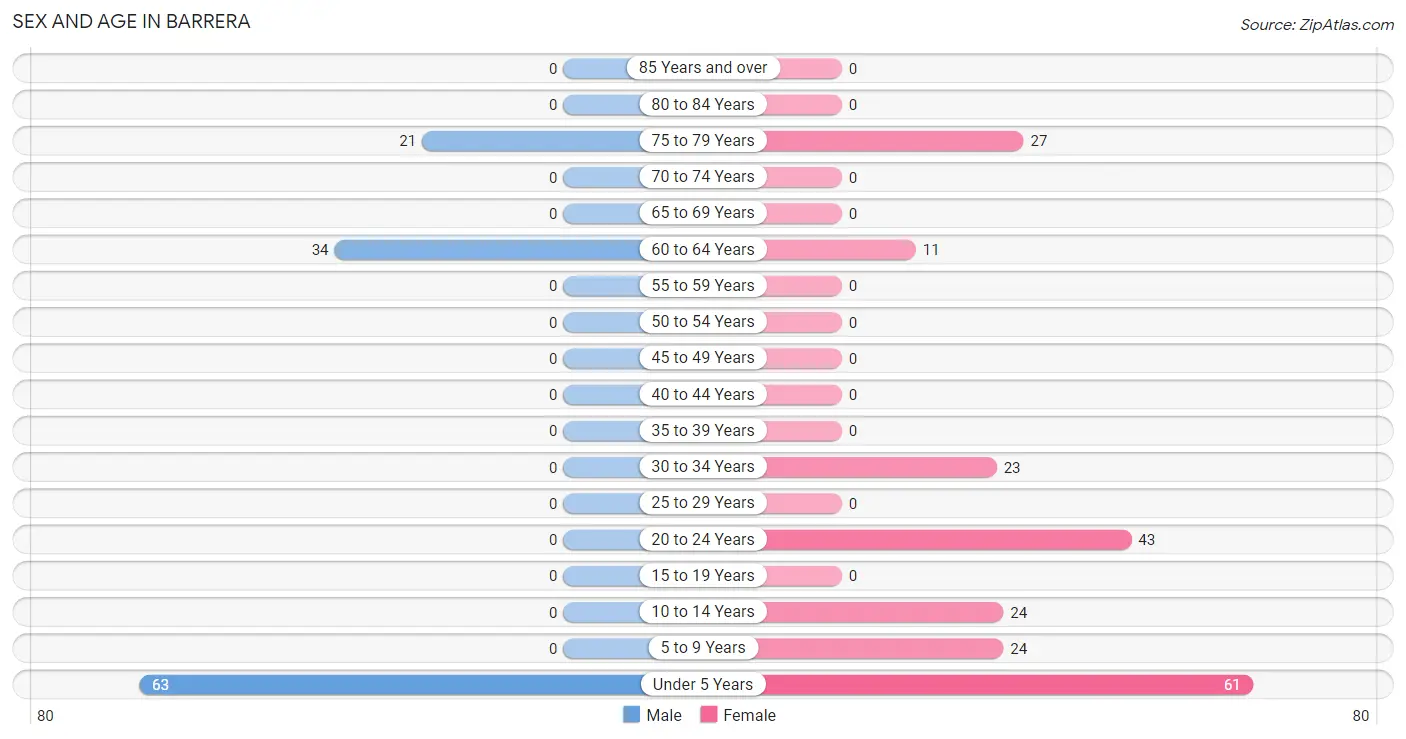
| Age Bracket | Male | Female |
| Under 5 Years | 63 (53.4%) | 61 (28.6%) |
| 5 to 9 Years | 0 (0.0%) | 24 (11.3%) |
| 10 to 14 Years | 0 (0.0%) | 24 (11.3%) |
| 15 to 19 Years | 0 (0.0%) | 0 (0.0%) |
| 20 to 24 Years | 0 (0.0%) | 43 (20.2%) |
| 25 to 29 Years | 0 (0.0%) | 0 (0.0%) |
| 30 to 34 Years | 0 (0.0%) | 23 (10.8%) |
| 35 to 39 Years | 0 (0.0%) | 0 (0.0%) |
| 40 to 44 Years | 0 (0.0%) | 0 (0.0%) |
| 45 to 49 Years | 0 (0.0%) | 0 (0.0%) |
| 50 to 54 Years | 0 (0.0%) | 0 (0.0%) |
| 55 to 59 Years | 0 (0.0%) | 0 (0.0%) |
| 60 to 64 Years | 34 (28.8%) | 11 (5.2%) |
| 65 to 69 Years | 0 (0.0%) | 0 (0.0%) |
| 70 to 74 Years | 0 (0.0%) | 0 (0.0%) |
| 75 to 79 Years | 21 (17.8%) | 27 (12.7%) |
| 80 to 84 Years | 0 (0.0%) | 0 (0.0%) |
| 85 Years and over | 0 (0.0%) | 0 (0.0%) |
| Total | 118 (100.0%) | 213 (100.0%) |
Families and Households in Barrera
Median Family Size in Barrera
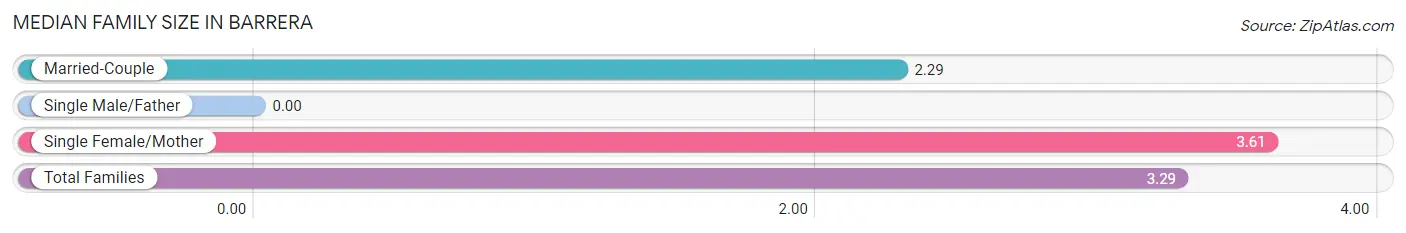
| Family Type | # Families | Family Size |
| Married-Couple | 21 (24.1%) | 2.29 |
| Single Male/Father | 0 (0.0%) | - |
| Single Female/Mother | 66 (75.9%) | 3.61 |
| Total Families | 87 (100.0%) | 3.29 |
Median Household Size in Barrera
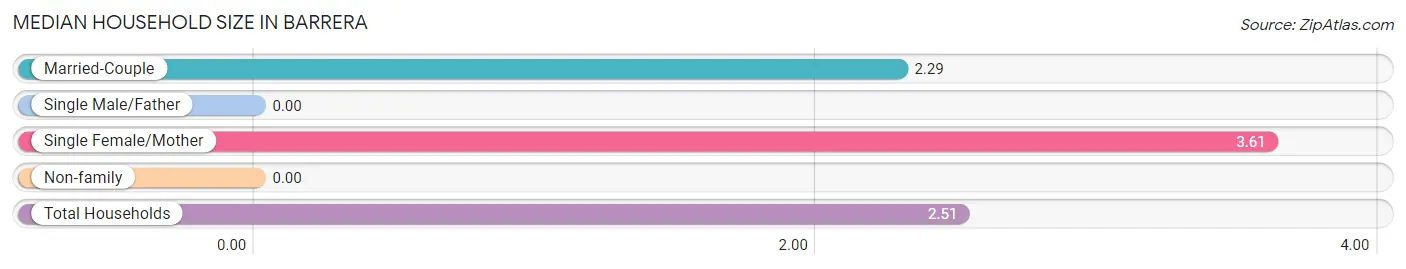
| Household Type | # Households | Household Size |
| Married-Couple | 21 (15.9%) | 2.29 |
| Single Male/Father | 0 (0.0%) | - |
| Single Female/Mother | 66 (50.0%) | 3.61 |
| Non-family | 45 (34.1%) | - |
| Total Households | 132 (100.0%) | 2.51 |
Household Size by Marriage Status in Barrera
Out of a total of 132 households in Barrera, 87 (65.9%) are family households, while 45 (34.1%) are nonfamily households. The most numerous type of family households are 3-person households, comprising 66, and the most common type of nonfamily households are 1-person households, comprising 45.
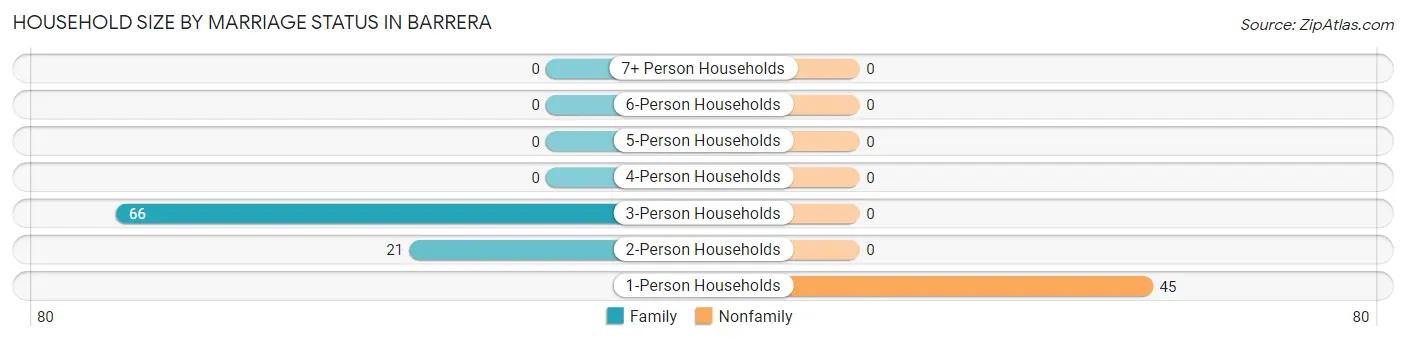
| Household Size | Family Households | Nonfamily Households |
| 1-Person Households | - | 45 (34.1%) |
| 2-Person Households | 21 (15.9%) | 0 (0.0%) |
| 3-Person Households | 66 (50.0%) | 0 (0.0%) |
| 4-Person Households | 0 (0.0%) | 0 (0.0%) |
| 5-Person Households | 0 (0.0%) | 0 (0.0%) |
| 6-Person Households | 0 (0.0%) | 0 (0.0%) |
| 7+ Person Households | 0 (0.0%) | 0 (0.0%) |
| Total | 87 (65.9%) | 45 (34.1%) |
Female Fertility in Barrera
Fertility by Age in Barrera
Average fertility rate in Barrera is 652.0 births per 1,000 women. Women in the age bracket of 20 to 34 years have the highest fertility rate with 652.0 births per 1,000 women. Women in the age bracket of 20 to 34 years acount for 100.0% of all women with births.
| Age Bracket | Women with Births | Births / 1,000 Women |
| 15 to 19 years | 0 (0.0%) | 0.0 |
| 20 to 34 years | 43 (100.0%) | 652.0 |
| 35 to 50 years | 0 (0.0%) | 0.0 |
| Total | 43 (100.0%) | 652.0 |
Fertility by Age by Marriage Status in Barrera
| Age Bracket | Married | Unmarried |
| 15 to 19 years | 0 (0.0%) | 0 (0.0%) |
| 20 to 34 years | 0 (0.0%) | 43 (100.0%) |
| 35 to 50 years | 0 (0.0%) | 0 (0.0%) |
| Total | 0 (0.0%) | 43 (100.0%) |
Fertility by Education in Barrera
| Educational Attainment | Women with Births | Births / 1,000 Women |
| Less than High School | 0 (0.0%) | 0.0 |
| High School Diploma | 0 (0.0%) | 0.0 |
| College or Associate's Degree | 43 (100.0%) | 1,000.0 |
| Bachelor's Degree | 0 (0.0%) | 0.0 |
| Graduate Degree | 0 (0.0%) | 0.0 |
| Total | 43 (100.0%) | 652.0 |
Fertility by Education by Marriage Status in Barrera
| Educational Attainment | Married | Unmarried |
| Less than High School | 0 (0.0%) | 0 (0.0%) |
| High School Diploma | 0 (0.0%) | 0 (0.0%) |
| College or Associate's Degree | 0 (0.0%) | 43 (100.0%) |
| Bachelor's Degree | 0 (0.0%) | 0 (0.0%) |
| Graduate Degree | 0 (0.0%) | 0 (0.0%) |
| Total | 0 (0.0%) | 43 (100.0%) |
Employment Characteristics in Barrera
Employment by Class of Employer in Barrera
Among the 57 employed individuals in Barrera, self-employed (not incorporated) (34 | 59.7%), and private company employees (23 | 40.4%) make up the most common classes of employment.
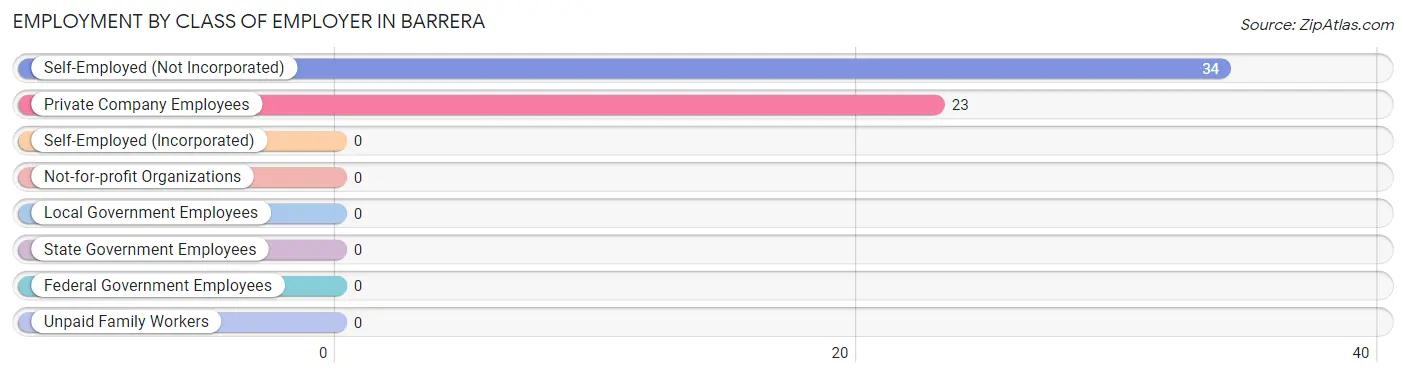
| Employer Class | # Employees | % Employees |
| Private Company Employees | 23 | 40.4% |
| Self-Employed (Incorporated) | 0 | 0.0% |
| Self-Employed (Not Incorporated) | 34 | 59.7% |
| Not-for-profit Organizations | 0 | 0.0% |
| Local Government Employees | 0 | 0.0% |
| State Government Employees | 0 | 0.0% |
| Federal Government Employees | 0 | 0.0% |
| Unpaid Family Workers | 0 | 0.0% |
| Total | 57 | 100.0% |
Employment Status by Age in Barrera
According to the labor force statistics for Barrera, out of the total population over 16 years of age (159), 42.8% or 68 individuals are in the labor force, with 16.2% or 11 of them unemployed. The age group with the highest labor force participation rate is 30 to 34 years, with 100.0% or 23 individuals in the labor force. Within the labor force, the 60 to 64 years age range has the highest percentage of unemployed individuals, with 24.4% or 11 of them being unemployed.
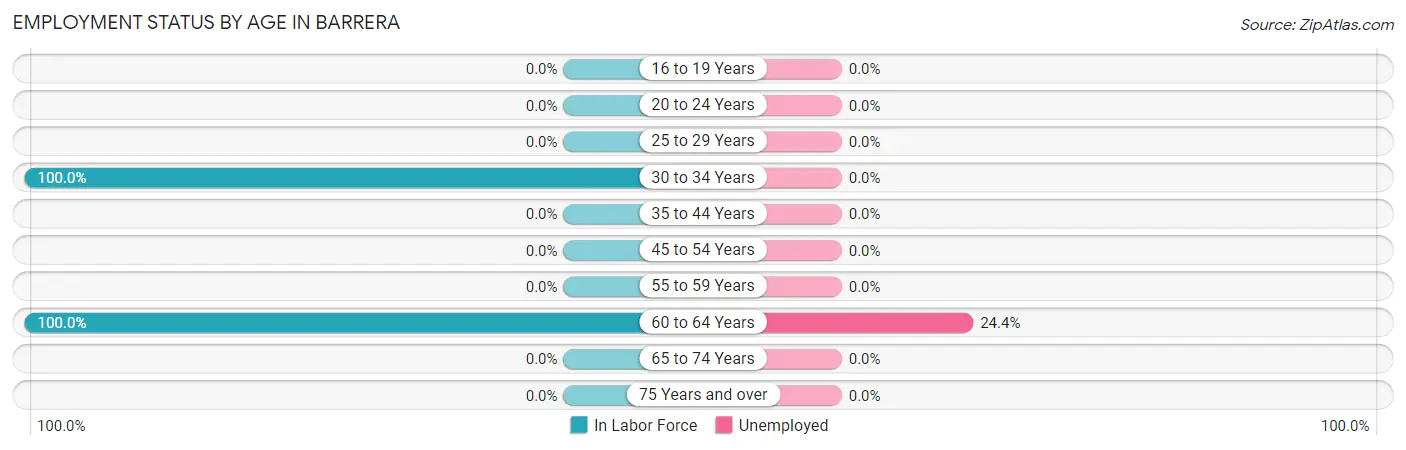
| Age Bracket | In Labor Force | Unemployed |
| 16 to 19 Years | 0 (0.0%) | 0 (0.0%) |
| 20 to 24 Years | 0 (0.0%) | 0 (0.0%) |
| 25 to 29 Years | 0 (0.0%) | 0 (0.0%) |
| 30 to 34 Years | 23 (100.0%) | 0 (0.0%) |
| 35 to 44 Years | 0 (0.0%) | 0 (0.0%) |
| 45 to 54 Years | 0 (0.0%) | 0 (0.0%) |
| 55 to 59 Years | 0 (0.0%) | 0 (0.0%) |
| 60 to 64 Years | 45 (100.0%) | 11 (24.4%) |
| 65 to 74 Years | 0 (0.0%) | 0 (0.0%) |
| 75 Years and over | 0 (0.0%) | 0 (0.0%) |
| Total | 68 (42.8%) | 11 (16.2%) |
Employment Status by Educational Attainment in Barrera
According to labor force statistics for Barrera, 100.0% of individuals (68) out of the total population between 25 and 64 years of age (68) are in the labor force, with 16.2% or 11 of them being unemployed. The group with the highest labor force participation rate are those with the educational attainment of less than high school, with 100.0% or 34 individuals in the labor force. Within the labor force, individuals with college / associate degree education have the highest percentage of unemployment, with 100.0% or 11 of them being unemployed.
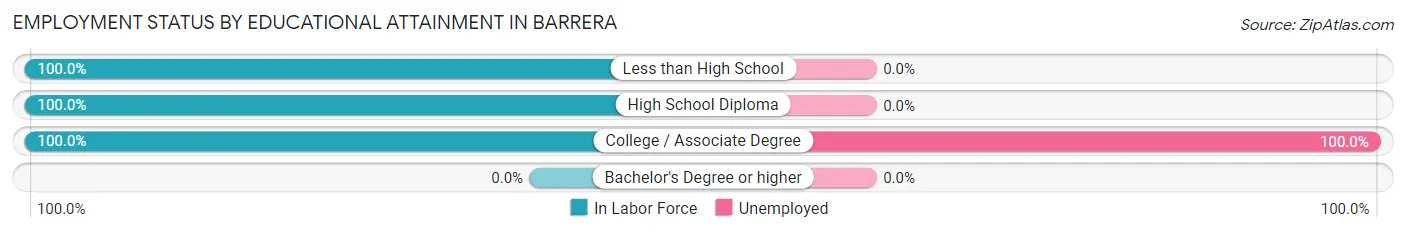
| Educational Attainment | In Labor Force | Unemployed |
| Less than High School | 34 (100.0%) | 0 (0.0%) |
| High School Diploma | 23 (100.0%) | 0 (0.0%) |
| College / Associate Degree | 11 (100.0%) | 11 (100.0%) |
| Bachelor's Degree or higher | 0 (0.0%) | 0 (0.0%) |
| Total | 68 (100.0%) | 11 (16.2%) |
Employment Occupations by Sex in Barrera
Management, Business, Science and Arts Occupations
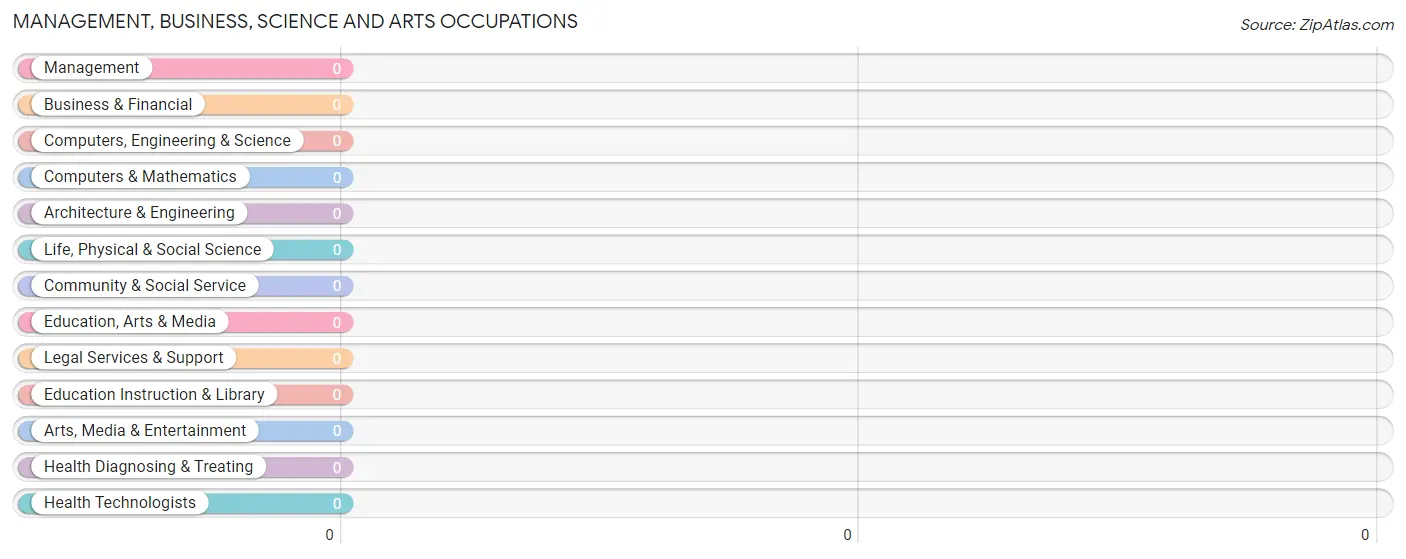
Management, Business, Science and Arts Occupations by Sex
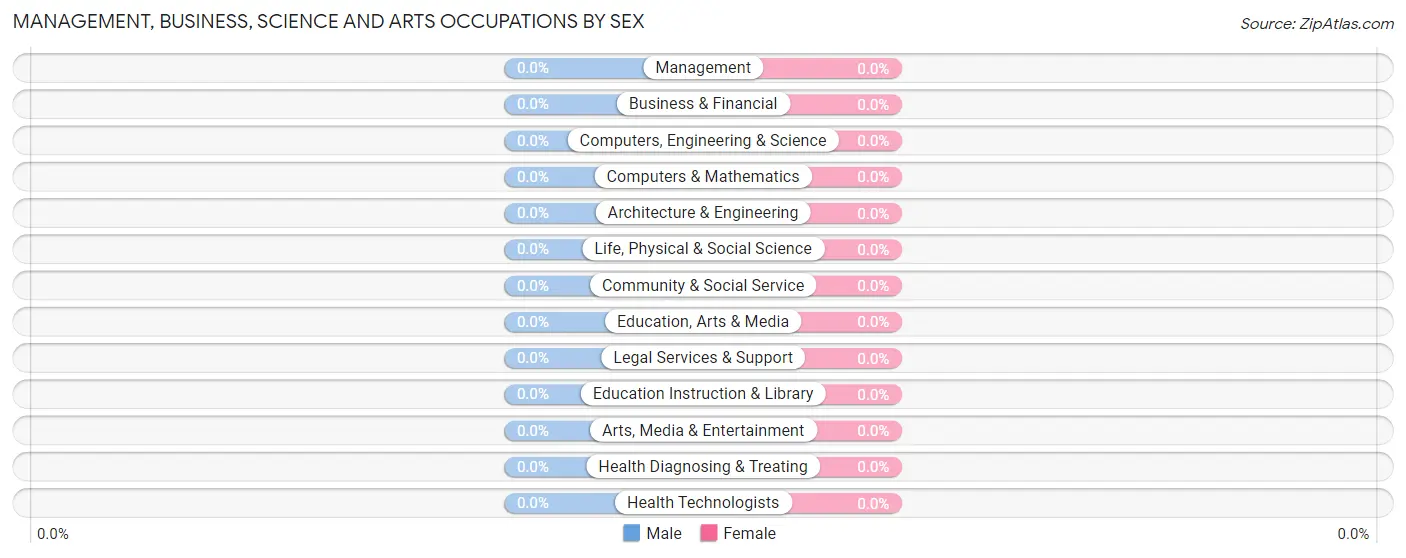
| Occupation | Male | Female |
| Management | 0 (0.0%) | 0 (0.0%) |
| Business & Financial | 0 (0.0%) | 0 (0.0%) |
| Computers, Engineering & Science | 0 (0.0%) | 0 (0.0%) |
| Computers & Mathematics | 0 (0.0%) | 0 (0.0%) |
| Architecture & Engineering | 0 (0.0%) | 0 (0.0%) |
| Life, Physical & Social Science | 0 (0.0%) | 0 (0.0%) |
| Community & Social Service | 0 (0.0%) | 0 (0.0%) |
| Education, Arts & Media | 0 (0.0%) | 0 (0.0%) |
| Legal Services & Support | 0 (0.0%) | 0 (0.0%) |
| Education Instruction & Library | 0 (0.0%) | 0 (0.0%) |
| Arts, Media & Entertainment | 0 (0.0%) | 0 (0.0%) |
| Health Diagnosing & Treating | 0 (0.0%) | 0 (0.0%) |
| Health Technologists | 0 (0.0%) | 0 (0.0%) |
| Total (Category) | 0 (0.0%) | 0 (0.0%) |
| Total (Overall) | 34 (59.7%) | 23 (40.4%) |
Services Occupations
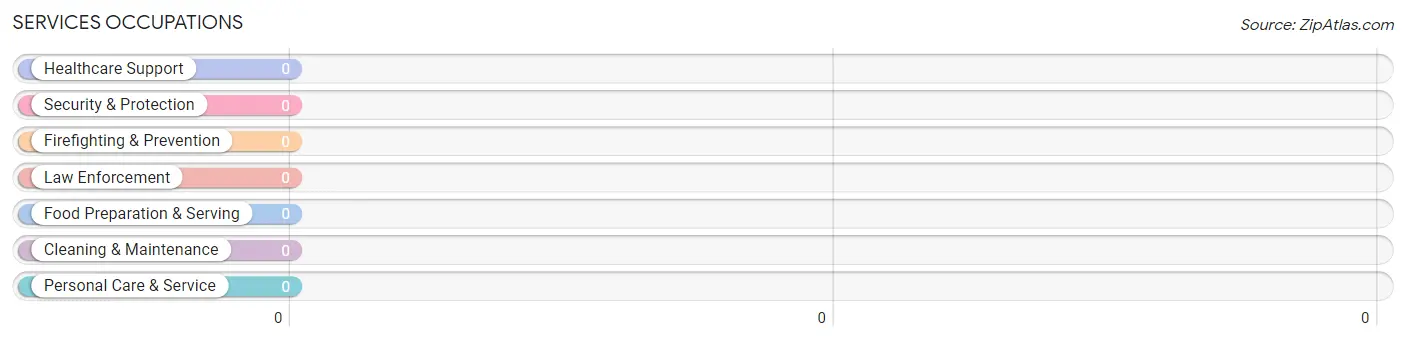
Services Occupations by Sex
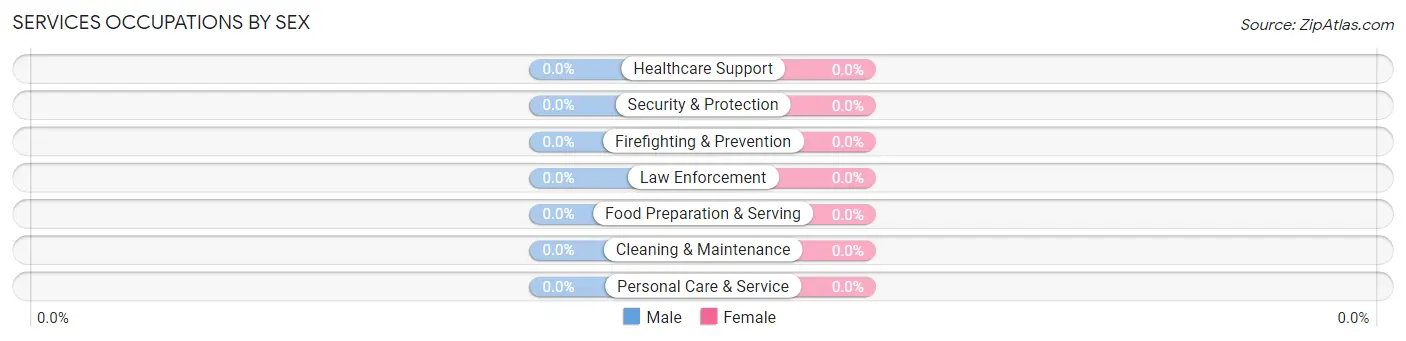
| Occupation | Male | Female |
| Healthcare Support | 0 (0.0%) | 0 (0.0%) |
| Security & Protection | 0 (0.0%) | 0 (0.0%) |
| Firefighting & Prevention | 0 (0.0%) | 0 (0.0%) |
| Law Enforcement | 0 (0.0%) | 0 (0.0%) |
| Food Preparation & Serving | 0 (0.0%) | 0 (0.0%) |
| Cleaning & Maintenance | 0 (0.0%) | 0 (0.0%) |
| Personal Care & Service | 0 (0.0%) | 0 (0.0%) |
| Total (Category) | 0 (0.0%) | 0 (0.0%) |
| Total (Overall) | 34 (59.7%) | 23 (40.4%) |
Sales and Office Occupations
The most common Sales and Office occupations in Barrera are , and Office & Administration (23 | 40.4%).
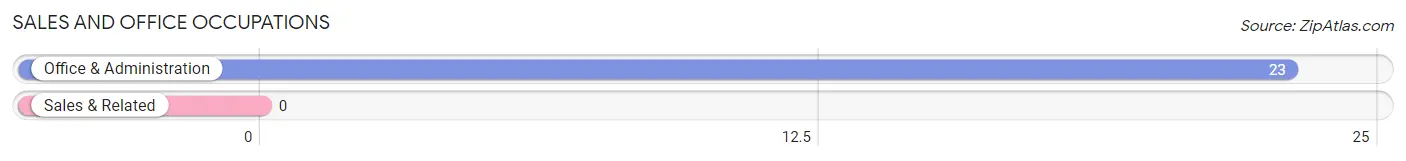
Sales and Office Occupations by Sex
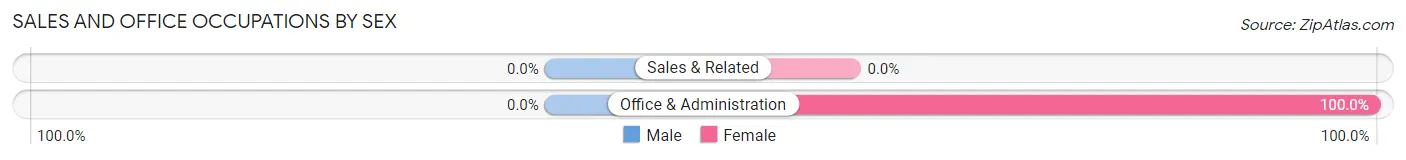
| Occupation | Male | Female |
| Sales & Related | 0 (0.0%) | 0 (0.0%) |
| Office & Administration | 0 (0.0%) | 23 (100.0%) |
| Total (Category) | 0 (0.0%) | 23 (100.0%) |
| Total (Overall) | 34 (59.7%) | 23 (40.4%) |
Natural Resources, Construction and Maintenance Occupations
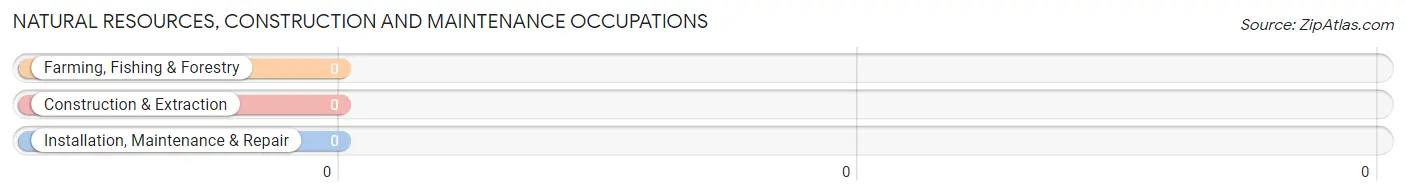
Natural Resources, Construction and Maintenance Occupations by Sex
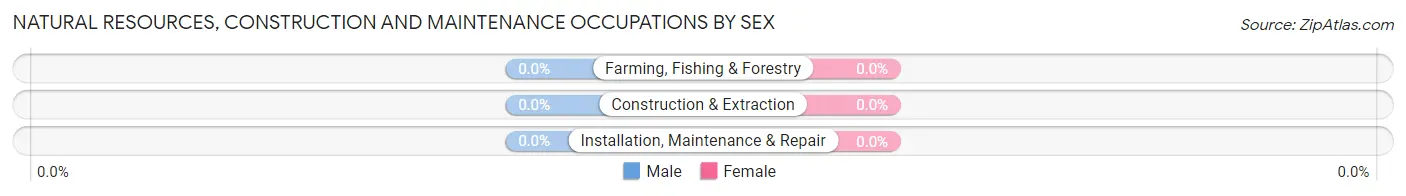
| Occupation | Male | Female |
| Farming, Fishing & Forestry | 0 (0.0%) | 0 (0.0%) |
| Construction & Extraction | 0 (0.0%) | 0 (0.0%) |
| Installation, Maintenance & Repair | 0 (0.0%) | 0 (0.0%) |
| Total (Category) | 0 (0.0%) | 0 (0.0%) |
| Total (Overall) | 34 (59.7%) | 23 (40.4%) |
Production, Transportation and Moving Occupations
The most common Production, Transportation and Moving occupations in Barrera are , and Production (34 | 59.7%).
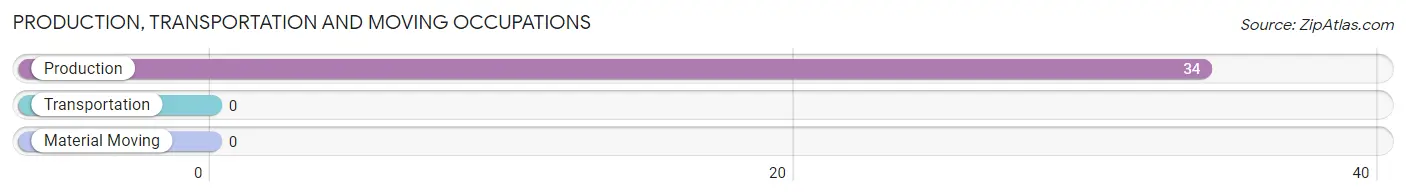
Production, Transportation and Moving Occupations by Sex
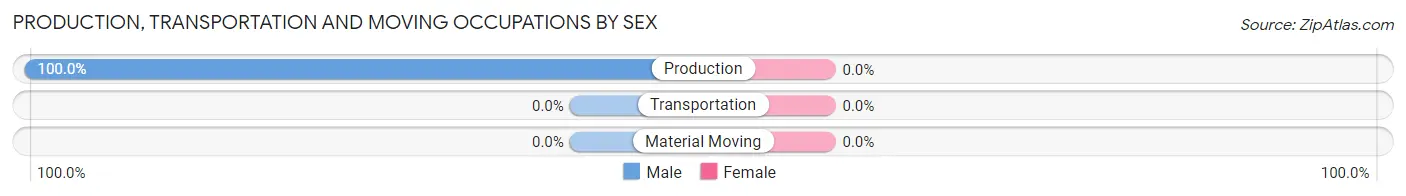
| Occupation | Male | Female |
| Production | 34 (100.0%) | 0 (0.0%) |
| Transportation | 0 (0.0%) | 0 (0.0%) |
| Material Moving | 0 (0.0%) | 0 (0.0%) |
| Total (Category) | 34 (100.0%) | 0 (0.0%) |
| Total (Overall) | 34 (59.7%) | 23 (40.4%) |
Employment Industries by Sex in Barrera
Employment Industries in Barrera
The major employment industries in Barrera include , and Health Care & Social Assistance (23 | 40.4%).
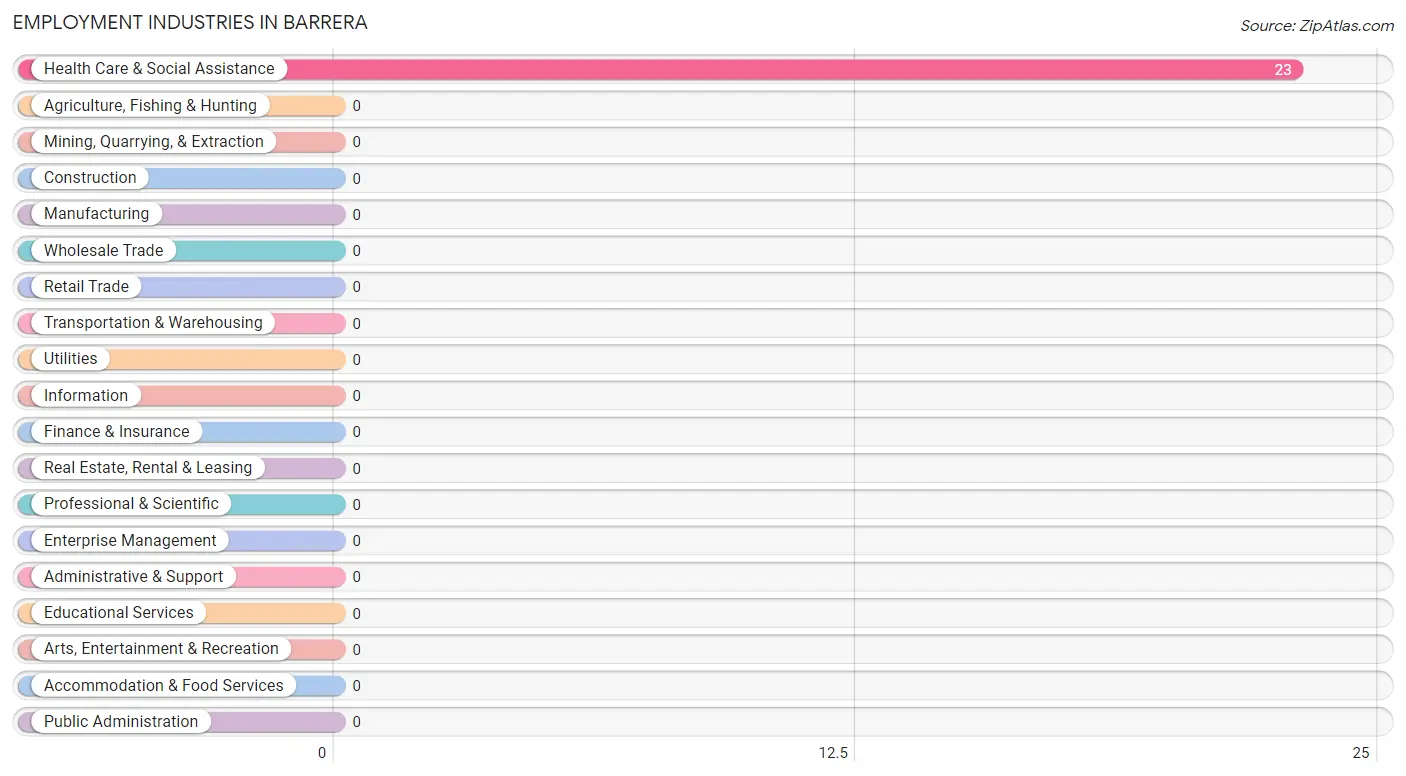
Employment Industries by Sex in Barrera
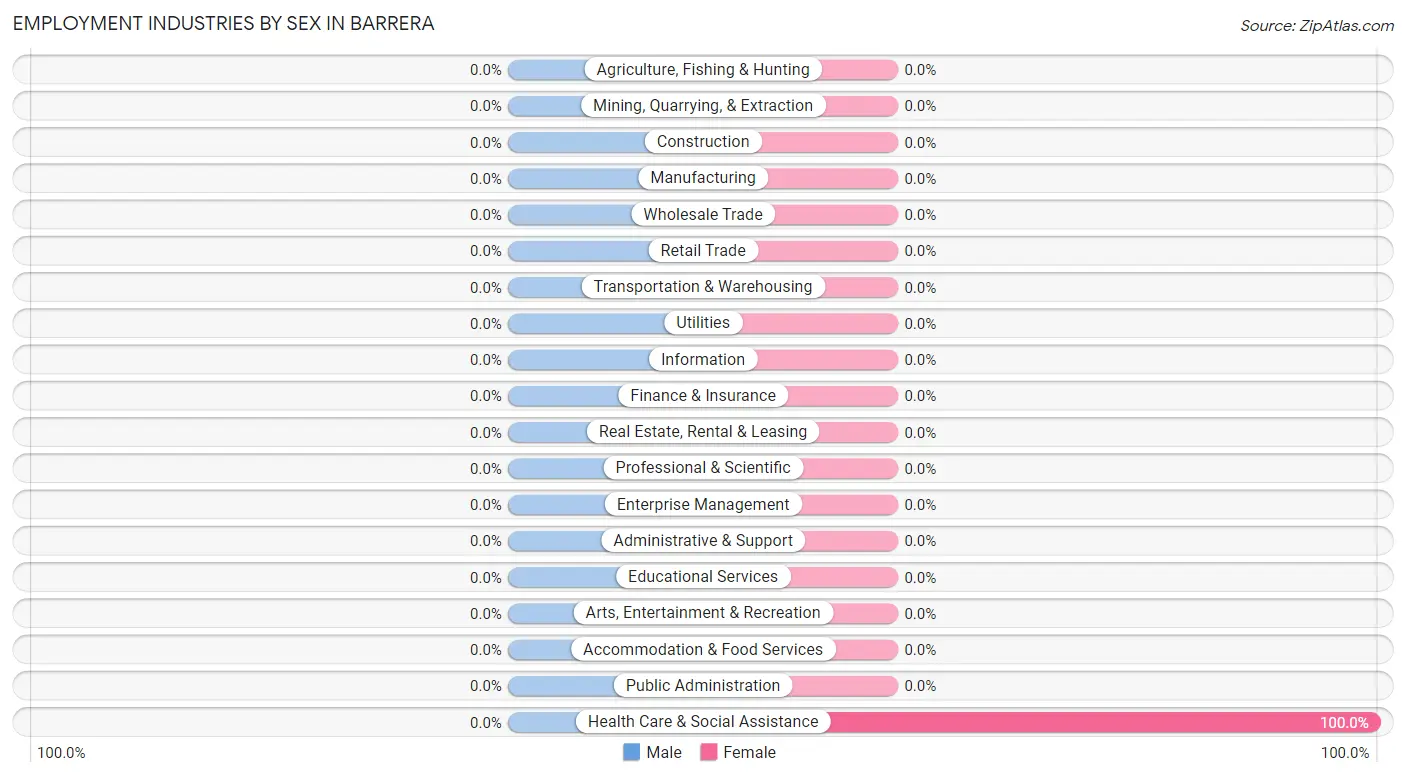
| Industry | Male | Female |
| Agriculture, Fishing & Hunting | 0 (0.0%) | 0 (0.0%) |
| Mining, Quarrying, & Extraction | 0 (0.0%) | 0 (0.0%) |
| Construction | 0 (0.0%) | 0 (0.0%) |
| Manufacturing | 0 (0.0%) | 0 (0.0%) |
| Wholesale Trade | 0 (0.0%) | 0 (0.0%) |
| Retail Trade | 0 (0.0%) | 0 (0.0%) |
| Transportation & Warehousing | 0 (0.0%) | 0 (0.0%) |
| Utilities | 0 (0.0%) | 0 (0.0%) |
| Information | 0 (0.0%) | 0 (0.0%) |
| Finance & Insurance | 0 (0.0%) | 0 (0.0%) |
| Real Estate, Rental & Leasing | 0 (0.0%) | 0 (0.0%) |
| Professional & Scientific | 0 (0.0%) | 0 (0.0%) |
| Enterprise Management | 0 (0.0%) | 0 (0.0%) |
| Administrative & Support | 0 (0.0%) | 0 (0.0%) |
| Educational Services | 0 (0.0%) | 0 (0.0%) |
| Health Care & Social Assistance | 0 (0.0%) | 23 (100.0%) |
| Arts, Entertainment & Recreation | 0 (0.0%) | 0 (0.0%) |
| Accommodation & Food Services | 0 (0.0%) | 0 (0.0%) |
| Public Administration | 0 (0.0%) | 0 (0.0%) |
| Total | 34 (59.7%) | 23 (40.4%) |
Education in Barrera
School Enrollment in Barrera
The most common levels of schooling among the 48 students in Barrera are elementary school (24 | 50.0%), and middle school (24 | 50.0%).
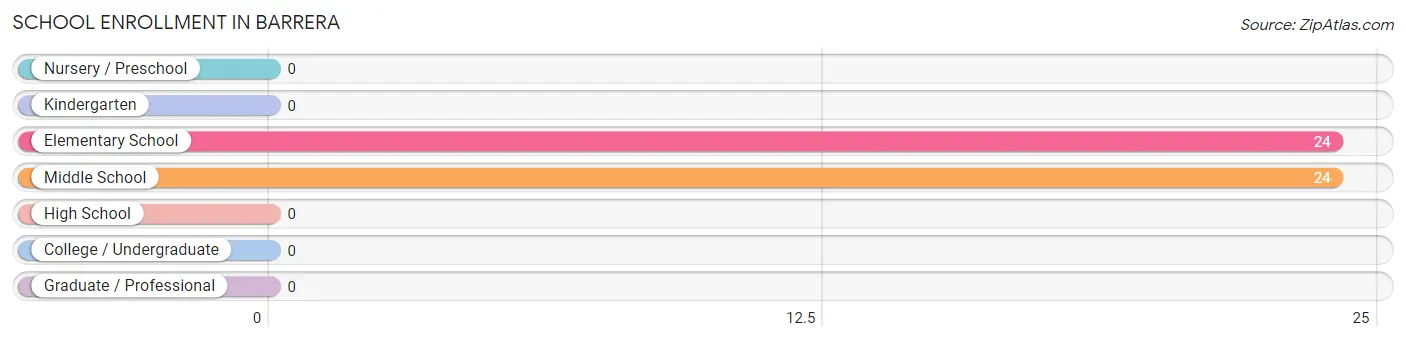
| School Level | # Students | % Students |
| Nursery / Preschool | 0 | 0.0% |
| Kindergarten | 0 | 0.0% |
| Elementary School | 24 | 50.0% |
| Middle School | 24 | 50.0% |
| High School | 0 | 0.0% |
| College / Undergraduate | 0 | 0.0% |
| Graduate / Professional | 0 | 0.0% |
| Total | 48 | 100.0% |
School Enrollment by Age by Funding Source in Barrera
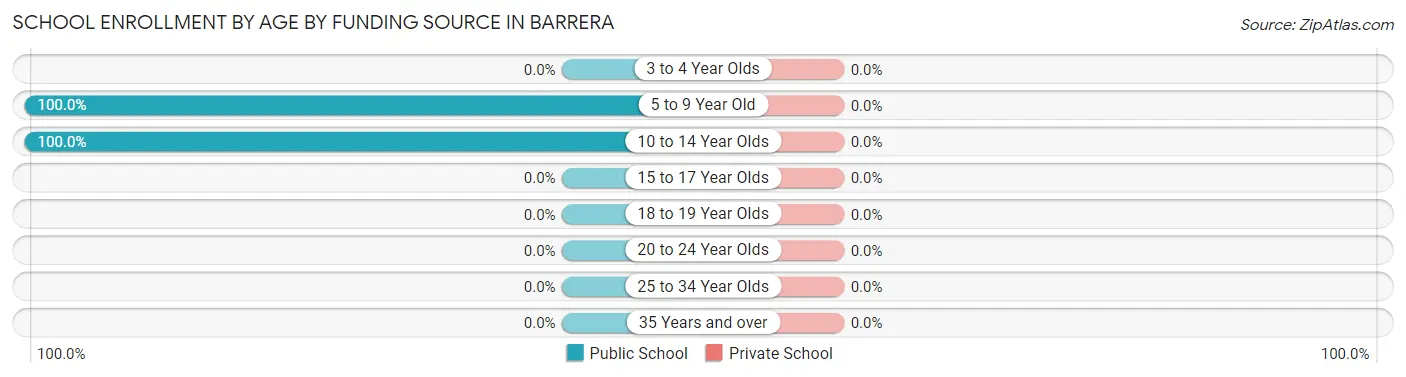
| Age Bracket | Public School | Private School |
| 3 to 4 Year Olds | 0 (0.0%) | 0 (0.0%) |
| 5 to 9 Year Old | 24 (100.0%) | 0 (0.0%) |
| 10 to 14 Year Olds | 24 (100.0%) | 0 (0.0%) |
| 15 to 17 Year Olds | 0 (0.0%) | 0 (0.0%) |
| 18 to 19 Year Olds | 0 (0.0%) | 0 (0.0%) |
| 20 to 24 Year Olds | 0 (0.0%) | 0 (0.0%) |
| 25 to 34 Year Olds | 0 (0.0%) | 0 (0.0%) |
| 35 Years and over | 0 (0.0%) | 0 (0.0%) |
| Total | 48 (100.0%) | 0 (0.0%) |
Educational Attainment by Field of Study in Barrera
| Field of Study | # Graduates | % Graduates |
| Computers & Mathematics | 0 | 0.0% |
| Bio, Nature & Agricultural | 0 | 0.0% |
| Physical & Health Sciences | 0 | 0.0% |
| Psychology | 0 | 0.0% |
| Social Sciences | 0 | 0.0% |
| Engineering | 0 | 0.0% |
| Multidisciplinary Studies | 0 | 0.0% |
| Science & Technology | 0 | 0.0% |
| Business | 0 | 0.0% |
| Education | 0 | 0.0% |
| Literature & Languages | 0 | 0.0% |
| Liberal Arts & History | 0 | 0.0% |
| Visual & Performing Arts | 0 | 0.0% |
| Communications | 0 | 0.0% |
| Arts & Humanities | 0 | 0.0% |
| Total | 0 | 0.0% |
Transportation & Commute in Barrera
Vehicle Availability by Sex in Barrera
The most prevalent vehicle ownership categories in Barrera are males with 1 vehicle (34, accounting for 100.0%) and females with 1 vehicle (23, making up 147.8%).
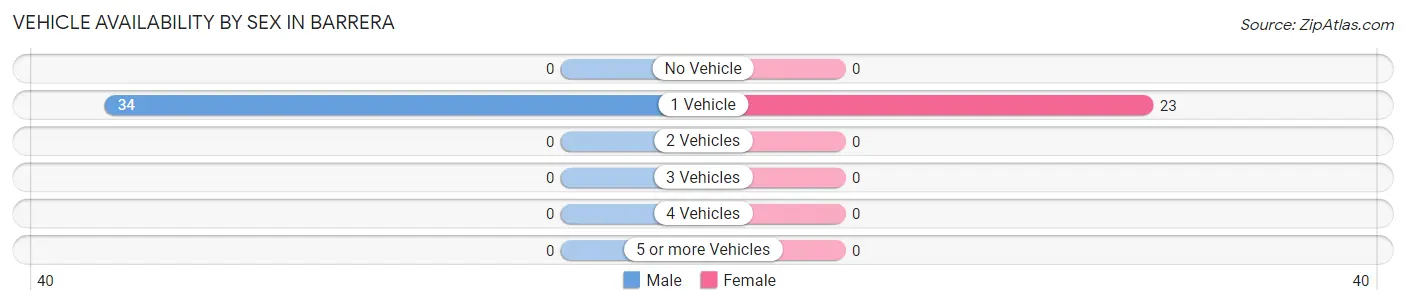
| Vehicles Available | Male | Female |
| No Vehicle | 0 (0.0%) | 0 (0.0%) |
| 1 Vehicle | 34 (100.0%) | 23 (100.0%) |
| 2 Vehicles | 0 (0.0%) | 0 (0.0%) |
| 3 Vehicles | 0 (0.0%) | 0 (0.0%) |
| 4 Vehicles | 0 (0.0%) | 0 (0.0%) |
| 5 or more Vehicles | 0 (0.0%) | 0 (0.0%) |
| Total | 34 (100.0%) | 23 (100.0%) |
Commute Time in Barrera
The most frequently occuring commute durations in Barrera are 15 to 19 minutes (57 commuters, 100.0%), less than 5 minutes (0 commuters, 0.0%), and 5 to 9 minutes (0 commuters, 0.0%).
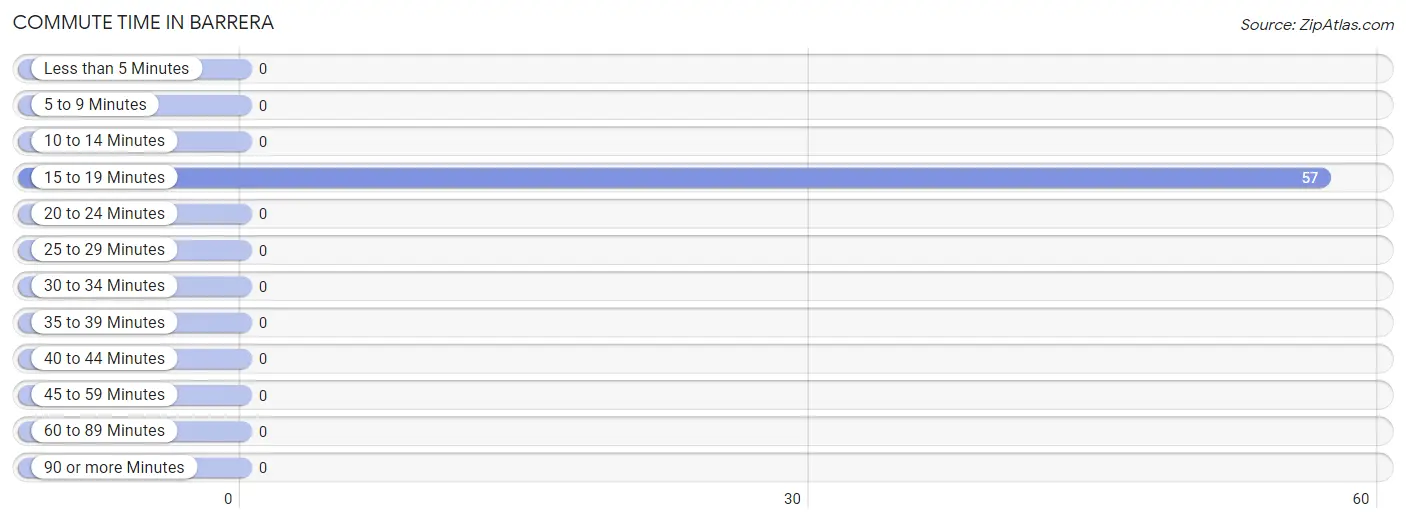
| Commute Time | # Commuters | % Commuters |
| Less than 5 Minutes | 0 | 0.0% |
| 5 to 9 Minutes | 0 | 0.0% |
| 10 to 14 Minutes | 0 | 0.0% |
| 15 to 19 Minutes | 57 | 100.0% |
| 20 to 24 Minutes | 0 | 0.0% |
| 25 to 29 Minutes | 0 | 0.0% |
| 30 to 34 Minutes | 0 | 0.0% |
| 35 to 39 Minutes | 0 | 0.0% |
| 40 to 44 Minutes | 0 | 0.0% |
| 45 to 59 Minutes | 0 | 0.0% |
| 60 to 89 Minutes | 0 | 0.0% |
| 90 or more Minutes | 0 | 0.0% |
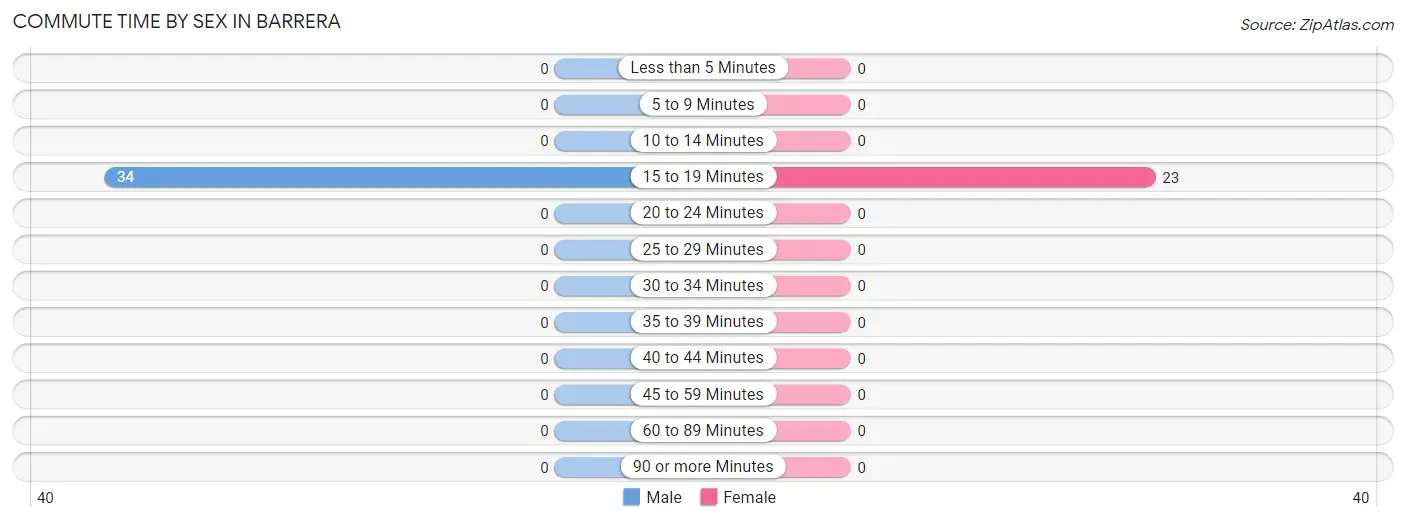
Commute Time by Sex in Barrera
The most common commute times in Barrera are 15 to 19 minutes (34 commuters, 100.0%) for males and 15 to 19 minutes (23 commuters, 100.0%) for females.
| Commute Time | Male | Female |
| Less than 5 Minutes | 0 (0.0%) | 0 (0.0%) |
| 5 to 9 Minutes | 0 (0.0%) | 0 (0.0%) |
| 10 to 14 Minutes | 0 (0.0%) | 0 (0.0%) |
| 15 to 19 Minutes | 34 (100.0%) | 23 (100.0%) |
| 20 to 24 Minutes | 0 (0.0%) | 0 (0.0%) |
| 25 to 29 Minutes | 0 (0.0%) | 0 (0.0%) |
| 30 to 34 Minutes | 0 (0.0%) | 0 (0.0%) |
| 35 to 39 Minutes | 0 (0.0%) | 0 (0.0%) |
| 40 to 44 Minutes | 0 (0.0%) | 0 (0.0%) |
| 45 to 59 Minutes | 0 (0.0%) | 0 (0.0%) |
| 60 to 89 Minutes | 0 (0.0%) | 0 (0.0%) |
| 90 or more Minutes | 0 (0.0%) | 0 (0.0%) |
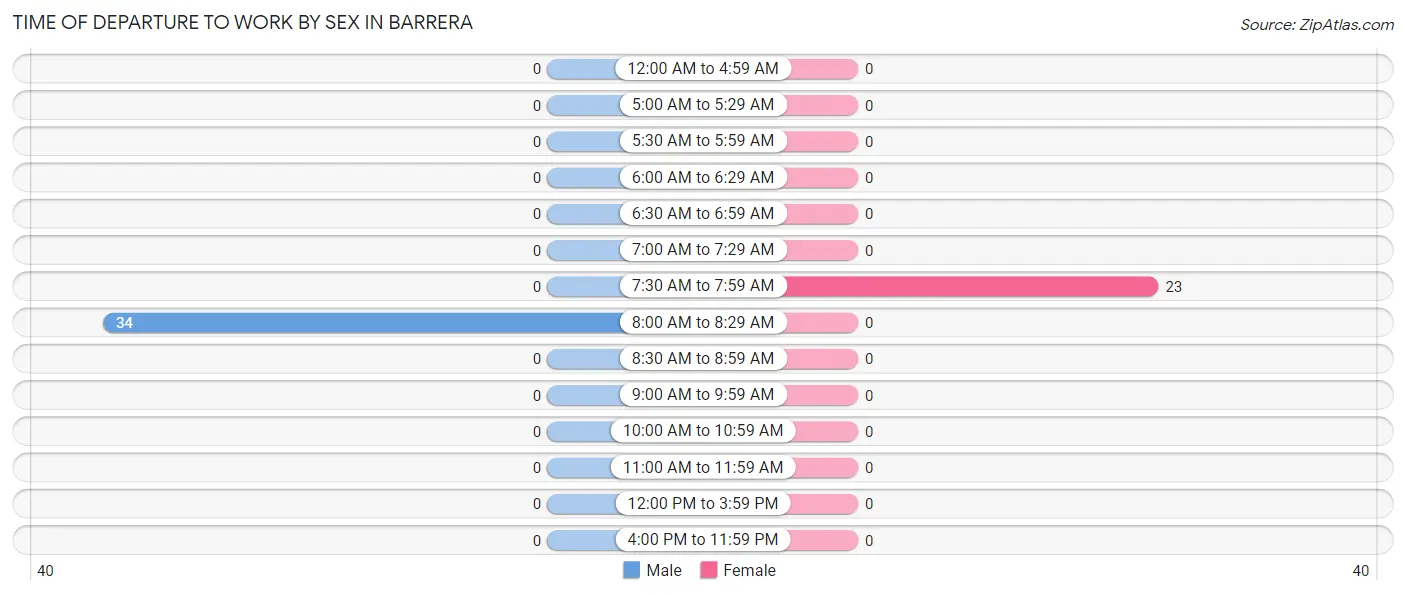
Time of Departure to Work by Sex in Barrera
The most frequent times of departure to work in Barrera are 8:00 AM to 8:29 AM (34, 100.0%) for males and 7:30 AM to 7:59 AM (23, 100.0%) for females.
| Time of Departure | Male | Female |
| 12:00 AM to 4:59 AM | 0 (0.0%) | 0 (0.0%) |
| 5:00 AM to 5:29 AM | 0 (0.0%) | 0 (0.0%) |
| 5:30 AM to 5:59 AM | 0 (0.0%) | 0 (0.0%) |
| 6:00 AM to 6:29 AM | 0 (0.0%) | 0 (0.0%) |
| 6:30 AM to 6:59 AM | 0 (0.0%) | 0 (0.0%) |
| 7:00 AM to 7:29 AM | 0 (0.0%) | 0 (0.0%) |
| 7:30 AM to 7:59 AM | 0 (0.0%) | 23 (100.0%) |
| 8:00 AM to 8:29 AM | 34 (100.0%) | 0 (0.0%) |
| 8:30 AM to 8:59 AM | 0 (0.0%) | 0 (0.0%) |
| 9:00 AM to 9:59 AM | 0 (0.0%) | 0 (0.0%) |
| 10:00 AM to 10:59 AM | 0 (0.0%) | 0 (0.0%) |
| 11:00 AM to 11:59 AM | 0 (0.0%) | 0 (0.0%) |
| 12:00 PM to 3:59 PM | 0 (0.0%) | 0 (0.0%) |
| 4:00 PM to 11:59 PM | 0 (0.0%) | 0 (0.0%) |
| Total | 34 (100.0%) | 23 (100.0%) |
Housing Occupancy in Barrera
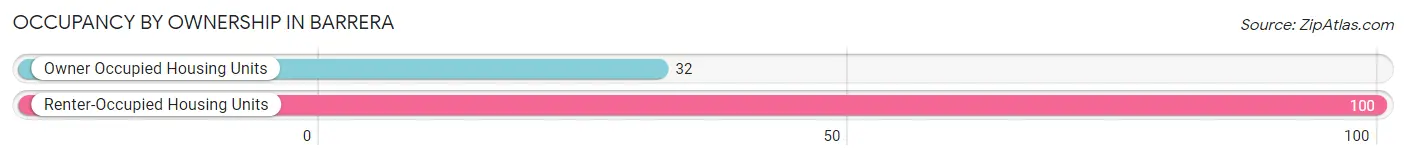
Occupancy by Ownership in Barrera
Of the total 132 dwellings in Barrera, owner-occupied units account for 32 (24.2%), while renter-occupied units make up 100 (75.8%).
| Occupancy | # Housing Units | % Housing Units |
| Owner Occupied Housing Units | 32 | 24.2% |
| Renter-Occupied Housing Units | 100 | 75.8% |
| Total Occupied Housing Units | 132 | 100.0% |
Occupancy by Household Size in Barrera
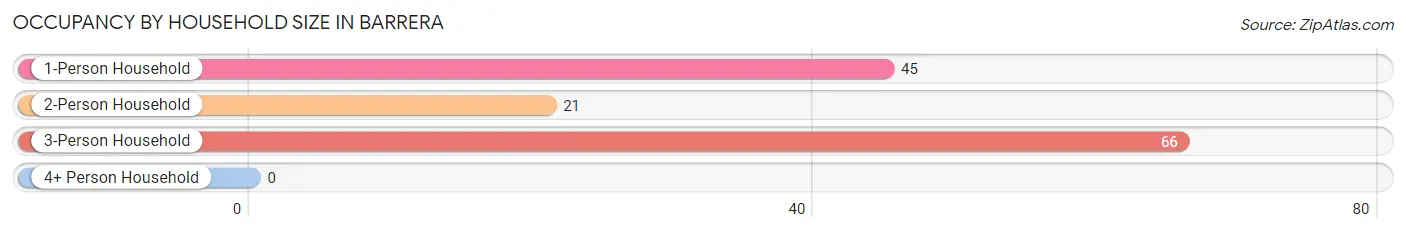
| Household Size | # Housing Units | % Housing Units |
| 1-Person Household | 45 | 34.1% |
| 2-Person Household | 21 | 15.9% |
| 3-Person Household | 66 | 50.0% |
| 4+ Person Household | 0 | 0.0% |
| Total Housing Units | 132 | 100.0% |
Occupancy by Ownership by Household Size in Barrera
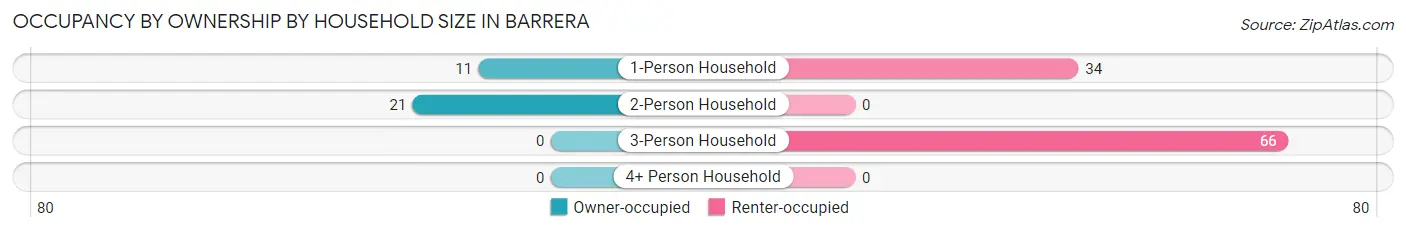
| Household Size | Owner-occupied | Renter-occupied |
| 1-Person Household | 11 (24.4%) | 34 (75.6%) |
| 2-Person Household | 21 (100.0%) | 0 (0.0%) |
| 3-Person Household | 0 (0.0%) | 66 (100.0%) |
| 4+ Person Household | 0 (0.0%) | 0 (0.0%) |
| Total Housing Units | 32 (24.2%) | 100 (75.8%) |
Occupancy by Educational Attainment in Barrera
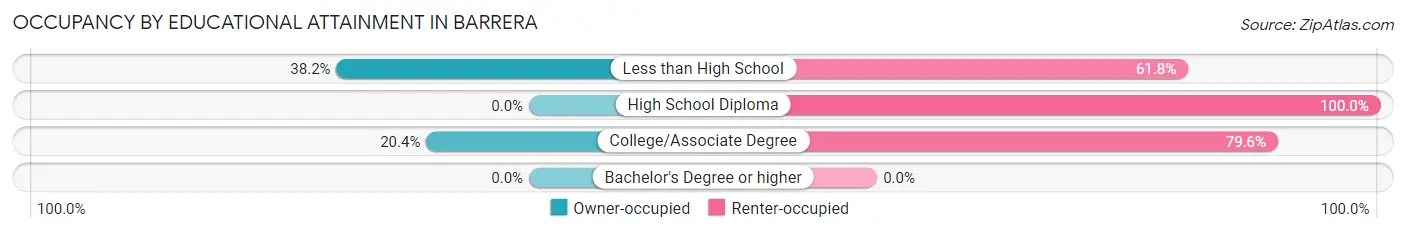
| Household Size | Owner-occupied | Renter-occupied |
| Less than High School | 21 (38.2%) | 34 (61.8%) |
| High School Diploma | 0 (0.0%) | 23 (100.0%) |
| College/Associate Degree | 11 (20.4%) | 43 (79.6%) |
| Bachelor's Degree or higher | 0 (0.0%) | 0 (0.0%) |
Occupancy by Age of Householder in Barrera
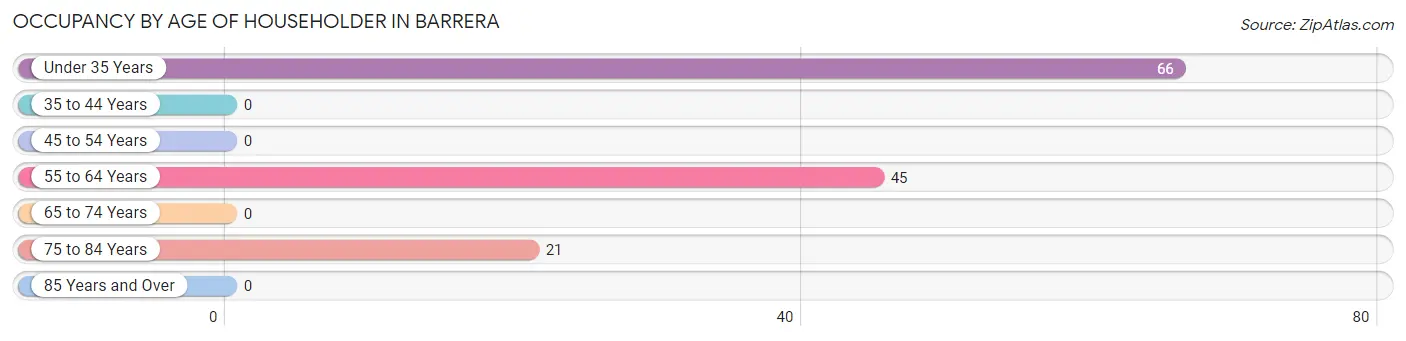
| Age Bracket | # Households | % Households |
| Under 35 Years | 66 | 50.0% |
| 35 to 44 Years | 0 | 0.0% |
| 45 to 54 Years | 0 | 0.0% |
| 55 to 64 Years | 45 | 34.1% |
| 65 to 74 Years | 0 | 0.0% |
| 75 to 84 Years | 21 | 15.9% |
| 85 Years and Over | 0 | 0.0% |
| Total | 132 | 100.0% |
Housing Finances in Barrera
Median Income by Occupancy in Barrera
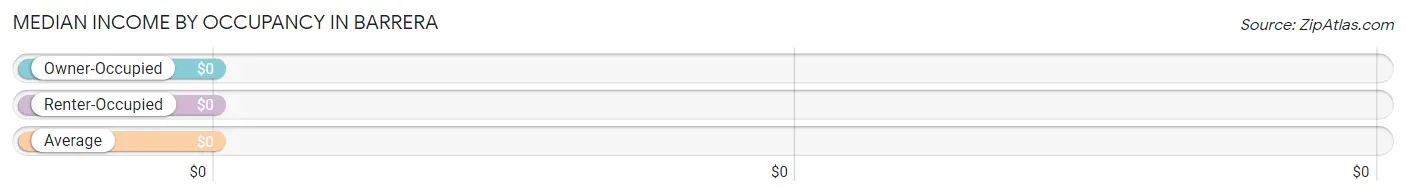
| Occupancy Type | # Households | Median Income |
| Owner-Occupied | 32 (24.2%) | $0 |
| Renter-Occupied | 100 (75.8%) | $0 |
| Average | 132 (100.0%) | $0 |
Occupancy by Householder Income Bracket in Barrera
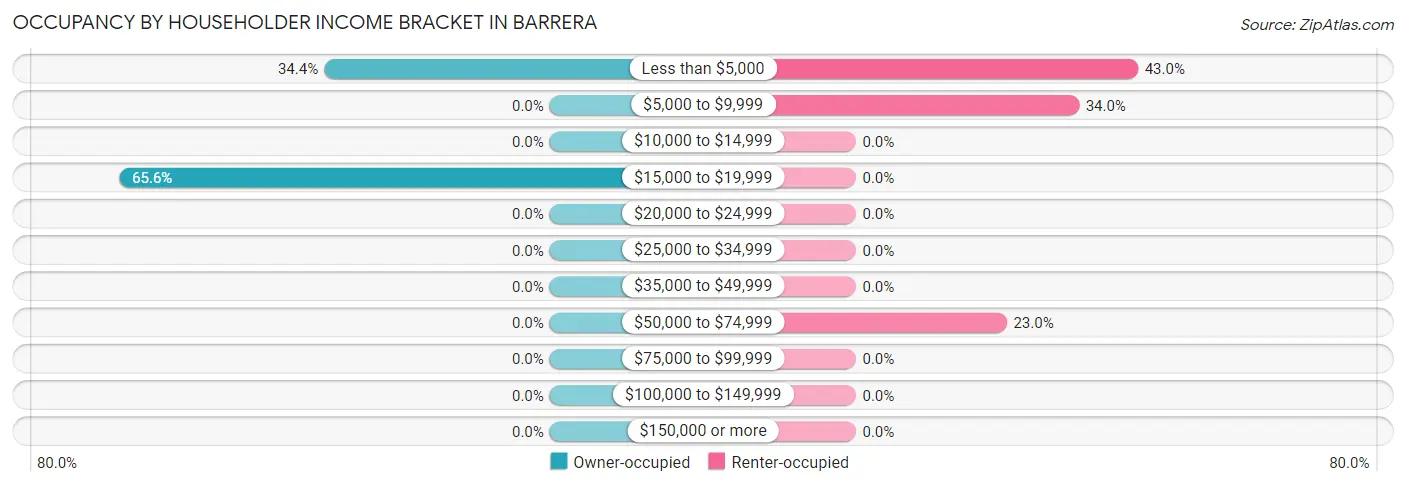
| Income Bracket | Owner-occupied | Renter-occupied |
| Less than $5,000 | 11 (34.4%) | 43 (43.0%) |
| $5,000 to $9,999 | 0 (0.0%) | 34 (34.0%) |
| $10,000 to $14,999 | 0 (0.0%) | 0 (0.0%) |
| $15,000 to $19,999 | 21 (65.6%) | 0 (0.0%) |
| $20,000 to $24,999 | 0 (0.0%) | 0 (0.0%) |
| $25,000 to $34,999 | 0 (0.0%) | 0 (0.0%) |
| $35,000 to $49,999 | 0 (0.0%) | 0 (0.0%) |
| $50,000 to $74,999 | 0 (0.0%) | 23 (23.0%) |
| $75,000 to $99,999 | 0 (0.0%) | 0 (0.0%) |
| $100,000 to $149,999 | 0 (0.0%) | 0 (0.0%) |
| $150,000 or more | 0 (0.0%) | 0 (0.0%) |
| Total | 32 (100.0%) | 100 (100.0%) |
Monthly Housing Cost Tiers in Barrera
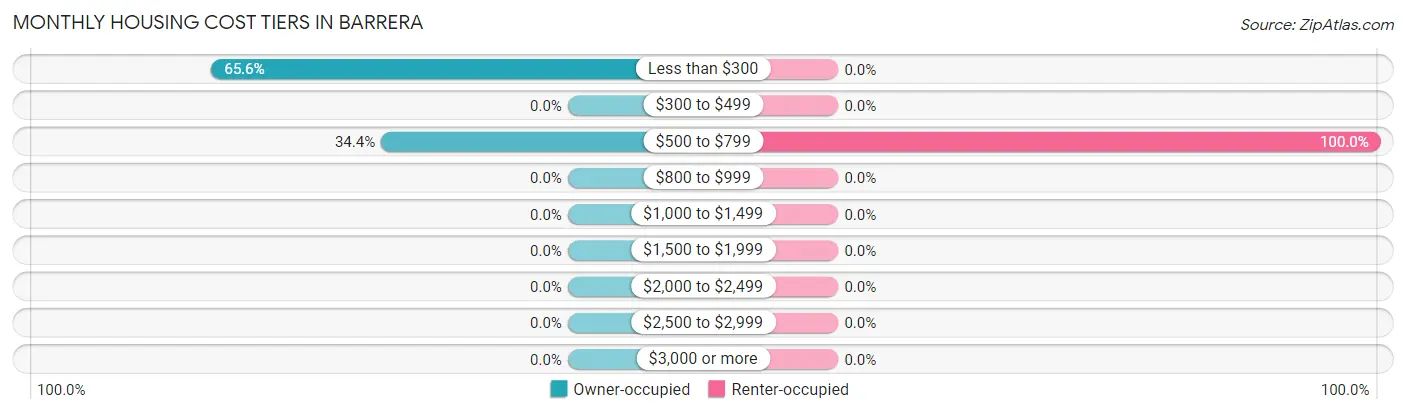
| Monthly Cost | Owner-occupied | Renter-occupied |
| Less than $300 | 21 (65.6%) | 0 (0.0%) |
| $300 to $499 | 0 (0.0%) | 0 (0.0%) |
| $500 to $799 | 11 (34.4%) | 100 (100.0%) |
| $800 to $999 | 0 (0.0%) | 0 (0.0%) |
| $1,000 to $1,499 | 0 (0.0%) | 0 (0.0%) |
| $1,500 to $1,999 | 0 (0.0%) | 0 (0.0%) |
| $2,000 to $2,499 | 0 (0.0%) | 0 (0.0%) |
| $2,500 to $2,999 | 0 (0.0%) | 0 (0.0%) |
| $3,000 or more | 0 (0.0%) | 0 (0.0%) |
| Total | 32 (100.0%) | 100 (100.0%) |
Physical Housing Characteristics in Barrera
Housing Structures in Barrera
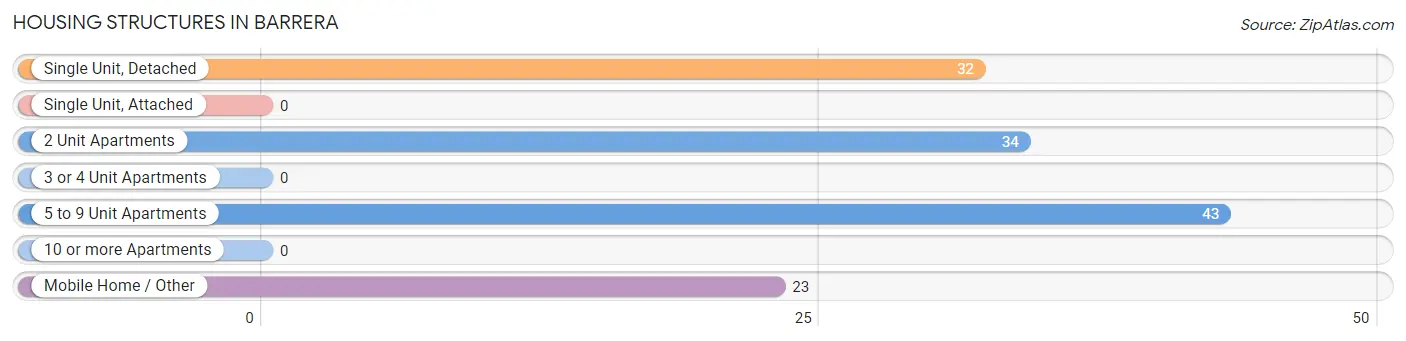
| Structure Type | # Housing Units | % Housing Units |
| Single Unit, Detached | 32 | 24.2% |
| Single Unit, Attached | 0 | 0.0% |
| 2 Unit Apartments | 34 | 25.8% |
| 3 or 4 Unit Apartments | 0 | 0.0% |
| 5 to 9 Unit Apartments | 43 | 32.6% |
| 10 or more Apartments | 0 | 0.0% |
| Mobile Home / Other | 23 | 17.4% |
| Total | 132 | 100.0% |
Housing Structures by Occupancy in Barrera
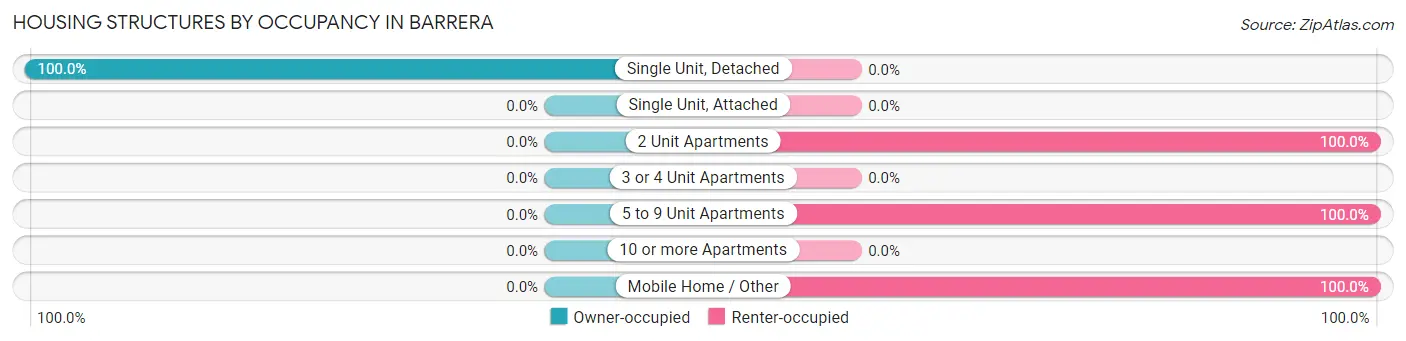
| Structure Type | Owner-occupied | Renter-occupied |
| Single Unit, Detached | 32 (100.0%) | 0 (0.0%) |
| Single Unit, Attached | 0 (0.0%) | 0 (0.0%) |
| 2 Unit Apartments | 0 (0.0%) | 34 (100.0%) |
| 3 or 4 Unit Apartments | 0 (0.0%) | 0 (0.0%) |
| 5 to 9 Unit Apartments | 0 (0.0%) | 43 (100.0%) |
| 10 or more Apartments | 0 (0.0%) | 0 (0.0%) |
| Mobile Home / Other | 0 (0.0%) | 23 (100.0%) |
| Total | 32 (24.2%) | 100 (75.8%) |
Housing Structures by Number of Rooms in Barrera
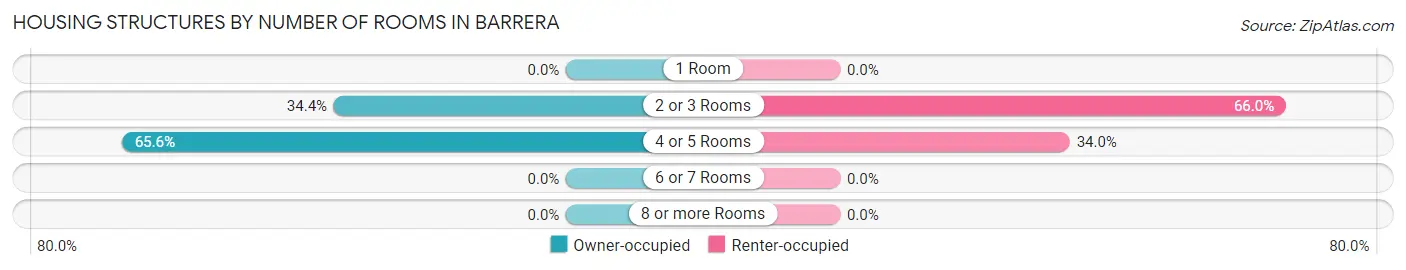
| Number of Rooms | Owner-occupied | Renter-occupied |
| 1 Room | 0 (0.0%) | 0 (0.0%) |
| 2 or 3 Rooms | 11 (34.4%) | 66 (66.0%) |
| 4 or 5 Rooms | 21 (65.6%) | 34 (34.0%) |
| 6 or 7 Rooms | 0 (0.0%) | 0 (0.0%) |
| 8 or more Rooms | 0 (0.0%) | 0 (0.0%) |
| Total | 32 (100.0%) | 100 (100.0%) |
Housing Structure by Heating Type in Barrera
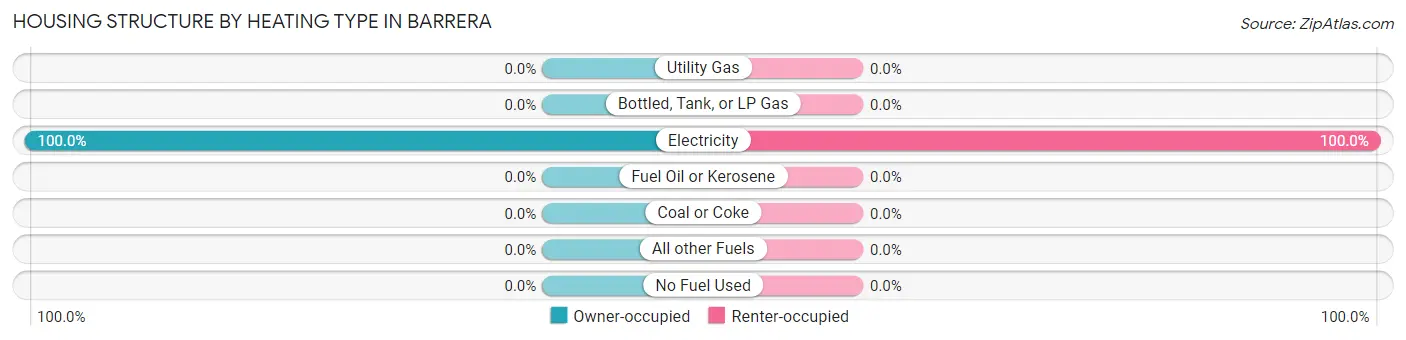
| Heating Type | Owner-occupied | Renter-occupied |
| Utility Gas | 0 (0.0%) | 0 (0.0%) |
| Bottled, Tank, or LP Gas | 0 (0.0%) | 0 (0.0%) |
| Electricity | 32 (100.0%) | 100 (100.0%) |
| Fuel Oil or Kerosene | 0 (0.0%) | 0 (0.0%) |
| Coal or Coke | 0 (0.0%) | 0 (0.0%) |
| All other Fuels | 0 (0.0%) | 0 (0.0%) |
| No Fuel Used | 0 (0.0%) | 0 (0.0%) |
| Total | 32 (100.0%) | 100 (100.0%) |
Household Vehicle Usage in Barrera
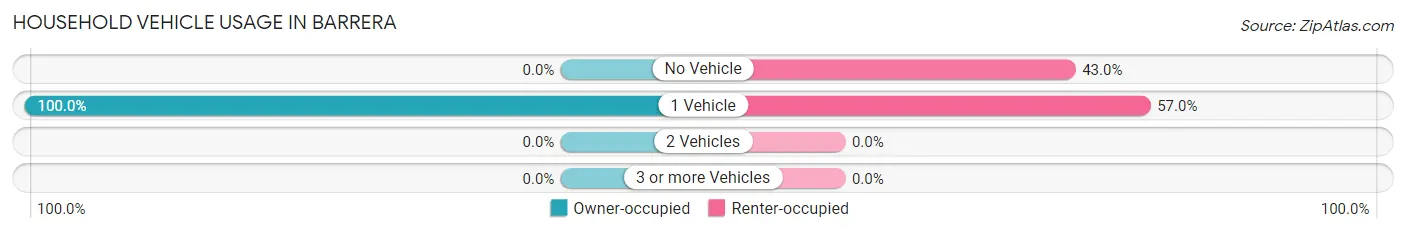
| Vehicles per Household | Owner-occupied | Renter-occupied |
| No Vehicle | 0 (0.0%) | 43 (43.0%) |
| 1 Vehicle | 32 (100.0%) | 57 (57.0%) |
| 2 Vehicles | 0 (0.0%) | 0 (0.0%) |
| 3 or more Vehicles | 0 (0.0%) | 0 (0.0%) |
| Total | 32 (100.0%) | 100 (100.0%) |
Real Estate & Mortgages in Barrera
Real Estate and Mortgage Overview in Barrera
| Characteristic | Without Mortgage | With Mortgage |
| Housing Units | 32 | 0 |
| Median Property Value | - | - |
| Median Household Income | - | - |
| Monthly Housing Costs | - | - |
| Real Estate Taxes | - | - |
Property Value by Mortgage Status in Barrera
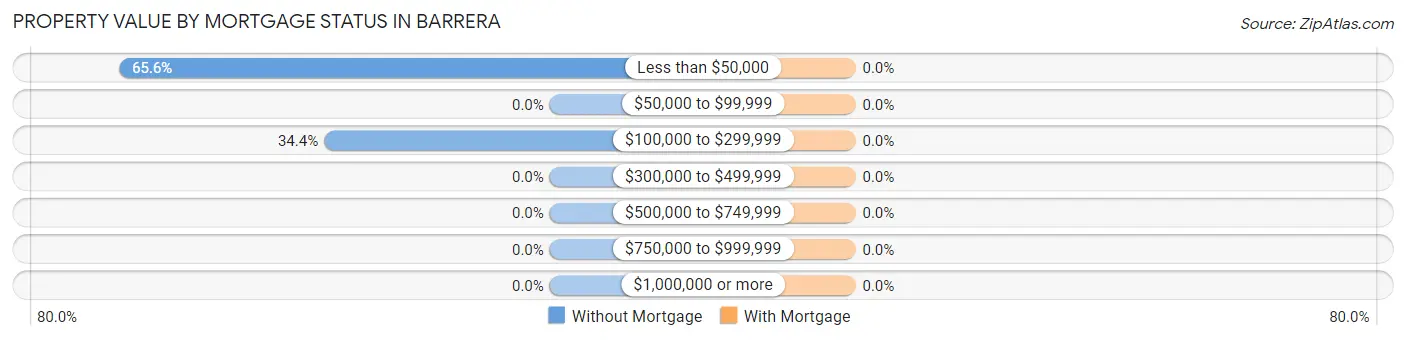
| Property Value | Without Mortgage | With Mortgage |
| Less than $50,000 | 21 (65.6%) | 0 (0.0%) |
| $50,000 to $99,999 | 0 (0.0%) | 0 (0.0%) |
| $100,000 to $299,999 | 11 (34.4%) | 0 (0.0%) |
| $300,000 to $499,999 | 0 (0.0%) | 0 (0.0%) |
| $500,000 to $749,999 | 0 (0.0%) | 0 (0.0%) |
| $750,000 to $999,999 | 0 (0.0%) | 0 (0.0%) |
| $1,000,000 or more | 0 (0.0%) | 0 (0.0%) |
| Total | 32 (100.0%) | 0 (0.0%) |
Household Income by Mortgage Status in Barrera
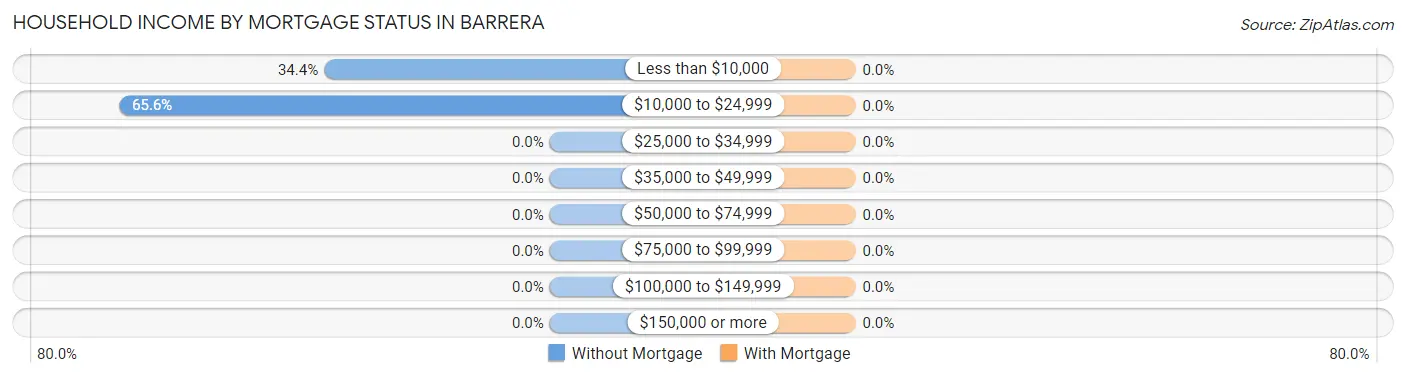
| Household Income | Without Mortgage | With Mortgage |
| Less than $10,000 | 11 (34.4%) | 0 (0.0%) |
| $10,000 to $24,999 | 21 (65.6%) | 0 (0.0%) |
| $25,000 to $34,999 | 0 (0.0%) | 0 (0.0%) |
| $35,000 to $49,999 | 0 (0.0%) | 0 (0.0%) |
| $50,000 to $74,999 | 0 (0.0%) | 0 (0.0%) |
| $75,000 to $99,999 | 0 (0.0%) | 0 (0.0%) |
| $100,000 to $149,999 | 0 (0.0%) | 0 (0.0%) |
| $150,000 or more | 0 (0.0%) | 0 (0.0%) |
| Total | 32 (100.0%) | 0 (0.0%) |
Property Value to Household Income Ratio in Barrera
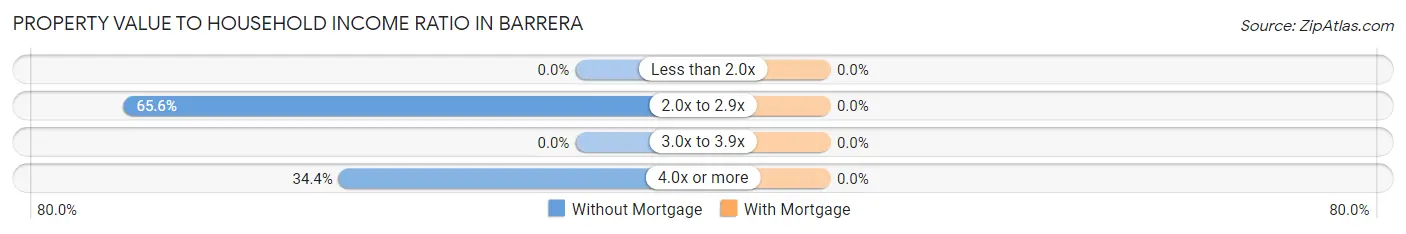
| Value-to-Income Ratio | Without Mortgage | With Mortgage |
| Less than 2.0x | 0 (0.0%) | 0 (0.0%) |
| 2.0x to 2.9x | 21 (65.6%) | 0 (0.0%) |
| 3.0x to 3.9x | 0 (0.0%) | 0 (0.0%) |
| 4.0x or more | 11 (34.4%) | 0 (0.0%) |
| Total | 32 (100.0%) | 0 (0.0%) |
Real Estate Taxes by Mortgage Status in Barrera
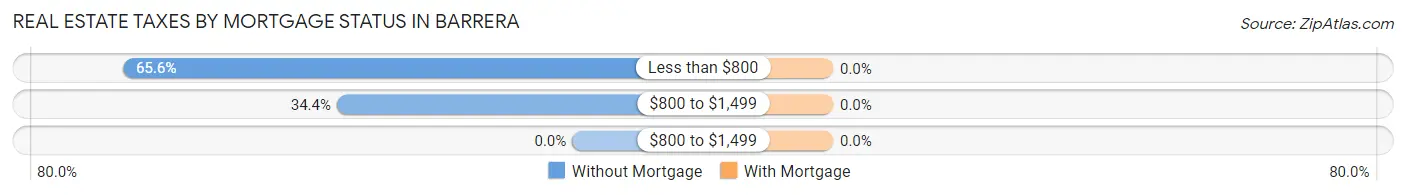
| Property Taxes | Without Mortgage | With Mortgage |
| Less than $800 | 21 (65.6%) | 0 (0.0%) |
| $800 to $1,499 | 11 (34.4%) | 0 (0.0%) |
| $800 to $1,499 | 0 (0.0%) | 0 (0.0%) |
| Total | 32 (100.0%) | 0 (0.0%) |
Health & Disability in Barrera
Health Insurance Coverage by Age in Barrera
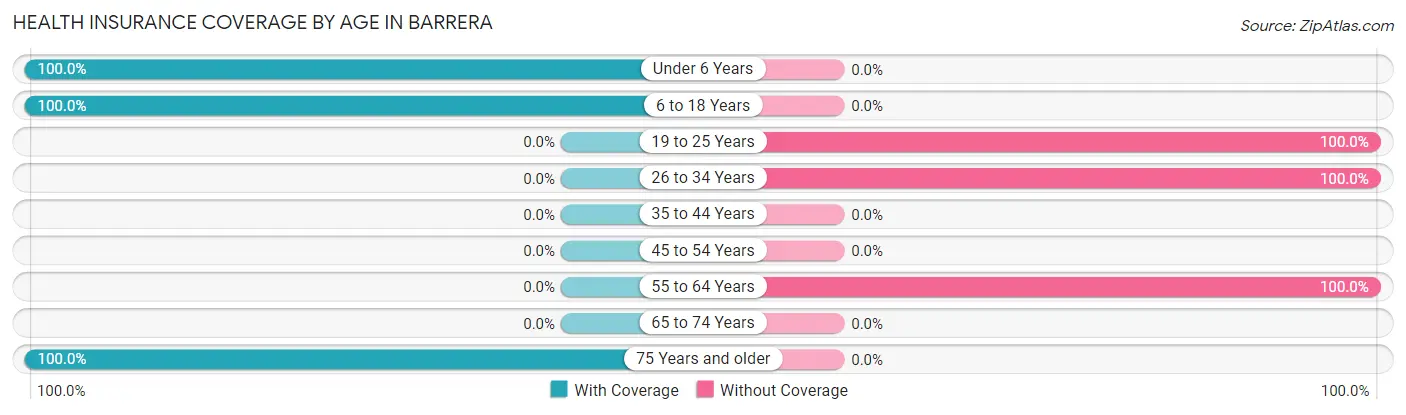
| Age Bracket | With Coverage | Without Coverage |
| Under 6 Years | 124 (100.0%) | 0 (0.0%) |
| 6 to 18 Years | 48 (100.0%) | 0 (0.0%) |
| 19 to 25 Years | 0 (0.0%) | 43 (100.0%) |
| 26 to 34 Years | 0 (0.0%) | 23 (100.0%) |
| 35 to 44 Years | 0 (0.0%) | 0 (0.0%) |
| 45 to 54 Years | 0 (0.0%) | 0 (0.0%) |
| 55 to 64 Years | 0 (0.0%) | 45 (100.0%) |
| 65 to 74 Years | 0 (0.0%) | 0 (0.0%) |
| 75 Years and older | 48 (100.0%) | 0 (0.0%) |
| Total | 220 (66.5%) | 111 (33.5%) |
Health Insurance Coverage by Citizenship Status in Barrera
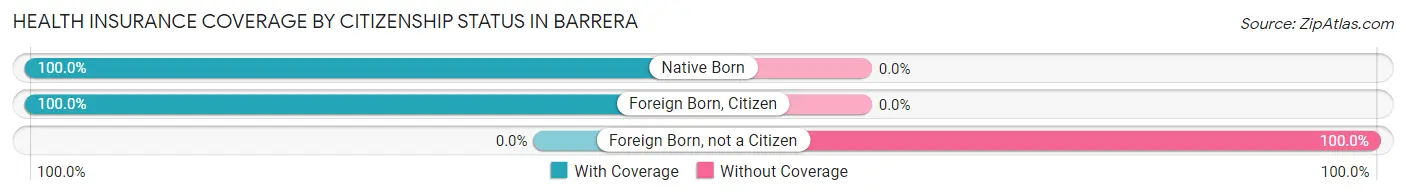
| Citizenship Status | With Coverage | Without Coverage |
| Native Born | 124 (100.0%) | 0 (0.0%) |
| Foreign Born, Citizen | 48 (100.0%) | 0 (0.0%) |
| Foreign Born, not a Citizen | 0 (0.0%) | 43 (100.0%) |
Health Insurance Coverage by Household Income in Barrera
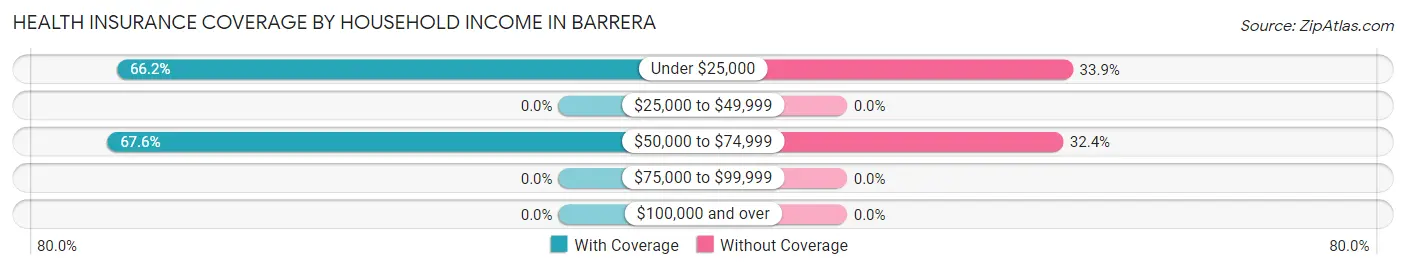
| Household Income | With Coverage | Without Coverage |
| Under $25,000 | 172 (66.1%) | 88 (33.9%) |
| $25,000 to $49,999 | 0 (0.0%) | 0 (0.0%) |
| $50,000 to $74,999 | 48 (67.6%) | 23 (32.4%) |
| $75,000 to $99,999 | 0 (0.0%) | 0 (0.0%) |
| $100,000 and over | 0 (0.0%) | 0 (0.0%) |
Public vs Private Health Insurance Coverage by Age in Barrera
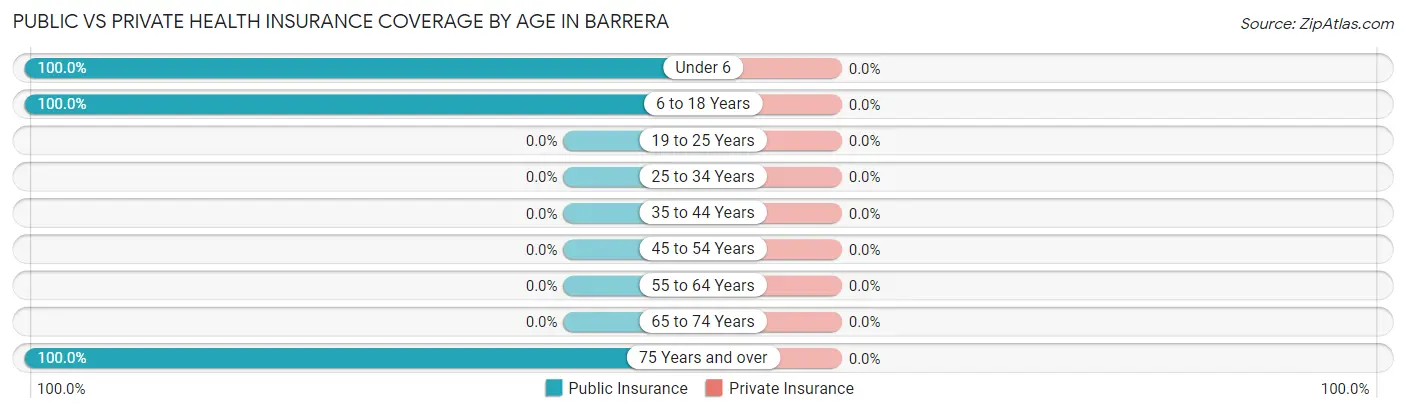
| Age Bracket | Public Insurance | Private Insurance |
| Under 6 | 124 (100.0%) | 0 (0.0%) |
| 6 to 18 Years | 48 (100.0%) | 0 (0.0%) |
| 19 to 25 Years | 0 (0.0%) | 0 (0.0%) |
| 25 to 34 Years | 0 (0.0%) | 0 (0.0%) |
| 35 to 44 Years | 0 (0.0%) | 0 (0.0%) |
| 45 to 54 Years | 0 (0.0%) | 0 (0.0%) |
| 55 to 64 Years | 0 (0.0%) | 0 (0.0%) |
| 65 to 74 Years | 0 (0.0%) | 0 (0.0%) |
| 75 Years and over | 48 (100.0%) | 0 (0.0%) |
| Total | 220 (66.5%) | 0 (0.0%) |
Disability Status by Sex by Age in Barrera
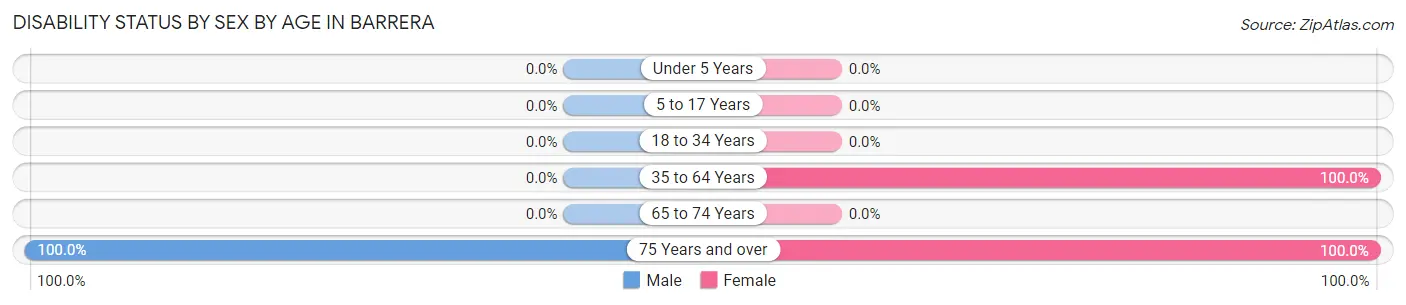
| Age Bracket | Male | Female |
| Under 5 Years | 0 (0.0%) | 0 (0.0%) |
| 5 to 17 Years | 0 (0.0%) | 0 (0.0%) |
| 18 to 34 Years | 0 (0.0%) | 0 (0.0%) |
| 35 to 64 Years | 0 (0.0%) | 11 (100.0%) |
| 65 to 74 Years | 0 (0.0%) | 0 (0.0%) |
| 75 Years and over | 21 (100.0%) | 27 (100.0%) |
Disability Class by Sex by Age in Barrera
Disability Class: Hearing Difficulty
| Age Bracket | Male | Female |
| Under 5 Years | 0 (0.0%) | 0 (0.0%) |
| 5 to 17 Years | 0 (0.0%) | 0 (0.0%) |
| 18 to 34 Years | 0 (0.0%) | 0 (0.0%) |
| 35 to 64 Years | 0 (0.0%) | 0 (0.0%) |
| 65 to 74 Years | 0 (0.0%) | 0 (0.0%) |
| 75 Years and over | 0 (0.0%) | 0 (0.0%) |
Disability Class: Vision Difficulty
| Age Bracket | Male | Female |
| Under 5 Years | 0 (0.0%) | 0 (0.0%) |
| 5 to 17 Years | 0 (0.0%) | 0 (0.0%) |
| 18 to 34 Years | 0 (0.0%) | 0 (0.0%) |
| 35 to 64 Years | 0 (0.0%) | 0 (0.0%) |
| 65 to 74 Years | 0 (0.0%) | 0 (0.0%) |
| 75 Years and over | 0 (0.0%) | 0 (0.0%) |
Disability Class: Cognitive Difficulty
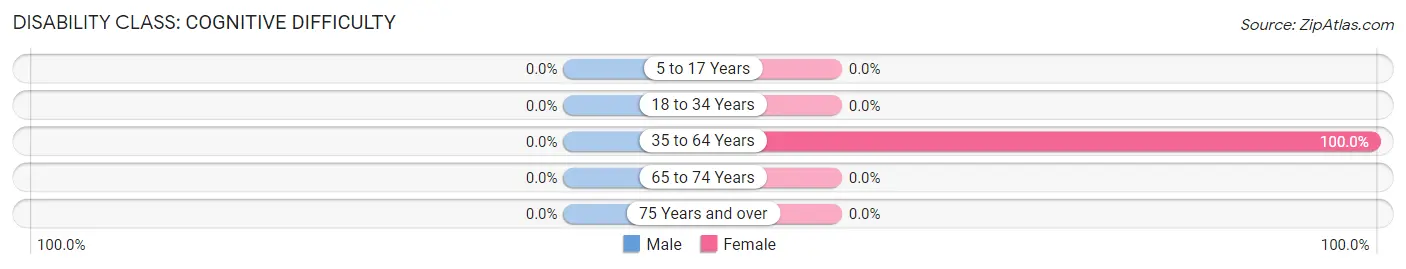
| Age Bracket | Male | Female |
| 5 to 17 Years | 0 (0.0%) | 0 (0.0%) |
| 18 to 34 Years | 0 (0.0%) | 0 (0.0%) |
| 35 to 64 Years | 0 (0.0%) | 11 (100.0%) |
| 65 to 74 Years | 0 (0.0%) | 0 (0.0%) |
| 75 Years and over | 0 (0.0%) | 0 (0.0%) |
Disability Class: Ambulatory Difficulty
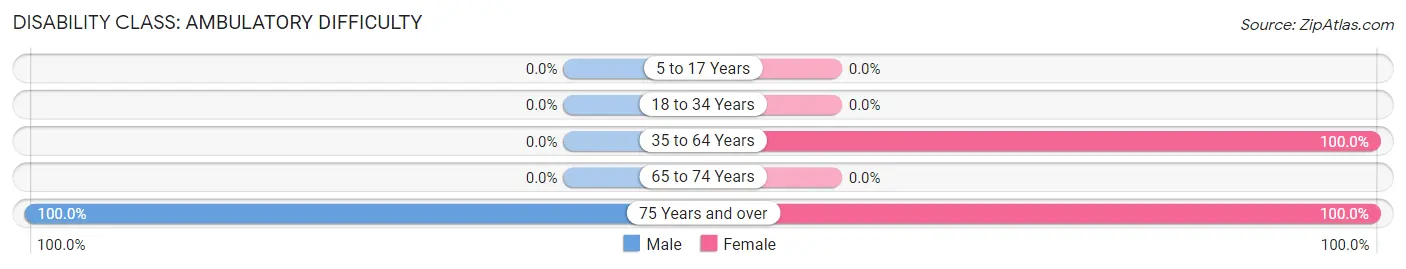
| Age Bracket | Male | Female |
| 5 to 17 Years | 0 (0.0%) | 0 (0.0%) |
| 18 to 34 Years | 0 (0.0%) | 0 (0.0%) |
| 35 to 64 Years | 0 (0.0%) | 11 (100.0%) |
| 65 to 74 Years | 0 (0.0%) | 0 (0.0%) |
| 75 Years and over | 21 (100.0%) | 27 (100.0%) |
Disability Class: Self-Care Difficulty
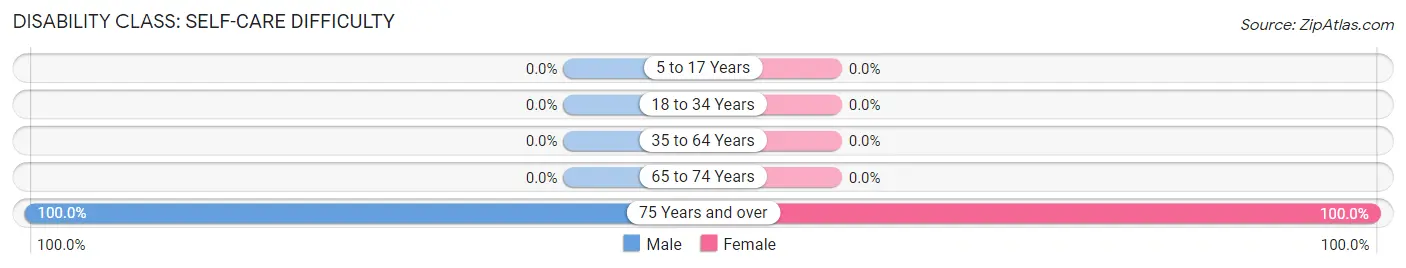
| Age Bracket | Male | Female |
| 5 to 17 Years | 0 (0.0%) | 0 (0.0%) |
| 18 to 34 Years | 0 (0.0%) | 0 (0.0%) |
| 35 to 64 Years | 0 (0.0%) | 0 (0.0%) |
| 65 to 74 Years | 0 (0.0%) | 0 (0.0%) |
| 75 Years and over | 21 (100.0%) | 27 (100.0%) |
Technology Access in Barrera
Computing Device Access in Barrera
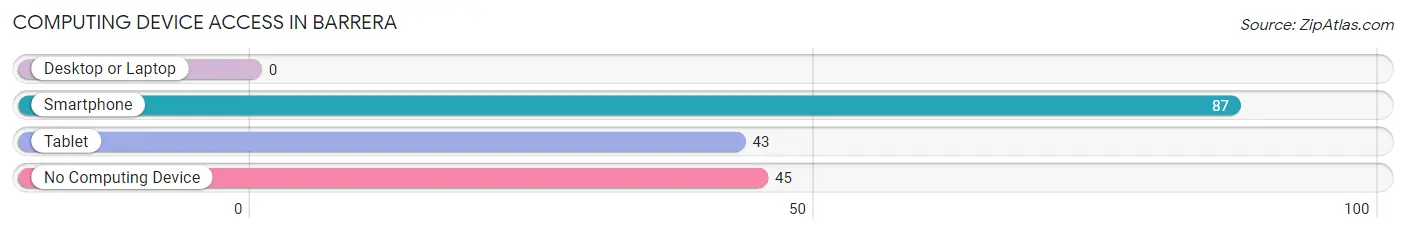
| Device Type | # Households | % Households |
| Desktop or Laptop | 0 | 0.0% |
| Smartphone | 87 | 65.9% |
| Tablet | 43 | 32.6% |
| No Computing Device | 45 | 34.1% |
| Total | 132 | 100.0% |
Internet Access in Barrera
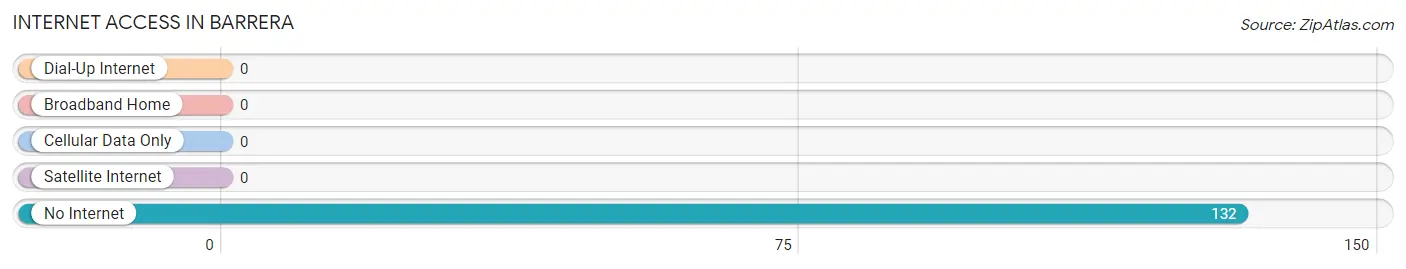
| Internet Type | # Households | % Households |
| Dial-Up Internet | 0 | 0.0% |
| Broadband Home | 0 | 0.0% |
| Cellular Data Only | 0 | 0.0% |
| Satellite Internet | 0 | 0.0% |
| No Internet | 132 | 100.0% |
| Total | 132 | 100.0% |
Barrera Summary
Barrera, Texas is a small unincorporated community located in Starr County, Texas. It is situated on the Rio Grande River, approximately 10 miles south of Rio Grande City. The population of Barrera was estimated to be around 1,000 people in 2020.
History
Barrera was founded in the late 19th century by a group of Mexican immigrants who were looking for a place to settle and start a new life. The town was named after a local rancher, Don Jose Barrera, who owned a large ranch in the area. The town was originally a small farming community, but it soon grew to become a bustling trading center.
In the early 20th century, Barrera was a major stop on the Southern Pacific Railroad. The railroad brought in new settlers and businesses, and the town began to grow. By the mid-20th century, Barrera had become a major center for the production of cotton, corn, and other agricultural products.
Geography
Barrera is located in Starr County, Texas, approximately 10 miles south of Rio Grande City. The town is situated on the Rio Grande River, which forms the border between the United States and Mexico. The town is surrounded by agricultural land, and the climate is generally hot and dry.
Economy
Barrera’s economy is largely based on agriculture. The town is home to several large farms that produce cotton, corn, and other crops. The town also has a few small businesses, including a grocery store, a gas station, and a few restaurants.
Demographics
Barrera is a predominantly Hispanic community. According to the 2010 census, the population of Barrera was 1,000 people, with 97.7% of the population being of Hispanic or Latino origin. The median household income in Barrera was $25,000, and the median age was 28. The town is served by the Rio Grande City Consolidated Independent School District.
Conclusion
Barrera, Texas is a small unincorporated community located in Starr County, Texas. It is situated on the Rio Grande River, approximately 10 miles south of Rio Grande City. The town was founded in the late 19th century by a group of Mexican immigrants, and it has since grown to become a bustling trading center. The town’s economy is largely based on agriculture, and the population is predominantly Hispanic. Barrera is served by the Rio Grande City Consolidated Independent School District.
Common Questions
What is Per Capita Income in Barrera?
Per Capita income in Barrera is $6,589.
What is Inequality or Gini Index in Barrera?
Inequality or Gini Index in Barrera is 0.57.
What is the Total Population of Barrera?
Total Population of Barrera is 331.
What is the Total Male Population of Barrera?
Total Male Population of Barrera is 118.
What is the Total Female Population of Barrera?
Total Female Population of Barrera is 213.
What is the Ratio of Males per 100 Females in Barrera?
There are 55.40 Males per 100 Females in Barrera.
What is the Ratio of Females per 100 Males in Barrera?
There are 180.51 Females per 100 Males in Barrera.
What is the Median Population Age in Barrera?
Median Population Age in Barrera is 13.7 Years.
What is the Average Family Size in Barrera
Average Family Size in Barrera is 3.3 People.
What is the Average Household Size in Barrera
Average Household Size in Barrera is 2.5 People.
How Large is the Labor Force in Barrera?
There are 68 People in the Labor Forcein in Barrera.
What is the Percentage of People in the Labor Force in Barrera?
42.8% of People are in the Labor Force in Barrera.
What is the Unemployment Rate in Barrera?
Unemployment Rate in Barrera is 16.2%.