Ozora, MO Map & Demographics
Ozora Map
Ozora Overview
$21,867
PER CAPITA INCOME
47.5%
WAGE / INCOME GAP [ % ]
52.5¢/ $1
WAGE / INCOME GAP [ $ ]
0.41
INEQUALITY / GINI INDEX
275
TOTAL POPULATION
101
MALE POPULATION
174
FEMALE POPULATION
58.05
MALES / 100 FEMALES
172.28
FEMALES / 100 MALES
19.8
MEDIAN AGE
4.1
AVG FAMILY SIZE
3.2
AVG HOUSEHOLD SIZE
156
LABOR FORCE [ PEOPLE ]
74.6%
PERCENT IN LABOR FORCE
Income in Ozora
Income Overview in Ozora
| Characteristic | Number | Measure |
| Per Capita Income | 275 | $21,867 |
| Median Family Income | 60 | $0 |
| Mean Family Income | 60 | $81,283 |
| Median Household Income | 84 | $0 |
| Mean Household Income | 84 | $67,838 |
| Income Deficit | 60 | $0 |
| Wage / Income Gap (%) | 275 | 47.52% |
| Wage / Income Gap ($) | 275 | 52.48¢ per $1 |
| Gini / Inequality Index | 275 | 0.41 |
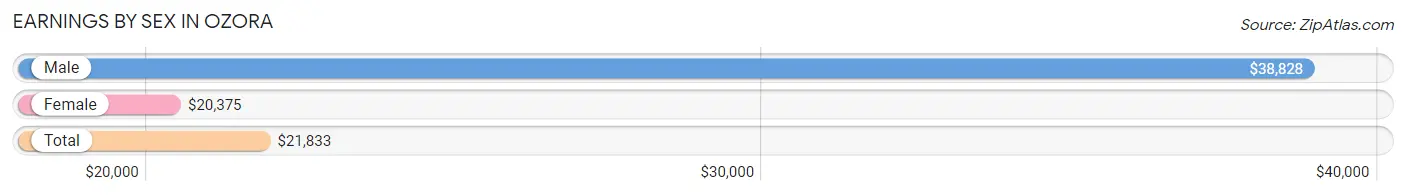
Earnings by Sex in Ozora
Average Earnings in Ozora are $21,833, $38,828 for men and $20,375 for women, a difference of 47.5%.
| Sex | Number | Average Earnings |
| Male | 61 (39.1%) | $38,828 |
| Female | 95 (60.9%) | $20,375 |
| Total | 156 (100.0%) | $21,833 |
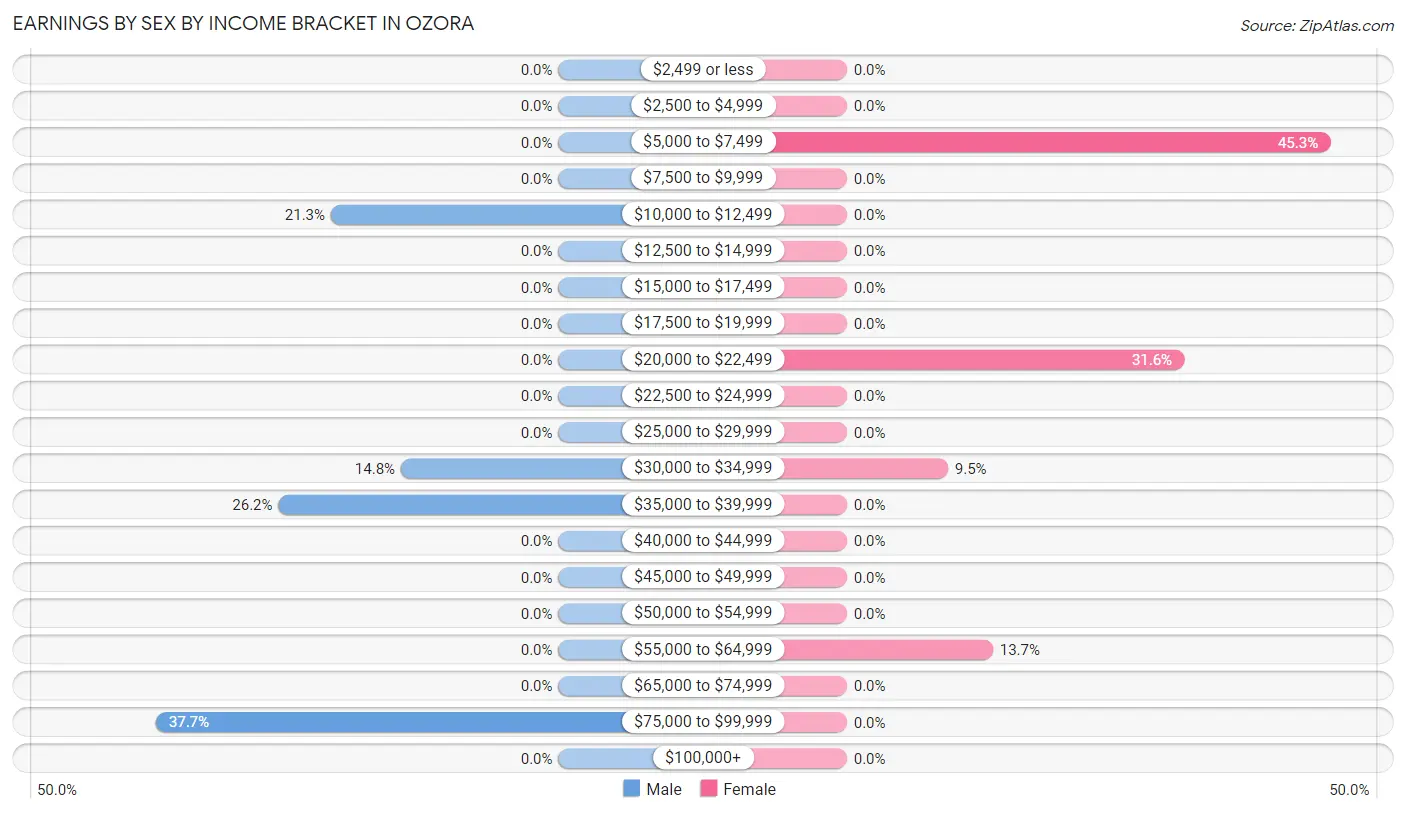
Earnings by Sex by Income Bracket in Ozora
The most common earnings brackets in Ozora are $75,000 to $99,999 for men (23 | 37.7%) and $5,000 to $7,499 for women (43 | 45.3%).
| Income | Male | Female |
| $2,499 or less | 0 (0.0%) | 0 (0.0%) |
| $2,500 to $4,999 | 0 (0.0%) | 0 (0.0%) |
| $5,000 to $7,499 | 0 (0.0%) | 43 (45.3%) |
| $7,500 to $9,999 | 0 (0.0%) | 0 (0.0%) |
| $10,000 to $12,499 | 13 (21.3%) | 0 (0.0%) |
| $12,500 to $14,999 | 0 (0.0%) | 0 (0.0%) |
| $15,000 to $17,499 | 0 (0.0%) | 0 (0.0%) |
| $17,500 to $19,999 | 0 (0.0%) | 0 (0.0%) |
| $20,000 to $22,499 | 0 (0.0%) | 30 (31.6%) |
| $22,500 to $24,999 | 0 (0.0%) | 0 (0.0%) |
| $25,000 to $29,999 | 0 (0.0%) | 0 (0.0%) |
| $30,000 to $34,999 | 9 (14.7%) | 9 (9.5%) |
| $35,000 to $39,999 | 16 (26.2%) | 0 (0.0%) |
| $40,000 to $44,999 | 0 (0.0%) | 0 (0.0%) |
| $45,000 to $49,999 | 0 (0.0%) | 0 (0.0%) |
| $50,000 to $54,999 | 0 (0.0%) | 0 (0.0%) |
| $55,000 to $64,999 | 0 (0.0%) | 13 (13.7%) |
| $65,000 to $74,999 | 0 (0.0%) | 0 (0.0%) |
| $75,000 to $99,999 | 23 (37.7%) | 0 (0.0%) |
| $100,000+ | 0 (0.0%) | 0 (0.0%) |
| Total | 61 (100.0%) | 95 (100.0%) |
Earnings by Sex by Educational Attainment in Ozora
| Educational Attainment | Male Income | Female Income |
| Less than High School | - | - |
| High School Diploma | - | - |
| College or Associate's Degree | - | - |
| Bachelor's Degree | - | - |
| Graduate Degree | - | - |
| Total | - | - |
Family Income in Ozora
Family Income Brackets in Ozora
According to the Ozora family income data, there are 30 families falling into the $25,000 to $34,999 income range, which is the most common income bracket and makes up 50.0% of all families.
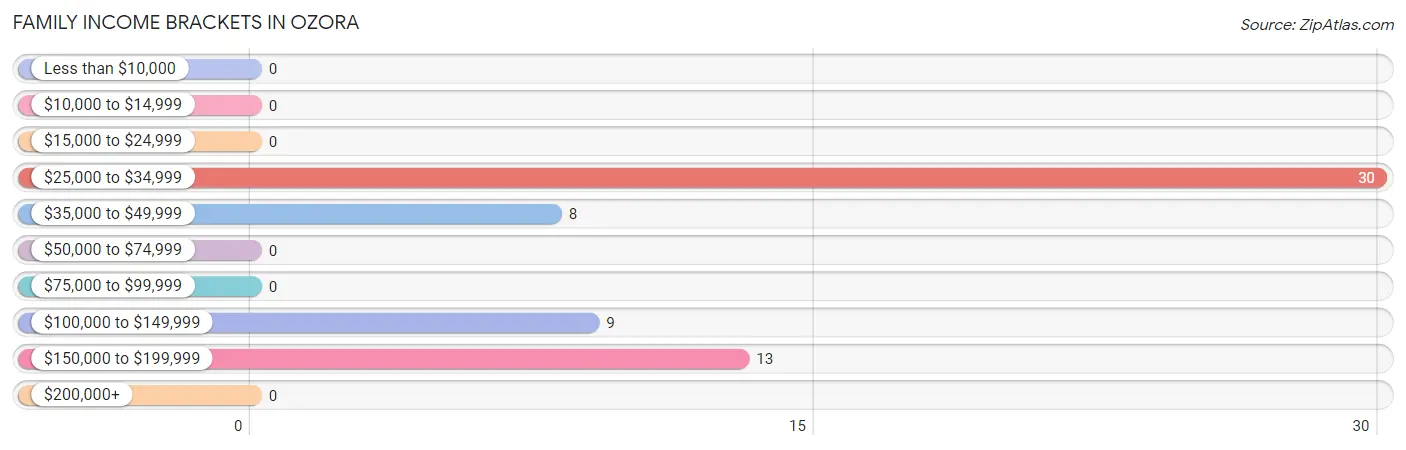
| Income Bracket | # Families | % Families |
| Less than $10,000 | 0 | 0.0% |
| $10,000 to $14,999 | 0 | 0.0% |
| $15,000 to $24,999 | 0 | 0.0% |
| $25,000 to $34,999 | 30 | 50.0% |
| $35,000 to $49,999 | 8 | 13.3% |
| $50,000 to $74,999 | 0 | 0.0% |
| $75,000 to $99,999 | 0 | 0.0% |
| $100,000 to $149,999 | 9 | 15.0% |
| $150,000 to $199,999 | 13 | 21.7% |
| $200,000+ | 0 | 0.0% |
Family Income by Famaliy Size in Ozora
| Income Bracket | # Families | Median Income |
| 2-Person Families | 8 (13.3%) | $0 |
| 3-Person Families | 9 (15.0%) | $0 |
| 4-Person Families | 0 (0.0%) | $0 |
| 5-Person Families | 43 (71.7%) | $0 |
| 6-Person Families | 0 (0.0%) | $0 |
| 7+ Person Families | 0 (0.0%) | $0 |
| Total | 60 (100.0%) | $0 |
Family Income by Number of Earners in Ozora
| Number of Earners | # Families | Median Income |
| No Earners | 0 (0.0%) | $0 |
| 1 Earner | 8 (13.3%) | $0 |
| 2 Earners | 30 (50.0%) | $0 |
| 3+ Earners | 22 (36.7%) | $0 |
| Total | 60 (100.0%) | $0 |
Household Income in Ozora
Household Income Brackets in Ozora
With 54 households falling in the category, the $25,000 to $34,999 income range is the most frequent in Ozora, accounting for 64.3% of all households.
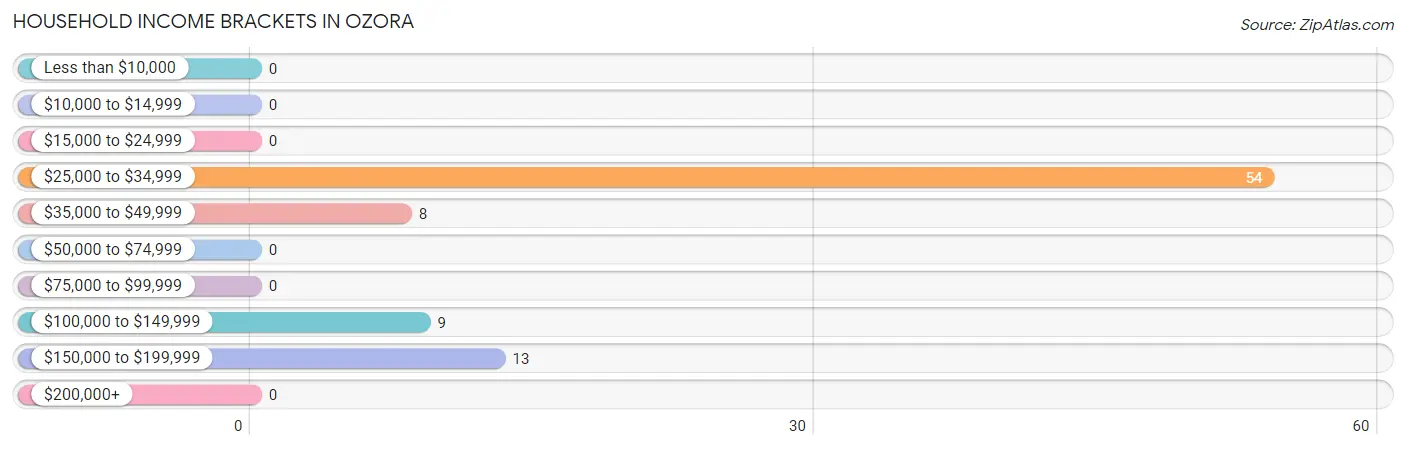
| Income Bracket | # Households | % Households |
| Less than $10,000 | 0 | 0.0% |
| $10,000 to $14,999 | 0 | 0.0% |
| $15,000 to $24,999 | 0 | 0.0% |
| $25,000 to $34,999 | 54 | 64.3% |
| $35,000 to $49,999 | 8 | 9.5% |
| $50,000 to $74,999 | 0 | 0.0% |
| $75,000 to $99,999 | 0 | 0.0% |
| $100,000 to $149,999 | 9 | 10.7% |
| $150,000 to $199,999 | 13 | 15.5% |
| $200,000+ | 0 | 0.0% |
Household Income by Householder Age in Ozora
| Income Bracket | # Households | Median Income |
| 15 to 24 Years | 0 (0.0%) | $0 |
| 25 to 44 Years | 43 (51.2%) | $0 |
| 45 to 64 Years | 18 (21.4%) | $0 |
| 65+ Years | 23 (27.4%) | $0 |
| Total | 84 (100.0%) | $0 |
Poverty in Ozora
Income Below Poverty by Sex and Age in Ozora
With 31.7% poverty level for males and 62.6% for females among the residents of Ozora, 15 year old males and 16 and 17 year old females are the most vulnerable to poverty, with 32 males (100.0%) and 24 females (100.0%) in their respective age groups living below the poverty level.
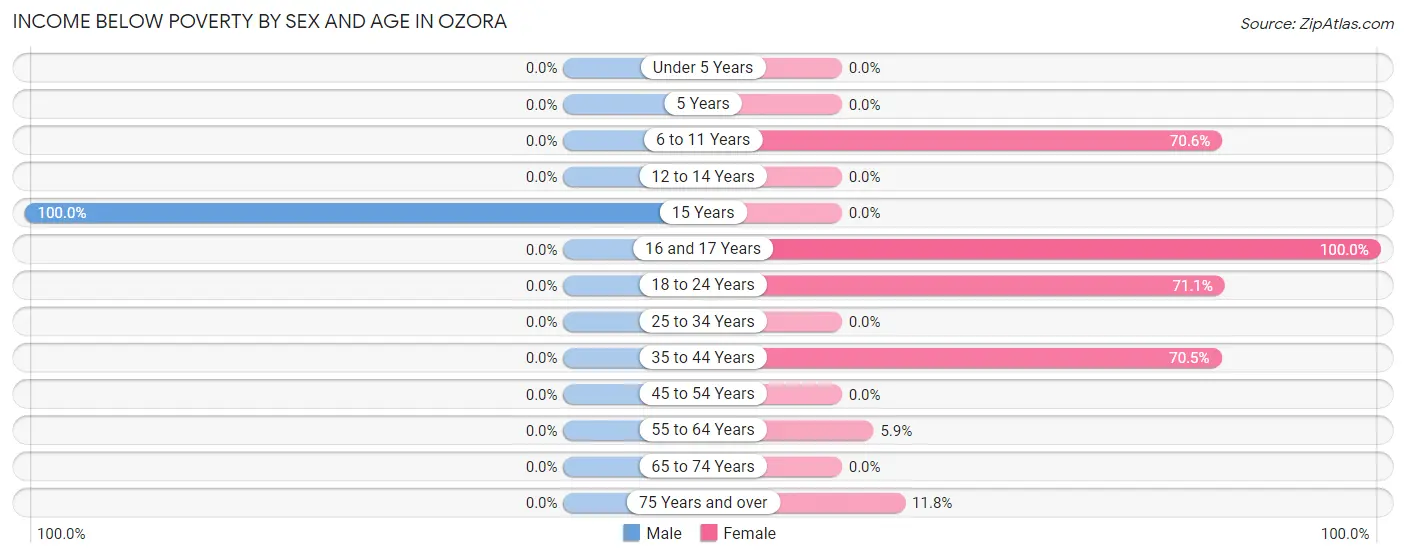
| Age Bracket | Male | Female |
| Under 5 Years | 0 (0.0%) | 0 (0.0%) |
| 5 Years | 0 (0.0%) | 0 (0.0%) |
| 6 to 11 Years | 0 (0.0%) | 24 (70.6%) |
| 12 to 14 Years | 0 (0.0%) | 0 (0.0%) |
| 15 Years | 32 (100.0%) | 0 (0.0%) |
| 16 and 17 Years | 0 (0.0%) | 24 (100.0%) |
| 18 to 24 Years | 0 (0.0%) | 27 (71.1%) |
| 25 to 34 Years | 0 (0.0%) | 0 (0.0%) |
| 35 to 44 Years | 0 (0.0%) | 31 (70.5%) |
| 45 to 54 Years | 0 (0.0%) | 0 (0.0%) |
| 55 to 64 Years | 0 (0.0%) | 1 (5.9%) |
| 65 to 74 Years | 0 (0.0%) | 0 (0.0%) |
| 75 Years and over | 0 (0.0%) | 2 (11.8%) |
| Total | 32 (31.7%) | 109 (62.6%) |
Income Above Poverty by Sex and Age in Ozora
According to the poverty statistics in Ozora, males aged 16 and 17 years and females aged 55 to 64 years are the age groups that are most secure financially, with 100.0% of males and 94.1% of females in these age groups living above the poverty line.
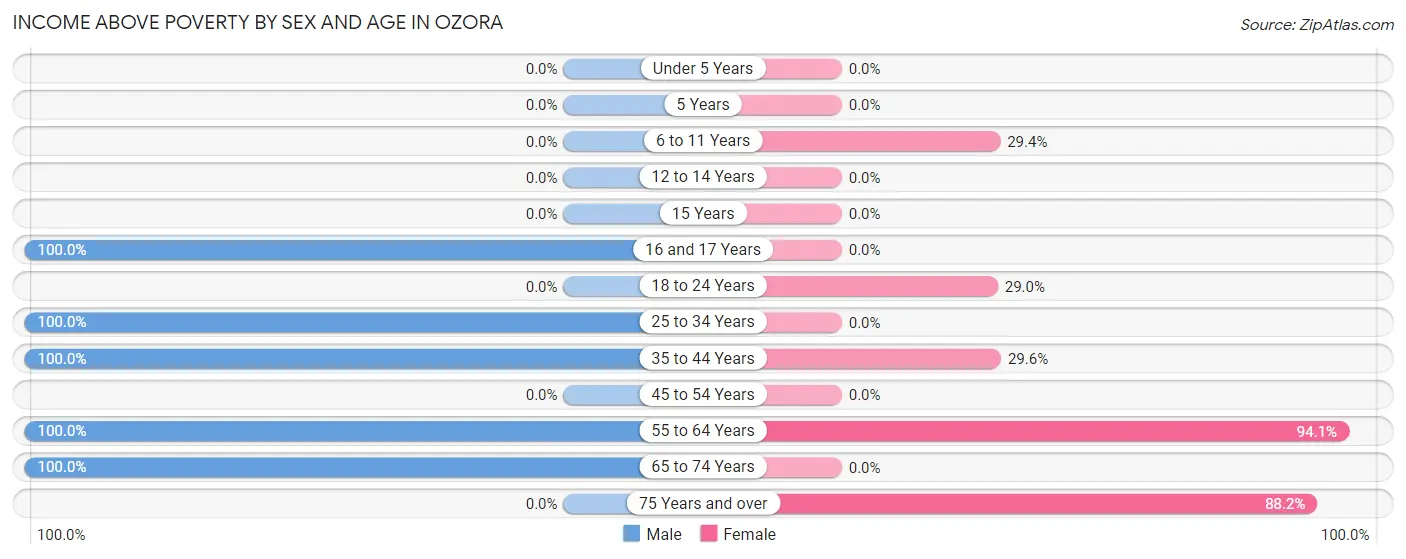
| Age Bracket | Male | Female |
| Under 5 Years | 0 (0.0%) | 0 (0.0%) |
| 5 Years | 0 (0.0%) | 0 (0.0%) |
| 6 to 11 Years | 0 (0.0%) | 10 (29.4%) |
| 12 to 14 Years | 0 (0.0%) | 0 (0.0%) |
| 15 Years | 0 (0.0%) | 0 (0.0%) |
| 16 and 17 Years | 13 (100.0%) | 0 (0.0%) |
| 18 to 24 Years | 0 (0.0%) | 11 (28.9%) |
| 25 to 34 Years | 16 (100.0%) | 0 (0.0%) |
| 35 to 44 Years | 14 (100.0%) | 13 (29.5%) |
| 45 to 54 Years | 0 (0.0%) | 0 (0.0%) |
| 55 to 64 Years | 18 (100.0%) | 16 (94.1%) |
| 65 to 74 Years | 8 (100.0%) | 0 (0.0%) |
| 75 Years and over | 0 (0.0%) | 15 (88.2%) |
| Total | 69 (68.3%) | 65 (37.4%) |
Income Below Poverty Among Married-Couple Families in Ozora
| Children | Above Poverty | Below Poverty |
| No Children | 17 (100.0%) | 0 (0.0%) |
| 1 or 2 Children | 13 (100.0%) | 0 (0.0%) |
| 3 or 4 Children | 0 (0.0%) | 0 (0.0%) |
| 5 or more Children | 0 (0.0%) | 0 (0.0%) |
| Total | 30 (100.0%) | 0 (0.0%) |
Income Below Poverty Among Single-Parent Households in Ozora
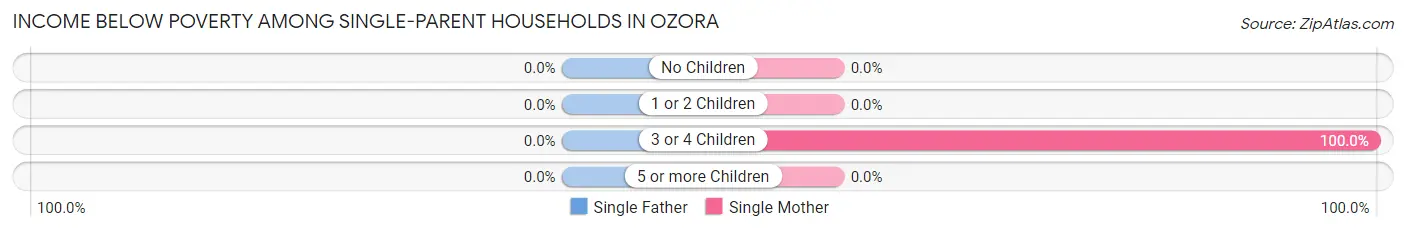
| Children | Single Father | Single Mother |
| No Children | 0 (0.0%) | 0 (0.0%) |
| 1 or 2 Children | 0 (0.0%) | 0 (0.0%) |
| 3 or 4 Children | 0 (0.0%) | 30 (100.0%) |
| 5 or more Children | 0 (0.0%) | 0 (0.0%) |
| Total | 0 (0.0%) | 30 (100.0%) |
Income Below Poverty Among Married-Couple vs Single-Parent Households in Ozora
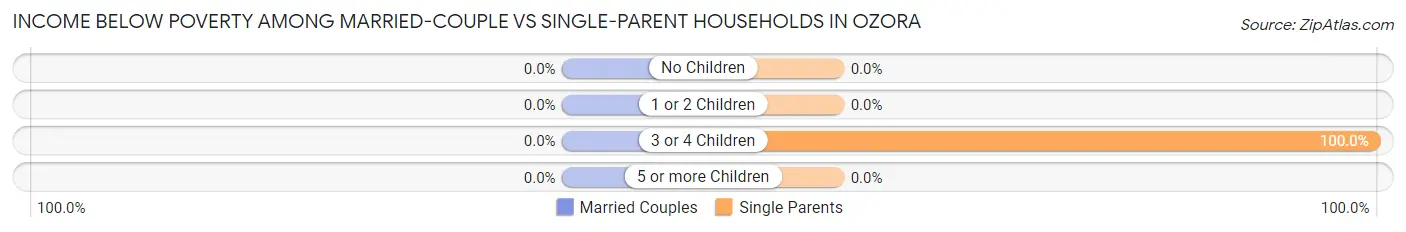
| Children | Married-Couple Families | Single-Parent Households |
| No Children | 0 (0.0%) | 0 (0.0%) |
| 1 or 2 Children | 0 (0.0%) | 0 (0.0%) |
| 3 or 4 Children | 0 (0.0%) | 30 (100.0%) |
| 5 or more Children | 0 (0.0%) | 0 (0.0%) |
| Total | 0 (0.0%) | 30 (100.0%) |
Race in Ozora
The most populous races in Ozora are White / Caucasian (273 | 99.3%), Asian (1 | 0.4%), and Two or more Races (1 | 0.4%).
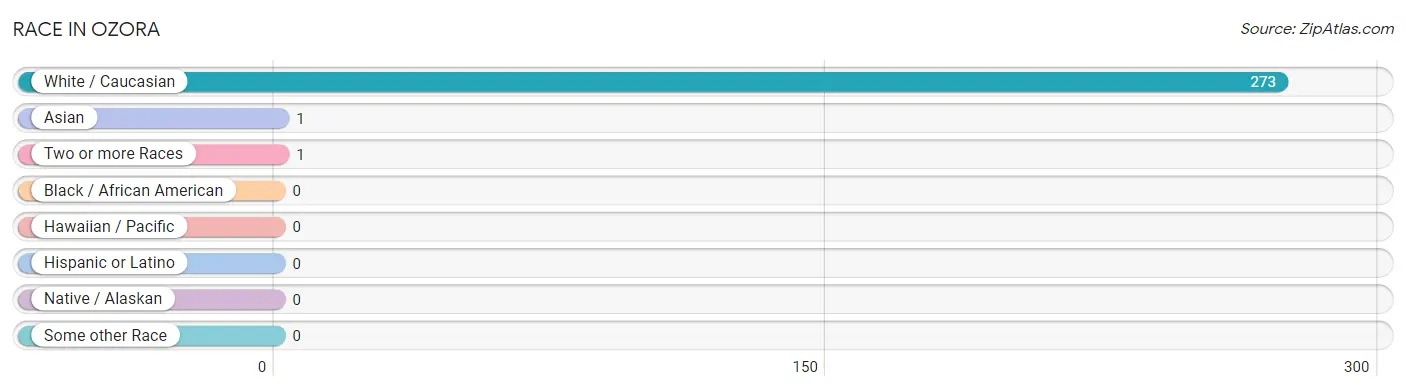
| Race | # Population | % Population |
| Asian | 1 | 0.4% |
| Black / African American | 0 | 0.0% |
| Hawaiian / Pacific | 0 | 0.0% |
| Hispanic or Latino | 0 | 0.0% |
| Native / Alaskan | 0 | 0.0% |
| White / Caucasian | 273 | 99.3% |
| Two or more Races | 1 | 0.4% |
| Some other Race | 0 | 0.0% |
| Total | 275 | 100.0% |
Ancestry in Ozora
The most populous ancestries reported in Ozora are German (49 | 17.8%), English (28 | 10.2%), American (15 | 5.4%), French (9 | 3.3%), and Norwegian (1 | 0.4%), together accounting for 37.1% of all Ozora residents.
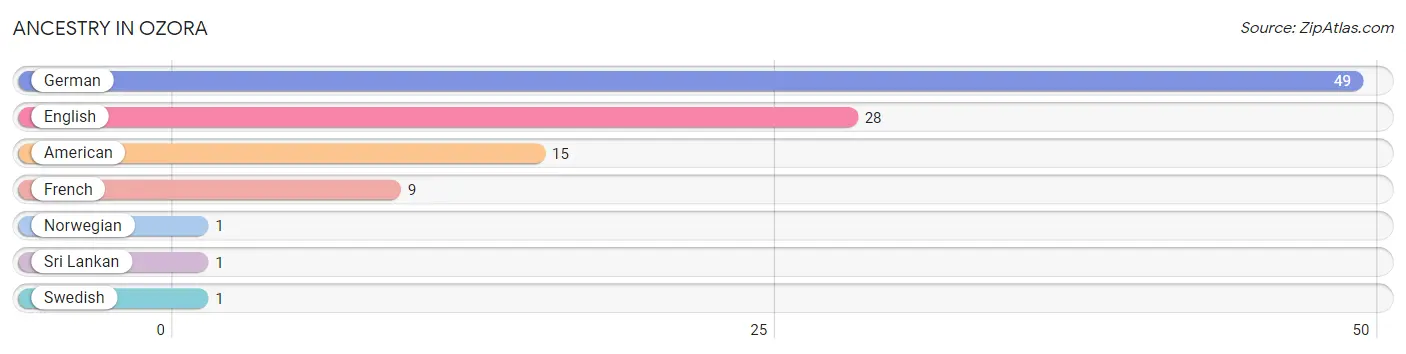
| Ancestry | # Population | % Population |
| American | 15 | 5.4% |
| English | 28 | 10.2% |
| French | 9 | 3.3% |
| German | 49 | 17.8% |
| Norwegian | 1 | 0.4% |
| Sri Lankan | 1 | 0.4% |
| Swedish | 1 | 0.4% | View All 7 Rows |
Immigrants in Ozora
The most numerous immigrant groups reported in Ozora came from Asia (1 | 0.4%), South Eastern Asia (1 | 0.4%), and Vietnam (1 | 0.4%), together accounting for 1.1% of all Ozora residents.
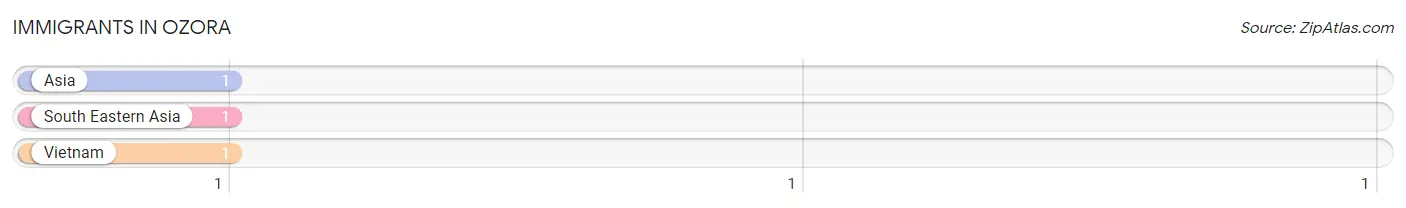
| Immigration Origin | # Population | % Population |
| Asia | 1 | 0.4% |
| South Eastern Asia | 1 | 0.4% |
| Vietnam | 1 | 0.4% | View All 3 Rows |
Sex and Age in Ozora
Sex and Age in Ozora
The most populous age groups in Ozora are 15 to 19 Years (45 | 44.6%) for men and 15 to 19 Years (61 | 35.1%) for women.
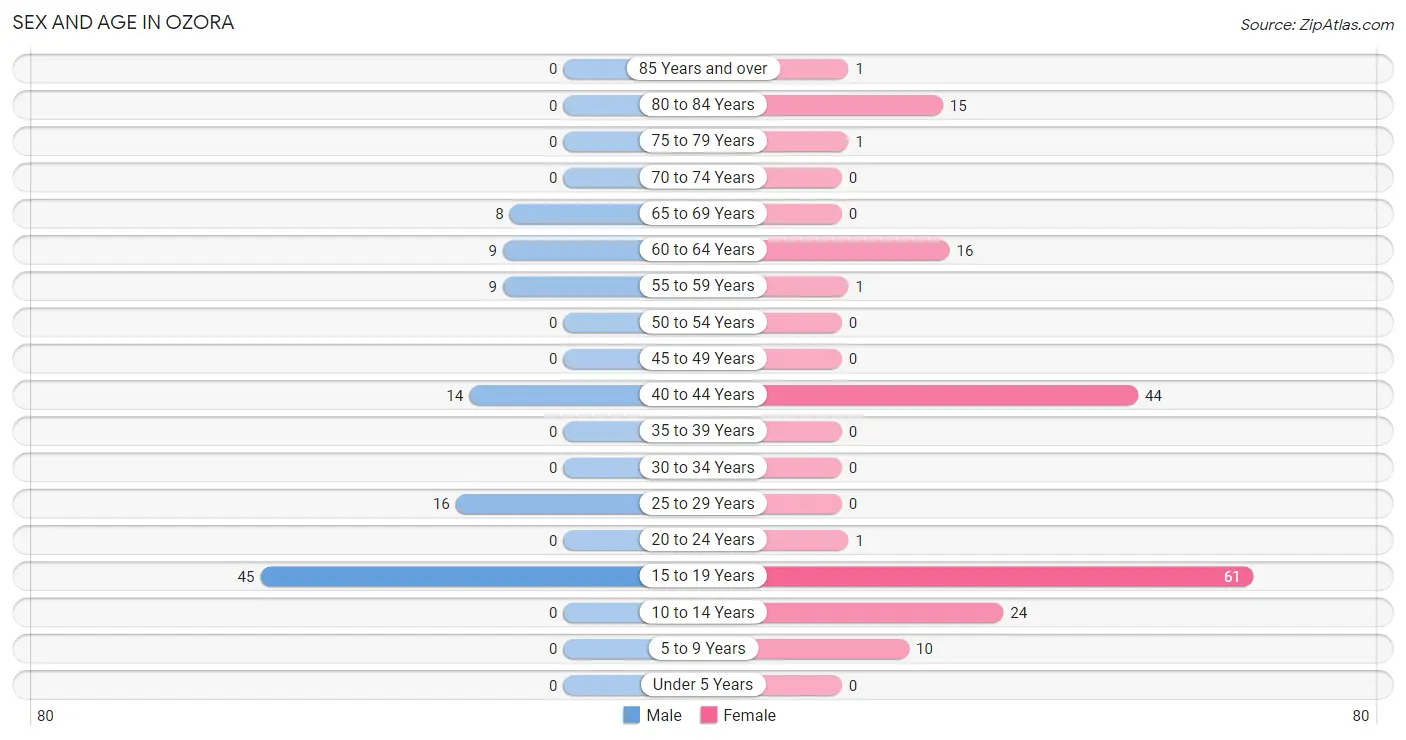
| Age Bracket | Male | Female |
| Under 5 Years | 0 (0.0%) | 0 (0.0%) |
| 5 to 9 Years | 0 (0.0%) | 10 (5.8%) |
| 10 to 14 Years | 0 (0.0%) | 24 (13.8%) |
| 15 to 19 Years | 45 (44.6%) | 61 (35.1%) |
| 20 to 24 Years | 0 (0.0%) | 1 (0.6%) |
| 25 to 29 Years | 16 (15.8%) | 0 (0.0%) |
| 30 to 34 Years | 0 (0.0%) | 0 (0.0%) |
| 35 to 39 Years | 0 (0.0%) | 0 (0.0%) |
| 40 to 44 Years | 14 (13.9%) | 44 (25.3%) |
| 45 to 49 Years | 0 (0.0%) | 0 (0.0%) |
| 50 to 54 Years | 0 (0.0%) | 0 (0.0%) |
| 55 to 59 Years | 9 (8.9%) | 1 (0.6%) |
| 60 to 64 Years | 9 (8.9%) | 16 (9.2%) |
| 65 to 69 Years | 8 (7.9%) | 0 (0.0%) |
| 70 to 74 Years | 0 (0.0%) | 0 (0.0%) |
| 75 to 79 Years | 0 (0.0%) | 1 (0.6%) |
| 80 to 84 Years | 0 (0.0%) | 15 (8.6%) |
| 85 Years and over | 0 (0.0%) | 1 (0.6%) |
| Total | 101 (100.0%) | 174 (100.0%) |
Families and Households in Ozora
Median Family Size in Ozora
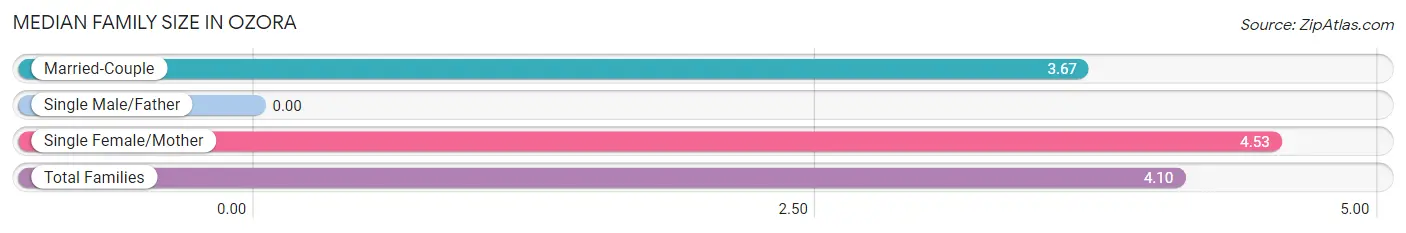
| Family Type | # Families | Family Size |
| Married-Couple | 30 (50.0%) | 3.67 |
| Single Male/Father | 0 (0.0%) | - |
| Single Female/Mother | 30 (50.0%) | 4.53 |
| Total Families | 60 (100.0%) | 4.10 |
Median Household Size in Ozora
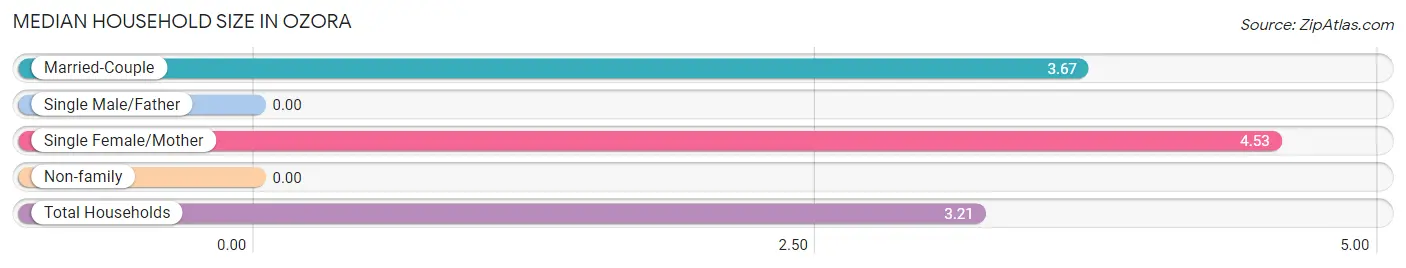
| Household Type | # Households | Household Size |
| Married-Couple | 30 (35.7%) | 3.67 |
| Single Male/Father | 0 (0.0%) | - |
| Single Female/Mother | 30 (35.7%) | 4.53 |
| Non-family | 24 (28.6%) | - |
| Total Households | 84 (100.0%) | 3.21 |
Household Size by Marriage Status in Ozora
Out of a total of 84 households in Ozora, 60 (71.4%) are family households, while 24 (28.6%) are nonfamily households. The most numerous type of family households are 5-person households, comprising 43, and the most common type of nonfamily households are 1-person households, comprising 24.
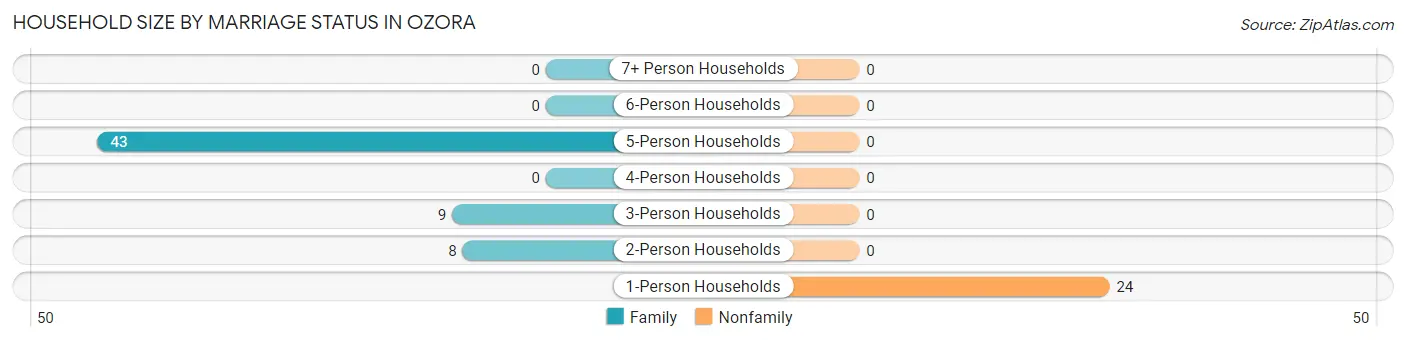
| Household Size | Family Households | Nonfamily Households |
| 1-Person Households | - | 24 (28.6%) |
| 2-Person Households | 8 (9.5%) | 0 (0.0%) |
| 3-Person Households | 9 (10.7%) | 0 (0.0%) |
| 4-Person Households | 0 (0.0%) | 0 (0.0%) |
| 5-Person Households | 43 (51.2%) | 0 (0.0%) |
| 6-Person Households | 0 (0.0%) | 0 (0.0%) |
| 7+ Person Households | 0 (0.0%) | 0 (0.0%) |
| Total | 60 (71.4%) | 24 (28.6%) |
Female Fertility in Ozora
Fertility by Age in Ozora
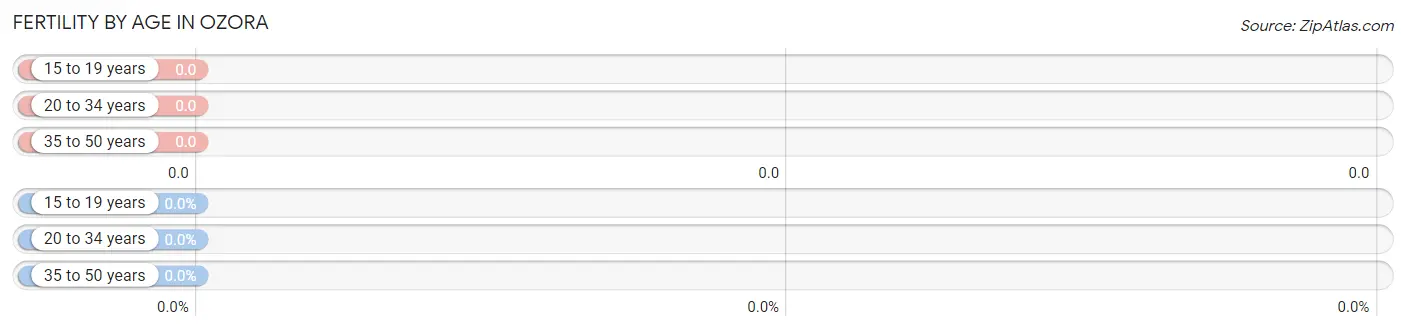
| Age Bracket | Women with Births | Births / 1,000 Women |
| 15 to 19 years | 0 (0.0%) | 0.0 |
| 20 to 34 years | 0 (0.0%) | 0.0 |
| 35 to 50 years | 0 (0.0%) | 0.0 |
| Total | 0 (0.0%) | 0.0 |
Fertility by Age by Marriage Status in Ozora
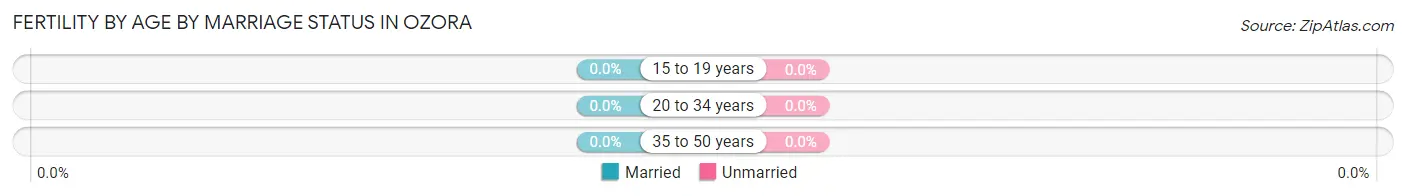
| Age Bracket | Married | Unmarried |
| 15 to 19 years | 0 (0.0%) | 0 (0.0%) |
| 20 to 34 years | 0 (0.0%) | 0 (0.0%) |
| 35 to 50 years | 0 (0.0%) | 0 (0.0%) |
| Total | 0 (0.0%) | 0 (0.0%) |
Fertility by Education in Ozora
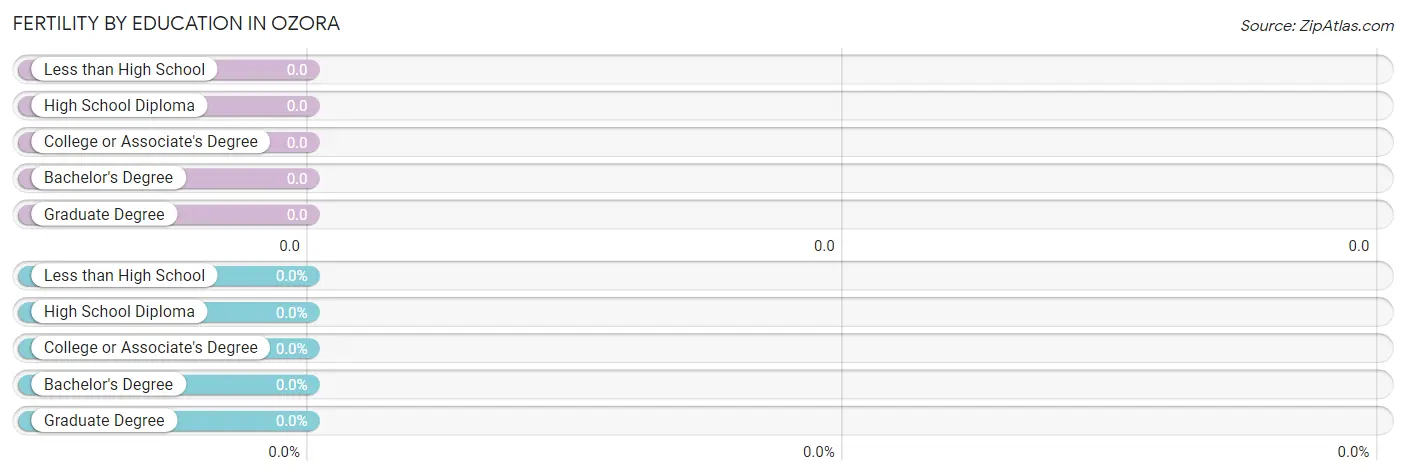
| Educational Attainment | Women with Births | Births / 1,000 Women |
| Less than High School | 0 (0.0%) | 0.0 |
| High School Diploma | 0 (0.0%) | 0.0 |
| College or Associate's Degree | 0 (0.0%) | 0.0 |
| Bachelor's Degree | 0 (0.0%) | 0.0 |
| Graduate Degree | 0 (0.0%) | 0.0 |
| Total | 0 (0.0%) | 0.0 |
Fertility by Education by Marriage Status in Ozora
| Educational Attainment | Married | Unmarried |
| Less than High School | 0 (0.0%) | 0 (0.0%) |
| High School Diploma | 0 (0.0%) | 0 (0.0%) |
| College or Associate's Degree | 0 (0.0%) | 0 (0.0%) |
| Bachelor's Degree | 0 (0.0%) | 0 (0.0%) |
| Graduate Degree | 0 (0.0%) | 0 (0.0%) |
| Total | 0 (0.0%) | 0 (0.0%) |
Employment Characteristics in Ozora
Employment by Class of Employer in Ozora
Among the 156 employed individuals in Ozora, private company employees (108 | 69.2%), self-employed (not incorporated) (18 | 11.5%), and local government employees (13 | 8.3%) make up the most common classes of employment.
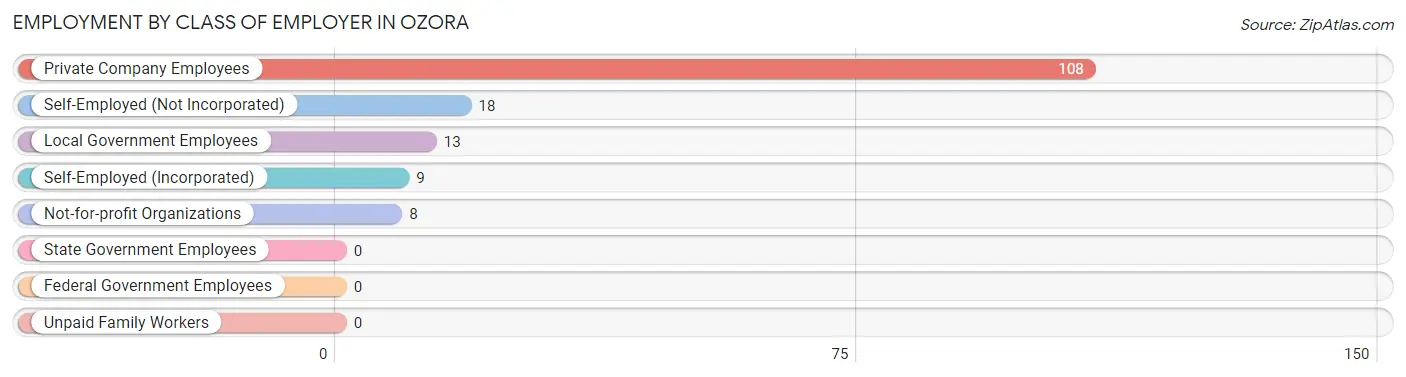
| Employer Class | # Employees | % Employees |
| Private Company Employees | 108 | 69.2% |
| Self-Employed (Incorporated) | 9 | 5.8% |
| Self-Employed (Not Incorporated) | 18 | 11.5% |
| Not-for-profit Organizations | 8 | 5.1% |
| Local Government Employees | 13 | 8.3% |
| State Government Employees | 0 | 0.0% |
| Federal Government Employees | 0 | 0.0% |
| Unpaid Family Workers | 0 | 0.0% |
| Total | 156 | 100.0% |
Employment Status by Age in Ozora
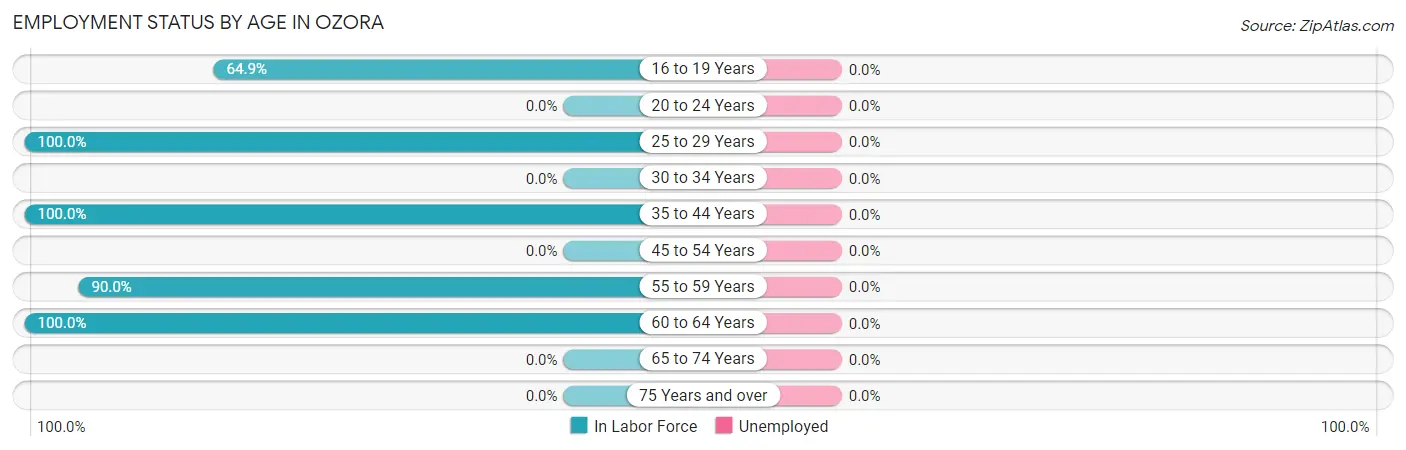
| Age Bracket | In Labor Force | Unemployed |
| 16 to 19 Years | 48 (64.9%) | 0 (0.0%) |
| 20 to 24 Years | 0 (0.0%) | 0 (0.0%) |
| 25 to 29 Years | 16 (100.0%) | 0 (0.0%) |
| 30 to 34 Years | 0 (0.0%) | 0 (0.0%) |
| 35 to 44 Years | 58 (100.0%) | 0 (0.0%) |
| 45 to 54 Years | 0 (0.0%) | 0 (0.0%) |
| 55 to 59 Years | 9 (90.0%) | 0 (0.0%) |
| 60 to 64 Years | 25 (100.0%) | 0 (0.0%) |
| 65 to 74 Years | 0 (0.0%) | 0 (0.0%) |
| 75 Years and over | 0 (0.0%) | 0 (0.0%) |
| Total | 156 (74.6%) | 0 (0.0%) |
Employment Status by Educational Attainment in Ozora
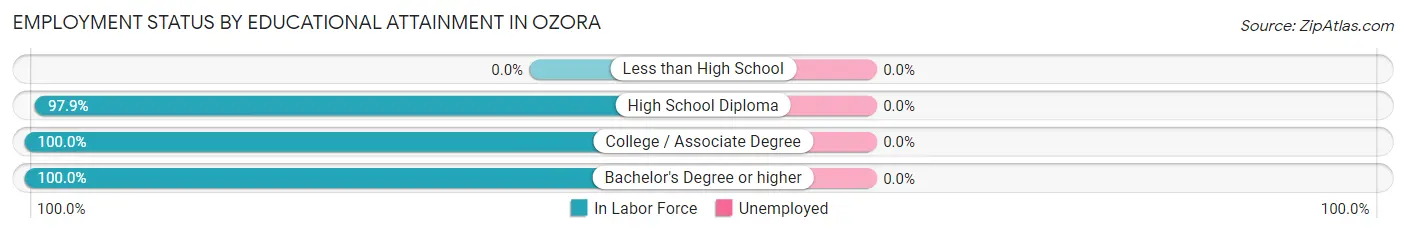
| Educational Attainment | In Labor Force | Unemployed |
| Less than High School | 0 (0.0%) | 0 (0.0%) |
| High School Diploma | 46 (97.9%) | 0 (0.0%) |
| College / Associate Degree | 39 (100.0%) | 0 (0.0%) |
| Bachelor's Degree or higher | 23 (100.0%) | 0 (0.0%) |
| Total | 108 (99.1%) | 0 (0.0%) |
Employment Occupations by Sex in Ozora
Management, Business, Science and Arts Occupations
The most common Management, Business, Science and Arts occupations in Ozora are Community & Social Service (13 | 8.3%), Education Instruction & Library (13 | 8.3%), and Management (10 | 6.4%).
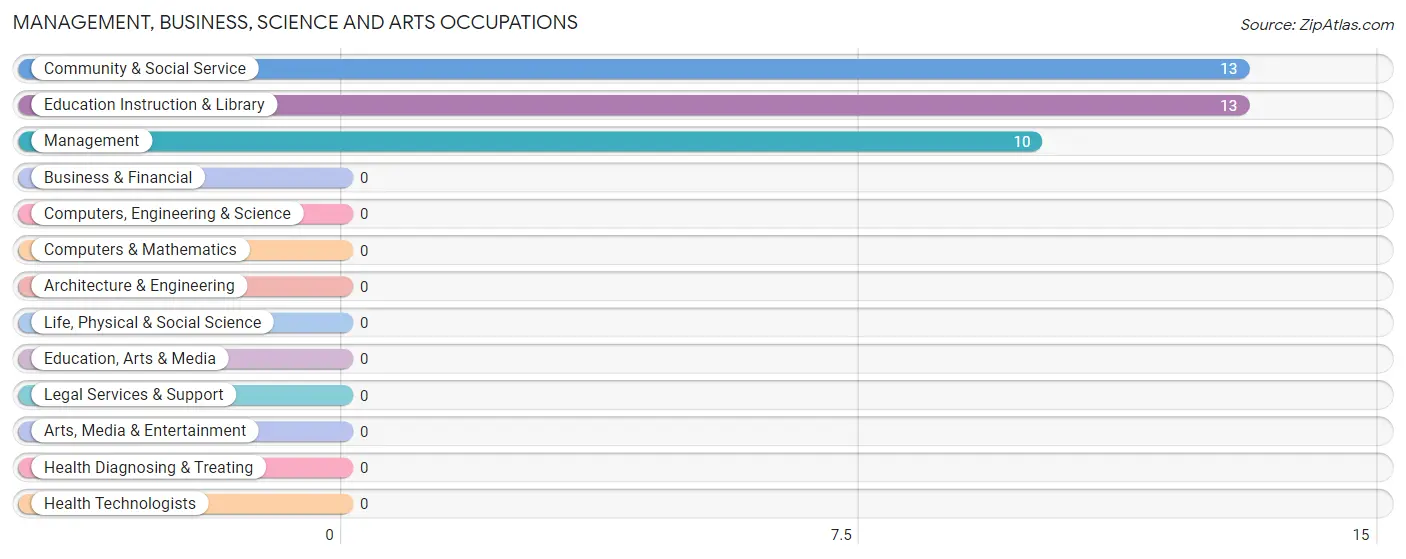
Management, Business, Science and Arts Occupations by Sex
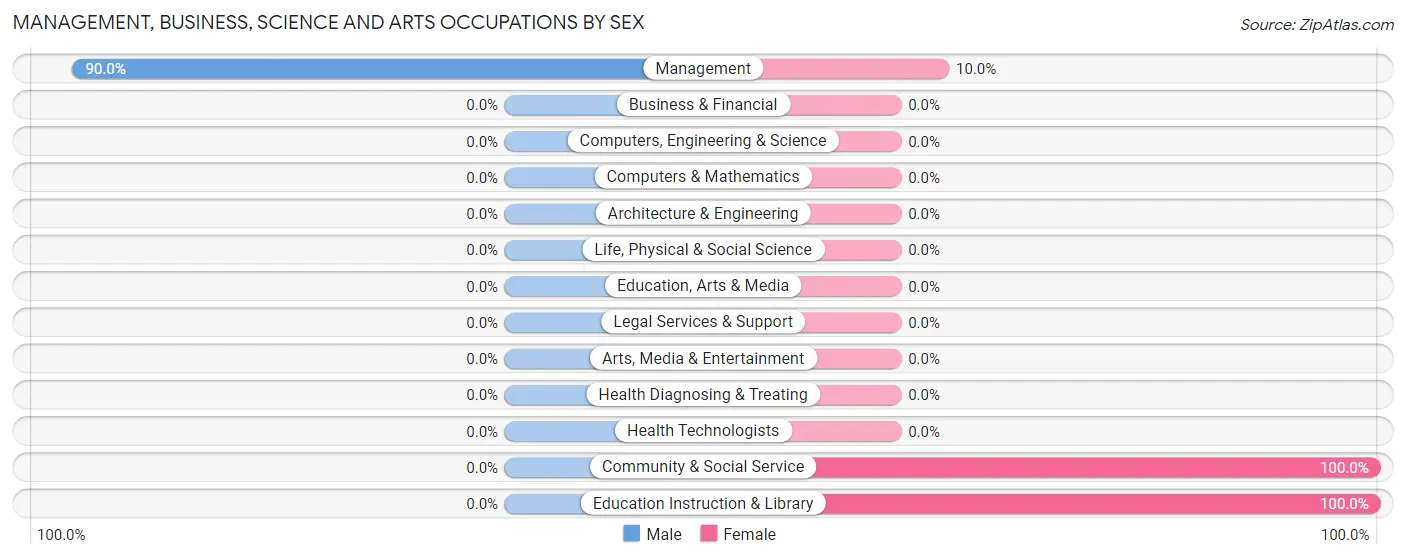
| Occupation | Male | Female |
| Management | 9 (90.0%) | 1 (10.0%) |
| Business & Financial | 0 (0.0%) | 0 (0.0%) |
| Computers, Engineering & Science | 0 (0.0%) | 0 (0.0%) |
| Computers & Mathematics | 0 (0.0%) | 0 (0.0%) |
| Architecture & Engineering | 0 (0.0%) | 0 (0.0%) |
| Life, Physical & Social Science | 0 (0.0%) | 0 (0.0%) |
| Community & Social Service | 0 (0.0%) | 13 (100.0%) |
| Education, Arts & Media | 0 (0.0%) | 0 (0.0%) |
| Legal Services & Support | 0 (0.0%) | 0 (0.0%) |
| Education Instruction & Library | 0 (0.0%) | 13 (100.0%) |
| Arts, Media & Entertainment | 0 (0.0%) | 0 (0.0%) |
| Health Diagnosing & Treating | 0 (0.0%) | 0 (0.0%) |
| Health Technologists | 0 (0.0%) | 0 (0.0%) |
| Total (Category) | 9 (39.1%) | 14 (60.9%) |
| Total (Overall) | 61 (39.1%) | 95 (60.9%) |
Services Occupations
The most common Services occupations in Ozora are Food Preparation & Serving (42 | 26.9%), and Healthcare Support (9 | 5.8%).
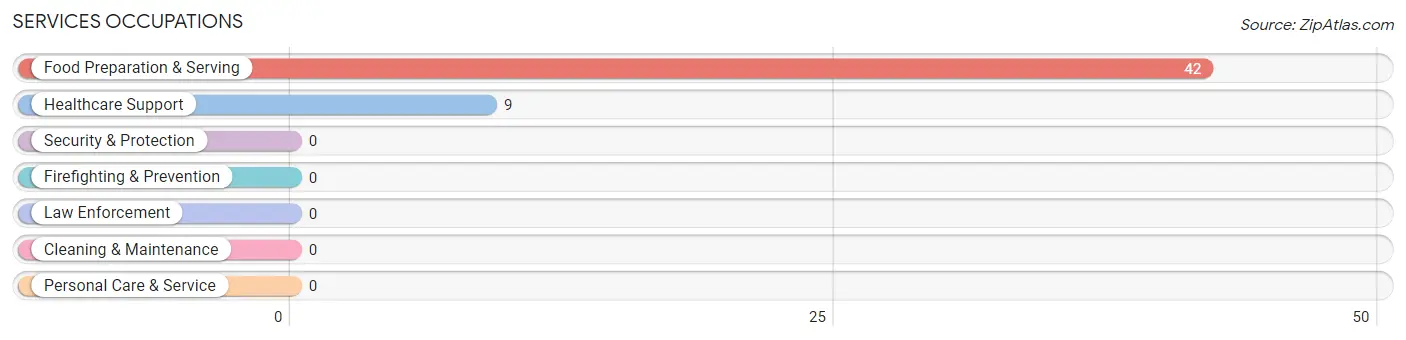
Services Occupations by Sex
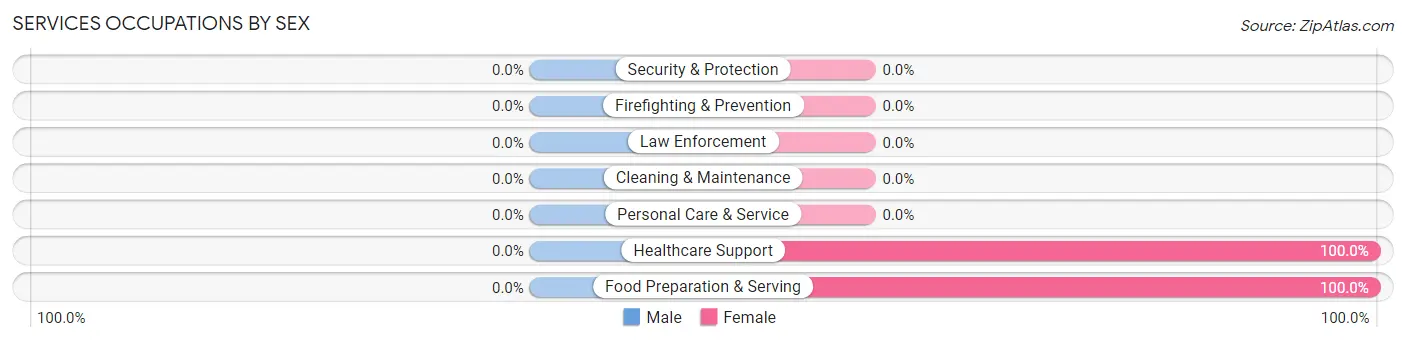
| Occupation | Male | Female |
| Healthcare Support | 0 (0.0%) | 9 (100.0%) |
| Security & Protection | 0 (0.0%) | 0 (0.0%) |
| Firefighting & Prevention | 0 (0.0%) | 0 (0.0%) |
| Law Enforcement | 0 (0.0%) | 0 (0.0%) |
| Food Preparation & Serving | 0 (0.0%) | 42 (100.0%) |
| Cleaning & Maintenance | 0 (0.0%) | 0 (0.0%) |
| Personal Care & Service | 0 (0.0%) | 0 (0.0%) |
| Total (Category) | 0 (0.0%) | 51 (100.0%) |
| Total (Overall) | 61 (39.1%) | 95 (60.9%) |
Sales and Office Occupations
Sales and Office Occupations by Sex
| Occupation | Male | Female |
| Sales & Related | 0 (0.0%) | 0 (0.0%) |
| Office & Administration | 0 (0.0%) | 0 (0.0%) |
| Total (Category) | 0 (0.0%) | 0 (0.0%) |
| Total (Overall) | 61 (39.1%) | 95 (60.9%) |
Natural Resources, Construction and Maintenance Occupations
The most common Natural Resources, Construction and Maintenance occupations in Ozora are , and Construction & Extraction (25 | 16.0%).
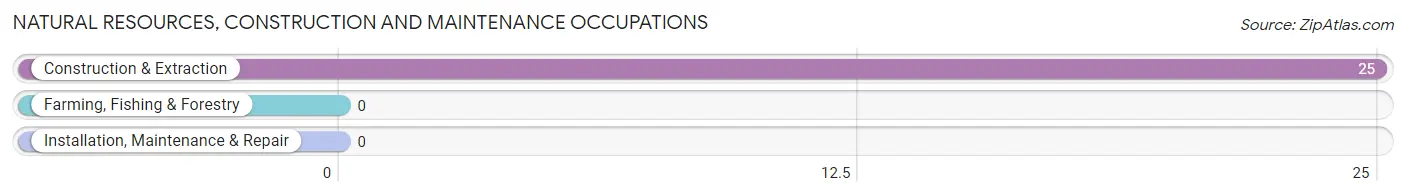
Natural Resources, Construction and Maintenance Occupations by Sex
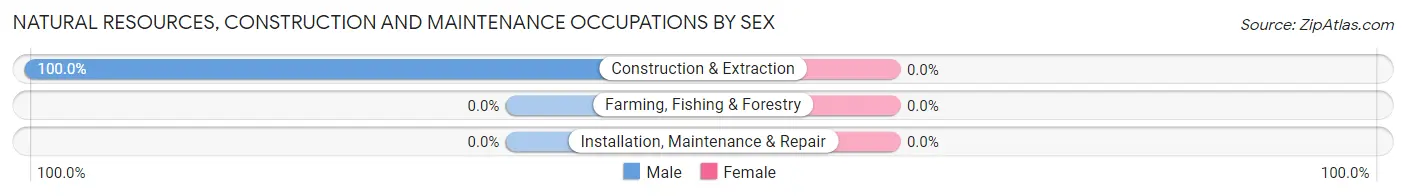
| Occupation | Male | Female |
| Farming, Fishing & Forestry | 0 (0.0%) | 0 (0.0%) |
| Construction & Extraction | 25 (100.0%) | 0 (0.0%) |
| Installation, Maintenance & Repair | 0 (0.0%) | 0 (0.0%) |
| Total (Category) | 25 (100.0%) | 0 (0.0%) |
| Total (Overall) | 61 (39.1%) | 95 (60.9%) |
Production, Transportation and Moving Occupations
The most common Production, Transportation and Moving occupations in Ozora are Production (44 | 28.2%), and Material Moving (13 | 8.3%).
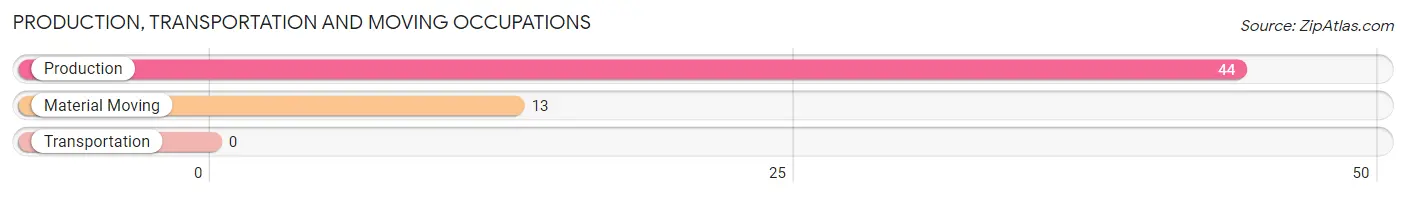
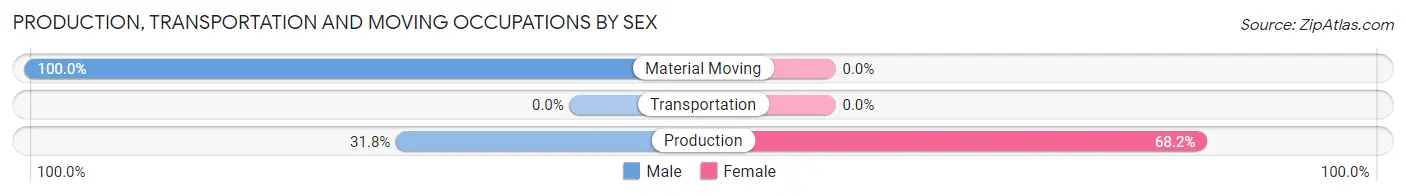
Production, Transportation and Moving Occupations by Sex
| Occupation | Male | Female |
| Production | 14 (31.8%) | 30 (68.2%) |
| Transportation | 0 (0.0%) | 0 (0.0%) |
| Material Moving | 13 (100.0%) | 0 (0.0%) |
| Total (Category) | 27 (47.4%) | 30 (52.6%) |
| Total (Overall) | 61 (39.1%) | 95 (60.9%) |
Employment Industries by Sex in Ozora
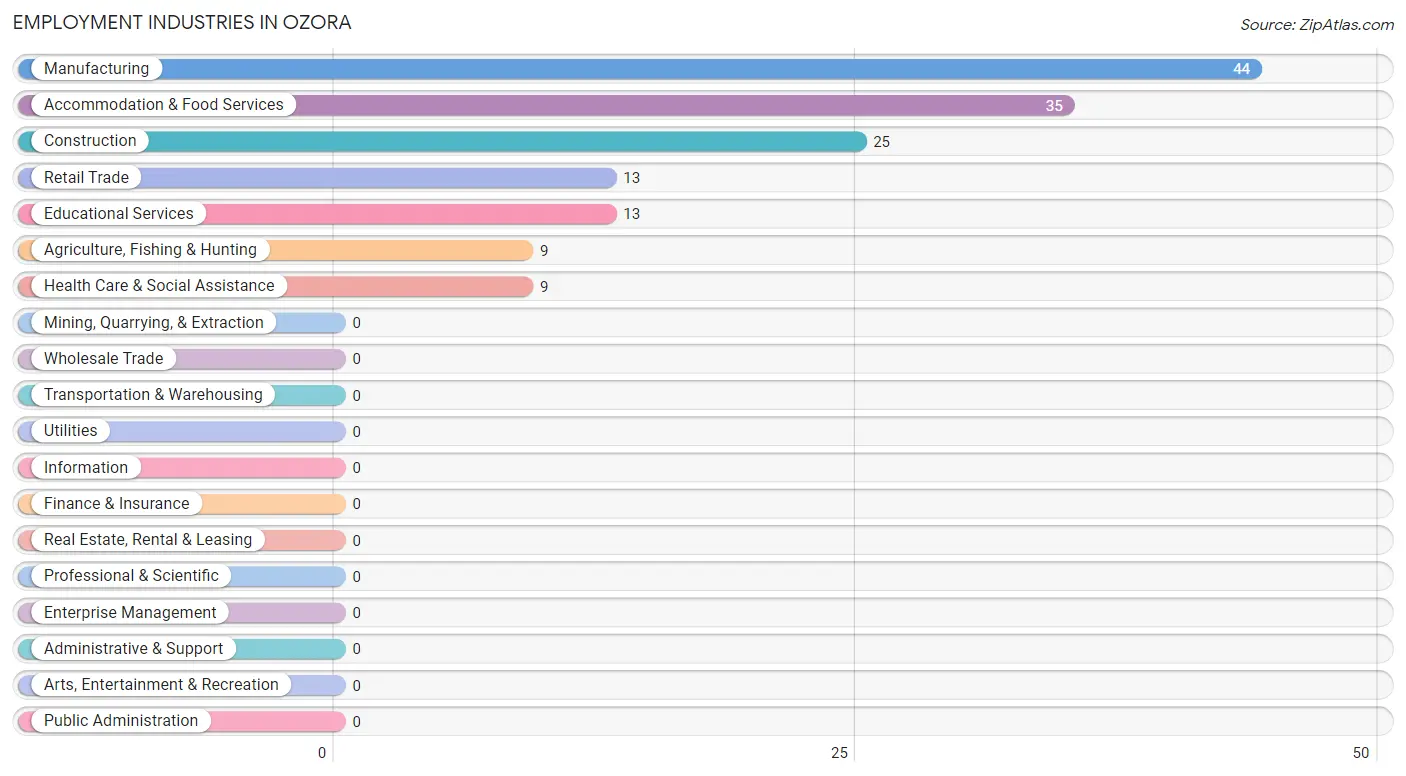
Employment Industries in Ozora
The major employment industries in Ozora include Manufacturing (44 | 28.2%), Accommodation & Food Services (35 | 22.4%), Construction (25 | 16.0%), Retail Trade (13 | 8.3%), and Educational Services (13 | 8.3%).
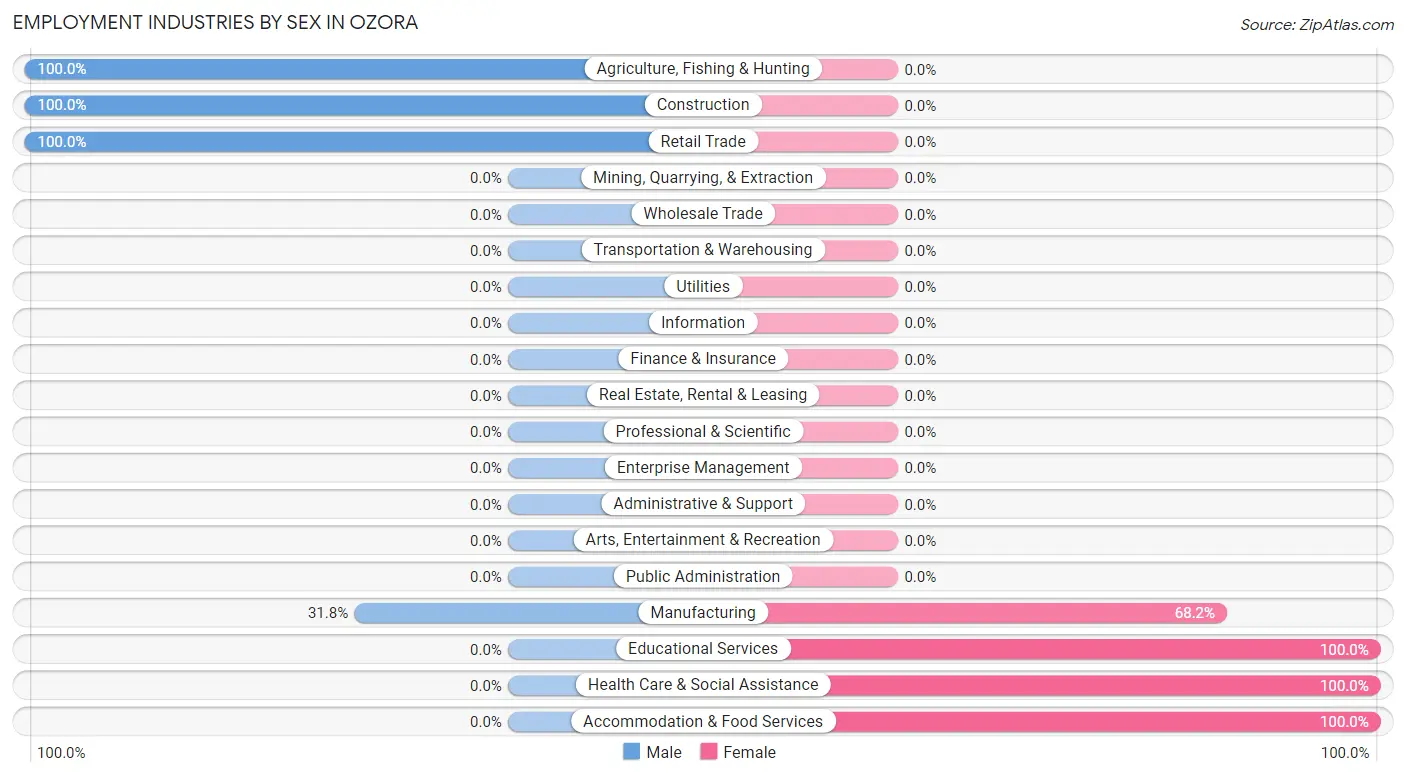
Employment Industries by Sex in Ozora
The Ozora industries that see more men than women are Agriculture, Fishing & Hunting (100.0%), Construction (100.0%), and Retail Trade (100.0%), whereas the industries that tend to have a higher number of women are Educational Services (100.0%), Health Care & Social Assistance (100.0%), and Accommodation & Food Services (100.0%).
| Industry | Male | Female |
| Agriculture, Fishing & Hunting | 9 (100.0%) | 0 (0.0%) |
| Mining, Quarrying, & Extraction | 0 (0.0%) | 0 (0.0%) |
| Construction | 25 (100.0%) | 0 (0.0%) |
| Manufacturing | 14 (31.8%) | 30 (68.2%) |
| Wholesale Trade | 0 (0.0%) | 0 (0.0%) |
| Retail Trade | 13 (100.0%) | 0 (0.0%) |
| Transportation & Warehousing | 0 (0.0%) | 0 (0.0%) |
| Utilities | 0 (0.0%) | 0 (0.0%) |
| Information | 0 (0.0%) | 0 (0.0%) |
| Finance & Insurance | 0 (0.0%) | 0 (0.0%) |
| Real Estate, Rental & Leasing | 0 (0.0%) | 0 (0.0%) |
| Professional & Scientific | 0 (0.0%) | 0 (0.0%) |
| Enterprise Management | 0 (0.0%) | 0 (0.0%) |
| Administrative & Support | 0 (0.0%) | 0 (0.0%) |
| Educational Services | 0 (0.0%) | 13 (100.0%) |
| Health Care & Social Assistance | 0 (0.0%) | 9 (100.0%) |
| Arts, Entertainment & Recreation | 0 (0.0%) | 0 (0.0%) |
| Accommodation & Food Services | 0 (0.0%) | 35 (100.0%) |
| Public Administration | 0 (0.0%) | 0 (0.0%) |
| Total | 61 (39.1%) | 95 (60.9%) |
Education in Ozora
School Enrollment in Ozora
The most common levels of schooling among the 140 students in Ozora are high school (95 | 67.9%), elementary school (24 | 17.1%), and college / undergraduate (11 | 7.9%).
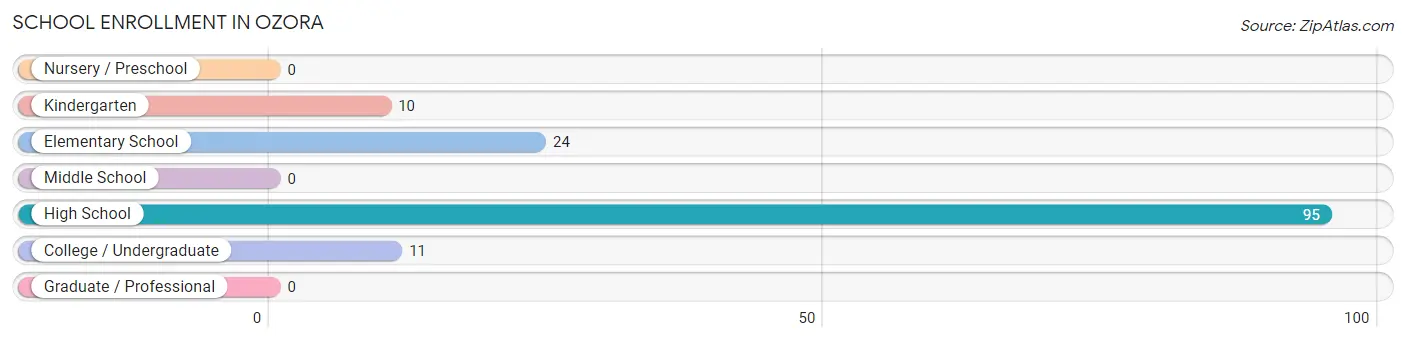
| School Level | # Students | % Students |
| Nursery / Preschool | 0 | 0.0% |
| Kindergarten | 10 | 7.1% |
| Elementary School | 24 | 17.1% |
| Middle School | 0 | 0.0% |
| High School | 95 | 67.9% |
| College / Undergraduate | 11 | 7.9% |
| Graduate / Professional | 0 | 0.0% |
| Total | 140 | 100.0% |
School Enrollment by Age by Funding Source in Ozora
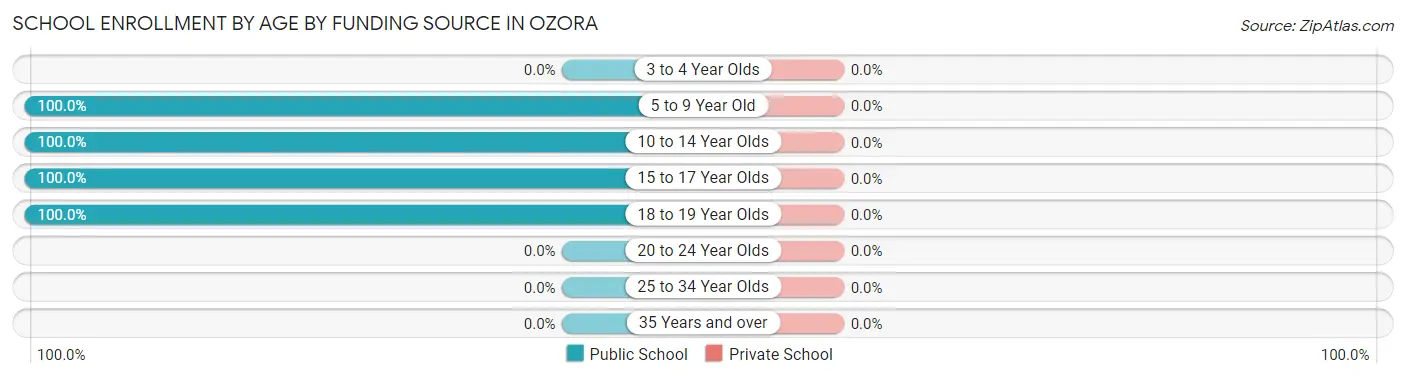
| Age Bracket | Public School | Private School |
| 3 to 4 Year Olds | 0 (0.0%) | 0 (0.0%) |
| 5 to 9 Year Old | 10 (100.0%) | 0 (0.0%) |
| 10 to 14 Year Olds | 24 (100.0%) | 0 (0.0%) |
| 15 to 17 Year Olds | 69 (100.0%) | 0 (0.0%) |
| 18 to 19 Year Olds | 37 (100.0%) | 0 (0.0%) |
| 20 to 24 Year Olds | 0 (0.0%) | 0 (0.0%) |
| 25 to 34 Year Olds | 0 (0.0%) | 0 (0.0%) |
| 35 Years and over | 0 (0.0%) | 0 (0.0%) |
| Total | 140 (100.0%) | 0 (0.0%) |
Educational Attainment by Field of Study in Ozora
Science & technology (14 | 56.0%), business (9 | 36.0%), and education (2 | 8.0%) are the most common fields of study among 25 individuals in Ozora who have obtained a bachelor's degree or higher.
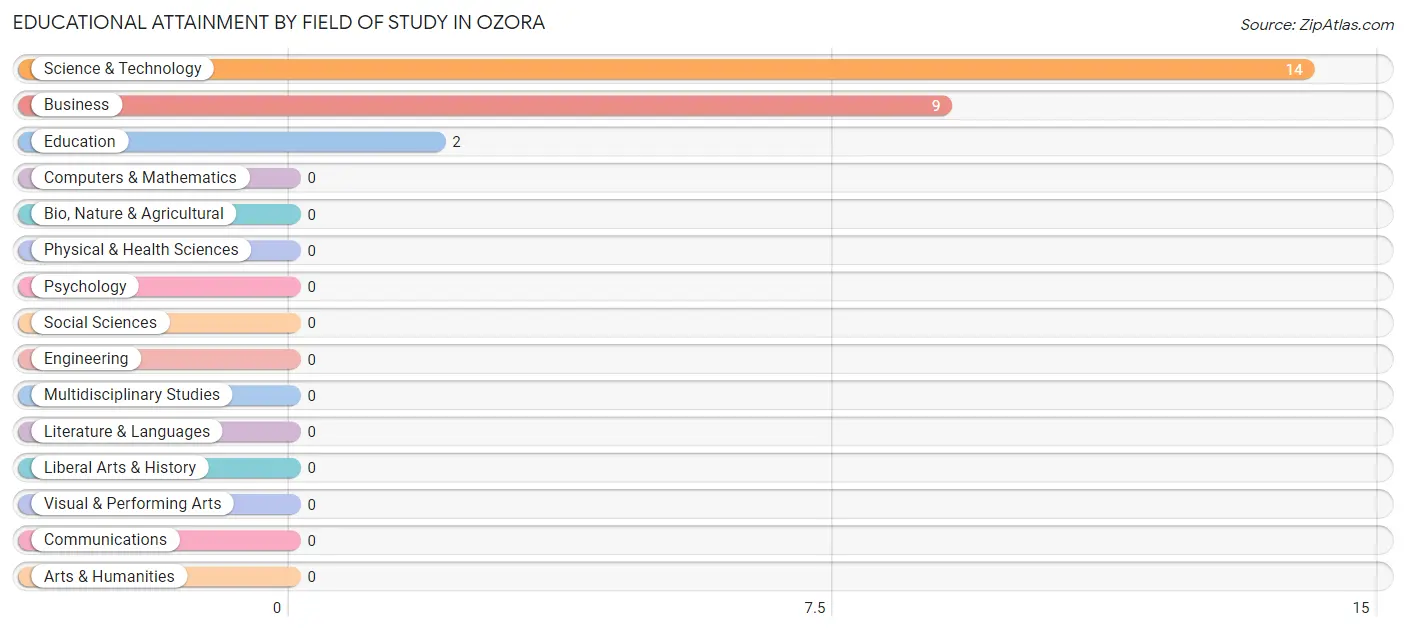
| Field of Study | # Graduates | % Graduates |
| Computers & Mathematics | 0 | 0.0% |
| Bio, Nature & Agricultural | 0 | 0.0% |
| Physical & Health Sciences | 0 | 0.0% |
| Psychology | 0 | 0.0% |
| Social Sciences | 0 | 0.0% |
| Engineering | 0 | 0.0% |
| Multidisciplinary Studies | 0 | 0.0% |
| Science & Technology | 14 | 56.0% |
| Business | 9 | 36.0% |
| Education | 2 | 8.0% |
| Literature & Languages | 0 | 0.0% |
| Liberal Arts & History | 0 | 0.0% |
| Visual & Performing Arts | 0 | 0.0% |
| Communications | 0 | 0.0% |
| Arts & Humanities | 0 | 0.0% |
| Total | 25 | 100.0% |
Transportation & Commute in Ozora
Vehicle Availability by Sex in Ozora
The most prevalent vehicle ownership categories in Ozora are males with 5 or more vehicles (52, accounting for 85.3%) and females with 5 or more vehicles (33, making up 55.3%).
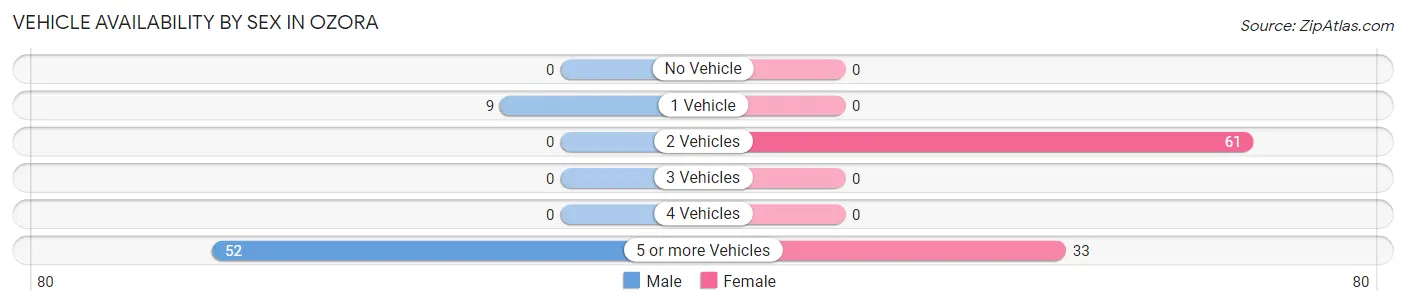
| Vehicles Available | Male | Female |
| No Vehicle | 0 (0.0%) | 0 (0.0%) |
| 1 Vehicle | 9 (14.7%) | 0 (0.0%) |
| 2 Vehicles | 0 (0.0%) | 61 (64.9%) |
| 3 Vehicles | 0 (0.0%) | 0 (0.0%) |
| 4 Vehicles | 0 (0.0%) | 0 (0.0%) |
| 5 or more Vehicles | 52 (85.3%) | 33 (35.1%) |
| Total | 61 (100.0%) | 94 (100.0%) |
Commute Time in Ozora
The most frequently occuring commute durations in Ozora are 15 to 19 minutes (40 commuters, 25.6%), 20 to 24 minutes (39 commuters, 25.0%), and 10 to 14 minutes (25 commuters, 16.0%).
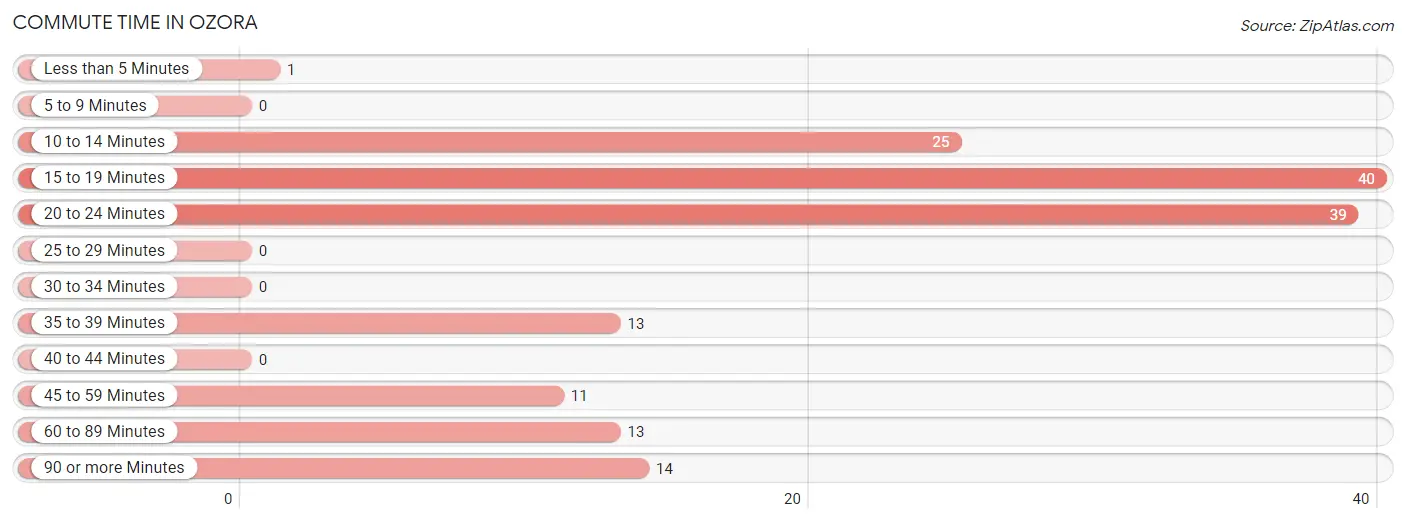
| Commute Time | # Commuters | % Commuters |
| Less than 5 Minutes | 1 | 0.6% |
| 5 to 9 Minutes | 0 | 0.0% |
| 10 to 14 Minutes | 25 | 16.0% |
| 15 to 19 Minutes | 40 | 25.6% |
| 20 to 24 Minutes | 39 | 25.0% |
| 25 to 29 Minutes | 0 | 0.0% |
| 30 to 34 Minutes | 0 | 0.0% |
| 35 to 39 Minutes | 13 | 8.3% |
| 40 to 44 Minutes | 0 | 0.0% |
| 45 to 59 Minutes | 11 | 7.0% |
| 60 to 89 Minutes | 13 | 8.3% |
| 90 or more Minutes | 14 | 9.0% |
Commute Time by Sex in Ozora
The most common commute times in Ozora are 10 to 14 minutes (25 commuters, 41.0%) for males and 15 to 19 minutes (40 commuters, 42.1%) for females.
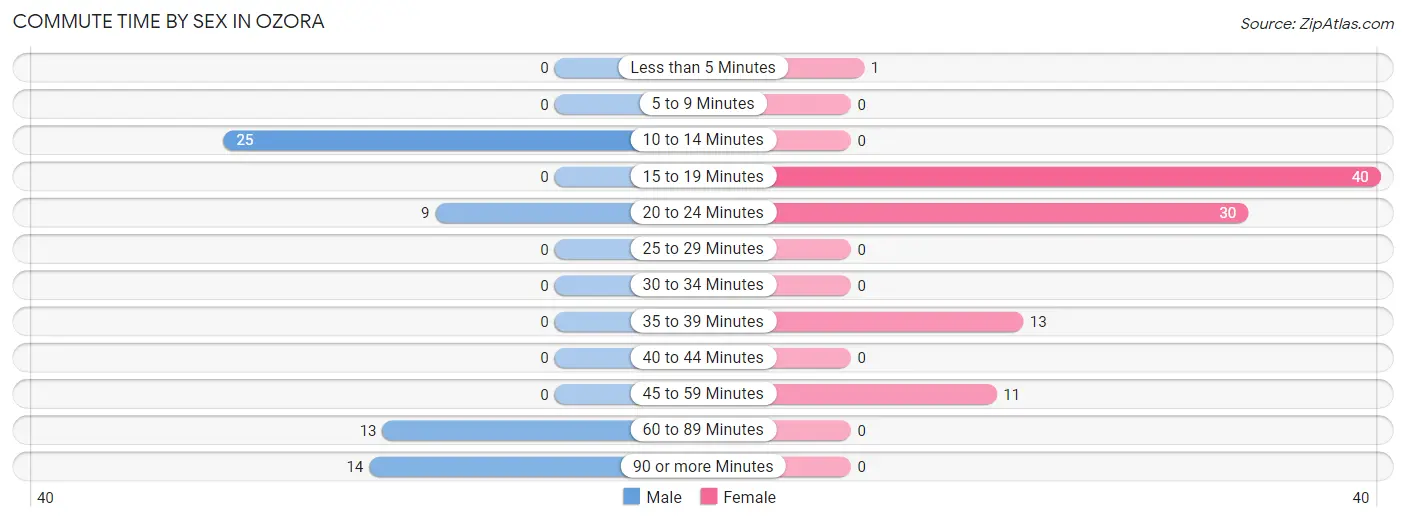
| Commute Time | Male | Female |
| Less than 5 Minutes | 0 (0.0%) | 1 (1.1%) |
| 5 to 9 Minutes | 0 (0.0%) | 0 (0.0%) |
| 10 to 14 Minutes | 25 (41.0%) | 0 (0.0%) |
| 15 to 19 Minutes | 0 (0.0%) | 40 (42.1%) |
| 20 to 24 Minutes | 9 (14.7%) | 30 (31.6%) |
| 25 to 29 Minutes | 0 (0.0%) | 0 (0.0%) |
| 30 to 34 Minutes | 0 (0.0%) | 0 (0.0%) |
| 35 to 39 Minutes | 0 (0.0%) | 13 (13.7%) |
| 40 to 44 Minutes | 0 (0.0%) | 0 (0.0%) |
| 45 to 59 Minutes | 0 (0.0%) | 11 (11.6%) |
| 60 to 89 Minutes | 13 (21.3%) | 0 (0.0%) |
| 90 or more Minutes | 14 (23.0%) | 0 (0.0%) |
Time of Departure to Work by Sex in Ozora
The most frequent times of departure to work in Ozora are 8:00 AM to 8:29 AM (25, 41.0%) for males and 5:30 AM to 5:59 AM (30, 31.6%) for females.
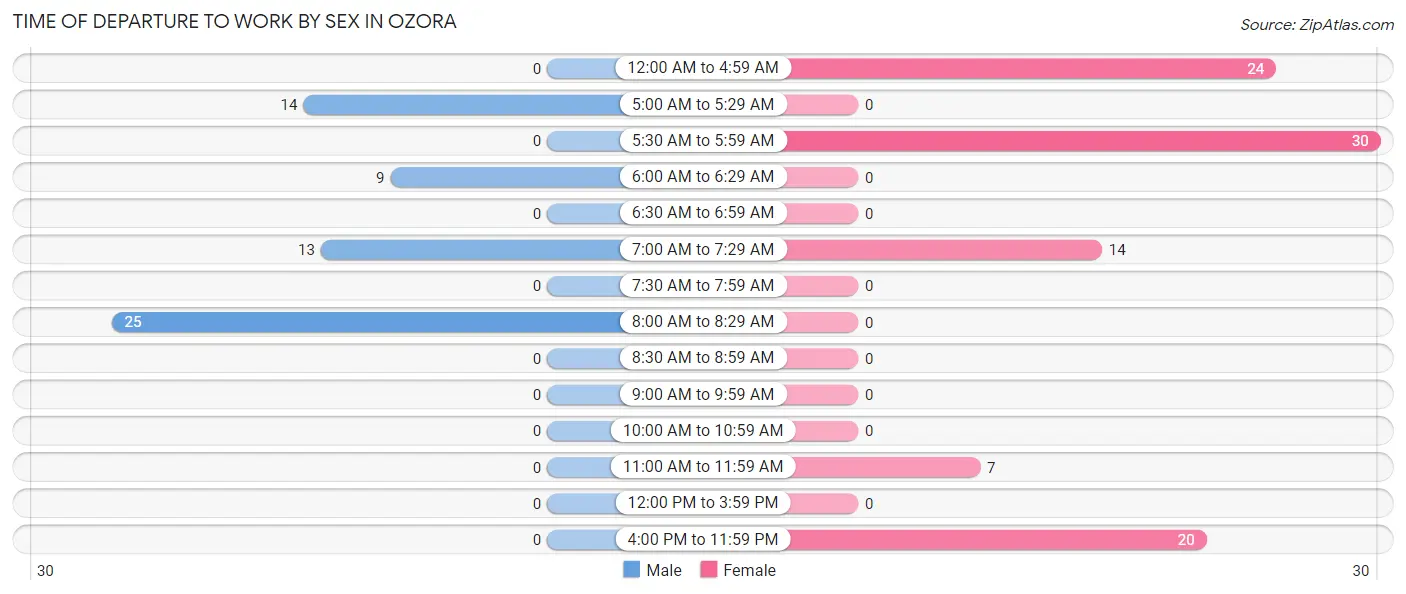
| Time of Departure | Male | Female |
| 12:00 AM to 4:59 AM | 0 (0.0%) | 24 (25.3%) |
| 5:00 AM to 5:29 AM | 14 (23.0%) | 0 (0.0%) |
| 5:30 AM to 5:59 AM | 0 (0.0%) | 30 (31.6%) |
| 6:00 AM to 6:29 AM | 9 (14.7%) | 0 (0.0%) |
| 6:30 AM to 6:59 AM | 0 (0.0%) | 0 (0.0%) |
| 7:00 AM to 7:29 AM | 13 (21.3%) | 14 (14.7%) |
| 7:30 AM to 7:59 AM | 0 (0.0%) | 0 (0.0%) |
| 8:00 AM to 8:29 AM | 25 (41.0%) | 0 (0.0%) |
| 8:30 AM to 8:59 AM | 0 (0.0%) | 0 (0.0%) |
| 9:00 AM to 9:59 AM | 0 (0.0%) | 0 (0.0%) |
| 10:00 AM to 10:59 AM | 0 (0.0%) | 0 (0.0%) |
| 11:00 AM to 11:59 AM | 0 (0.0%) | 7 (7.4%) |
| 12:00 PM to 3:59 PM | 0 (0.0%) | 0 (0.0%) |
| 4:00 PM to 11:59 PM | 0 (0.0%) | 20 (21.0%) |
| Total | 61 (100.0%) | 95 (100.0%) |
Housing Occupancy in Ozora
Occupancy by Ownership in Ozora
Of the total 84 dwellings in Ozora, owner-occupied units account for 54 (64.3%), while renter-occupied units make up 30 (35.7%).
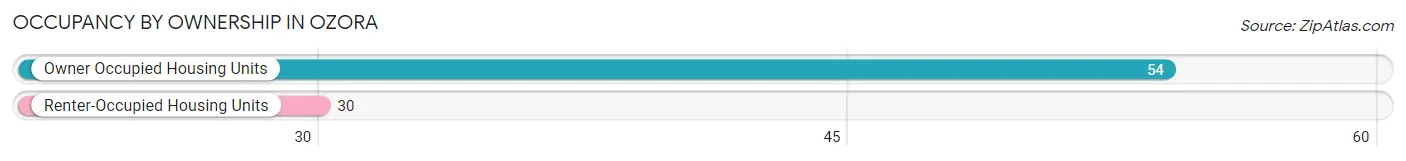
| Occupancy | # Housing Units | % Housing Units |
| Owner Occupied Housing Units | 54 | 64.3% |
| Renter-Occupied Housing Units | 30 | 35.7% |
| Total Occupied Housing Units | 84 | 100.0% |
Occupancy by Household Size in Ozora
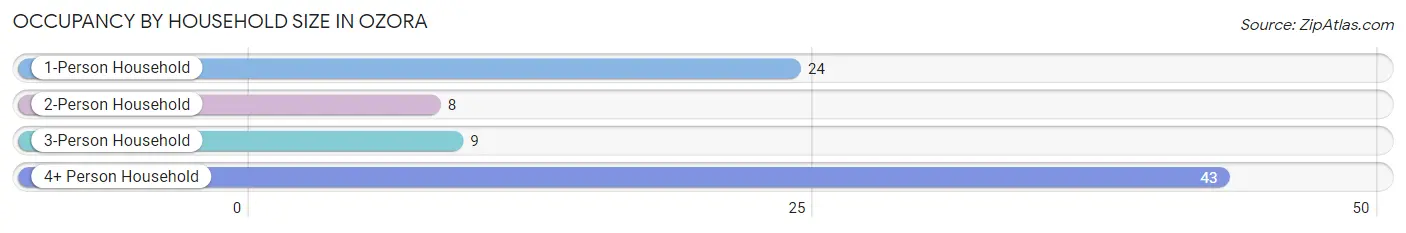
| Household Size | # Housing Units | % Housing Units |
| 1-Person Household | 24 | 28.6% |
| 2-Person Household | 8 | 9.5% |
| 3-Person Household | 9 | 10.7% |
| 4+ Person Household | 43 | 51.2% |
| Total Housing Units | 84 | 100.0% |
Occupancy by Ownership by Household Size in Ozora
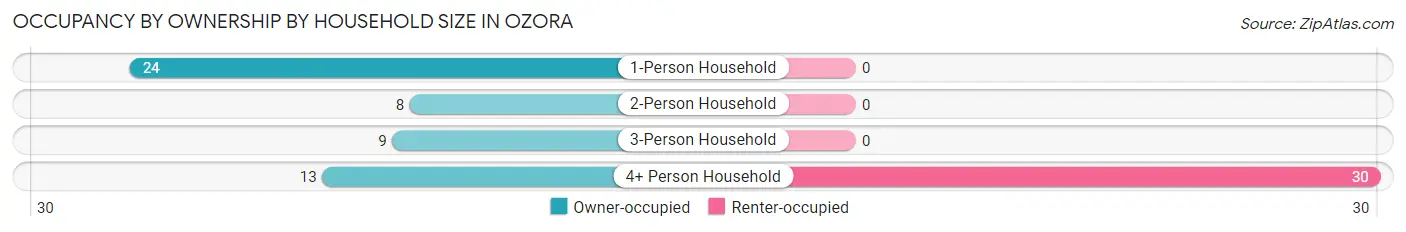
| Household Size | Owner-occupied | Renter-occupied |
| 1-Person Household | 24 (100.0%) | 0 (0.0%) |
| 2-Person Household | 8 (100.0%) | 0 (0.0%) |
| 3-Person Household | 9 (100.0%) | 0 (0.0%) |
| 4+ Person Household | 13 (30.2%) | 30 (69.8%) |
| Total Housing Units | 54 (64.3%) | 30 (35.7%) |
Occupancy by Educational Attainment in Ozora
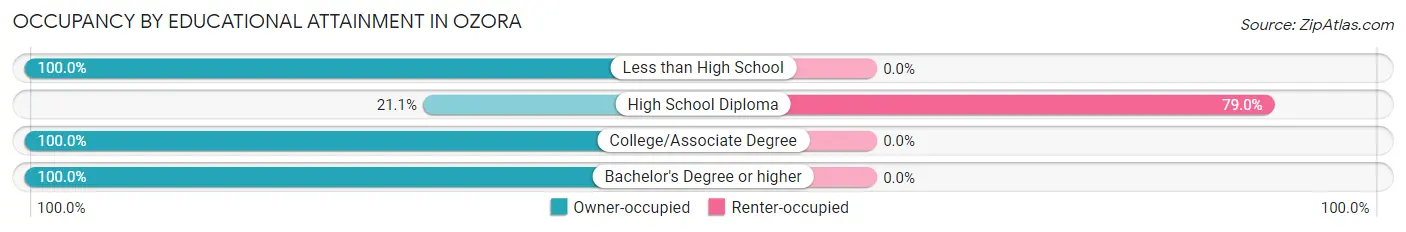
| Household Size | Owner-occupied | Renter-occupied |
| Less than High School | 15 (100.0%) | 0 (0.0%) |
| High School Diploma | 8 (21.0%) | 30 (78.9%) |
| College/Associate Degree | 9 (100.0%) | 0 (0.0%) |
| Bachelor's Degree or higher | 22 (100.0%) | 0 (0.0%) |
Occupancy by Age of Householder in Ozora
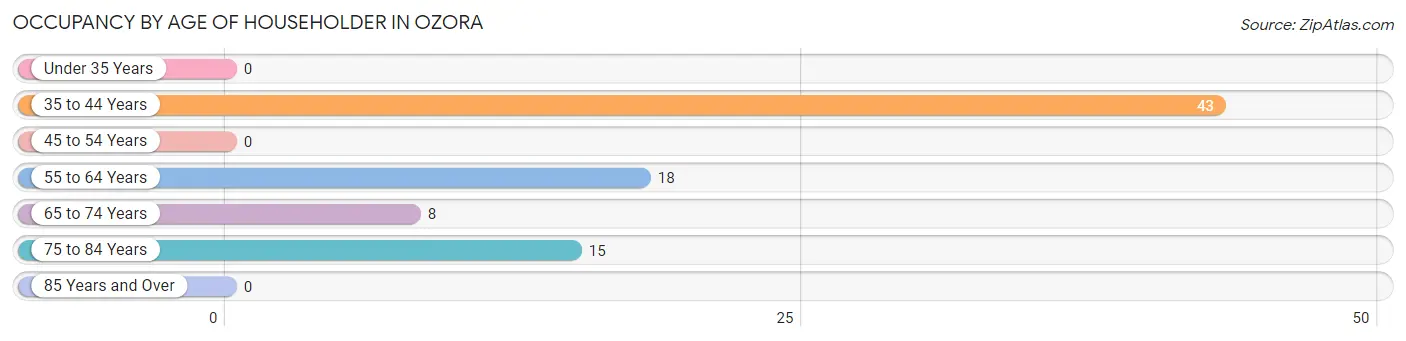
| Age Bracket | # Households | % Households |
| Under 35 Years | 0 | 0.0% |
| 35 to 44 Years | 43 | 51.2% |
| 45 to 54 Years | 0 | 0.0% |
| 55 to 64 Years | 18 | 21.4% |
| 65 to 74 Years | 8 | 9.5% |
| 75 to 84 Years | 15 | 17.9% |
| 85 Years and Over | 0 | 0.0% |
| Total | 84 | 100.0% |
Housing Finances in Ozora
Median Income by Occupancy in Ozora
| Occupancy Type | # Households | Median Income |
| Owner-Occupied | 54 (64.3%) | $0 |
| Renter-Occupied | 30 (35.7%) | $0 |
| Average | 84 (100.0%) | $0 |
Occupancy by Householder Income Bracket in Ozora
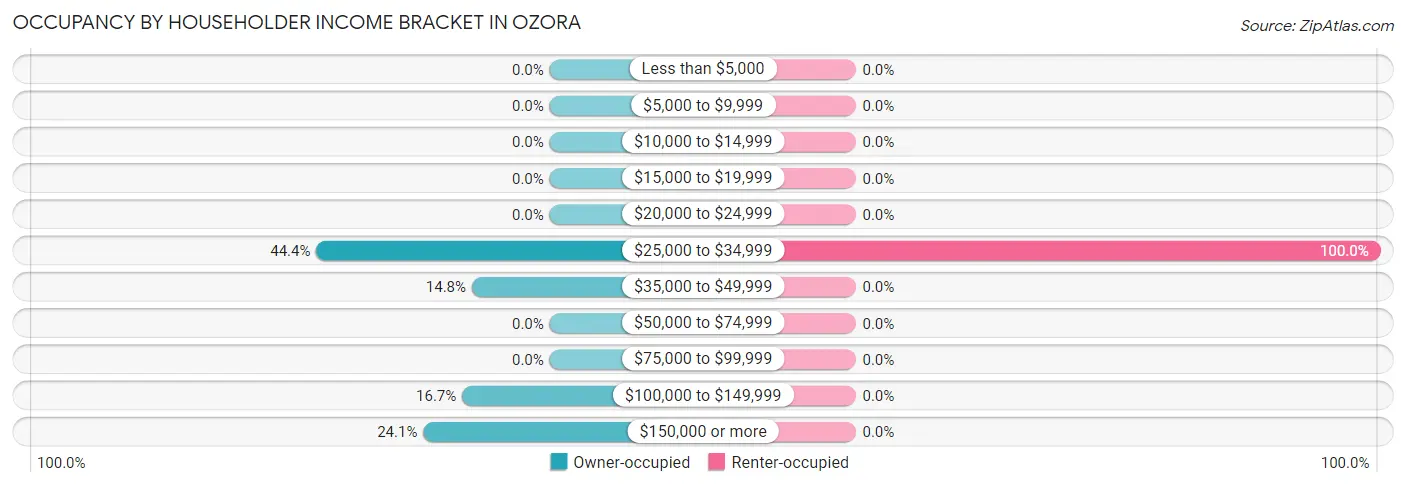
| Income Bracket | Owner-occupied | Renter-occupied |
| Less than $5,000 | 0 (0.0%) | 0 (0.0%) |
| $5,000 to $9,999 | 0 (0.0%) | 0 (0.0%) |
| $10,000 to $14,999 | 0 (0.0%) | 0 (0.0%) |
| $15,000 to $19,999 | 0 (0.0%) | 0 (0.0%) |
| $20,000 to $24,999 | 0 (0.0%) | 0 (0.0%) |
| $25,000 to $34,999 | 24 (44.4%) | 30 (100.0%) |
| $35,000 to $49,999 | 8 (14.8%) | 0 (0.0%) |
| $50,000 to $74,999 | 0 (0.0%) | 0 (0.0%) |
| $75,000 to $99,999 | 0 (0.0%) | 0 (0.0%) |
| $100,000 to $149,999 | 9 (16.7%) | 0 (0.0%) |
| $150,000 or more | 13 (24.1%) | 0 (0.0%) |
| Total | 54 (100.0%) | 30 (100.0%) |
Monthly Housing Cost Tiers in Ozora
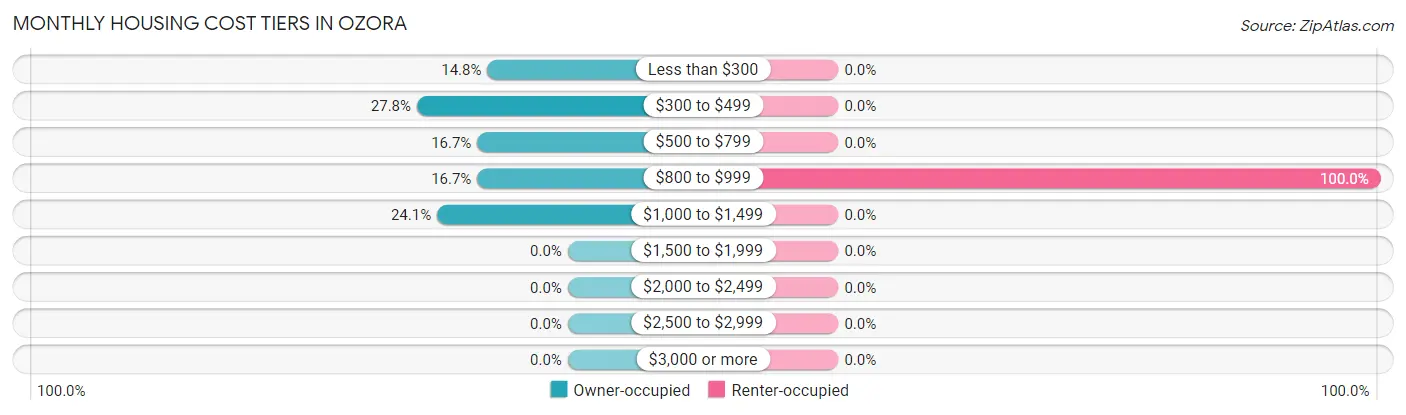
| Monthly Cost | Owner-occupied | Renter-occupied |
| Less than $300 | 8 (14.8%) | 0 (0.0%) |
| $300 to $499 | 15 (27.8%) | 0 (0.0%) |
| $500 to $799 | 9 (16.7%) | 0 (0.0%) |
| $800 to $999 | 9 (16.7%) | 30 (100.0%) |
| $1,000 to $1,499 | 13 (24.1%) | 0 (0.0%) |
| $1,500 to $1,999 | 0 (0.0%) | 0 (0.0%) |
| $2,000 to $2,499 | 0 (0.0%) | 0 (0.0%) |
| $2,500 to $2,999 | 0 (0.0%) | 0 (0.0%) |
| $3,000 or more | 0 (0.0%) | 0 (0.0%) |
| Total | 54 (100.0%) | 30 (100.0%) |
Physical Housing Characteristics in Ozora
Housing Structures in Ozora
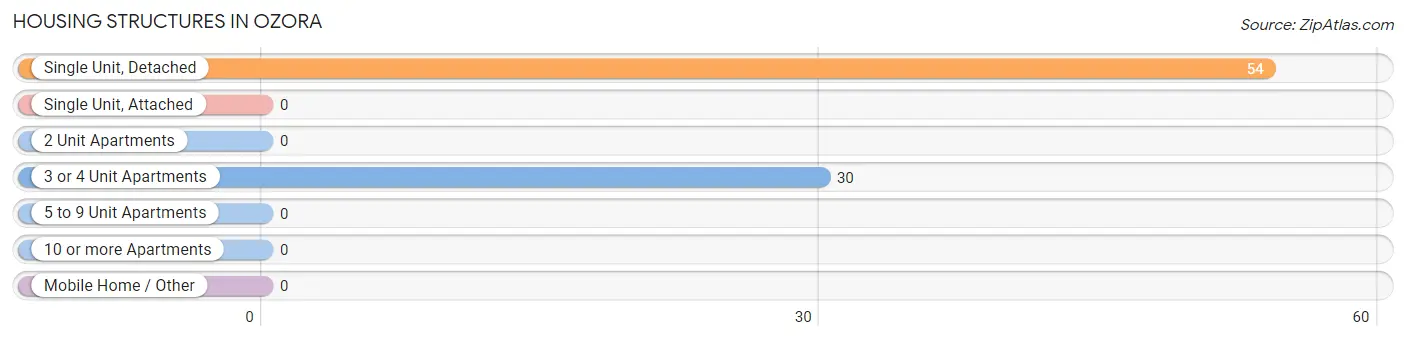
| Structure Type | # Housing Units | % Housing Units |
| Single Unit, Detached | 54 | 64.3% |
| Single Unit, Attached | 0 | 0.0% |
| 2 Unit Apartments | 0 | 0.0% |
| 3 or 4 Unit Apartments | 30 | 35.7% |
| 5 to 9 Unit Apartments | 0 | 0.0% |
| 10 or more Apartments | 0 | 0.0% |
| Mobile Home / Other | 0 | 0.0% |
| Total | 84 | 100.0% |
Housing Structures by Occupancy in Ozora
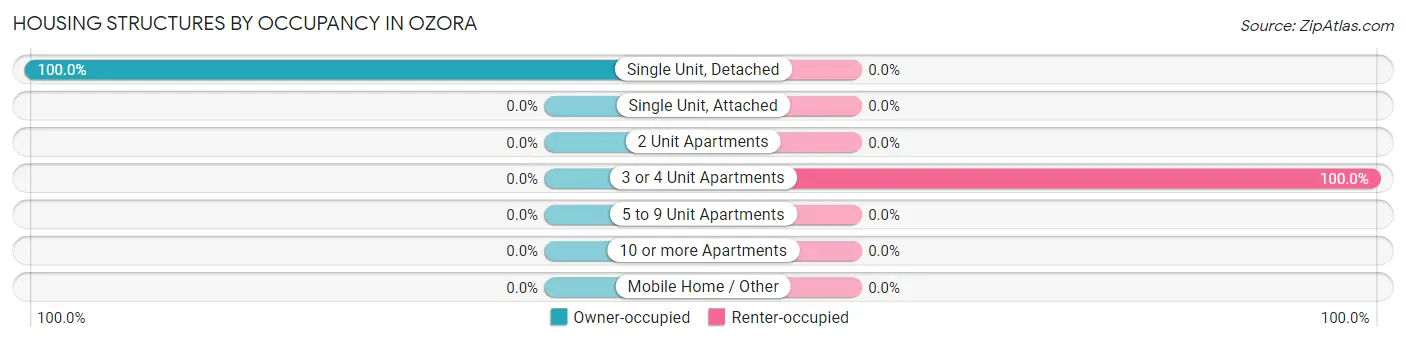
| Structure Type | Owner-occupied | Renter-occupied |
| Single Unit, Detached | 54 (100.0%) | 0 (0.0%) |
| Single Unit, Attached | 0 (0.0%) | 0 (0.0%) |
| 2 Unit Apartments | 0 (0.0%) | 0 (0.0%) |
| 3 or 4 Unit Apartments | 0 (0.0%) | 30 (100.0%) |
| 5 to 9 Unit Apartments | 0 (0.0%) | 0 (0.0%) |
| 10 or more Apartments | 0 (0.0%) | 0 (0.0%) |
| Mobile Home / Other | 0 (0.0%) | 0 (0.0%) |
| Total | 54 (64.3%) | 30 (35.7%) |
Housing Structures by Number of Rooms in Ozora
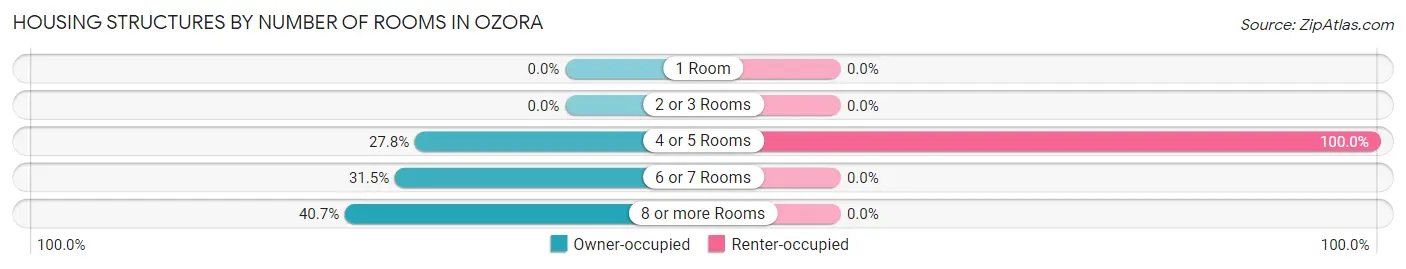
| Number of Rooms | Owner-occupied | Renter-occupied |
| 1 Room | 0 (0.0%) | 0 (0.0%) |
| 2 or 3 Rooms | 0 (0.0%) | 0 (0.0%) |
| 4 or 5 Rooms | 15 (27.8%) | 30 (100.0%) |
| 6 or 7 Rooms | 17 (31.5%) | 0 (0.0%) |
| 8 or more Rooms | 22 (40.7%) | 0 (0.0%) |
| Total | 54 (100.0%) | 30 (100.0%) |
Housing Structure by Heating Type in Ozora
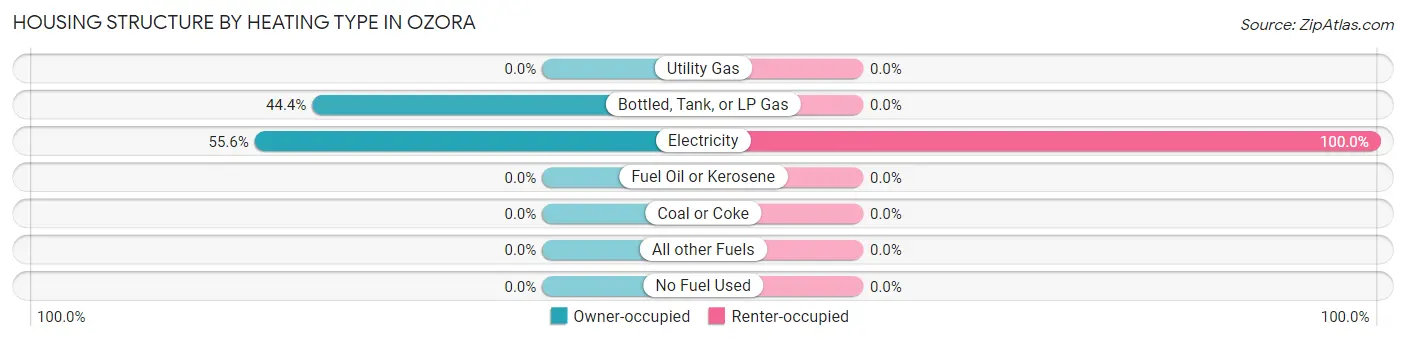
| Heating Type | Owner-occupied | Renter-occupied |
| Utility Gas | 0 (0.0%) | 0 (0.0%) |
| Bottled, Tank, or LP Gas | 24 (44.4%) | 0 (0.0%) |
| Electricity | 30 (55.6%) | 30 (100.0%) |
| Fuel Oil or Kerosene | 0 (0.0%) | 0 (0.0%) |
| Coal or Coke | 0 (0.0%) | 0 (0.0%) |
| All other Fuels | 0 (0.0%) | 0 (0.0%) |
| No Fuel Used | 0 (0.0%) | 0 (0.0%) |
| Total | 54 (100.0%) | 30 (100.0%) |
Household Vehicle Usage in Ozora
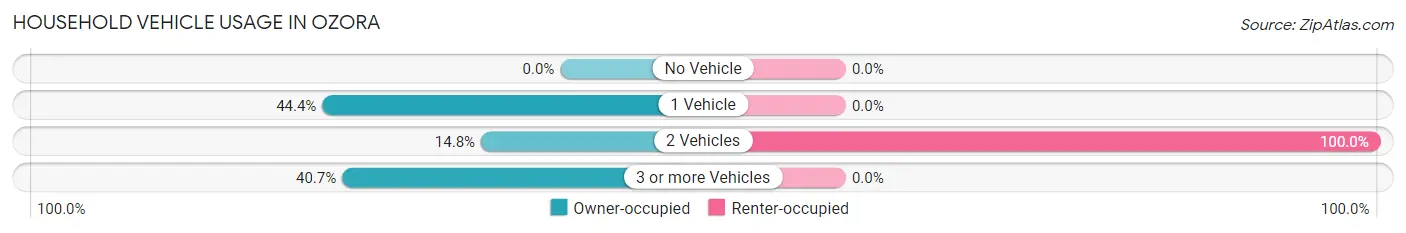
| Vehicles per Household | Owner-occupied | Renter-occupied |
| No Vehicle | 0 (0.0%) | 0 (0.0%) |
| 1 Vehicle | 24 (44.4%) | 0 (0.0%) |
| 2 Vehicles | 8 (14.8%) | 30 (100.0%) |
| 3 or more Vehicles | 22 (40.7%) | 0 (0.0%) |
| Total | 54 (100.0%) | 30 (100.0%) |
Real Estate & Mortgages in Ozora
Real Estate and Mortgage Overview in Ozora
| Characteristic | Without Mortgage | With Mortgage |
| Housing Units | 32 | 22 |
| Median Property Value | $116,700 | $0 |
| Median Household Income | $34,167 | $13 |
| Monthly Housing Costs | $377 | $0 |
| Real Estate Taxes | $825 | $0 |
Property Value by Mortgage Status in Ozora
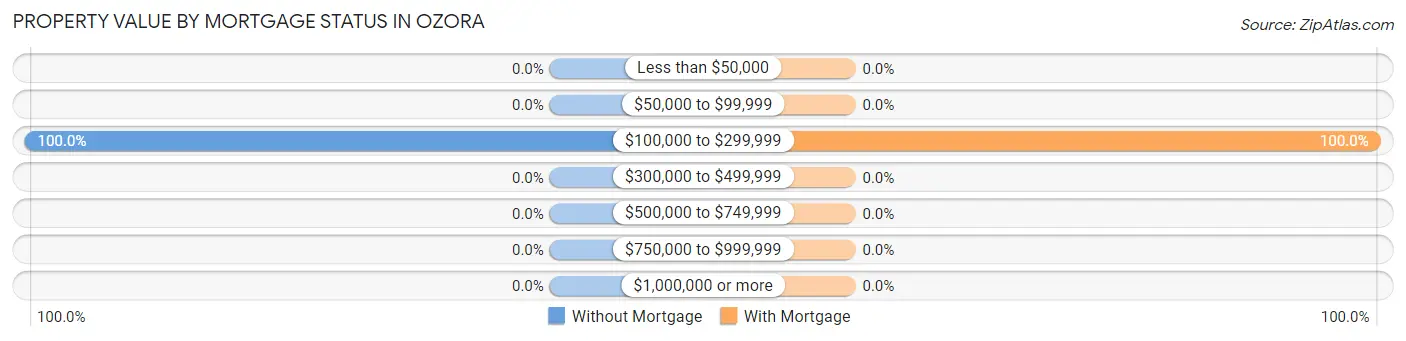
| Property Value | Without Mortgage | With Mortgage |
| Less than $50,000 | 0 (0.0%) | 0 (0.0%) |
| $50,000 to $99,999 | 0 (0.0%) | 0 (0.0%) |
| $100,000 to $299,999 | 32 (100.0%) | 22 (100.0%) |
| $300,000 to $499,999 | 0 (0.0%) | 0 (0.0%) |
| $500,000 to $749,999 | 0 (0.0%) | 0 (0.0%) |
| $750,000 to $999,999 | 0 (0.0%) | 0 (0.0%) |
| $1,000,000 or more | 0 (0.0%) | 0 (0.0%) |
| Total | 32 (100.0%) | 22 (100.0%) |
Household Income by Mortgage Status in Ozora
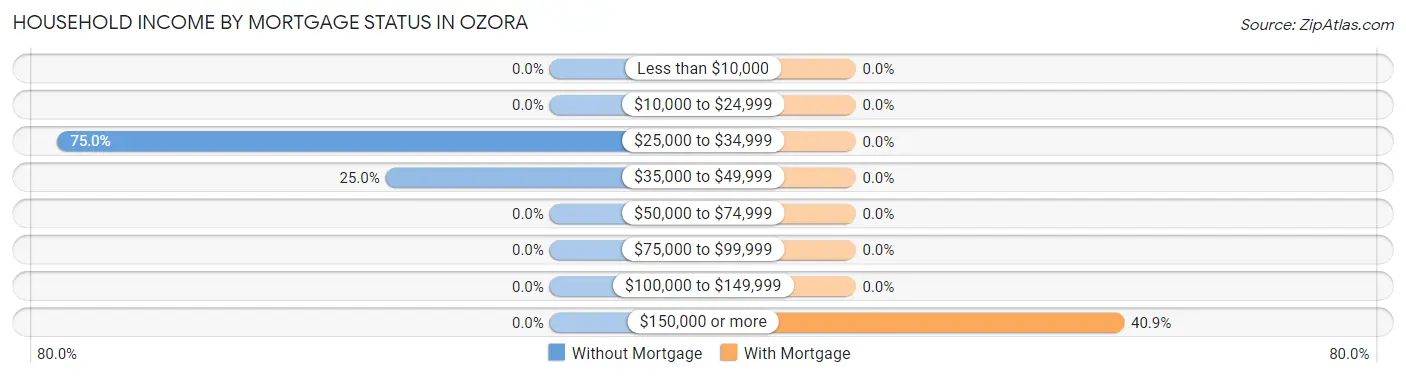
| Household Income | Without Mortgage | With Mortgage |
| Less than $10,000 | 0 (0.0%) | 0 (0.0%) |
| $10,000 to $24,999 | 0 (0.0%) | 0 (0.0%) |
| $25,000 to $34,999 | 24 (75.0%) | 0 (0.0%) |
| $35,000 to $49,999 | 8 (25.0%) | 0 (0.0%) |
| $50,000 to $74,999 | 0 (0.0%) | 0 (0.0%) |
| $75,000 to $99,999 | 0 (0.0%) | 0 (0.0%) |
| $100,000 to $149,999 | 0 (0.0%) | 0 (0.0%) |
| $150,000 or more | 0 (0.0%) | 9 (40.9%) |
| Total | 32 (100.0%) | 22 (100.0%) |
Property Value to Household Income Ratio in Ozora
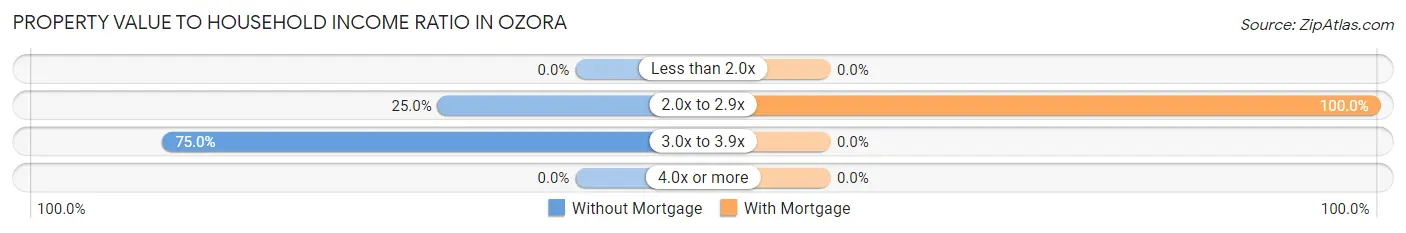
| Value-to-Income Ratio | Without Mortgage | With Mortgage |
| Less than 2.0x | 0 (0.0%) | 0 (0.0%) |
| 2.0x to 2.9x | 8 (25.0%) | 22 (100.0%) |
| 3.0x to 3.9x | 24 (75.0%) | 0 (0.0%) |
| 4.0x or more | 0 (0.0%) | 0 (0.0%) |
| Total | 32 (100.0%) | 22 (100.0%) |
Real Estate Taxes by Mortgage Status in Ozora
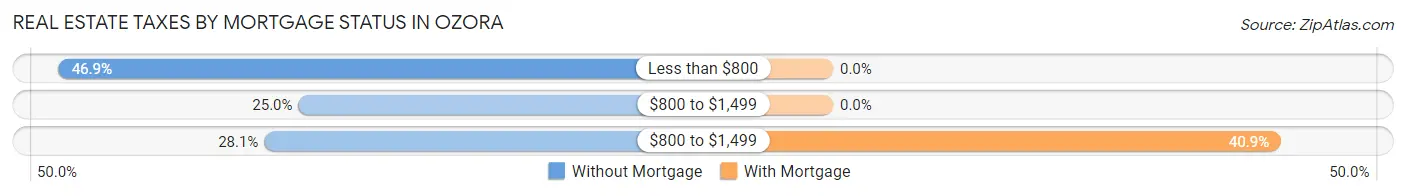
| Property Taxes | Without Mortgage | With Mortgage |
| Less than $800 | 15 (46.9%) | 0 (0.0%) |
| $800 to $1,499 | 8 (25.0%) | 0 (0.0%) |
| $800 to $1,499 | 9 (28.1%) | 9 (40.9%) |
| Total | 32 (100.0%) | 22 (100.0%) |
Health & Disability in Ozora
Health Insurance Coverage by Age in Ozora
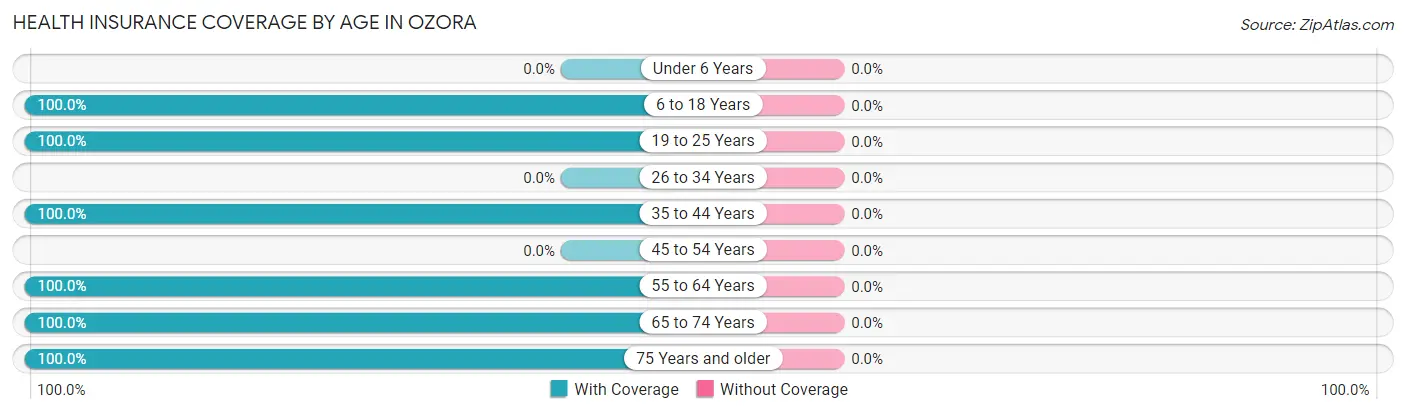
| Age Bracket | With Coverage | Without Coverage |
| Under 6 Years | 0 (0.0%) | 0 (0.0%) |
| 6 to 18 Years | 129 (100.0%) | 0 (0.0%) |
| 19 to 25 Years | 28 (100.0%) | 0 (0.0%) |
| 26 to 34 Years | 0 (0.0%) | 0 (0.0%) |
| 35 to 44 Years | 58 (100.0%) | 0 (0.0%) |
| 45 to 54 Years | 0 (0.0%) | 0 (0.0%) |
| 55 to 64 Years | 35 (100.0%) | 0 (0.0%) |
| 65 to 74 Years | 8 (100.0%) | 0 (0.0%) |
| 75 Years and older | 17 (100.0%) | 0 (0.0%) |
| Total | 275 (100.0%) | 0 (0.0%) |
Health Insurance Coverage by Citizenship Status in Ozora

| Citizenship Status | With Coverage | Without Coverage |
| Native Born | 0 (0.0%) | 0 (0.0%) |
| Foreign Born, Citizen | 129 (100.0%) | 0 (0.0%) |
| Foreign Born, not a Citizen | 28 (100.0%) | 0 (0.0%) |
Health Insurance Coverage by Household Income in Ozora
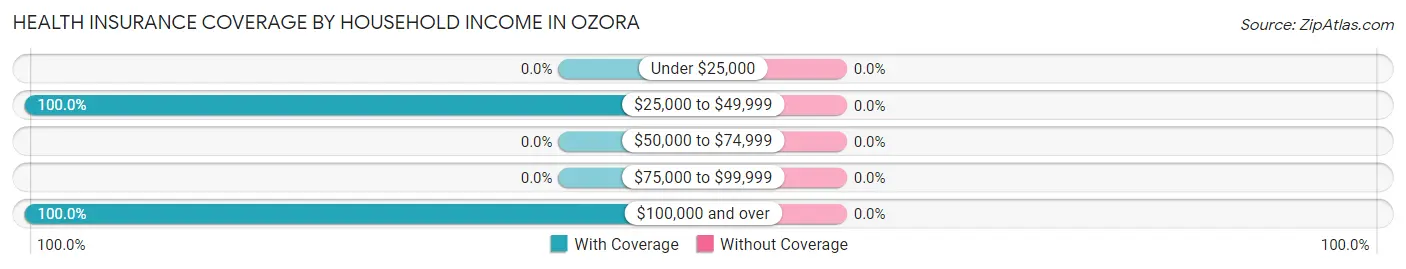
| Household Income | With Coverage | Without Coverage |
| Under $25,000 | 0 (0.0%) | 0 (0.0%) |
| $25,000 to $49,999 | 175 (100.0%) | 0 (0.0%) |
| $50,000 to $74,999 | 0 (0.0%) | 0 (0.0%) |
| $75,000 to $99,999 | 0 (0.0%) | 0 (0.0%) |
| $100,000 and over | 95 (100.0%) | 0 (0.0%) |
Public vs Private Health Insurance Coverage by Age in Ozora
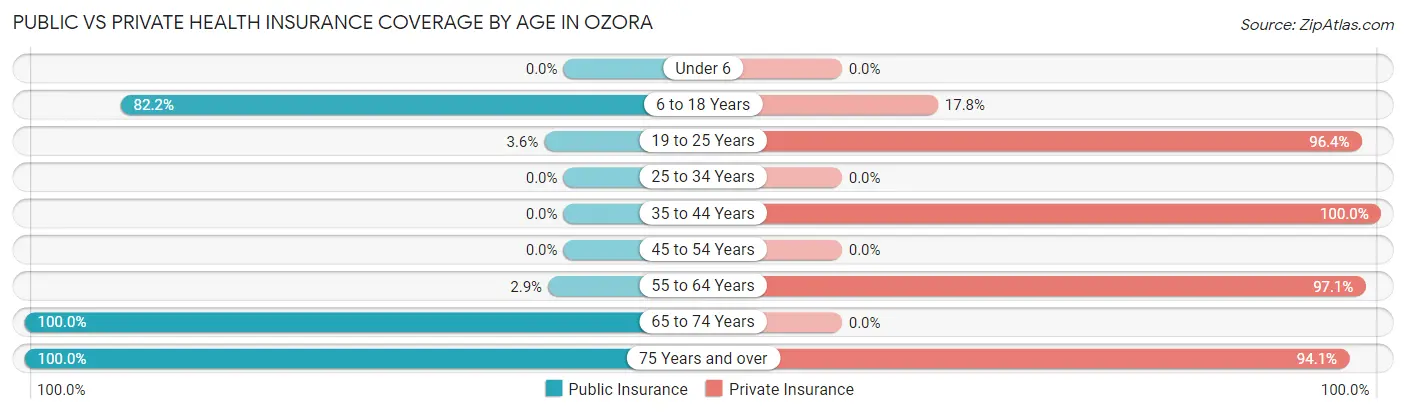
| Age Bracket | Public Insurance | Private Insurance |
| Under 6 | 0 (0.0%) | 0 (0.0%) |
| 6 to 18 Years | 106 (82.2%) | 23 (17.8%) |
| 19 to 25 Years | 1 (3.6%) | 27 (96.4%) |
| 25 to 34 Years | 0 (0.0%) | 0 (0.0%) |
| 35 to 44 Years | 0 (0.0%) | 58 (100.0%) |
| 45 to 54 Years | 0 (0.0%) | 0 (0.0%) |
| 55 to 64 Years | 1 (2.9%) | 34 (97.1%) |
| 65 to 74 Years | 8 (100.0%) | 0 (0.0%) |
| 75 Years and over | 17 (100.0%) | 16 (94.1%) |
| Total | 133 (48.4%) | 158 (57.5%) |
Disability Status by Sex by Age in Ozora
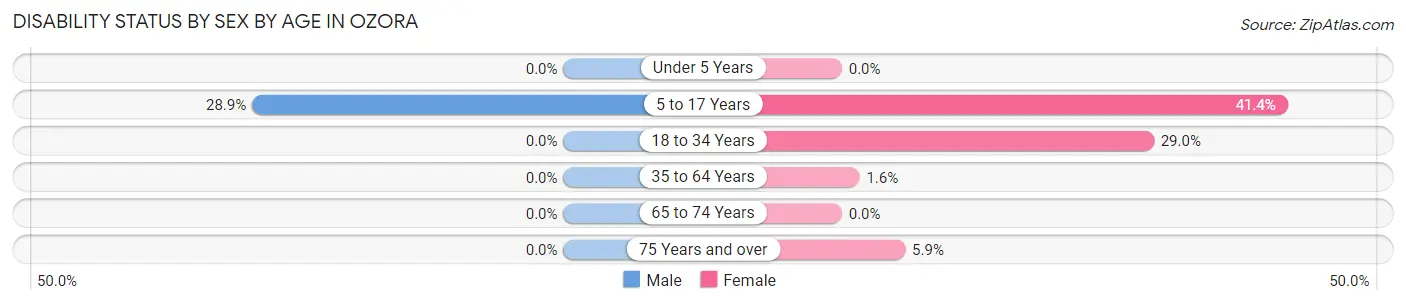
| Age Bracket | Male | Female |
| Under 5 Years | 0 (0.0%) | 0 (0.0%) |
| 5 to 17 Years | 13 (28.9%) | 24 (41.4%) |
| 18 to 34 Years | 0 (0.0%) | 11 (28.9%) |
| 35 to 64 Years | 0 (0.0%) | 1 (1.6%) |
| 65 to 74 Years | 0 (0.0%) | 0 (0.0%) |
| 75 Years and over | 0 (0.0%) | 1 (5.9%) |
Disability Class by Sex by Age in Ozora
Disability Class: Hearing Difficulty
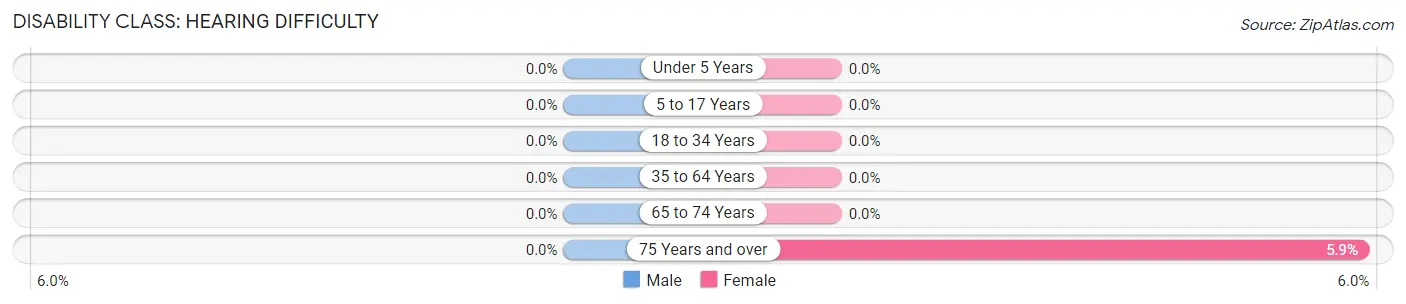
| Age Bracket | Male | Female |
| Under 5 Years | 0 (0.0%) | 0 (0.0%) |
| 5 to 17 Years | 0 (0.0%) | 0 (0.0%) |
| 18 to 34 Years | 0 (0.0%) | 0 (0.0%) |
| 35 to 64 Years | 0 (0.0%) | 0 (0.0%) |
| 65 to 74 Years | 0 (0.0%) | 0 (0.0%) |
| 75 Years and over | 0 (0.0%) | 1 (5.9%) |
Disability Class: Vision Difficulty
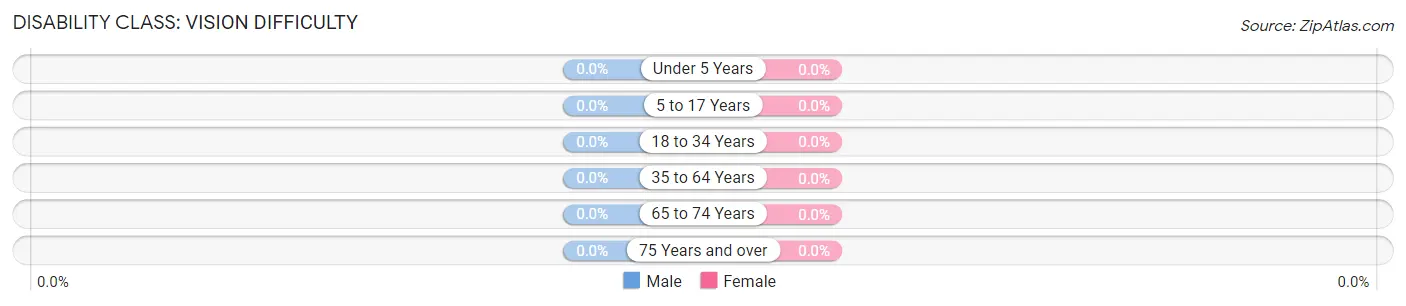
| Age Bracket | Male | Female |
| Under 5 Years | 0 (0.0%) | 0 (0.0%) |
| 5 to 17 Years | 0 (0.0%) | 0 (0.0%) |
| 18 to 34 Years | 0 (0.0%) | 0 (0.0%) |
| 35 to 64 Years | 0 (0.0%) | 0 (0.0%) |
| 65 to 74 Years | 0 (0.0%) | 0 (0.0%) |
| 75 Years and over | 0 (0.0%) | 0 (0.0%) |
Disability Class: Cognitive Difficulty
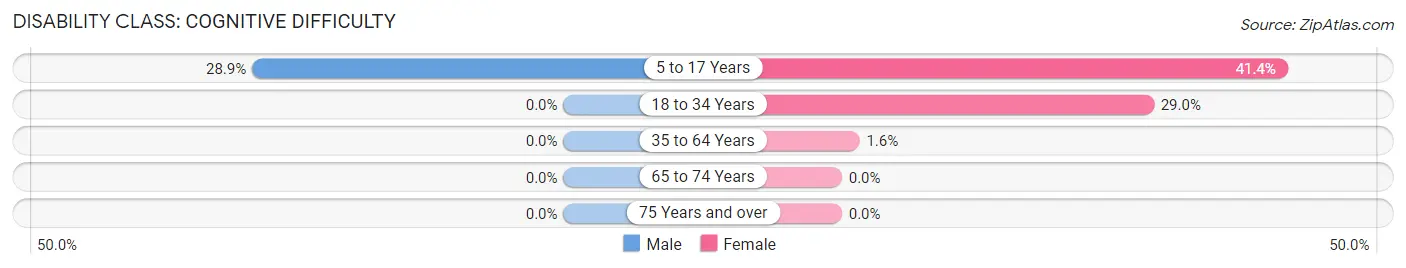
| Age Bracket | Male | Female |
| 5 to 17 Years | 13 (28.9%) | 24 (41.4%) |
| 18 to 34 Years | 0 (0.0%) | 11 (28.9%) |
| 35 to 64 Years | 0 (0.0%) | 1 (1.6%) |
| 65 to 74 Years | 0 (0.0%) | 0 (0.0%) |
| 75 Years and over | 0 (0.0%) | 0 (0.0%) |
Disability Class: Ambulatory Difficulty
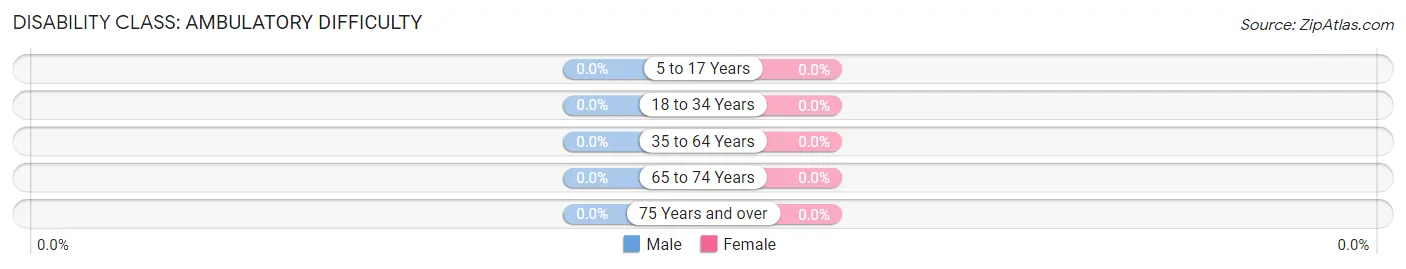
| Age Bracket | Male | Female |
| 5 to 17 Years | 0 (0.0%) | 0 (0.0%) |
| 18 to 34 Years | 0 (0.0%) | 0 (0.0%) |
| 35 to 64 Years | 0 (0.0%) | 0 (0.0%) |
| 65 to 74 Years | 0 (0.0%) | 0 (0.0%) |
| 75 Years and over | 0 (0.0%) | 0 (0.0%) |
Disability Class: Self-Care Difficulty
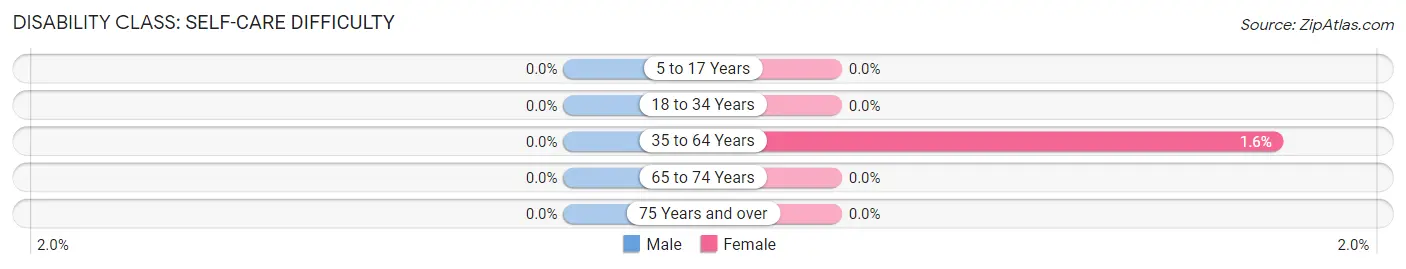
| Age Bracket | Male | Female |
| 5 to 17 Years | 0 (0.0%) | 0 (0.0%) |
| 18 to 34 Years | 0 (0.0%) | 0 (0.0%) |
| 35 to 64 Years | 0 (0.0%) | 1 (1.6%) |
| 65 to 74 Years | 0 (0.0%) | 0 (0.0%) |
| 75 Years and over | 0 (0.0%) | 0 (0.0%) |
Technology Access in Ozora
Computing Device Access in Ozora
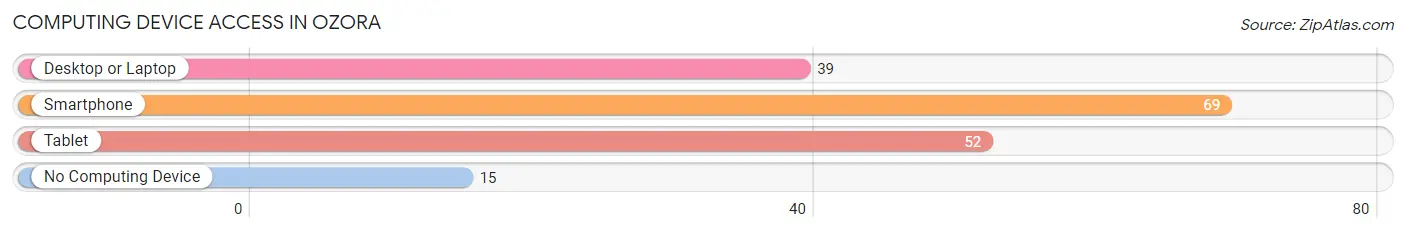
| Device Type | # Households | % Households |
| Desktop or Laptop | 39 | 46.4% |
| Smartphone | 69 | 82.1% |
| Tablet | 52 | 61.9% |
| No Computing Device | 15 | 17.9% |
| Total | 84 | 100.0% |
Internet Access in Ozora
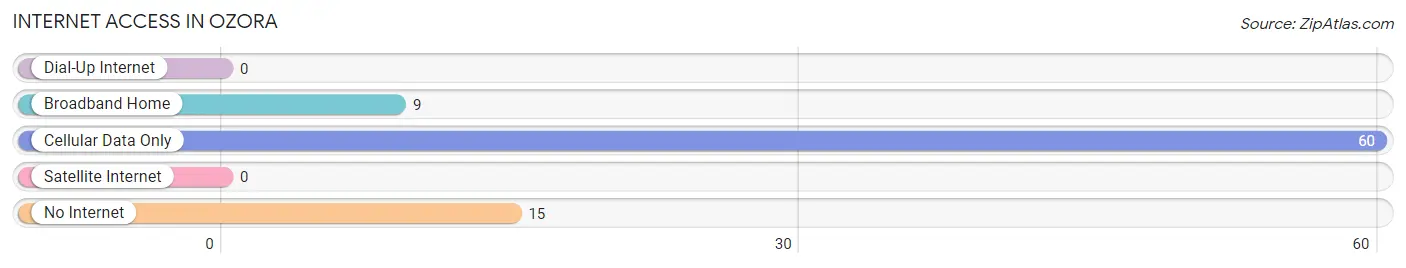
| Internet Type | # Households | % Households |
| Dial-Up Internet | 0 | 0.0% |
| Broadband Home | 9 | 10.7% |
| Cellular Data Only | 60 | 71.4% |
| Satellite Internet | 0 | 0.0% |
| No Internet | 15 | 17.9% |
| Total | 84 | 100.0% |
Ozora Summary
Ozora, Missouri is a small town located in the southeastern corner of the state, in Stoddard County. It is situated on the banks of the Castor River, and is surrounded by rolling hills and farmland. Ozora has a population of just over 500 people, and is a rural community with a strong sense of community and pride.
History
Ozora was founded in 1883 by a group of settlers from the Ozark region of Missouri. The town was named after the nearby Ozark Mountains, and was originally a farming community. The town grew slowly, and by the early 1900s, it had a population of around 200 people.
In the 1920s, Ozora began to experience a period of growth and prosperity. The town was home to several businesses, including a general store, a blacksmith shop, a sawmill, and a grist mill. The town also had a school, a post office, and a church.
In the 1950s, Ozora began to decline. The population dropped to just over 100 people, and many of the businesses closed. The town was in danger of becoming a ghost town, but in the late 1970s, the town began to experience a resurgence. New businesses opened, and the population began to grow again.
Geography
Ozora is located in the southeastern corner of Missouri, in Stoddard County. It is situated on the banks of the Castor River, and is surrounded by rolling hills and farmland. The town is located about 25 miles from the Arkansas border, and is about an hour and a half drive from St. Louis.
The climate in Ozora is humid subtropical, with hot, humid summers and mild winters. The average annual temperature is around 60 degrees Fahrenheit, and the average annual precipitation is around 40 inches.
Economy
Ozora’s economy is largely based on agriculture. The town is home to several farms, and the surrounding area is known for its production of soybeans, corn, and cotton. The town also has a few small businesses, including a general store, a hardware store, and a restaurant.
Demographics
As of the 2010 census, Ozora had a population of 517 people. The racial makeup of the town was 97.3% White, 0.6% African American, 0.2% Native American, 0.2% Asian, and 1.7% from other races. The median household income was $31,250, and the median family income was $37,500.
Ozora is a small, rural town with a strong sense of community and pride. The town is home to a diverse population, and is a great place to live and raise a family.
Common Questions
What is Per Capita Income in Ozora?
Per Capita income in Ozora is $21,867.
What is Income or Wage Gap in Ozora?
Income or Wage Gap in Ozora is 47.5%.
Women in Ozora earn 52.5 cents for every dollar earned by a man.
What is Inequality or Gini Index in Ozora?
Inequality or Gini Index in Ozora is 0.41.
What is the Total Population of Ozora?
Total Population of Ozora is 275.
What is the Total Male Population of Ozora?
Total Male Population of Ozora is 101.
What is the Total Female Population of Ozora?
Total Female Population of Ozora is 174.
What is the Ratio of Males per 100 Females in Ozora?
There are 58.05 Males per 100 Females in Ozora.
What is the Ratio of Females per 100 Males in Ozora?
There are 172.28 Females per 100 Males in Ozora.
What is the Median Population Age in Ozora?
Median Population Age in Ozora is 19.8 Years.
What is the Average Family Size in Ozora
Average Family Size in Ozora is 4.1 People.
What is the Average Household Size in Ozora
Average Household Size in Ozora is 3.2 People.
How Large is the Labor Force in Ozora?
There are 156 People in the Labor Forcein in Ozora.
What is the Percentage of People in the Labor Force in Ozora?
74.6% of People are in the Labor Force in Ozora.