Bassett, KS Map & Demographics
Bassett Map
Bassett Overview
$33,378
PER CAPITA INCOME
0.32
INEQUALITY / GINI INDEX
23
TOTAL POPULATION
12
MALE POPULATION
11
FEMALE POPULATION
109.09
MALES / 100 FEMALES
91.67
FEMALES / 100 MALES
49.3
MEDIAN AGE
3.8
AVG FAMILY SIZE
3.8
AVG HOUSEHOLD SIZE
13
LABOR FORCE [ PEOPLE ]
59.1%
PERCENT IN LABOR FORCE
30.8%
UNEMPLOYMENT RATE
Income in Bassett
Income Overview in Bassett
| Characteristic | Number | Measure |
| Per Capita Income | 23 | $33,378 |
| Median Family Income | 6 | $0 |
| Mean Family Income | 6 | $95,183 |
| Median Household Income | 6 | $0 |
| Mean Household Income | 6 | $95,183 |
| Income Deficit | 6 | $0 |
| Wage / Income Gap (%) | 23 | 0.00% |
| Wage / Income Gap ($) | 23 | 100.00¢ per $1 |
| Gini / Inequality Index | 23 | 0.32 |
Earnings by Sex in Bassett
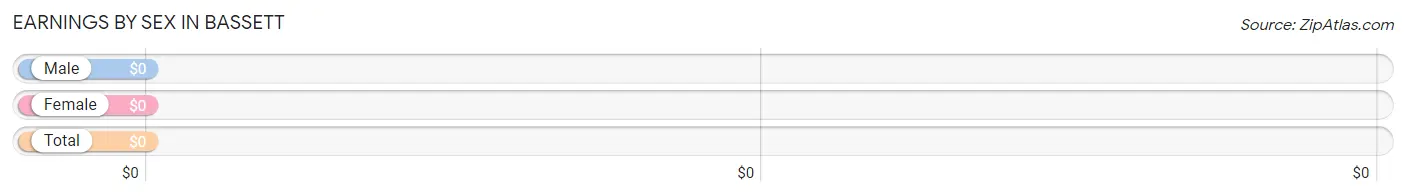
| Sex | Number | Average Earnings |
| Male | 5 (41.7%) | $0 |
| Female | 7 (58.3%) | $0 |
| Total | 12 (100.0%) | $0 |
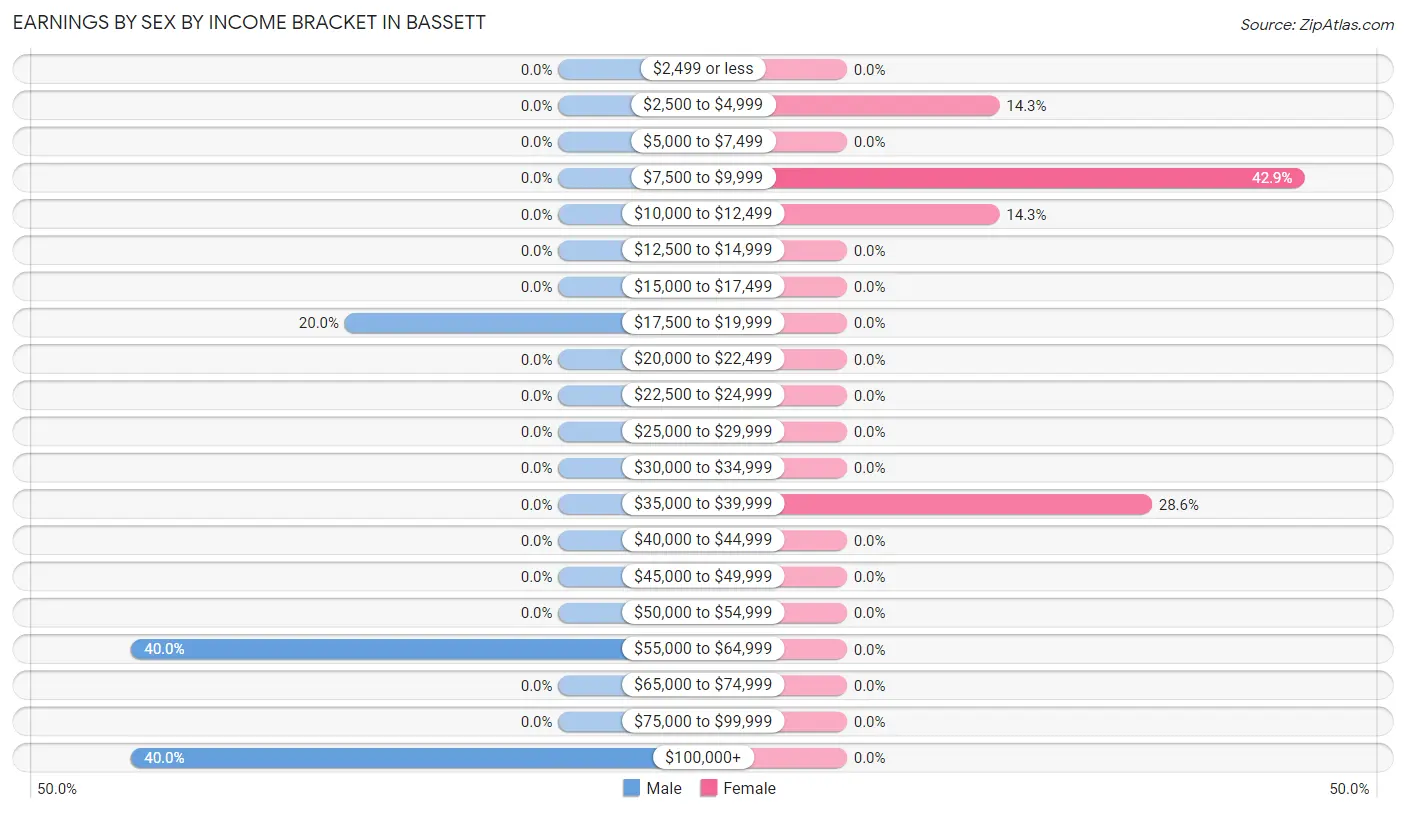
Earnings by Sex by Income Bracket in Bassett
The most common earnings brackets in Bassett are $55,000 to $64,999 for men (2 | 40.0%) and $7,500 to $9,999 for women (3 | 42.9%).
| Income | Male | Female |
| $2,499 or less | 0 (0.0%) | 0 (0.0%) |
| $2,500 to $4,999 | 0 (0.0%) | 1 (14.3%) |
| $5,000 to $7,499 | 0 (0.0%) | 0 (0.0%) |
| $7,500 to $9,999 | 0 (0.0%) | 3 (42.9%) |
| $10,000 to $12,499 | 0 (0.0%) | 1 (14.3%) |
| $12,500 to $14,999 | 0 (0.0%) | 0 (0.0%) |
| $15,000 to $17,499 | 0 (0.0%) | 0 (0.0%) |
| $17,500 to $19,999 | 1 (20.0%) | 0 (0.0%) |
| $20,000 to $22,499 | 0 (0.0%) | 0 (0.0%) |
| $22,500 to $24,999 | 0 (0.0%) | 0 (0.0%) |
| $25,000 to $29,999 | 0 (0.0%) | 0 (0.0%) |
| $30,000 to $34,999 | 0 (0.0%) | 0 (0.0%) |
| $35,000 to $39,999 | 0 (0.0%) | 2 (28.6%) |
| $40,000 to $44,999 | 0 (0.0%) | 0 (0.0%) |
| $45,000 to $49,999 | 0 (0.0%) | 0 (0.0%) |
| $50,000 to $54,999 | 0 (0.0%) | 0 (0.0%) |
| $55,000 to $64,999 | 2 (40.0%) | 0 (0.0%) |
| $65,000 to $74,999 | 0 (0.0%) | 0 (0.0%) |
| $75,000 to $99,999 | 0 (0.0%) | 0 (0.0%) |
| $100,000+ | 2 (40.0%) | 0 (0.0%) |
| Total | 5 (100.0%) | 7 (100.0%) |
Earnings by Sex by Educational Attainment in Bassett
| Educational Attainment | Male Income | Female Income |
| Less than High School | - | - |
| High School Diploma | - | - |
| College or Associate's Degree | - | - |
| Bachelor's Degree | - | - |
| Graduate Degree | - | - |
| Total | - | - |
Family Income in Bassett
Family Income Brackets in Bassett
According to the Bassett family income data, there are 2 families falling into the $35,000 to $49,999 income range, which is the most common income bracket and makes up 33.3% of all families.
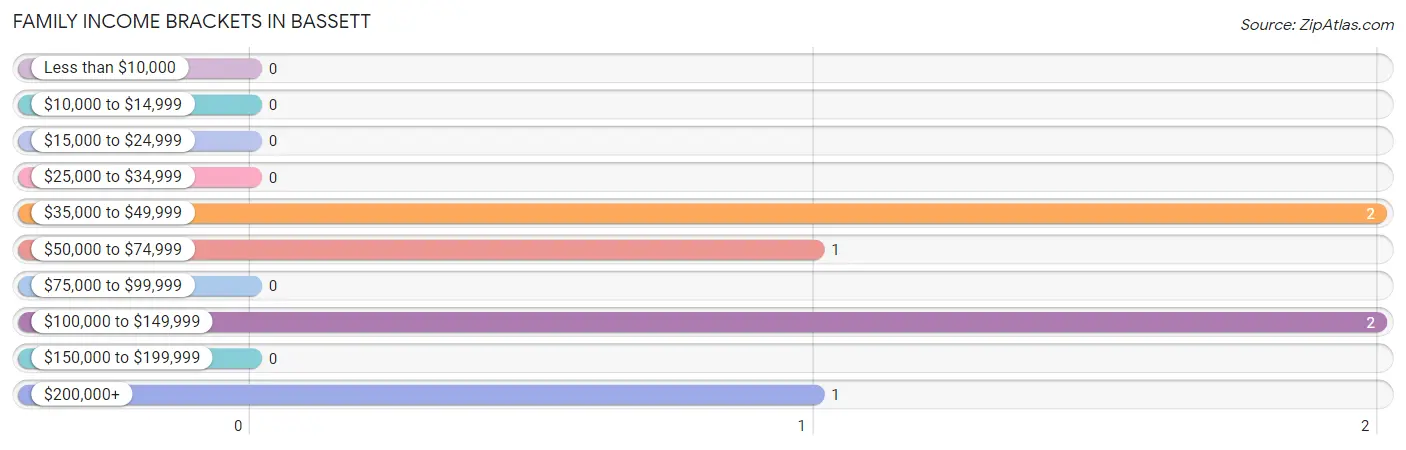
| Income Bracket | # Families | % Families |
| Less than $10,000 | 0 | 0.0% |
| $10,000 to $14,999 | 0 | 0.0% |
| $15,000 to $24,999 | 0 | 0.0% |
| $25,000 to $34,999 | 0 | 0.0% |
| $35,000 to $49,999 | 2 | 33.3% |
| $50,000 to $74,999 | 1 | 16.7% |
| $75,000 to $99,999 | 0 | 0.0% |
| $100,000 to $149,999 | 2 | 33.3% |
| $150,000 to $199,999 | 0 | 0.0% |
| $200,000+ | 1 | 16.7% |
Family Income by Famaliy Size in Bassett
2-person families (3 | 50.0%) account for the highest median family income in Bassett with $48,750 per family, while 2-person families (3 | 50.0%) have the highest median income of $24,375 per family member.
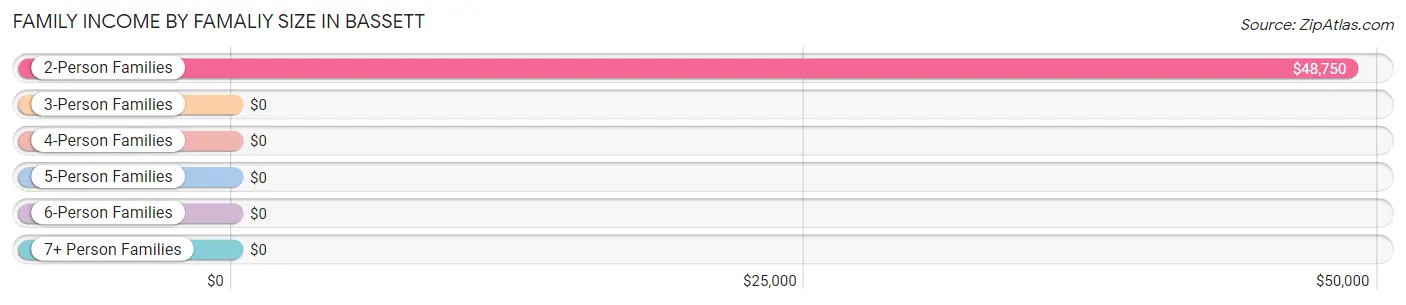
| Income Bracket | # Families | Median Income |
| 2-Person Families | 3 (50.0%) | $48,750 |
| 3-Person Families | 2 (33.3%) | $0 |
| 4-Person Families | 0 (0.0%) | $0 |
| 5-Person Families | 0 (0.0%) | $0 |
| 6-Person Families | 1 (16.7%) | $0 |
| 7+ Person Families | 0 (0.0%) | $0 |
| Total | 6 (100.0%) | $0 |
Family Income by Number of Earners in Bassett
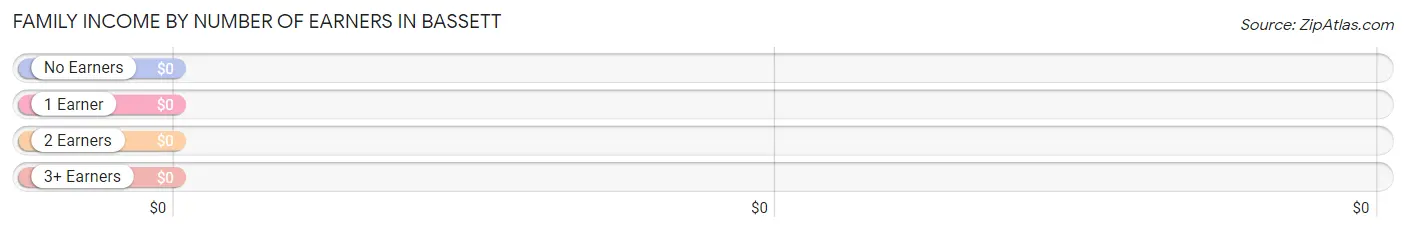
| Number of Earners | # Families | Median Income |
| No Earners | 1 (16.7%) | $0 |
| 1 Earner | 1 (16.7%) | $0 |
| 2 Earners | 3 (50.0%) | $0 |
| 3+ Earners | 1 (16.7%) | $0 |
| Total | 6 (100.0%) | $0 |
Household Income in Bassett
Household Income Brackets in Bassett
With 2 households falling in the category, the $35,000 to $49,999 income range is the most frequent in Bassett, accounting for 33.3% of all households.
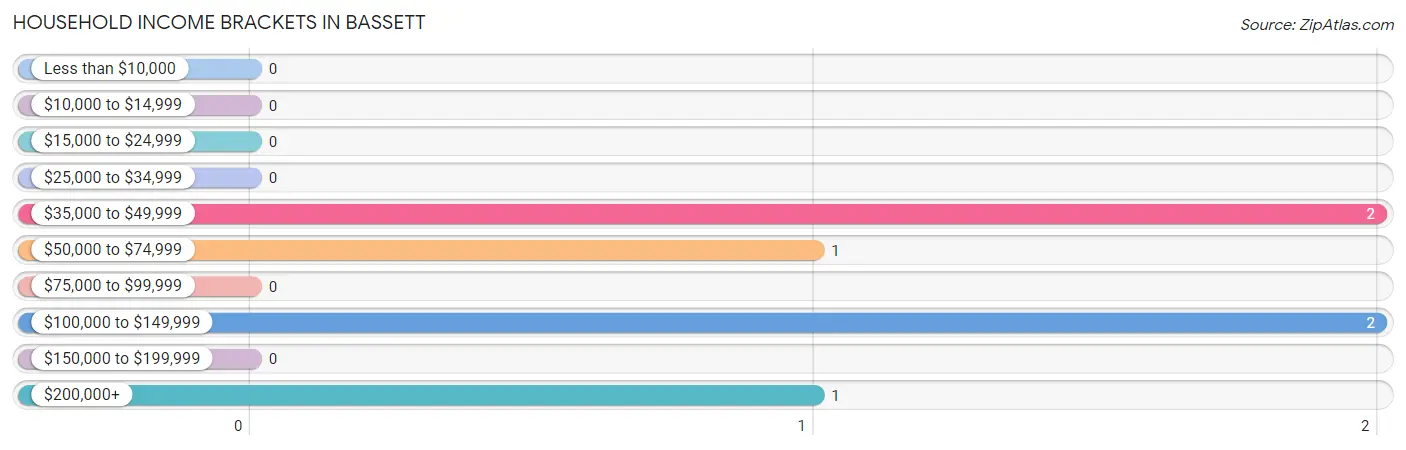
| Income Bracket | # Households | % Households |
| Less than $10,000 | 0 | 0.0% |
| $10,000 to $14,999 | 0 | 0.0% |
| $15,000 to $24,999 | 0 | 0.0% |
| $25,000 to $34,999 | 0 | 0.0% |
| $35,000 to $49,999 | 2 | 33.3% |
| $50,000 to $74,999 | 1 | 16.7% |
| $75,000 to $99,999 | 0 | 0.0% |
| $100,000 to $149,999 | 2 | 33.3% |
| $150,000 to $199,999 | 0 | 0.0% |
| $200,000+ | 1 | 16.7% |
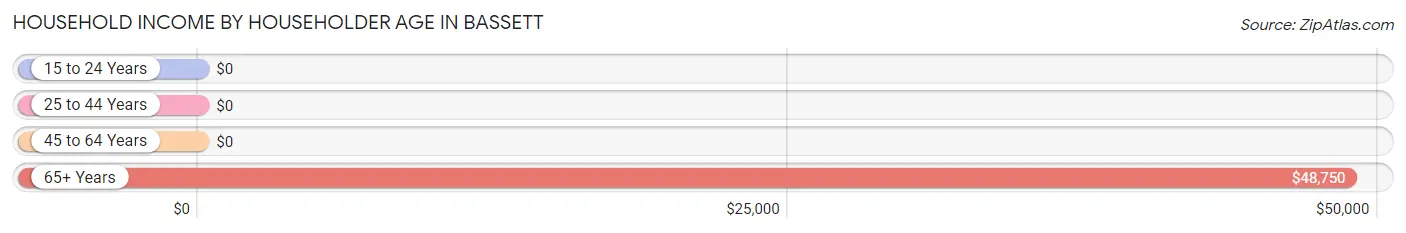
Household Income by Householder Age in Bassett
The median household income in Bassett is $0, with the highest median household income of $48,750 found in the 65+ years age bracket for the primary householder. A total of 3 households (50.0%) fall into this category.
| Income Bracket | # Households | Median Income |
| 15 to 24 Years | 0 (0.0%) | $0 |
| 25 to 44 Years | 0 (0.0%) | $0 |
| 45 to 64 Years | 3 (50.0%) | $0 |
| 65+ Years | 3 (50.0%) | $48,750 |
| Total | 6 (100.0%) | $0 |
Poverty in Bassett
Income Below Poverty by Sex and Age in Bassett
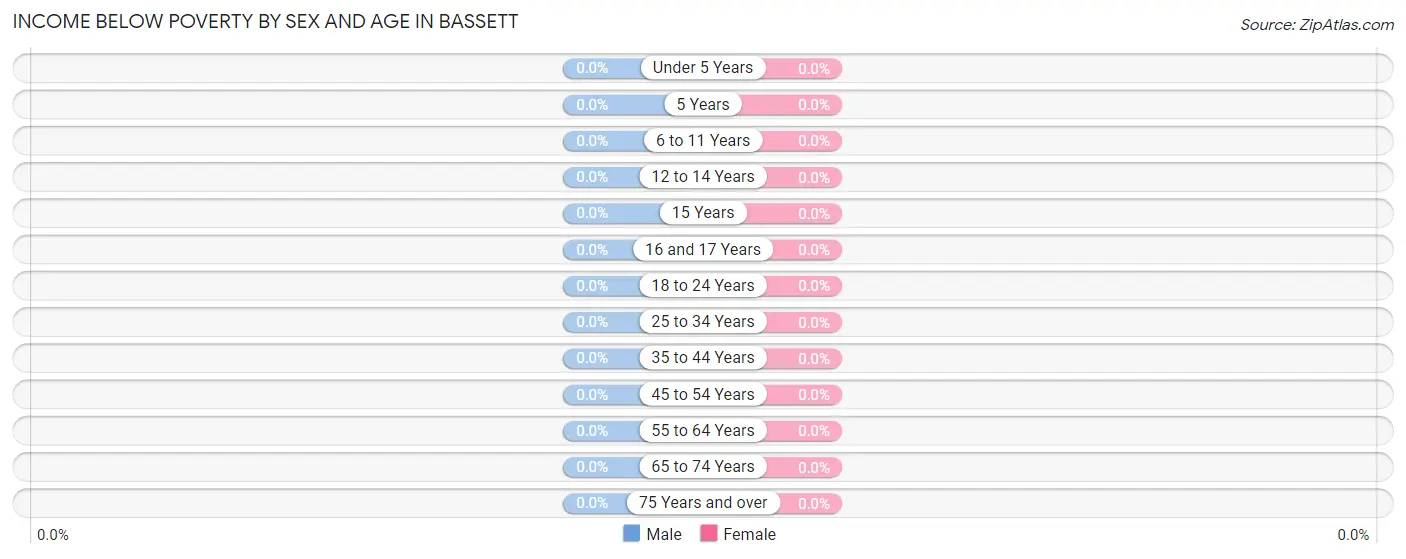
| Age Bracket | Male | Female |
| Under 5 Years | 0 (0.0%) | 0 (0.0%) |
| 5 Years | 0 (0.0%) | 0 (0.0%) |
| 6 to 11 Years | 0 (0.0%) | 0 (0.0%) |
| 12 to 14 Years | 0 (0.0%) | 0 (0.0%) |
| 15 Years | 0 (0.0%) | 0 (0.0%) |
| 16 and 17 Years | 0 (0.0%) | 0 (0.0%) |
| 18 to 24 Years | 0 (0.0%) | 0 (0.0%) |
| 25 to 34 Years | 0 (0.0%) | 0 (0.0%) |
| 35 to 44 Years | 0 (0.0%) | 0 (0.0%) |
| 45 to 54 Years | 0 (0.0%) | 0 (0.0%) |
| 55 to 64 Years | 0 (0.0%) | 0 (0.0%) |
| 65 to 74 Years | 0 (0.0%) | 0 (0.0%) |
| 75 Years and over | 0 (0.0%) | 0 (0.0%) |
| Total | 0 (0.0%) | 0 (0.0%) |
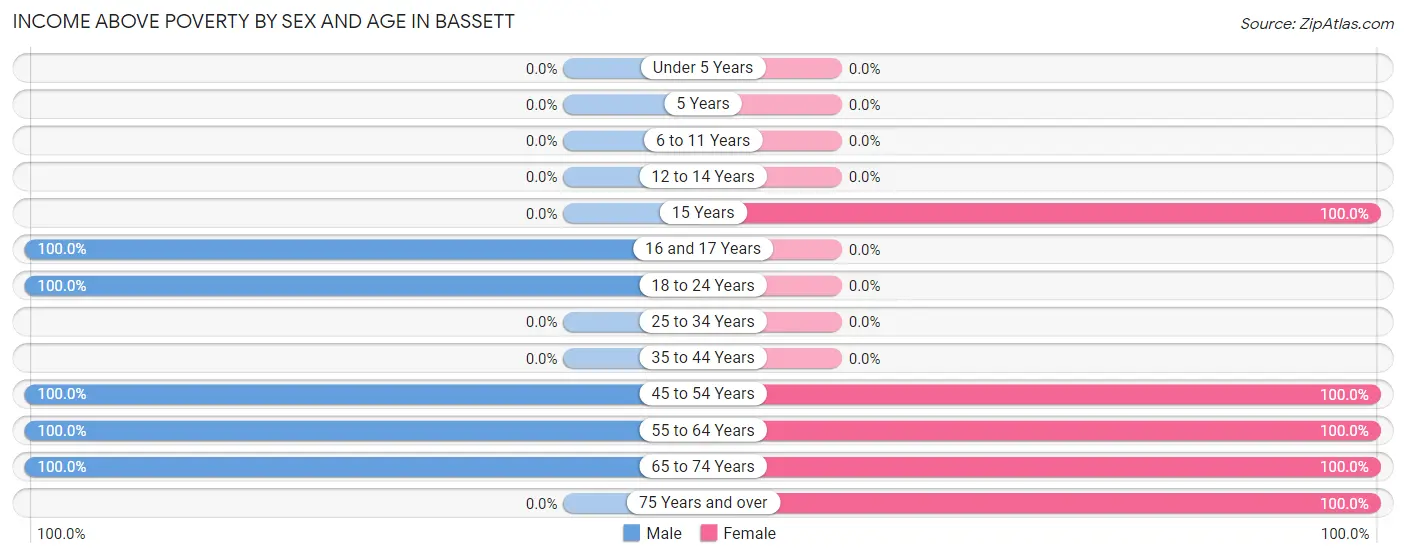
Income Above Poverty by Sex and Age in Bassett
According to the poverty statistics in Bassett, males aged 16 and 17 years and females aged 15 years are the age groups that are most secure financially, with 100.0% of males and 100.0% of females in these age groups living above the poverty line.
| Age Bracket | Male | Female |
| Under 5 Years | 0 (0.0%) | 0 (0.0%) |
| 5 Years | 0 (0.0%) | 0 (0.0%) |
| 6 to 11 Years | 0 (0.0%) | 0 (0.0%) |
| 12 to 14 Years | 0 (0.0%) | 0 (0.0%) |
| 15 Years | 0 (0.0%) | 1 (100.0%) |
| 16 and 17 Years | 2 (100.0%) | 0 (0.0%) |
| 18 to 24 Years | 4 (100.0%) | 0 (0.0%) |
| 25 to 34 Years | 0 (0.0%) | 0 (0.0%) |
| 35 to 44 Years | 0 (0.0%) | 0 (0.0%) |
| 45 to 54 Years | 4 (100.0%) | 6 (100.0%) |
| 55 to 64 Years | 1 (100.0%) | 1 (100.0%) |
| 65 to 74 Years | 1 (100.0%) | 2 (100.0%) |
| 75 Years and over | 0 (0.0%) | 1 (100.0%) |
| Total | 12 (100.0%) | 11 (100.0%) |
Income Below Poverty Among Married-Couple Families in Bassett
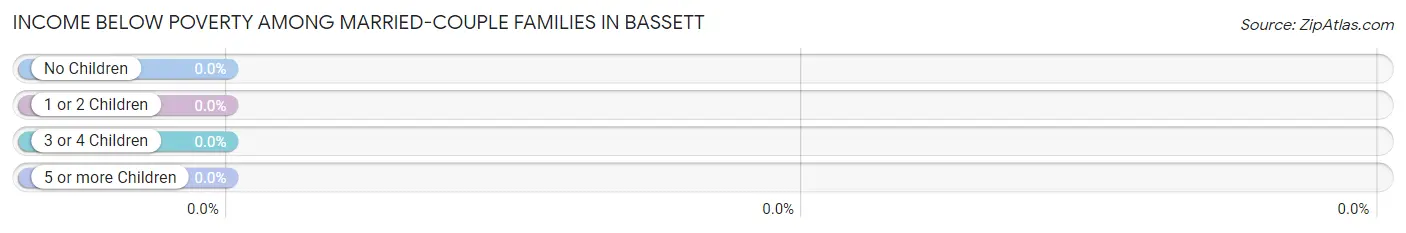
| Children | Above Poverty | Below Poverty |
| No Children | 3 (100.0%) | 0 (0.0%) |
| 1 or 2 Children | 1 (100.0%) | 0 (0.0%) |
| 3 or 4 Children | 0 (0.0%) | 0 (0.0%) |
| 5 or more Children | 0 (0.0%) | 0 (0.0%) |
| Total | 4 (100.0%) | 0 (0.0%) |
Income Below Poverty Among Single-Parent Households in Bassett
| Children | Single Father | Single Mother |
| No Children | 0 (0.0%) | 0 (0.0%) |
| 1 or 2 Children | 0 (0.0%) | 0 (0.0%) |
| 3 or 4 Children | 0 (0.0%) | 0 (0.0%) |
| 5 or more Children | 0 (0.0%) | 0 (0.0%) |
| Total | 0 (0.0%) | 0 (0.0%) |
Income Below Poverty Among Married-Couple vs Single-Parent Households in Bassett
| Children | Married-Couple Families | Single-Parent Households |
| No Children | 0 (0.0%) | 0 (0.0%) |
| 1 or 2 Children | 0 (0.0%) | 0 (0.0%) |
| 3 or 4 Children | 0 (0.0%) | 0 (0.0%) |
| 5 or more Children | 0 (0.0%) | 0 (0.0%) |
| Total | 0 (0.0%) | 0 (0.0%) |
Race in Bassett
The most populous races in Bassett are , and White / Caucasian (23 | 100.0%).
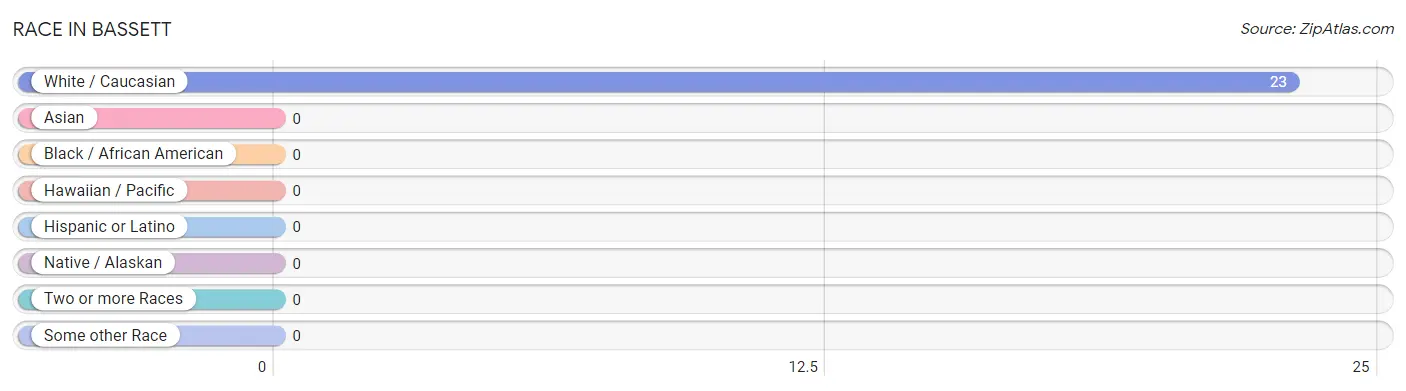
| Race | # Population | % Population |
| Asian | 0 | 0.0% |
| Black / African American | 0 | 0.0% |
| Hawaiian / Pacific | 0 | 0.0% |
| Hispanic or Latino | 0 | 0.0% |
| Native / Alaskan | 0 | 0.0% |
| White / Caucasian | 23 | 100.0% |
| Two or more Races | 0 | 0.0% |
| Some other Race | 0 | 0.0% |
| Total | 23 | 100.0% |
Ancestry in Bassett
The most populous ancestries reported in Bassett are German (5 | 21.7%), English (4 | 17.4%), Dutch (2 | 8.7%), Polish (2 | 8.7%), and French (1 | 4.3%), together accounting for 60.9% of all Bassett residents.
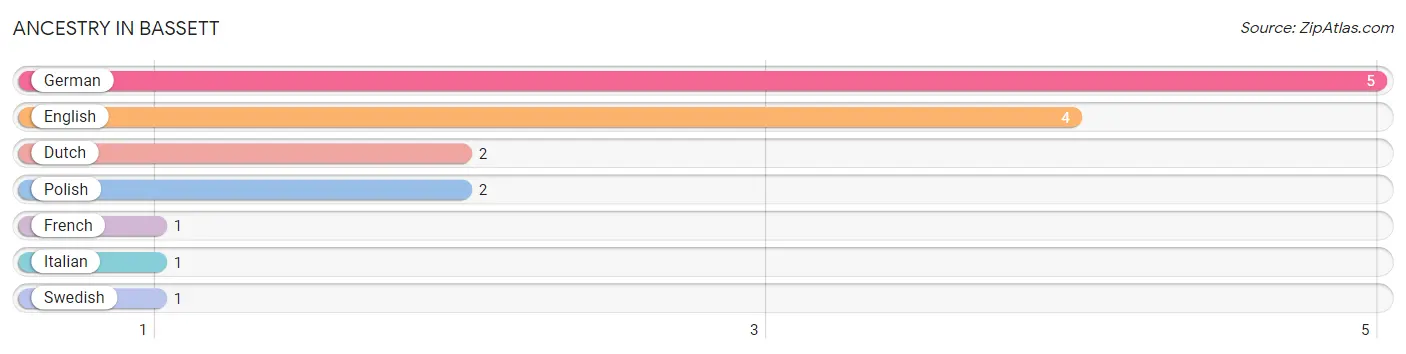
| Ancestry | # Population | % Population |
| Dutch | 2 | 8.7% |
| English | 4 | 17.4% |
| French | 1 | 4.3% |
| German | 5 | 21.7% |
| Italian | 1 | 4.3% |
| Polish | 2 | 8.7% |
| Swedish | 1 | 4.3% | View All 7 Rows |
Immigrants in Bassett

| Immigration Origin | # Population | % Population | View All 0 Rows |
Sex and Age in Bassett
Sex and Age in Bassett
The most populous age groups in Bassett are 15 to 19 Years (6 | 50.0%) for men and 45 to 49 Years (4 | 36.4%) for women.
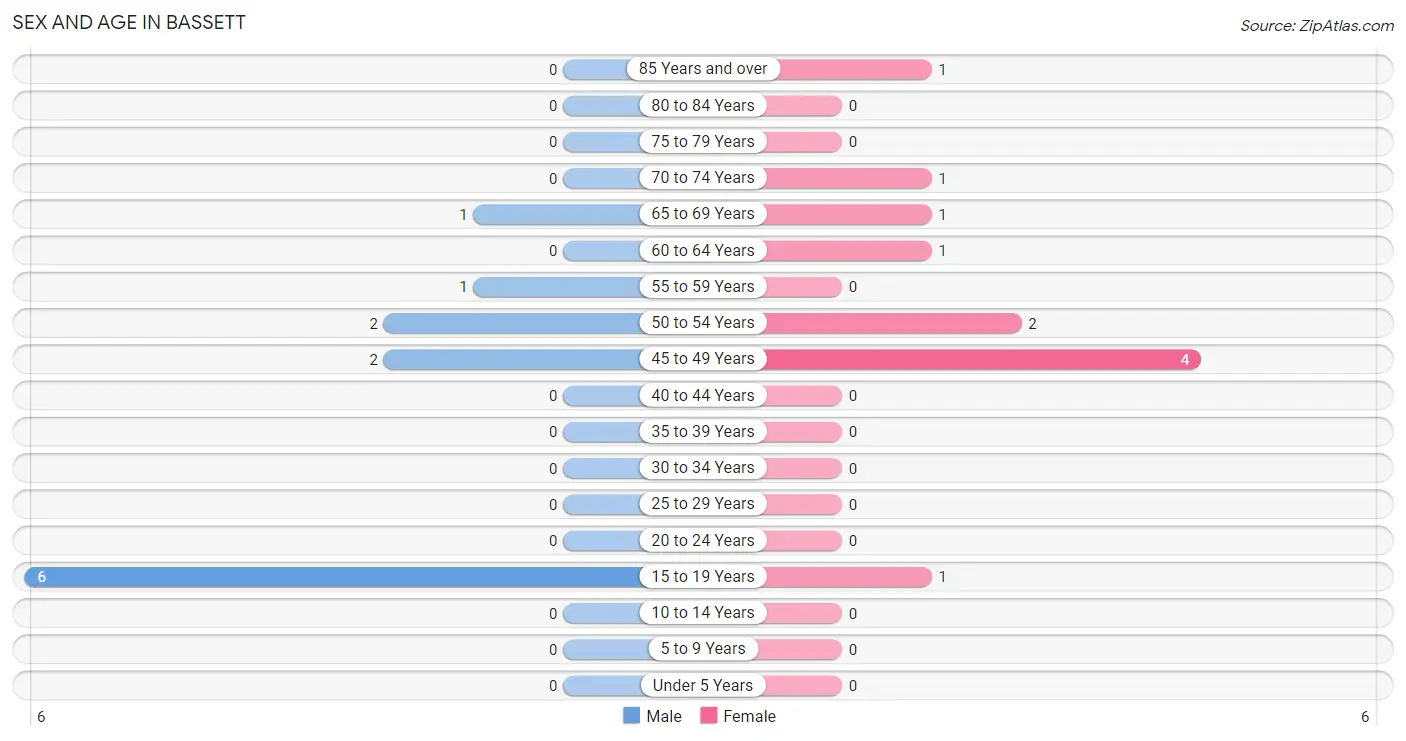
| Age Bracket | Male | Female |
| Under 5 Years | 0 (0.0%) | 0 (0.0%) |
| 5 to 9 Years | 0 (0.0%) | 0 (0.0%) |
| 10 to 14 Years | 0 (0.0%) | 0 (0.0%) |
| 15 to 19 Years | 6 (50.0%) | 1 (9.1%) |
| 20 to 24 Years | 0 (0.0%) | 0 (0.0%) |
| 25 to 29 Years | 0 (0.0%) | 0 (0.0%) |
| 30 to 34 Years | 0 (0.0%) | 0 (0.0%) |
| 35 to 39 Years | 0 (0.0%) | 0 (0.0%) |
| 40 to 44 Years | 0 (0.0%) | 0 (0.0%) |
| 45 to 49 Years | 2 (16.7%) | 4 (36.4%) |
| 50 to 54 Years | 2 (16.7%) | 2 (18.2%) |
| 55 to 59 Years | 1 (8.3%) | 0 (0.0%) |
| 60 to 64 Years | 0 (0.0%) | 1 (9.1%) |
| 65 to 69 Years | 1 (8.3%) | 1 (9.1%) |
| 70 to 74 Years | 0 (0.0%) | 1 (9.1%) |
| 75 to 79 Years | 0 (0.0%) | 0 (0.0%) |
| 80 to 84 Years | 0 (0.0%) | 0 (0.0%) |
| 85 Years and over | 0 (0.0%) | 1 (9.1%) |
| Total | 12 (100.0%) | 11 (100.0%) |
Families and Households in Bassett
Median Family Size in Bassett
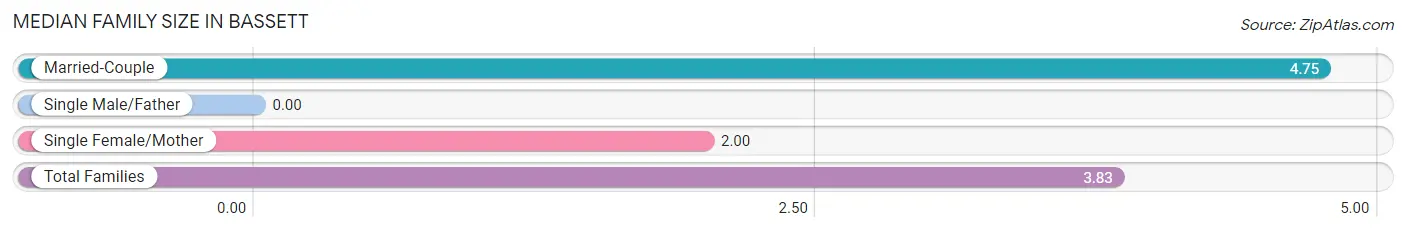
| Family Type | # Families | Family Size |
| Married-Couple | 4 (66.7%) | 4.75 |
| Single Male/Father | 0 (0.0%) | - |
| Single Female/Mother | 2 (33.3%) | 2.00 |
| Total Families | 6 (100.0%) | 3.83 |
Median Household Size in Bassett
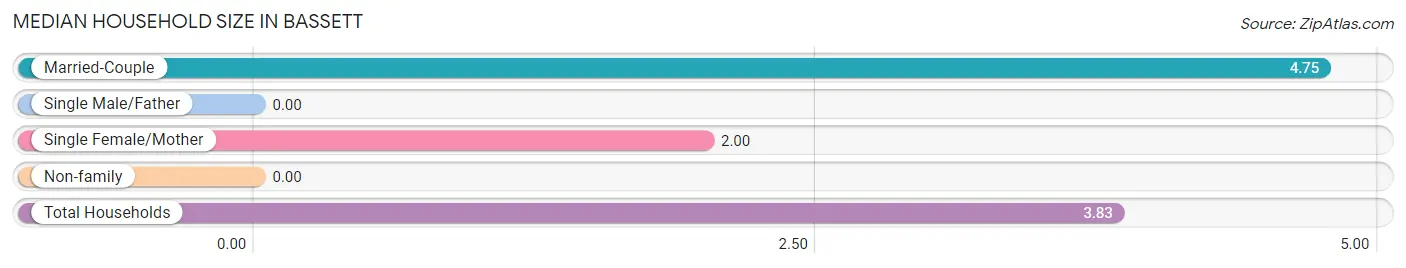
| Household Type | # Households | Household Size |
| Married-Couple | 4 (66.7%) | 4.75 |
| Single Male/Father | 0 (0.0%) | - |
| Single Female/Mother | 2 (33.3%) | 2.00 |
| Non-family | 0 (0.0%) | - |
| Total Households | 6 (100.0%) | 3.83 |
Household Size by Marriage Status in Bassett
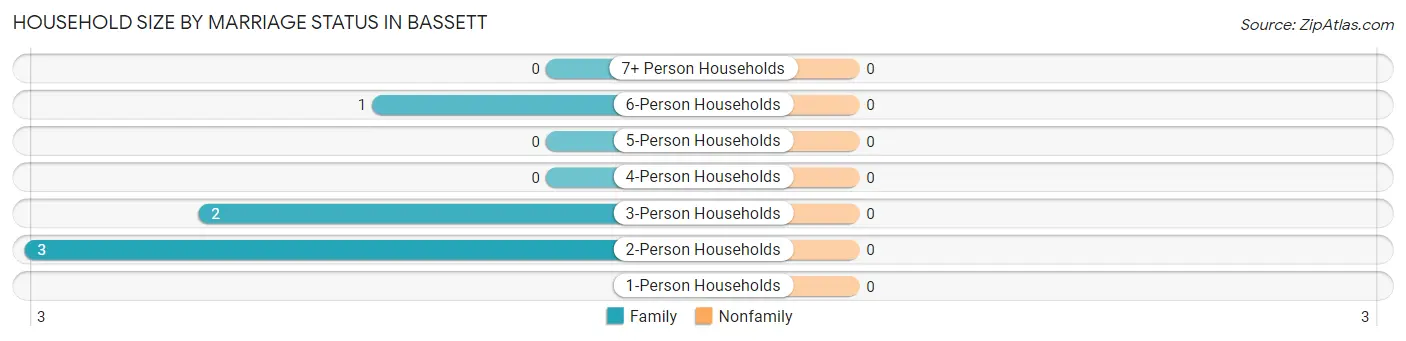
| Household Size | Family Households | Nonfamily Households |
| 1-Person Households | - | 0 (0.0%) |
| 2-Person Households | 3 (50.0%) | 0 (0.0%) |
| 3-Person Households | 2 (33.3%) | 0 (0.0%) |
| 4-Person Households | 0 (0.0%) | 0 (0.0%) |
| 5-Person Households | 0 (0.0%) | 0 (0.0%) |
| 6-Person Households | 1 (16.7%) | 0 (0.0%) |
| 7+ Person Households | 0 (0.0%) | 0 (0.0%) |
| Total | 6 (100.0%) | 0 (0.0%) |
Female Fertility in Bassett
Fertility by Age in Bassett
| Age Bracket | Women with Births | Births / 1,000 Women |
| 15 to 19 years | 0 (0.0%) | 0.0 |
| 20 to 34 years | 0 (0.0%) | 0.0 |
| 35 to 50 years | 0 (0.0%) | 0.0 |
| Total | 0 (0.0%) | 0.0 |
Fertility by Age by Marriage Status in Bassett
| Age Bracket | Married | Unmarried |
| 15 to 19 years | 0 (0.0%) | 0 (0.0%) |
| 20 to 34 years | 0 (0.0%) | 0 (0.0%) |
| 35 to 50 years | 0 (0.0%) | 0 (0.0%) |
| Total | 0 (0.0%) | 0 (0.0%) |
Fertility by Education in Bassett
| Educational Attainment | Women with Births | Births / 1,000 Women |
| Less than High School | 0 (0.0%) | 0.0 |
| High School Diploma | 0 (0.0%) | 0.0 |
| College or Associate's Degree | 0 (0.0%) | 0.0 |
| Bachelor's Degree | 0 (0.0%) | 0.0 |
| Graduate Degree | 0 (0.0%) | 0.0 |
| Total | 0 (0.0%) | 0.0 |
Fertility by Education by Marriage Status in Bassett
| Educational Attainment | Married | Unmarried |
| Less than High School | 0 (0.0%) | 0 (0.0%) |
| High School Diploma | 0 (0.0%) | 0 (0.0%) |
| College or Associate's Degree | 0 (0.0%) | 0 (0.0%) |
| Bachelor's Degree | 0 (0.0%) | 0 (0.0%) |
| Graduate Degree | 0 (0.0%) | 0 (0.0%) |
| Total | 0 (0.0%) | 0 (0.0%) |
Employment Characteristics in Bassett
Employment by Class of Employer in Bassett
Among the 7 employed individuals in Bassett, self-employed (not incorporated) (3 | 42.9%), self-employed (incorporated) (2 | 28.6%), and private company employees (1 | 14.3%) make up the most common classes of employment.
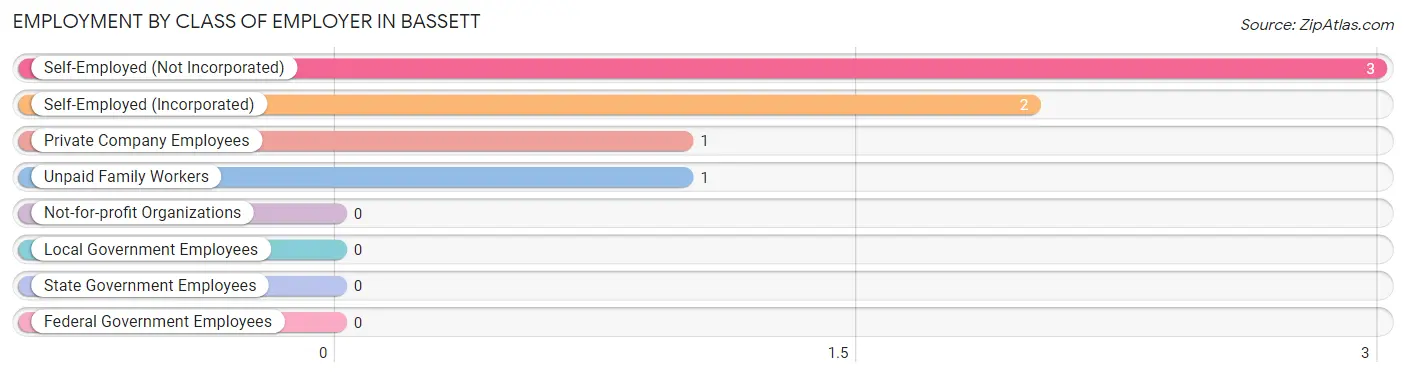
| Employer Class | # Employees | % Employees |
| Private Company Employees | 1 | 14.3% |
| Self-Employed (Incorporated) | 2 | 28.6% |
| Self-Employed (Not Incorporated) | 3 | 42.9% |
| Not-for-profit Organizations | 0 | 0.0% |
| Local Government Employees | 0 | 0.0% |
| State Government Employees | 0 | 0.0% |
| Federal Government Employees | 0 | 0.0% |
| Unpaid Family Workers | 1 | 14.3% |
| Total | 7 | 100.0% |
Employment Status by Age in Bassett
According to the labor force statistics for Bassett, out of the total population over 16 years of age (22), 59.1% or 13 individuals are in the labor force, with 30.8% or 4 of them unemployed. The age group with the highest labor force participation rate is 60 to 64 years, with 100.0% or 1 individuals in the labor force. Within the labor force, the 16 to 19 years age range has the highest percentage of unemployed individuals, with 100.0% or 4 of them being unemployed.
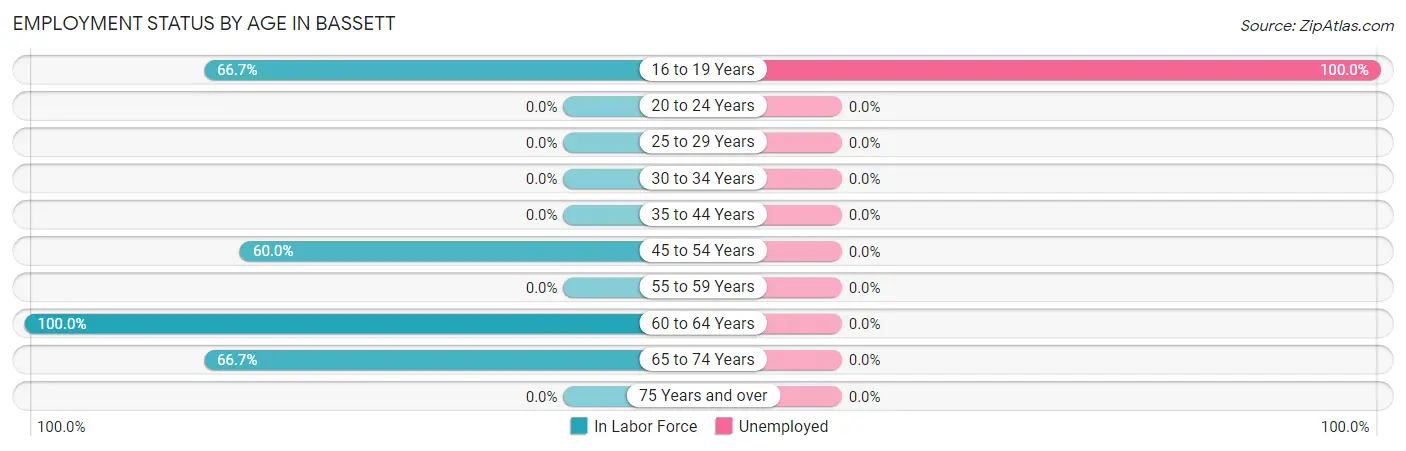
| Age Bracket | In Labor Force | Unemployed |
| 16 to 19 Years | 4 (66.7%) | 4 (100.0%) |
| 20 to 24 Years | 0 (0.0%) | 0 (0.0%) |
| 25 to 29 Years | 0 (0.0%) | 0 (0.0%) |
| 30 to 34 Years | 0 (0.0%) | 0 (0.0%) |
| 35 to 44 Years | 0 (0.0%) | 0 (0.0%) |
| 45 to 54 Years | 6 (60.0%) | 0 (0.0%) |
| 55 to 59 Years | 0 (0.0%) | 0 (0.0%) |
| 60 to 64 Years | 1 (100.0%) | 0 (0.0%) |
| 65 to 74 Years | 2 (66.7%) | 0 (0.0%) |
| 75 Years and over | 0 (0.0%) | 0 (0.0%) |
| Total | 13 (59.1%) | 4 (30.8%) |
Employment Status by Educational Attainment in Bassett
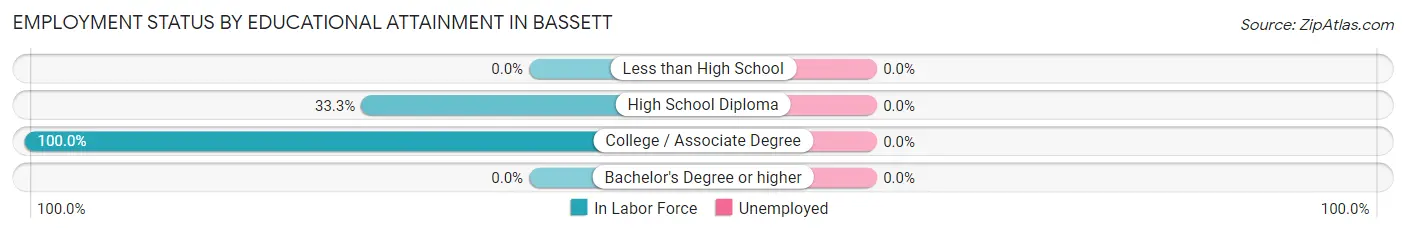
| Educational Attainment | In Labor Force | Unemployed |
| Less than High School | 0 (0.0%) | 0 (0.0%) |
| High School Diploma | 2 (33.3%) | 0 (0.0%) |
| College / Associate Degree | 5 (100.0%) | 0 (0.0%) |
| Bachelor's Degree or higher | 0 (0.0%) | 0 (0.0%) |
| Total | 7 (58.3%) | 0 (0.0%) |
Employment Occupations by Sex in Bassett
Management, Business, Science and Arts Occupations
The most common Management, Business, Science and Arts occupations in Bassett are , and Management (2 | 22.2%).
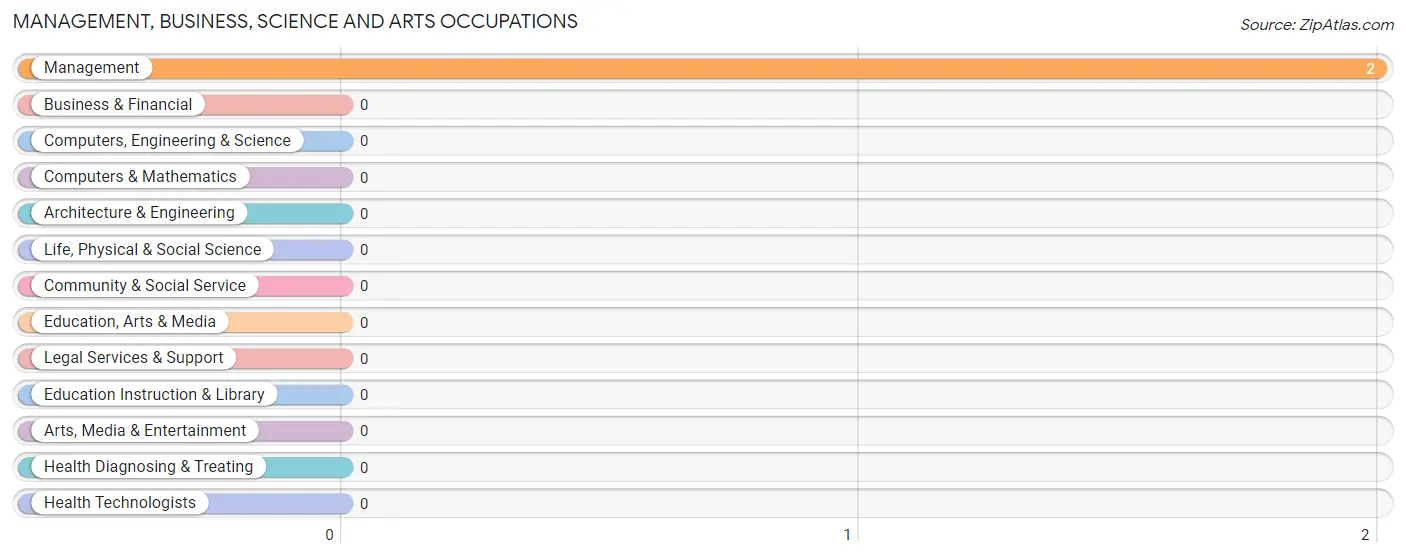
Management, Business, Science and Arts Occupations by Sex
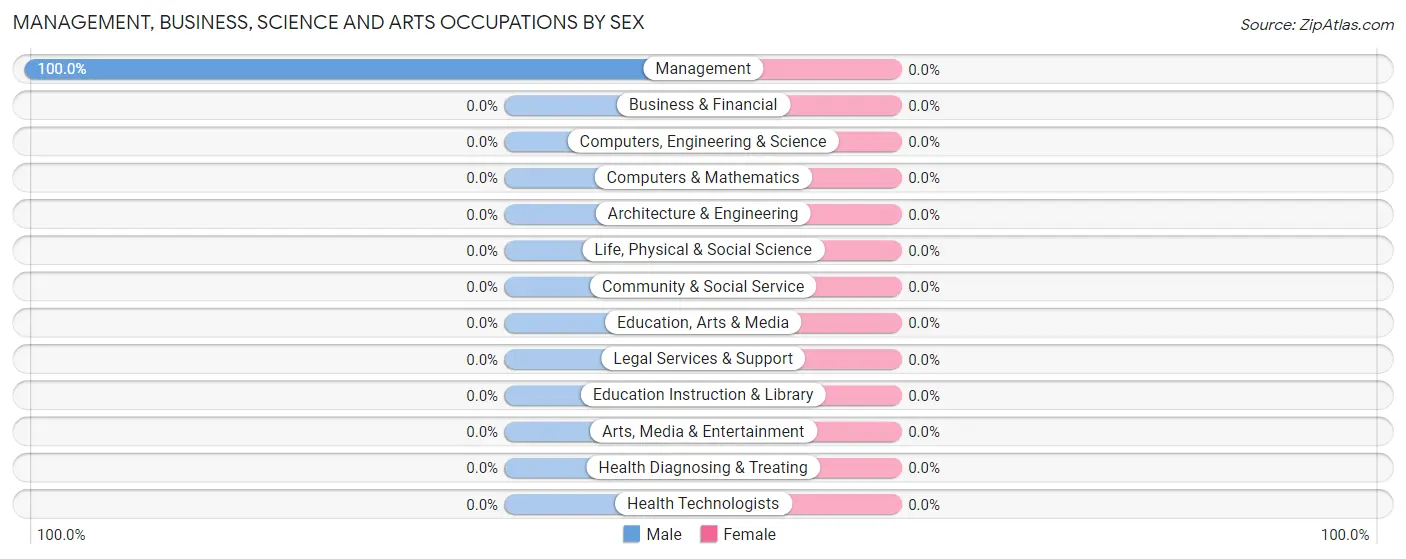
| Occupation | Male | Female |
| Management | 2 (100.0%) | 0 (0.0%) |
| Business & Financial | 0 (0.0%) | 0 (0.0%) |
| Computers, Engineering & Science | 0 (0.0%) | 0 (0.0%) |
| Computers & Mathematics | 0 (0.0%) | 0 (0.0%) |
| Architecture & Engineering | 0 (0.0%) | 0 (0.0%) |
| Life, Physical & Social Science | 0 (0.0%) | 0 (0.0%) |
| Community & Social Service | 0 (0.0%) | 0 (0.0%) |
| Education, Arts & Media | 0 (0.0%) | 0 (0.0%) |
| Legal Services & Support | 0 (0.0%) | 0 (0.0%) |
| Education Instruction & Library | 0 (0.0%) | 0 (0.0%) |
| Arts, Media & Entertainment | 0 (0.0%) | 0 (0.0%) |
| Health Diagnosing & Treating | 0 (0.0%) | 0 (0.0%) |
| Health Technologists | 0 (0.0%) | 0 (0.0%) |
| Total (Category) | 2 (100.0%) | 0 (0.0%) |
| Total (Overall) | 5 (55.6%) | 4 (44.4%) |
Services Occupations
The most common Services occupations in Bassett are Cleaning & Maintenance (1 | 11.1%), and Personal Care & Service (1 | 11.1%).
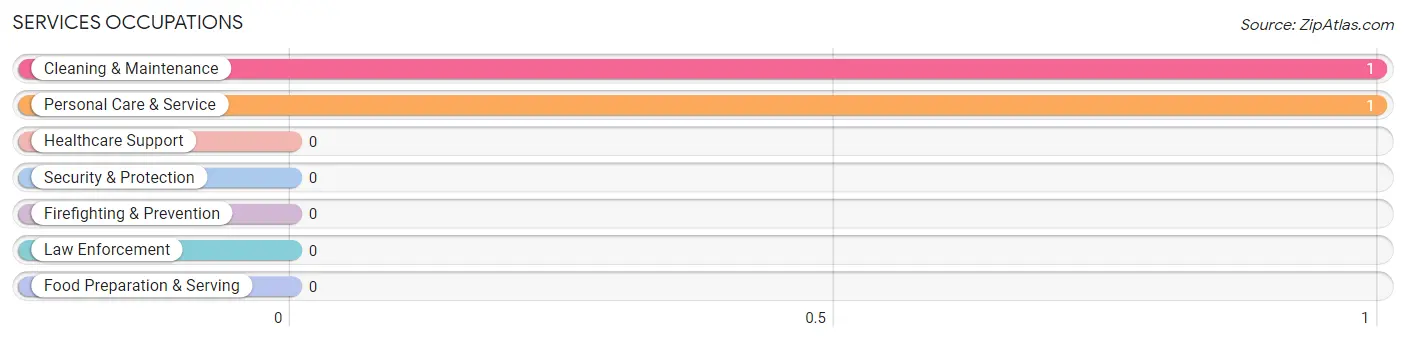
Services Occupations by Sex
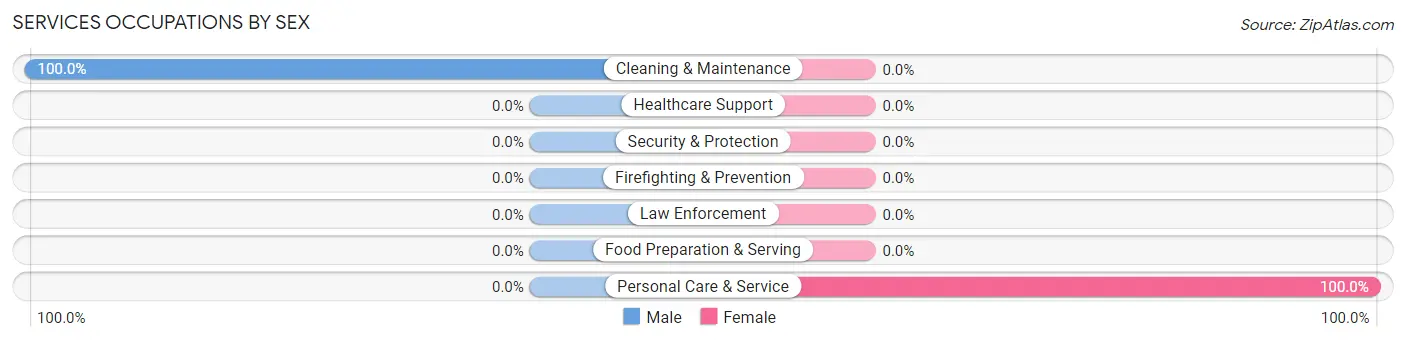
| Occupation | Male | Female |
| Healthcare Support | 0 (0.0%) | 0 (0.0%) |
| Security & Protection | 0 (0.0%) | 0 (0.0%) |
| Firefighting & Prevention | 0 (0.0%) | 0 (0.0%) |
| Law Enforcement | 0 (0.0%) | 0 (0.0%) |
| Food Preparation & Serving | 0 (0.0%) | 0 (0.0%) |
| Cleaning & Maintenance | 1 (100.0%) | 0 (0.0%) |
| Personal Care & Service | 0 (0.0%) | 1 (100.0%) |
| Total (Category) | 1 (50.0%) | 1 (50.0%) |
| Total (Overall) | 5 (55.6%) | 4 (44.4%) |
Sales and Office Occupations
The most common Sales and Office occupations in Bassett are , and Office & Administration (3 | 33.3%).
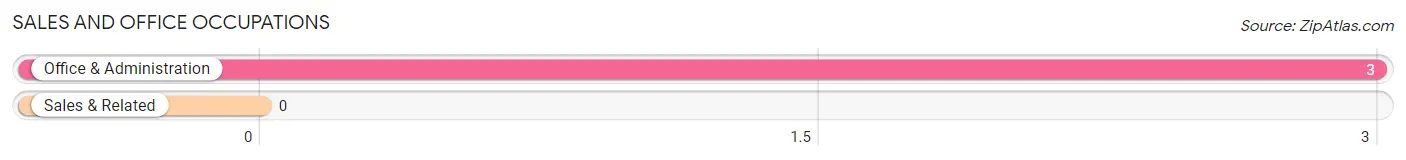
Sales and Office Occupations by Sex
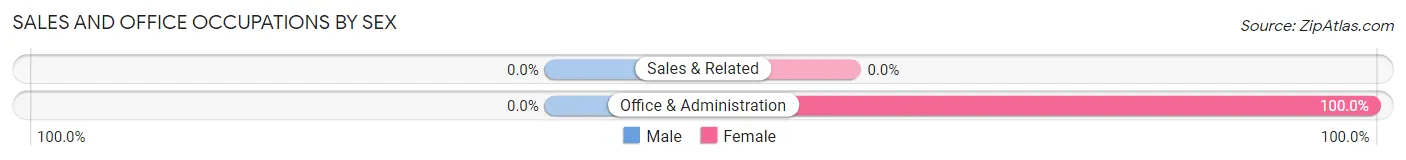
| Occupation | Male | Female |
| Sales & Related | 0 (0.0%) | 0 (0.0%) |
| Office & Administration | 0 (0.0%) | 3 (100.0%) |
| Total (Category) | 0 (0.0%) | 3 (100.0%) |
| Total (Overall) | 5 (55.6%) | 4 (44.4%) |
Natural Resources, Construction and Maintenance Occupations
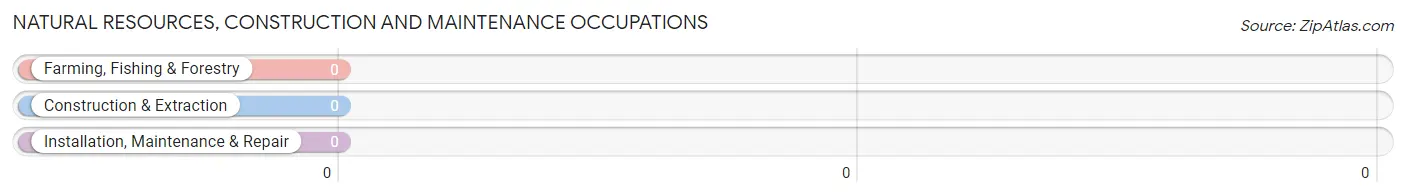
Natural Resources, Construction and Maintenance Occupations by Sex
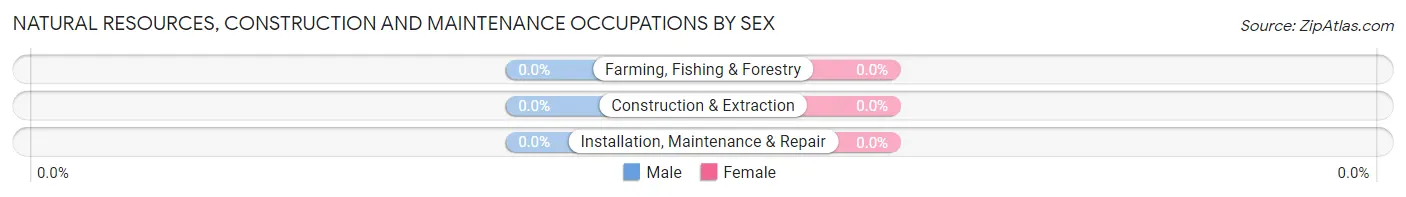
| Occupation | Male | Female |
| Farming, Fishing & Forestry | 0 (0.0%) | 0 (0.0%) |
| Construction & Extraction | 0 (0.0%) | 0 (0.0%) |
| Installation, Maintenance & Repair | 0 (0.0%) | 0 (0.0%) |
| Total (Category) | 0 (0.0%) | 0 (0.0%) |
| Total (Overall) | 5 (55.6%) | 4 (44.4%) |
Production, Transportation and Moving Occupations
The most common Production, Transportation and Moving occupations in Bassett are , and Transportation (2 | 22.2%).
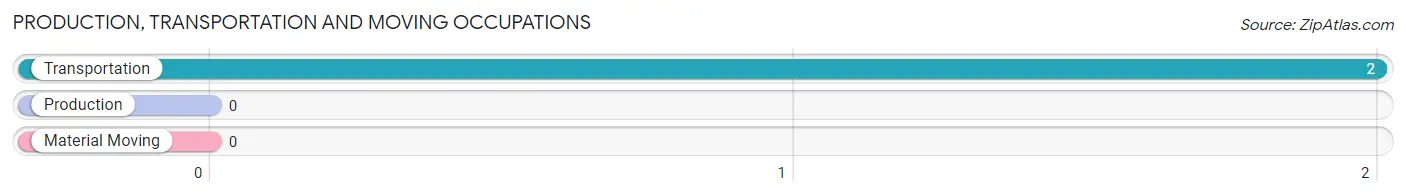
Production, Transportation and Moving Occupations by Sex
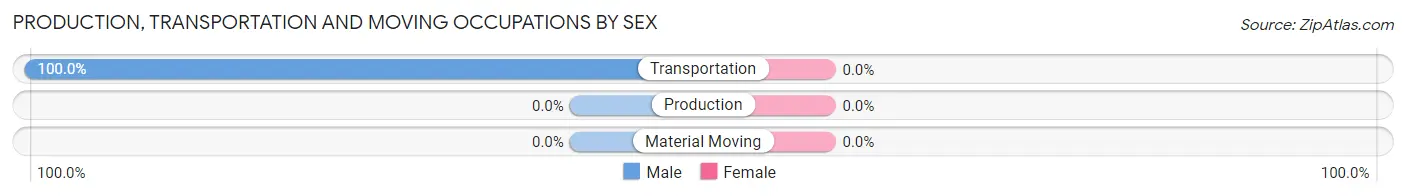
| Occupation | Male | Female |
| Production | 0 (0.0%) | 0 (0.0%) |
| Transportation | 2 (100.0%) | 0 (0.0%) |
| Material Moving | 0 (0.0%) | 0 (0.0%) |
| Total (Category) | 2 (100.0%) | 0 (0.0%) |
| Total (Overall) | 5 (55.6%) | 4 (44.4%) |
Employment Industries by Sex in Bassett
Employment Industries in Bassett
The major employment industries in Bassett include Mining, Quarrying, & Extraction (2 | 22.2%), Transportation & Warehousing (2 | 22.2%), Manufacturing (1 | 11.1%), and Educational Services (1 | 11.1%).
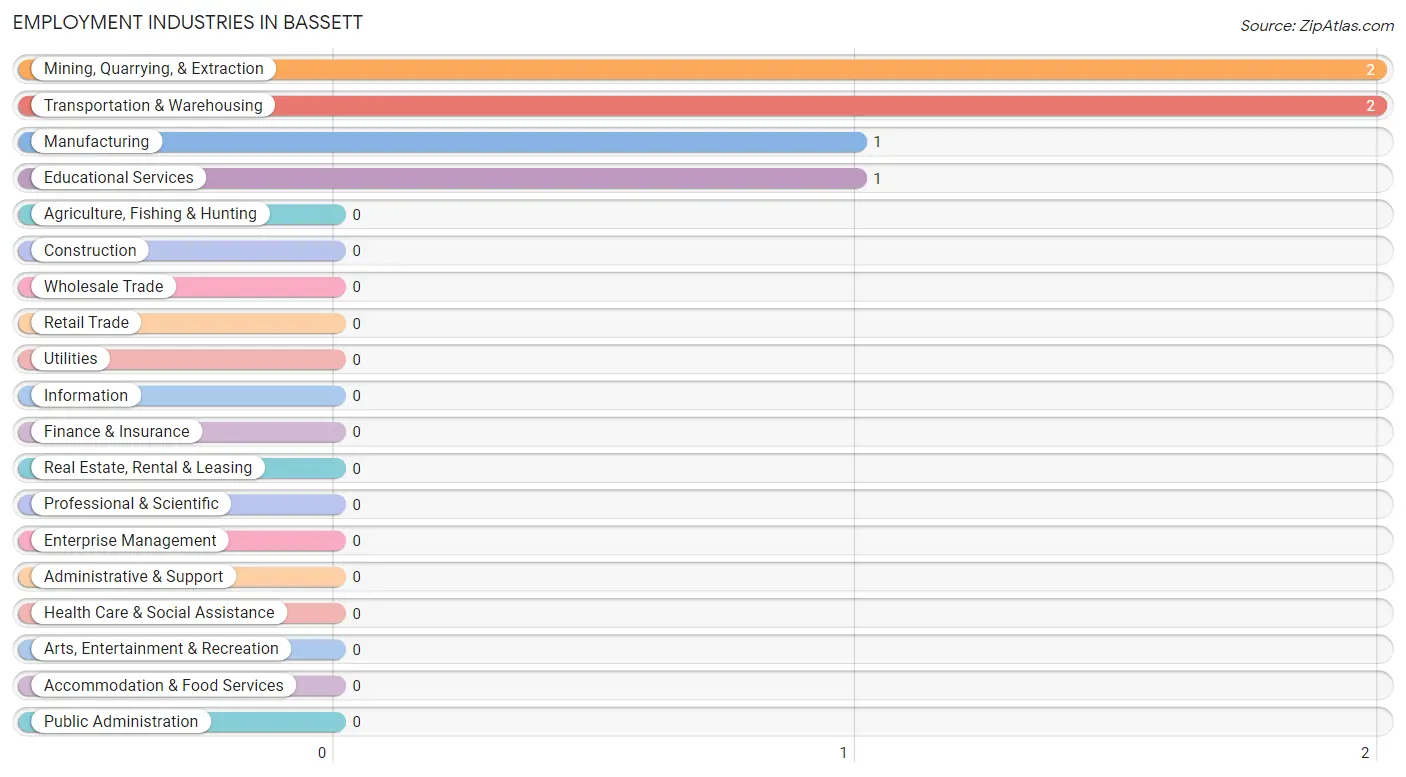
Employment Industries by Sex in Bassett
| Industry | Male | Female |
| Agriculture, Fishing & Hunting | 0 (0.0%) | 0 (0.0%) |
| Mining, Quarrying, & Extraction | 2 (100.0%) | 0 (0.0%) |
| Construction | 0 (0.0%) | 0 (0.0%) |
| Manufacturing | 0 (0.0%) | 1 (100.0%) |
| Wholesale Trade | 0 (0.0%) | 0 (0.0%) |
| Retail Trade | 0 (0.0%) | 0 (0.0%) |
| Transportation & Warehousing | 2 (100.0%) | 0 (0.0%) |
| Utilities | 0 (0.0%) | 0 (0.0%) |
| Information | 0 (0.0%) | 0 (0.0%) |
| Finance & Insurance | 0 (0.0%) | 0 (0.0%) |
| Real Estate, Rental & Leasing | 0 (0.0%) | 0 (0.0%) |
| Professional & Scientific | 0 (0.0%) | 0 (0.0%) |
| Enterprise Management | 0 (0.0%) | 0 (0.0%) |
| Administrative & Support | 0 (0.0%) | 0 (0.0%) |
| Educational Services | 1 (100.0%) | 0 (0.0%) |
| Health Care & Social Assistance | 0 (0.0%) | 0 (0.0%) |
| Arts, Entertainment & Recreation | 0 (0.0%) | 0 (0.0%) |
| Accommodation & Food Services | 0 (0.0%) | 0 (0.0%) |
| Public Administration | 0 (0.0%) | 0 (0.0%) |
| Total | 5 (55.6%) | 4 (44.4%) |
Education in Bassett
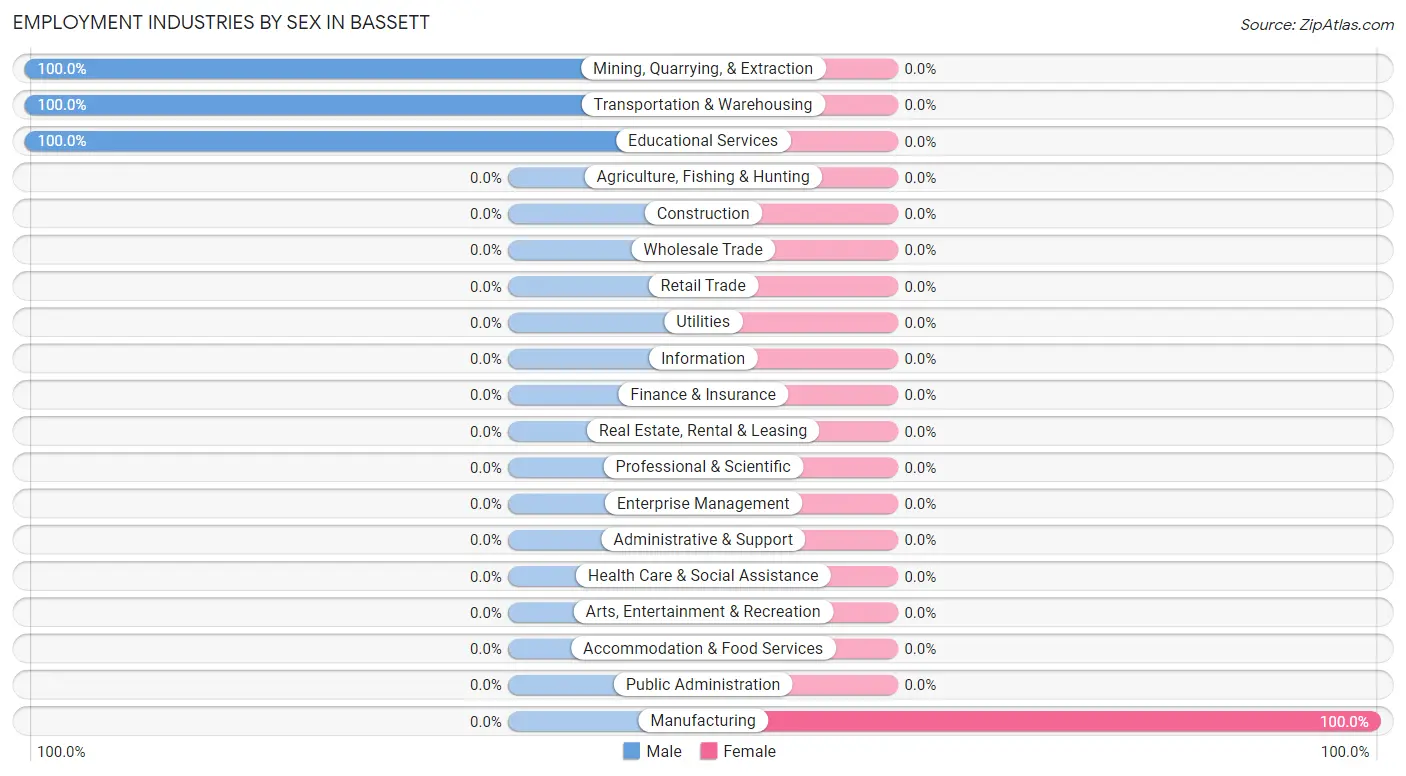
School Enrollment in Bassett
| School Level | # Students | % Students |
| Nursery / Preschool | 0 | 0.0% |
| Kindergarten | 0 | 0.0% |
| Elementary School | 0 | 0.0% |
| Middle School | 0 | 0.0% |
| High School | 7 | 100.0% |
| College / Undergraduate | 0 | 0.0% |
| Graduate / Professional | 0 | 0.0% |
| Total | 7 | 100.0% |
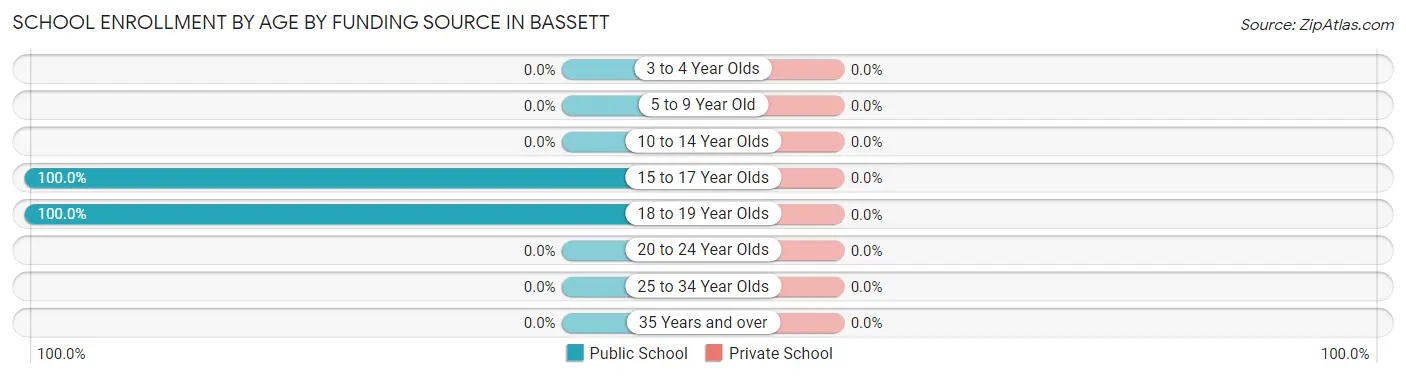
School Enrollment by Age by Funding Source in Bassett
| Age Bracket | Public School | Private School |
| 3 to 4 Year Olds | 0 (0.0%) | 0 (0.0%) |
| 5 to 9 Year Old | 0 (0.0%) | 0 (0.0%) |
| 10 to 14 Year Olds | 0 (0.0%) | 0 (0.0%) |
| 15 to 17 Year Olds | 3 (100.0%) | 0 (0.0%) |
| 18 to 19 Year Olds | 4 (100.0%) | 0 (0.0%) |
| 20 to 24 Year Olds | 0 (0.0%) | 0 (0.0%) |
| 25 to 34 Year Olds | 0 (0.0%) | 0 (0.0%) |
| 35 Years and over | 0 (0.0%) | 0 (0.0%) |
| Total | 7 (100.0%) | 0 (0.0%) |
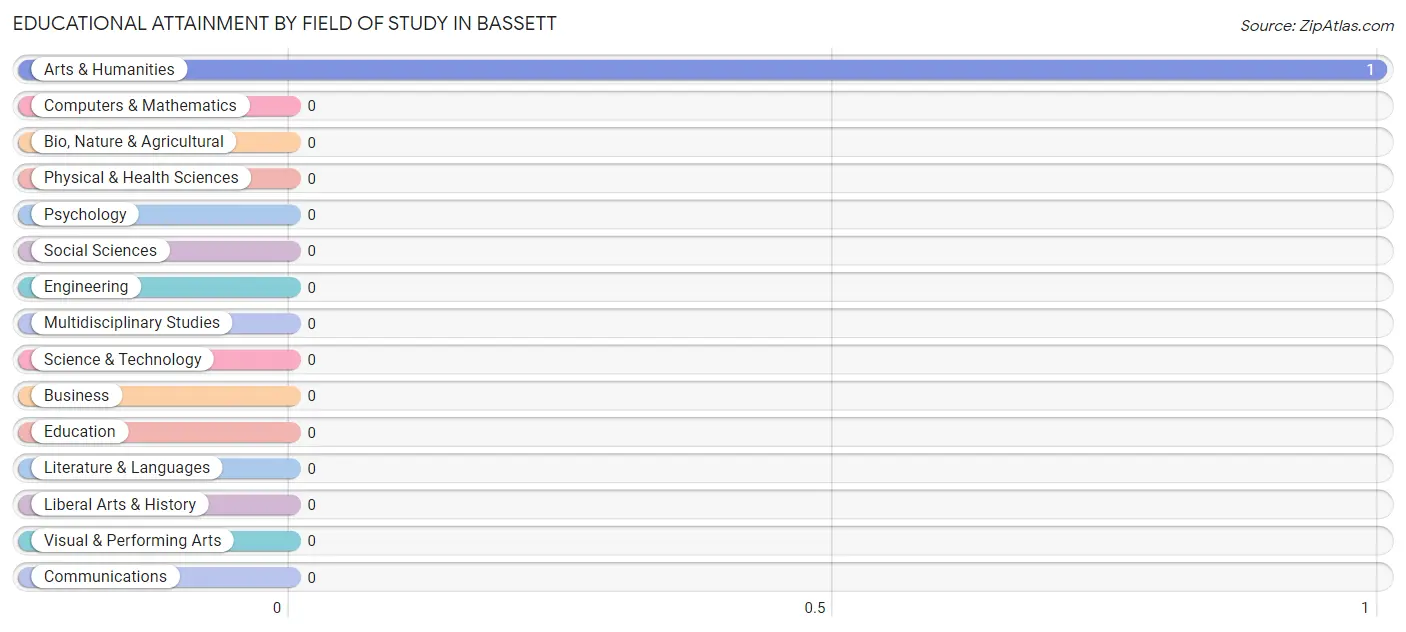
Educational Attainment by Field of Study in Bassett
, and arts & humanities (1 | 100.0%) are the most common fields of study among 1 individuals in Bassett who have obtained a bachelor's degree or higher.
| Field of Study | # Graduates | % Graduates |
| Computers & Mathematics | 0 | 0.0% |
| Bio, Nature & Agricultural | 0 | 0.0% |
| Physical & Health Sciences | 0 | 0.0% |
| Psychology | 0 | 0.0% |
| Social Sciences | 0 | 0.0% |
| Engineering | 0 | 0.0% |
| Multidisciplinary Studies | 0 | 0.0% |
| Science & Technology | 0 | 0.0% |
| Business | 0 | 0.0% |
| Education | 0 | 0.0% |
| Literature & Languages | 0 | 0.0% |
| Liberal Arts & History | 0 | 0.0% |
| Visual & Performing Arts | 0 | 0.0% |
| Communications | 0 | 0.0% |
| Arts & Humanities | 1 | 100.0% |
| Total | 1 | 100.0% |
Transportation & Commute in Bassett
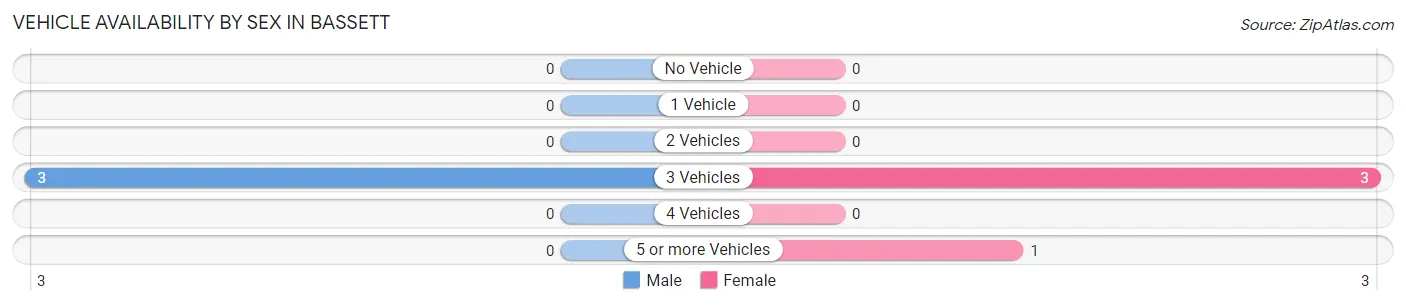
Vehicle Availability by Sex in Bassett
The most prevalent vehicle ownership categories in Bassett are males with 3 vehicles (3, accounting for 100.0%) and females with 3 vehicles (3, making up 75.0%).
| Vehicles Available | Male | Female |
| No Vehicle | 0 (0.0%) | 0 (0.0%) |
| 1 Vehicle | 0 (0.0%) | 0 (0.0%) |
| 2 Vehicles | 0 (0.0%) | 0 (0.0%) |
| 3 Vehicles | 3 (100.0%) | 3 (75.0%) |
| 4 Vehicles | 0 (0.0%) | 0 (0.0%) |
| 5 or more Vehicles | 0 (0.0%) | 1 (25.0%) |
| Total | 3 (100.0%) | 4 (100.0%) |
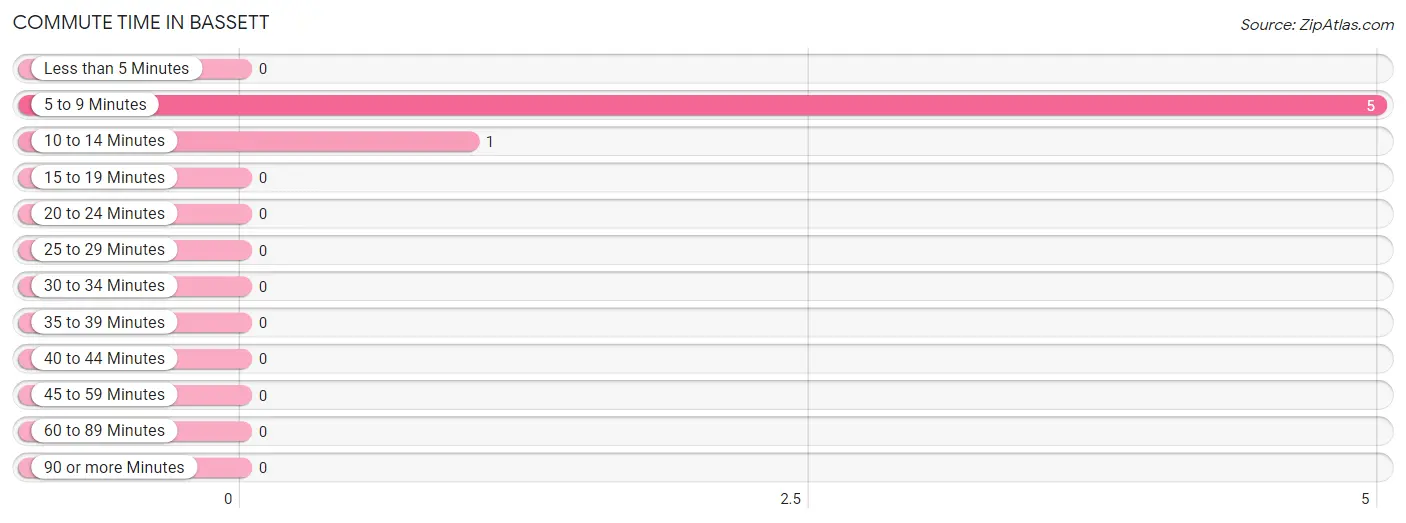
Commute Time in Bassett
The most frequently occuring commute durations in Bassett are 5 to 9 minutes (5 commuters, 83.3%), 10 to 14 minutes (1 commuters, 16.7%), and less than 5 minutes (0 commuters, 0.0%).
| Commute Time | # Commuters | % Commuters |
| Less than 5 Minutes | 0 | 0.0% |
| 5 to 9 Minutes | 5 | 83.3% |
| 10 to 14 Minutes | 1 | 16.7% |
| 15 to 19 Minutes | 0 | 0.0% |
| 20 to 24 Minutes | 0 | 0.0% |
| 25 to 29 Minutes | 0 | 0.0% |
| 30 to 34 Minutes | 0 | 0.0% |
| 35 to 39 Minutes | 0 | 0.0% |
| 40 to 44 Minutes | 0 | 0.0% |
| 45 to 59 Minutes | 0 | 0.0% |
| 60 to 89 Minutes | 0 | 0.0% |
| 90 or more Minutes | 0 | 0.0% |
Commute Time by Sex in Bassett
The most common commute times in Bassett are 5 to 9 minutes (2 commuters, 66.7%) for males and 5 to 9 minutes (3 commuters, 100.0%) for females.
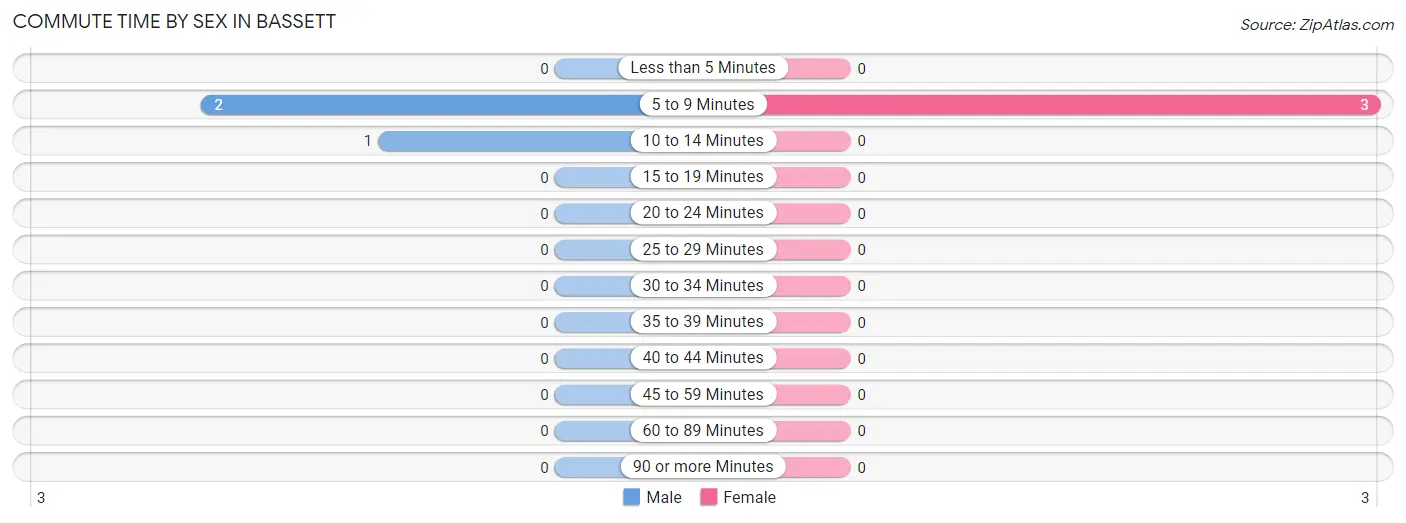
| Commute Time | Male | Female |
| Less than 5 Minutes | 0 (0.0%) | 0 (0.0%) |
| 5 to 9 Minutes | 2 (66.7%) | 3 (100.0%) |
| 10 to 14 Minutes | 1 (33.3%) | 0 (0.0%) |
| 15 to 19 Minutes | 0 (0.0%) | 0 (0.0%) |
| 20 to 24 Minutes | 0 (0.0%) | 0 (0.0%) |
| 25 to 29 Minutes | 0 (0.0%) | 0 (0.0%) |
| 30 to 34 Minutes | 0 (0.0%) | 0 (0.0%) |
| 35 to 39 Minutes | 0 (0.0%) | 0 (0.0%) |
| 40 to 44 Minutes | 0 (0.0%) | 0 (0.0%) |
| 45 to 59 Minutes | 0 (0.0%) | 0 (0.0%) |
| 60 to 89 Minutes | 0 (0.0%) | 0 (0.0%) |
| 90 or more Minutes | 0 (0.0%) | 0 (0.0%) |
Time of Departure to Work by Sex in Bassett
The most frequent times of departure to work in Bassett are 6:00 AM to 6:29 AM (3, 100.0%) for males and 10:00 AM to 10:59 AM (2, 66.7%) for females.
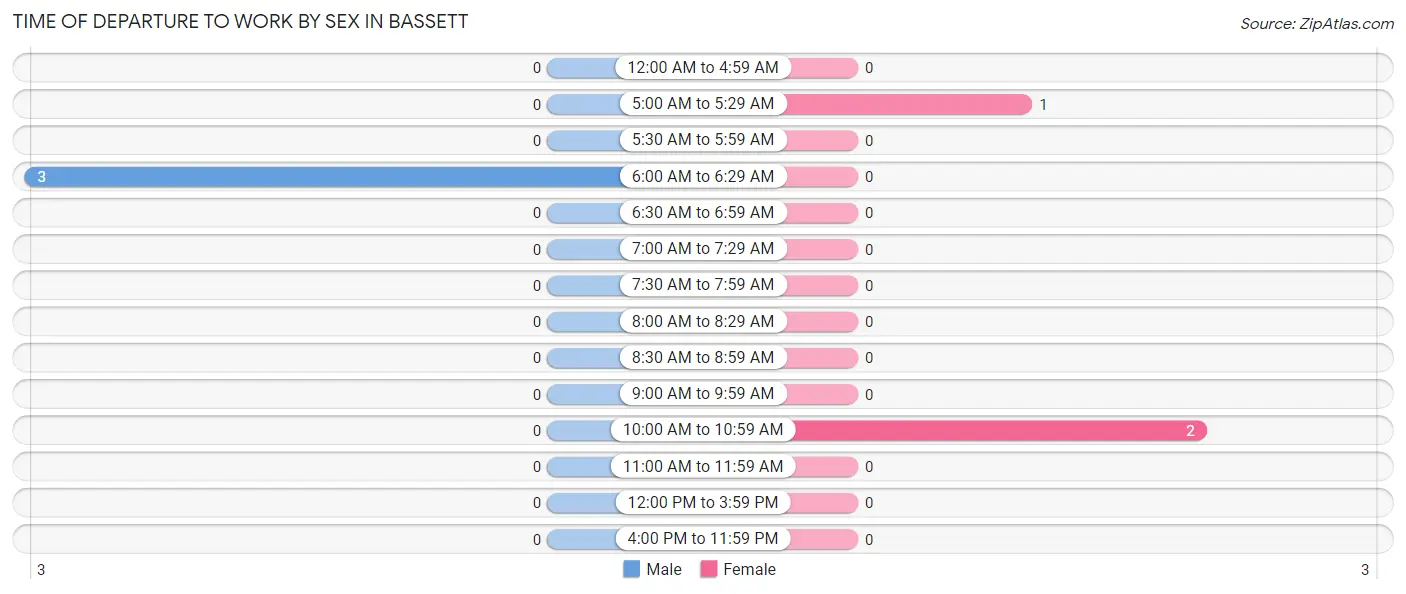
| Time of Departure | Male | Female |
| 12:00 AM to 4:59 AM | 0 (0.0%) | 0 (0.0%) |
| 5:00 AM to 5:29 AM | 0 (0.0%) | 1 (33.3%) |
| 5:30 AM to 5:59 AM | 0 (0.0%) | 0 (0.0%) |
| 6:00 AM to 6:29 AM | 3 (100.0%) | 0 (0.0%) |
| 6:30 AM to 6:59 AM | 0 (0.0%) | 0 (0.0%) |
| 7:00 AM to 7:29 AM | 0 (0.0%) | 0 (0.0%) |
| 7:30 AM to 7:59 AM | 0 (0.0%) | 0 (0.0%) |
| 8:00 AM to 8:29 AM | 0 (0.0%) | 0 (0.0%) |
| 8:30 AM to 8:59 AM | 0 (0.0%) | 0 (0.0%) |
| 9:00 AM to 9:59 AM | 0 (0.0%) | 0 (0.0%) |
| 10:00 AM to 10:59 AM | 0 (0.0%) | 2 (66.7%) |
| 11:00 AM to 11:59 AM | 0 (0.0%) | 0 (0.0%) |
| 12:00 PM to 3:59 PM | 0 (0.0%) | 0 (0.0%) |
| 4:00 PM to 11:59 PM | 0 (0.0%) | 0 (0.0%) |
| Total | 3 (100.0%) | 3 (100.0%) |
Housing Occupancy in Bassett
Occupancy by Ownership in Bassett
Of the total 6 dwellings in Bassett, owner-occupied units account for 6 (100.0%), while renter-occupied units make up 0 (0.0%).
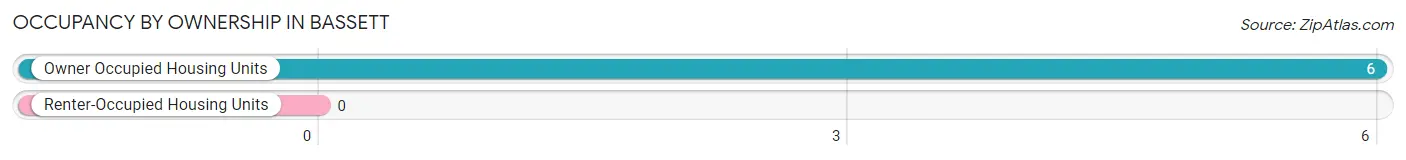
| Occupancy | # Housing Units | % Housing Units |
| Owner Occupied Housing Units | 6 | 100.0% |
| Renter-Occupied Housing Units | 0 | 0.0% |
| Total Occupied Housing Units | 6 | 100.0% |
Occupancy by Household Size in Bassett
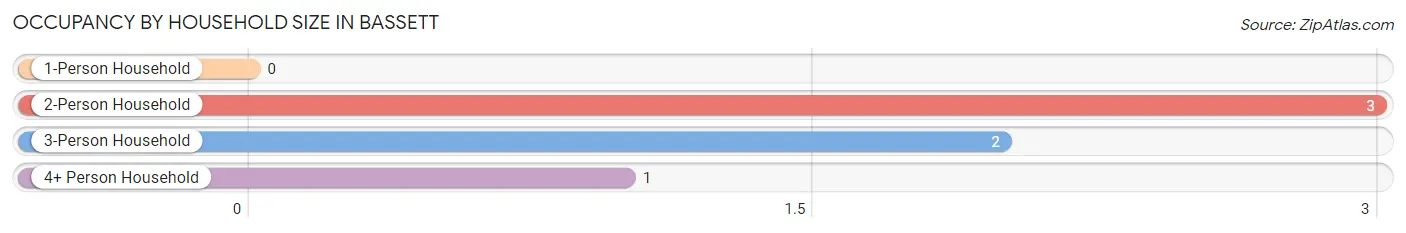
| Household Size | # Housing Units | % Housing Units |
| 1-Person Household | 0 | 0.0% |
| 2-Person Household | 3 | 50.0% |
| 3-Person Household | 2 | 33.3% |
| 4+ Person Household | 1 | 16.7% |
| Total Housing Units | 6 | 100.0% |
Occupancy by Ownership by Household Size in Bassett
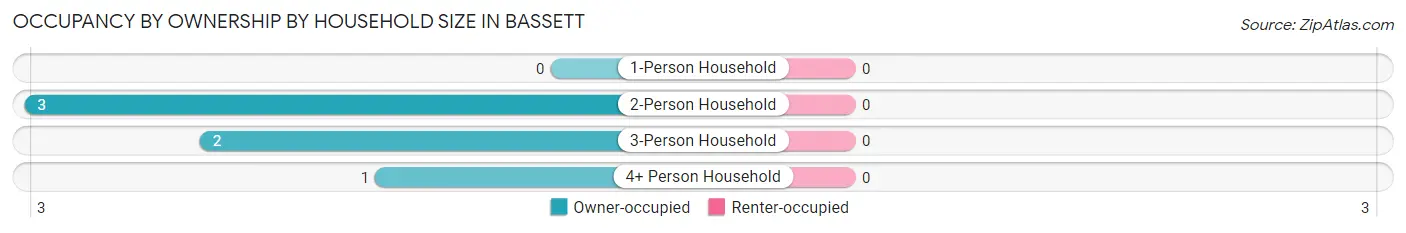
| Household Size | Owner-occupied | Renter-occupied |
| 1-Person Household | 0 (0.0%) | 0 (0.0%) |
| 2-Person Household | 3 (100.0%) | 0 (0.0%) |
| 3-Person Household | 2 (100.0%) | 0 (0.0%) |
| 4+ Person Household | 1 (100.0%) | 0 (0.0%) |
| Total Housing Units | 6 (100.0%) | 0 (0.0%) |
Occupancy by Educational Attainment in Bassett
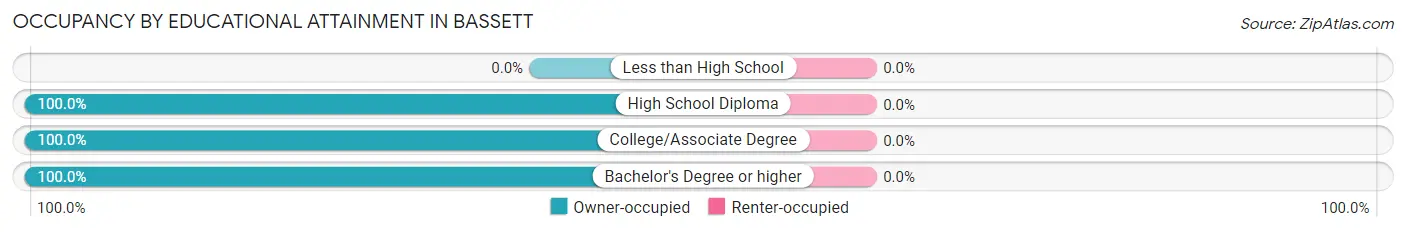
| Household Size | Owner-occupied | Renter-occupied |
| Less than High School | 0 (0.0%) | 0 (0.0%) |
| High School Diploma | 2 (100.0%) | 0 (0.0%) |
| College/Associate Degree | 3 (100.0%) | 0 (0.0%) |
| Bachelor's Degree or higher | 1 (100.0%) | 0 (0.0%) |
Occupancy by Age of Householder in Bassett
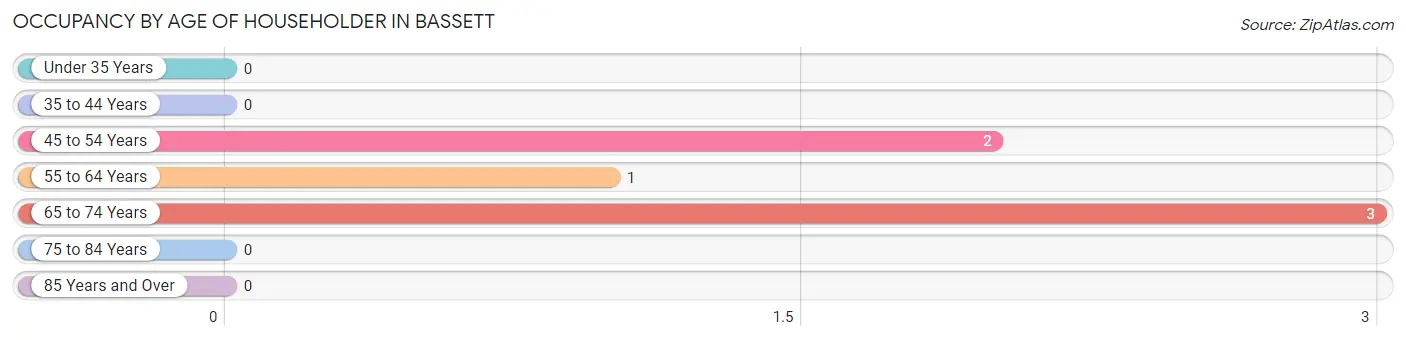
| Age Bracket | # Households | % Households |
| Under 35 Years | 0 | 0.0% |
| 35 to 44 Years | 0 | 0.0% |
| 45 to 54 Years | 2 | 33.3% |
| 55 to 64 Years | 1 | 16.7% |
| 65 to 74 Years | 3 | 50.0% |
| 75 to 84 Years | 0 | 0.0% |
| 85 Years and Over | 0 | 0.0% |
| Total | 6 | 100.0% |
Housing Finances in Bassett
Median Income by Occupancy in Bassett
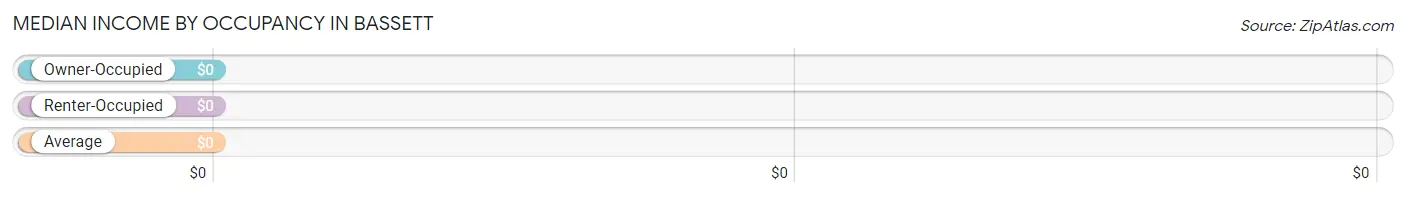
| Occupancy Type | # Households | Median Income |
| Owner-Occupied | 6 (100.0%) | $0 |
| Renter-Occupied | 0 (0.0%) | $0 |
| Average | 6 (100.0%) | $0 |
Occupancy by Householder Income Bracket in Bassett
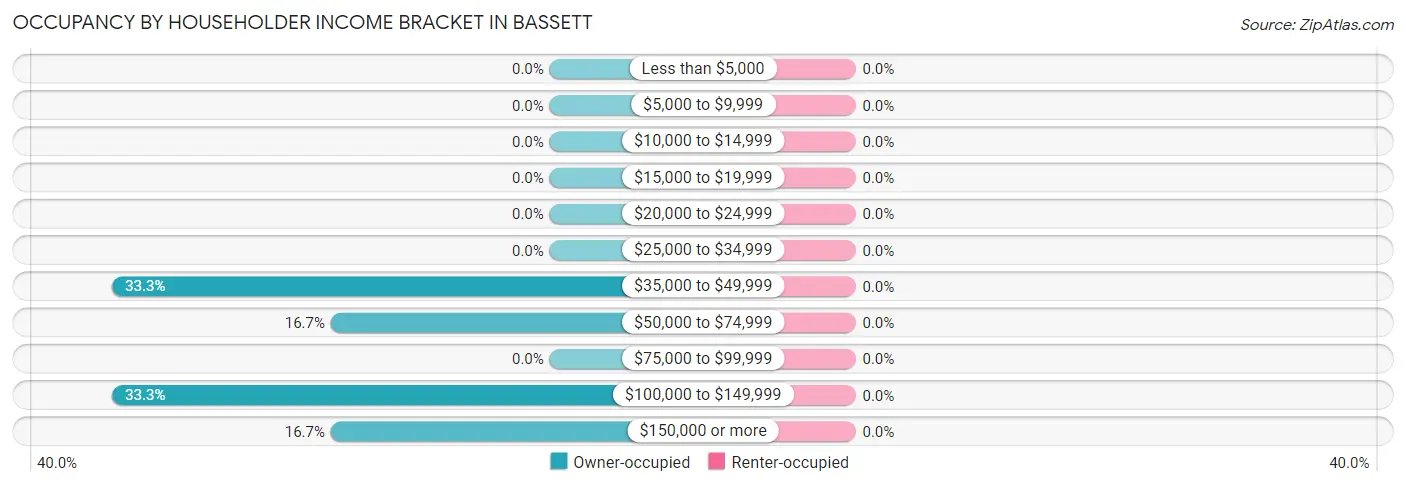
| Income Bracket | Owner-occupied | Renter-occupied |
| Less than $5,000 | 0 (0.0%) | 0 (0.0%) |
| $5,000 to $9,999 | 0 (0.0%) | 0 (0.0%) |
| $10,000 to $14,999 | 0 (0.0%) | 0 (0.0%) |
| $15,000 to $19,999 | 0 (0.0%) | 0 (0.0%) |
| $20,000 to $24,999 | 0 (0.0%) | 0 (0.0%) |
| $25,000 to $34,999 | 0 (0.0%) | 0 (0.0%) |
| $35,000 to $49,999 | 2 (33.3%) | 0 (0.0%) |
| $50,000 to $74,999 | 1 (16.7%) | 0 (0.0%) |
| $75,000 to $99,999 | 0 (0.0%) | 0 (0.0%) |
| $100,000 to $149,999 | 2 (33.3%) | 0 (0.0%) |
| $150,000 or more | 1 (16.7%) | 0 (0.0%) |
| Total | 6 (100.0%) | 0 (0.0%) |
Monthly Housing Cost Tiers in Bassett
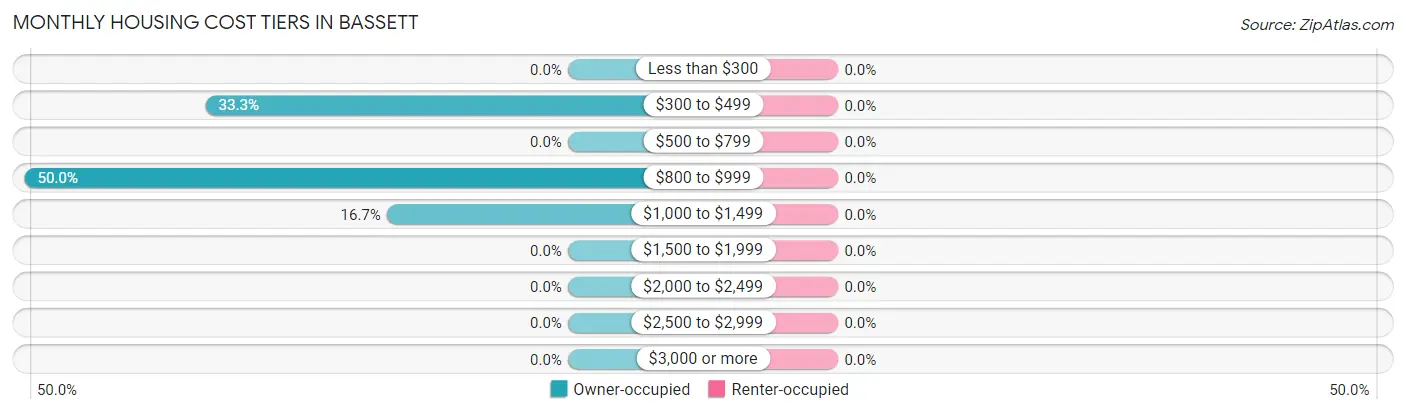
| Monthly Cost | Owner-occupied | Renter-occupied |
| Less than $300 | 0 (0.0%) | 0 (0.0%) |
| $300 to $499 | 2 (33.3%) | 0 (0.0%) |
| $500 to $799 | 0 (0.0%) | 0 (0.0%) |
| $800 to $999 | 3 (50.0%) | 0 (0.0%) |
| $1,000 to $1,499 | 1 (16.7%) | 0 (0.0%) |
| $1,500 to $1,999 | 0 (0.0%) | 0 (0.0%) |
| $2,000 to $2,499 | 0 (0.0%) | 0 (0.0%) |
| $2,500 to $2,999 | 0 (0.0%) | 0 (0.0%) |
| $3,000 or more | 0 (0.0%) | 0 (0.0%) |
| Total | 6 (100.0%) | 0 (0.0%) |
Physical Housing Characteristics in Bassett
Housing Structures in Bassett
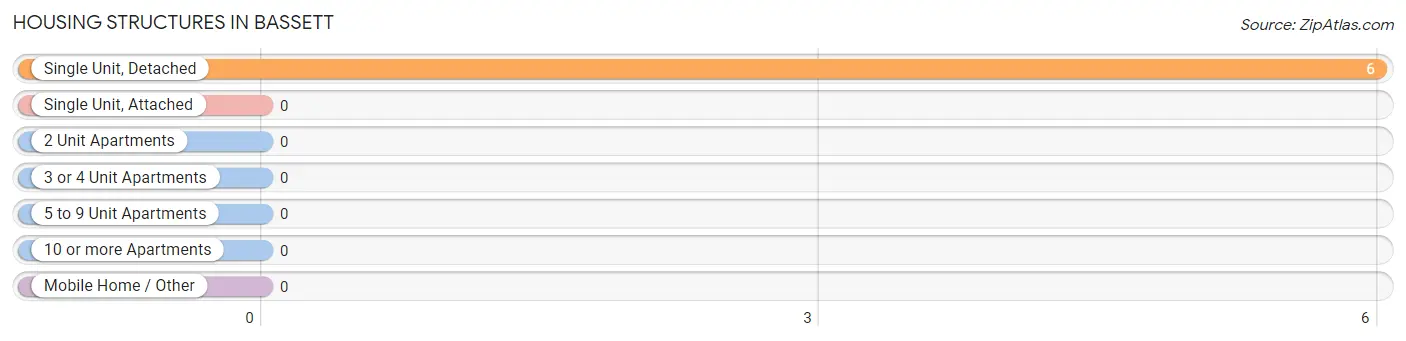
| Structure Type | # Housing Units | % Housing Units |
| Single Unit, Detached | 6 | 100.0% |
| Single Unit, Attached | 0 | 0.0% |
| 2 Unit Apartments | 0 | 0.0% |
| 3 or 4 Unit Apartments | 0 | 0.0% |
| 5 to 9 Unit Apartments | 0 | 0.0% |
| 10 or more Apartments | 0 | 0.0% |
| Mobile Home / Other | 0 | 0.0% |
| Total | 6 | 100.0% |
Housing Structures by Occupancy in Bassett
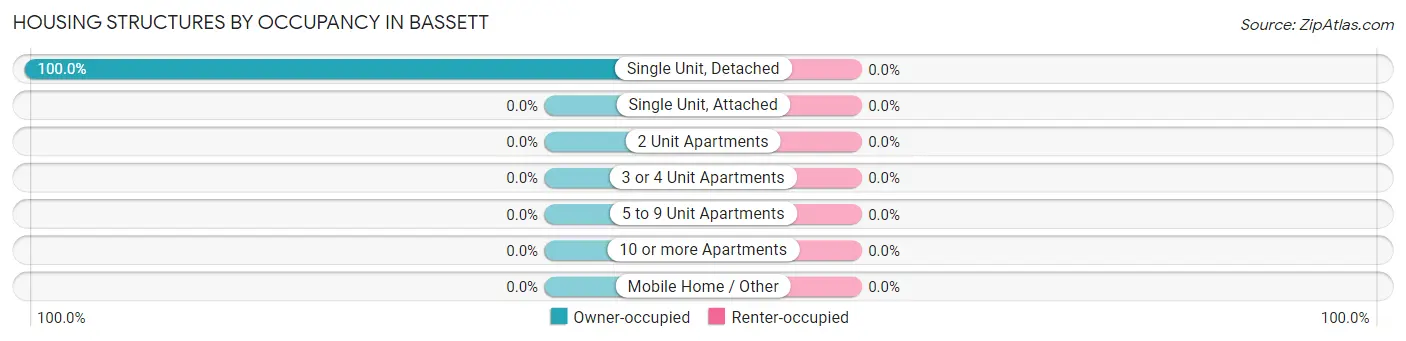
| Structure Type | Owner-occupied | Renter-occupied |
| Single Unit, Detached | 6 (100.0%) | 0 (0.0%) |
| Single Unit, Attached | 0 (0.0%) | 0 (0.0%) |
| 2 Unit Apartments | 0 (0.0%) | 0 (0.0%) |
| 3 or 4 Unit Apartments | 0 (0.0%) | 0 (0.0%) |
| 5 to 9 Unit Apartments | 0 (0.0%) | 0 (0.0%) |
| 10 or more Apartments | 0 (0.0%) | 0 (0.0%) |
| Mobile Home / Other | 0 (0.0%) | 0 (0.0%) |
| Total | 6 (100.0%) | 0 (0.0%) |
Housing Structures by Number of Rooms in Bassett
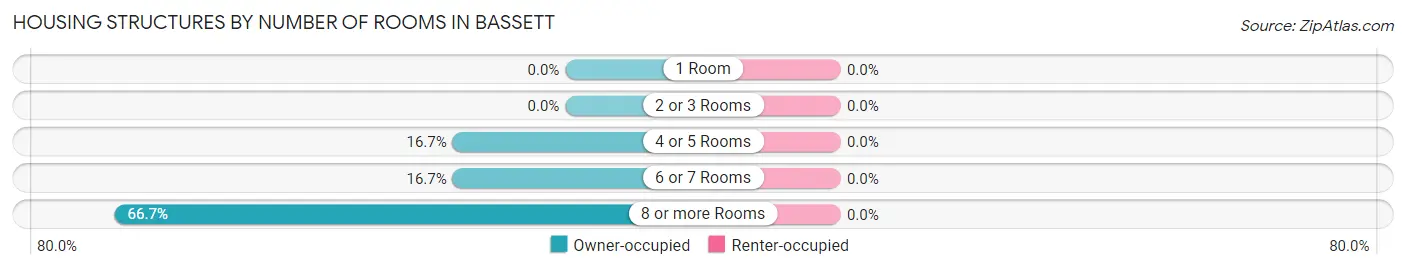
| Number of Rooms | Owner-occupied | Renter-occupied |
| 1 Room | 0 (0.0%) | 0 (0.0%) |
| 2 or 3 Rooms | 0 (0.0%) | 0 (0.0%) |
| 4 or 5 Rooms | 1 (16.7%) | 0 (0.0%) |
| 6 or 7 Rooms | 1 (16.7%) | 0 (0.0%) |
| 8 or more Rooms | 4 (66.7%) | 0 (0.0%) |
| Total | 6 (100.0%) | 0 (0.0%) |
Housing Structure by Heating Type in Bassett
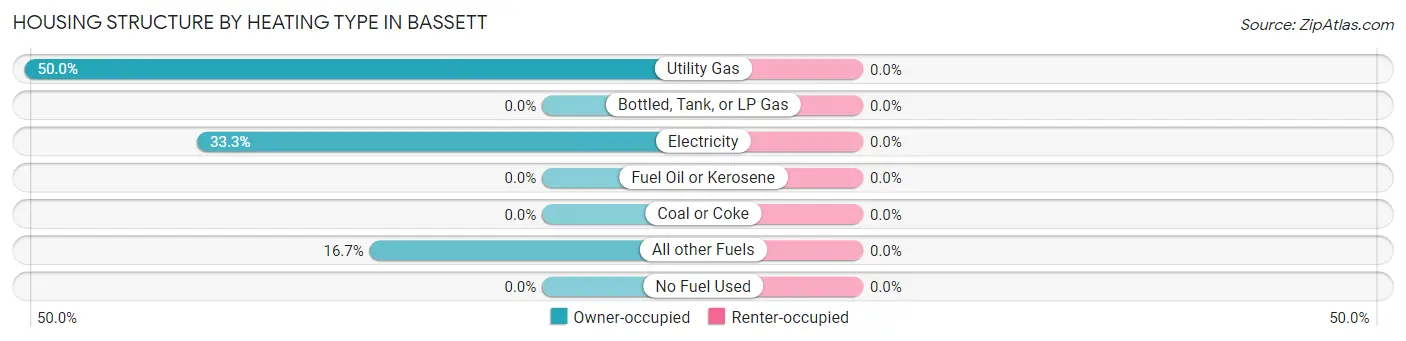
| Heating Type | Owner-occupied | Renter-occupied |
| Utility Gas | 3 (50.0%) | 0 (0.0%) |
| Bottled, Tank, or LP Gas | 0 (0.0%) | 0 (0.0%) |
| Electricity | 2 (33.3%) | 0 (0.0%) |
| Fuel Oil or Kerosene | 0 (0.0%) | 0 (0.0%) |
| Coal or Coke | 0 (0.0%) | 0 (0.0%) |
| All other Fuels | 1 (16.7%) | 0 (0.0%) |
| No Fuel Used | 0 (0.0%) | 0 (0.0%) |
| Total | 6 (100.0%) | 0 (0.0%) |
Household Vehicle Usage in Bassett
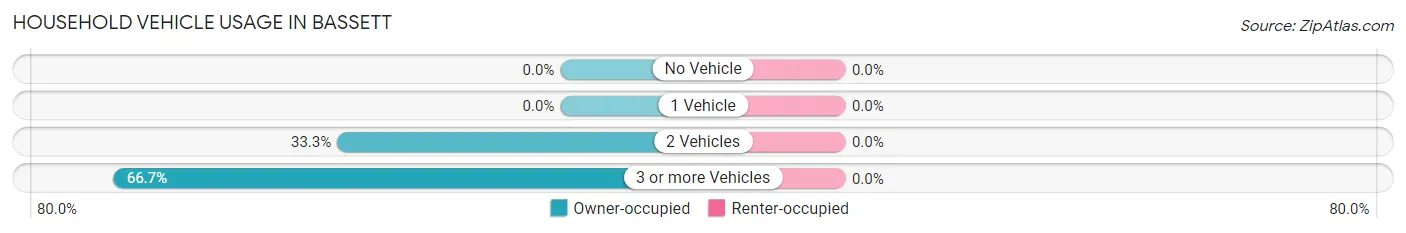
| Vehicles per Household | Owner-occupied | Renter-occupied |
| No Vehicle | 0 (0.0%) | 0 (0.0%) |
| 1 Vehicle | 0 (0.0%) | 0 (0.0%) |
| 2 Vehicles | 2 (33.3%) | 0 (0.0%) |
| 3 or more Vehicles | 4 (66.7%) | 0 (0.0%) |
| Total | 6 (100.0%) | 0 (0.0%) |
Real Estate & Mortgages in Bassett
Real Estate and Mortgage Overview in Bassett
| Characteristic | Without Mortgage | With Mortgage |
| Housing Units | 6 | 0 |
| Median Property Value | $125,000 | $0 |
| Median Household Income | - | - |
| Monthly Housing Costs | $933 | $0 |
| Real Estate Taxes | - | - |
Property Value by Mortgage Status in Bassett
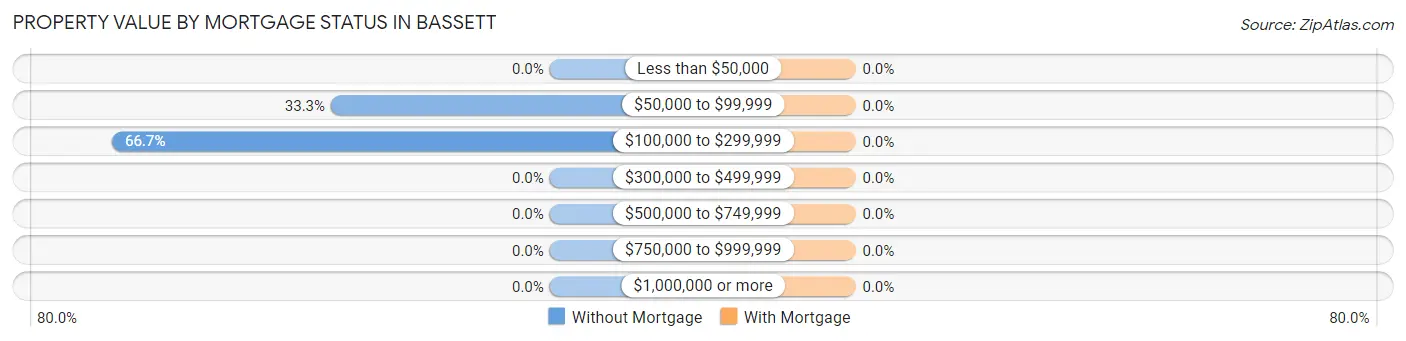
| Property Value | Without Mortgage | With Mortgage |
| Less than $50,000 | 0 (0.0%) | 0 (0.0%) |
| $50,000 to $99,999 | 2 (33.3%) | 0 (0.0%) |
| $100,000 to $299,999 | 4 (66.7%) | 0 (0.0%) |
| $300,000 to $499,999 | 0 (0.0%) | 0 (0.0%) |
| $500,000 to $749,999 | 0 (0.0%) | 0 (0.0%) |
| $750,000 to $999,999 | 0 (0.0%) | 0 (0.0%) |
| $1,000,000 or more | 0 (0.0%) | 0 (0.0%) |
| Total | 6 (100.0%) | 0 (0.0%) |
Household Income by Mortgage Status in Bassett
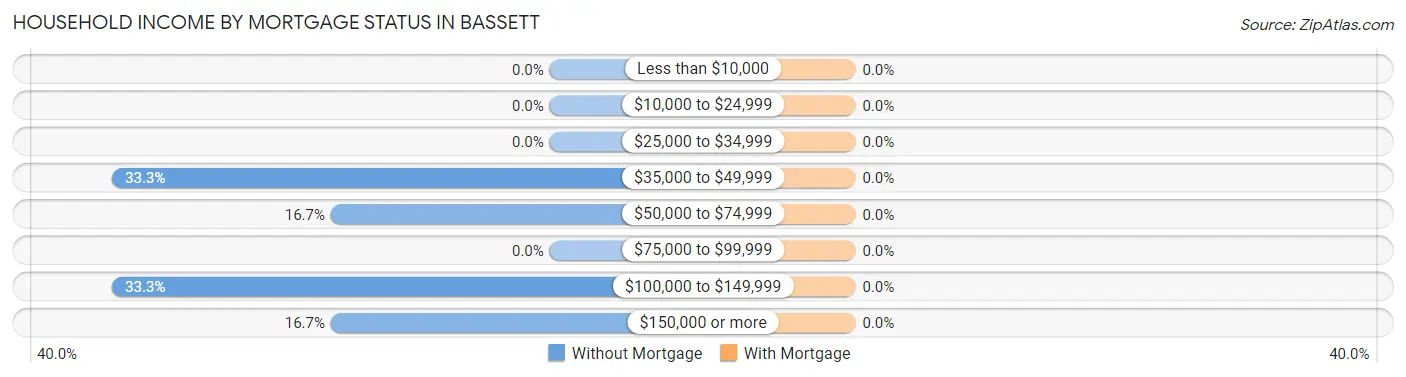
| Household Income | Without Mortgage | With Mortgage |
| Less than $10,000 | 0 (0.0%) | 0 (0.0%) |
| $10,000 to $24,999 | 0 (0.0%) | 0 (0.0%) |
| $25,000 to $34,999 | 0 (0.0%) | 0 (0.0%) |
| $35,000 to $49,999 | 2 (33.3%) | 0 (0.0%) |
| $50,000 to $74,999 | 1 (16.7%) | 0 (0.0%) |
| $75,000 to $99,999 | 0 (0.0%) | 0 (0.0%) |
| $100,000 to $149,999 | 2 (33.3%) | 0 (0.0%) |
| $150,000 or more | 1 (16.7%) | 0 (0.0%) |
| Total | 6 (100.0%) | 0 (0.0%) |
Property Value to Household Income Ratio in Bassett
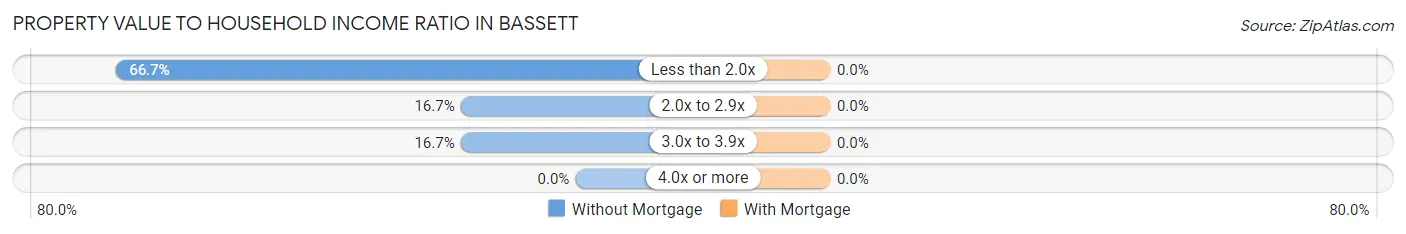
| Value-to-Income Ratio | Without Mortgage | With Mortgage |
| Less than 2.0x | 4 (66.7%) | 0 (0.0%) |
| 2.0x to 2.9x | 1 (16.7%) | 0 (0.0%) |
| 3.0x to 3.9x | 1 (16.7%) | 0 (0.0%) |
| 4.0x or more | 0 (0.0%) | 0 (0.0%) |
| Total | 6 (100.0%) | 0 (0.0%) |
Real Estate Taxes by Mortgage Status in Bassett
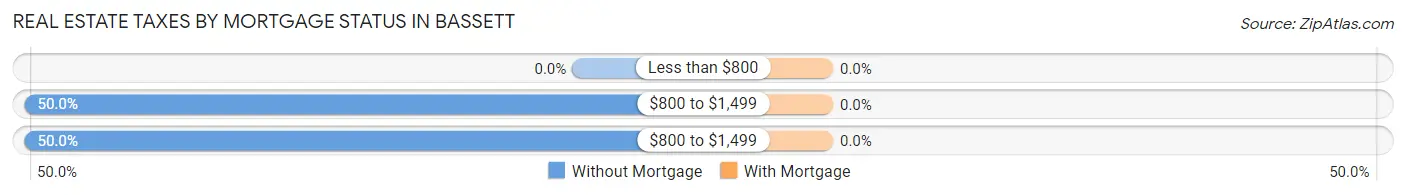
| Property Taxes | Without Mortgage | With Mortgage |
| Less than $800 | 0 (0.0%) | 0 (0.0%) |
| $800 to $1,499 | 3 (50.0%) | 0 (0.0%) |
| $800 to $1,499 | 3 (50.0%) | 0 (0.0%) |
| Total | 6 (100.0%) | 0 (0.0%) |
Health & Disability in Bassett
Health Insurance Coverage by Age in Bassett
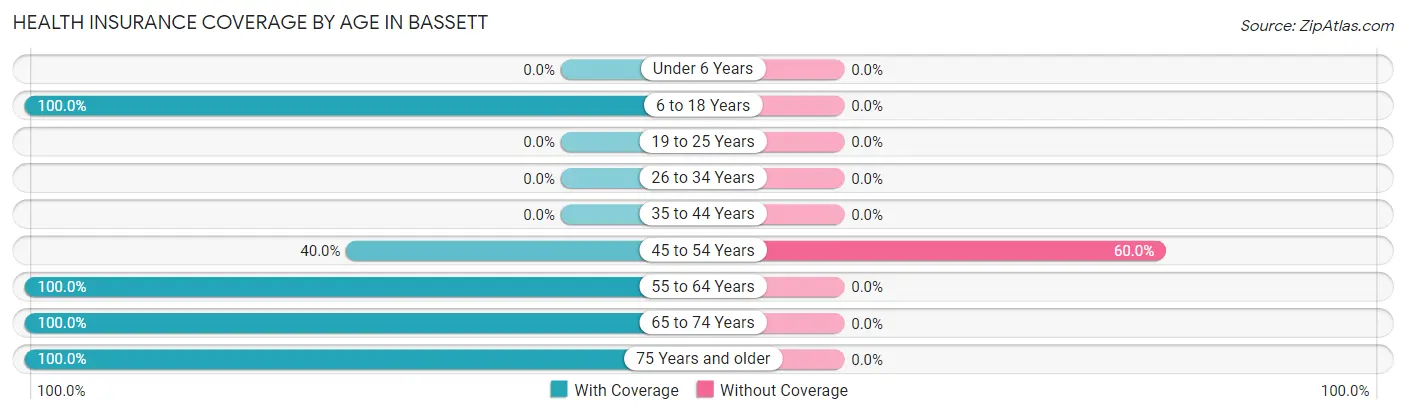
| Age Bracket | With Coverage | Without Coverage |
| Under 6 Years | 0 (0.0%) | 0 (0.0%) |
| 6 to 18 Years | 7 (100.0%) | 0 (0.0%) |
| 19 to 25 Years | 0 (0.0%) | 0 (0.0%) |
| 26 to 34 Years | 0 (0.0%) | 0 (0.0%) |
| 35 to 44 Years | 0 (0.0%) | 0 (0.0%) |
| 45 to 54 Years | 4 (40.0%) | 6 (60.0%) |
| 55 to 64 Years | 2 (100.0%) | 0 (0.0%) |
| 65 to 74 Years | 3 (100.0%) | 0 (0.0%) |
| 75 Years and older | 1 (100.0%) | 0 (0.0%) |
| Total | 17 (73.9%) | 6 (26.1%) |
Health Insurance Coverage by Citizenship Status in Bassett
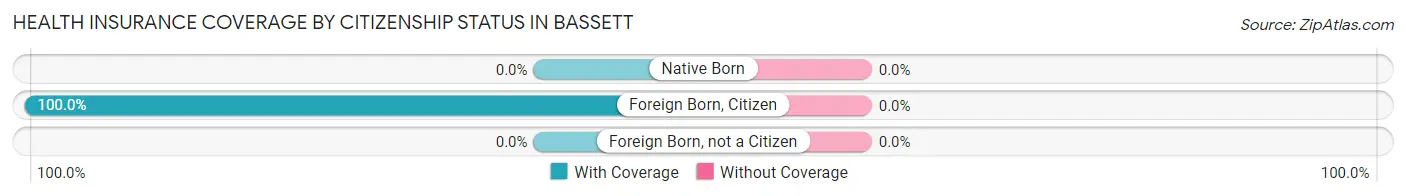
| Citizenship Status | With Coverage | Without Coverage |
| Native Born | 0 (0.0%) | 0 (0.0%) |
| Foreign Born, Citizen | 7 (100.0%) | 0 (0.0%) |
| Foreign Born, not a Citizen | 0 (0.0%) | 0 (0.0%) |
Health Insurance Coverage by Household Income in Bassett
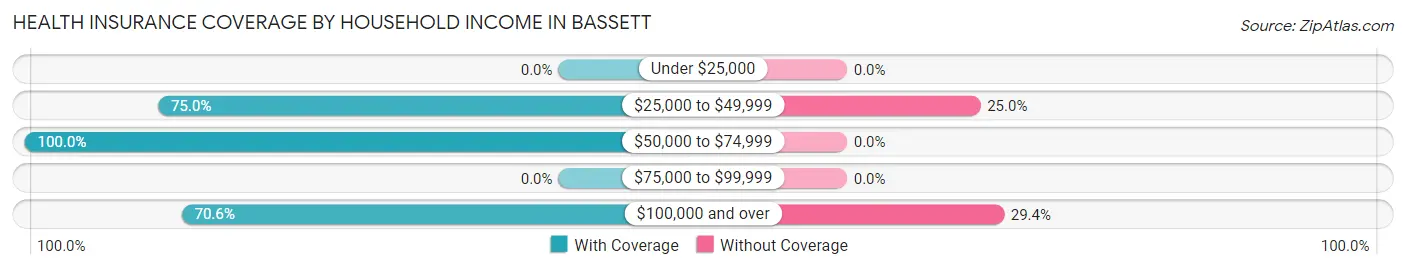
| Household Income | With Coverage | Without Coverage |
| Under $25,000 | 0 (0.0%) | 0 (0.0%) |
| $25,000 to $49,999 | 3 (75.0%) | 1 (25.0%) |
| $50,000 to $74,999 | 2 (100.0%) | 0 (0.0%) |
| $75,000 to $99,999 | 0 (0.0%) | 0 (0.0%) |
| $100,000 and over | 12 (70.6%) | 5 (29.4%) |
Public vs Private Health Insurance Coverage by Age in Bassett
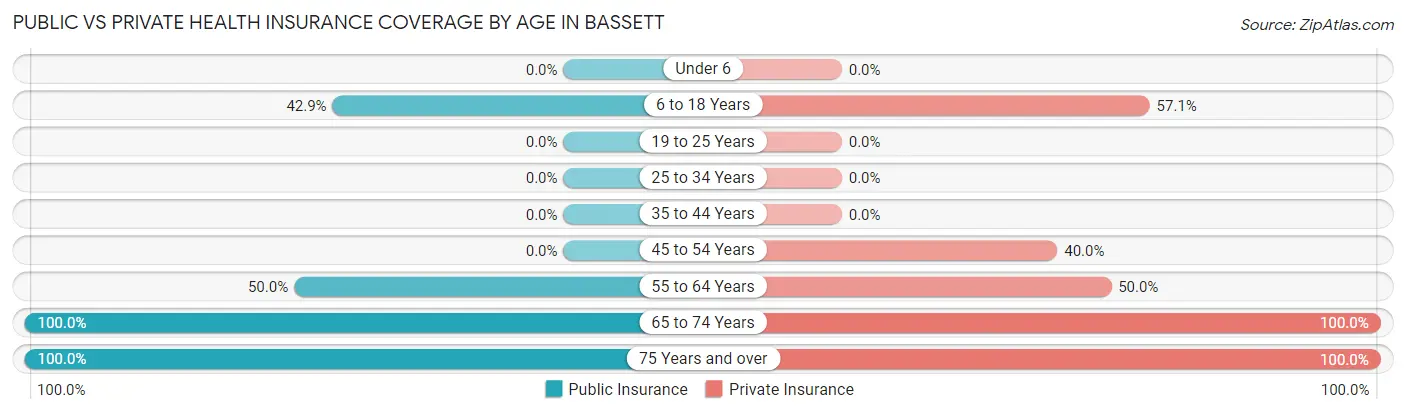
| Age Bracket | Public Insurance | Private Insurance |
| Under 6 | 0 (0.0%) | 0 (0.0%) |
| 6 to 18 Years | 3 (42.9%) | 4 (57.1%) |
| 19 to 25 Years | 0 (0.0%) | 0 (0.0%) |
| 25 to 34 Years | 0 (0.0%) | 0 (0.0%) |
| 35 to 44 Years | 0 (0.0%) | 0 (0.0%) |
| 45 to 54 Years | 0 (0.0%) | 4 (40.0%) |
| 55 to 64 Years | 1 (50.0%) | 1 (50.0%) |
| 65 to 74 Years | 3 (100.0%) | 3 (100.0%) |
| 75 Years and over | 1 (100.0%) | 1 (100.0%) |
| Total | 8 (34.8%) | 13 (56.5%) |
Disability Status by Sex by Age in Bassett
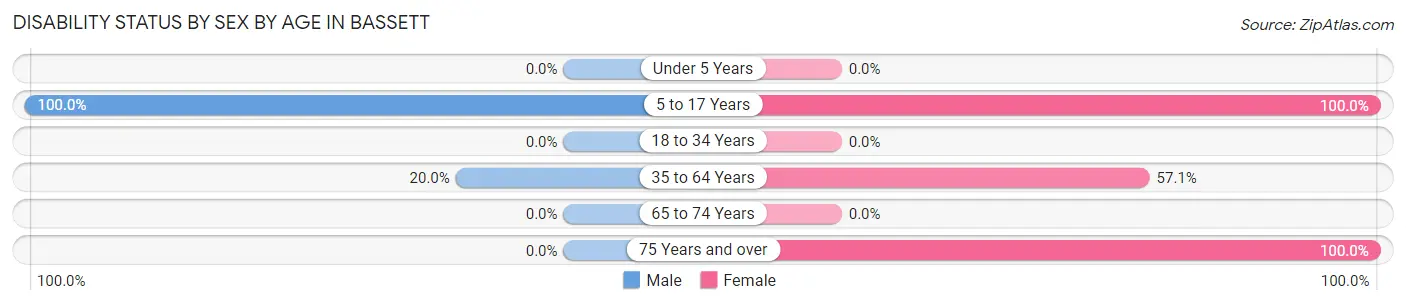
| Age Bracket | Male | Female |
| Under 5 Years | 0 (0.0%) | 0 (0.0%) |
| 5 to 17 Years | 2 (100.0%) | 1 (100.0%) |
| 18 to 34 Years | 0 (0.0%) | 0 (0.0%) |
| 35 to 64 Years | 1 (20.0%) | 4 (57.1%) |
| 65 to 74 Years | 0 (0.0%) | 0 (0.0%) |
| 75 Years and over | 0 (0.0%) | 1 (100.0%) |
Disability Class by Sex by Age in Bassett
Disability Class: Hearing Difficulty
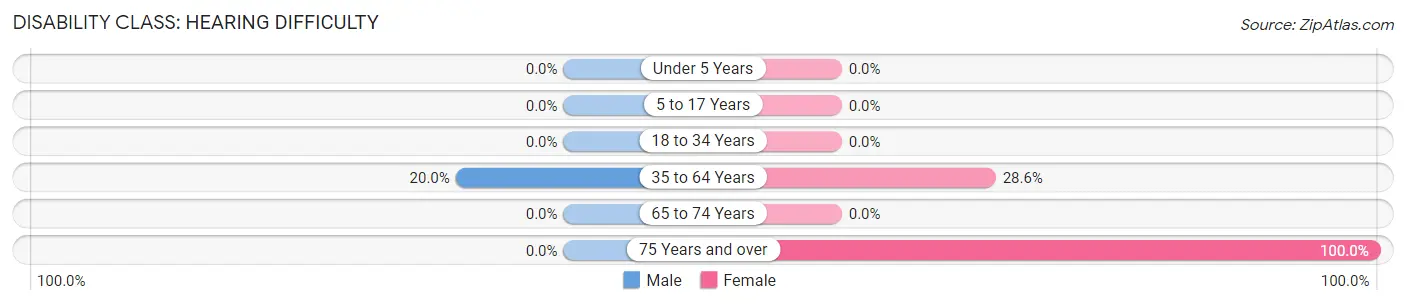
| Age Bracket | Male | Female |
| Under 5 Years | 0 (0.0%) | 0 (0.0%) |
| 5 to 17 Years | 0 (0.0%) | 0 (0.0%) |
| 18 to 34 Years | 0 (0.0%) | 0 (0.0%) |
| 35 to 64 Years | 1 (20.0%) | 2 (28.6%) |
| 65 to 74 Years | 0 (0.0%) | 0 (0.0%) |
| 75 Years and over | 0 (0.0%) | 1 (100.0%) |
Disability Class: Vision Difficulty
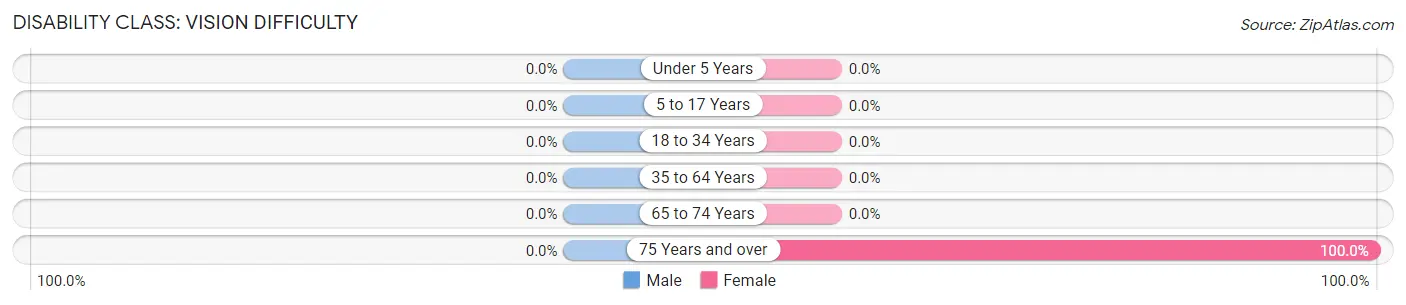
| Age Bracket | Male | Female |
| Under 5 Years | 0 (0.0%) | 0 (0.0%) |
| 5 to 17 Years | 0 (0.0%) | 0 (0.0%) |
| 18 to 34 Years | 0 (0.0%) | 0 (0.0%) |
| 35 to 64 Years | 0 (0.0%) | 0 (0.0%) |
| 65 to 74 Years | 0 (0.0%) | 0 (0.0%) |
| 75 Years and over | 0 (0.0%) | 1 (100.0%) |
Disability Class: Cognitive Difficulty
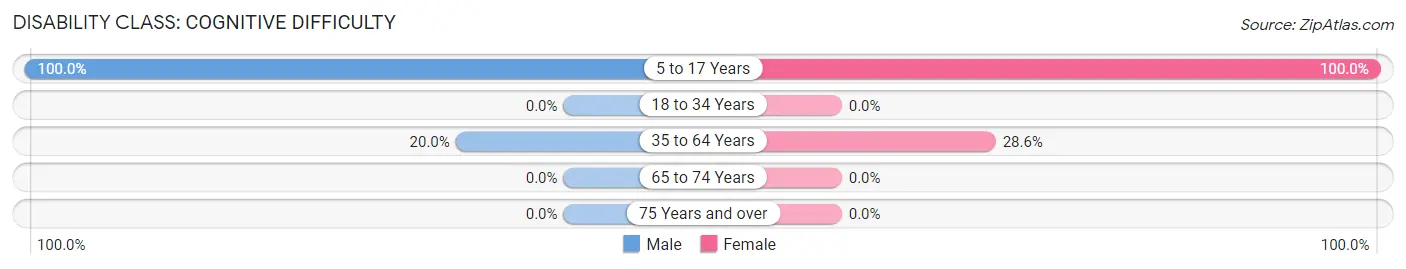
| Age Bracket | Male | Female |
| 5 to 17 Years | 2 (100.0%) | 1 (100.0%) |
| 18 to 34 Years | 0 (0.0%) | 0 (0.0%) |
| 35 to 64 Years | 1 (20.0%) | 2 (28.6%) |
| 65 to 74 Years | 0 (0.0%) | 0 (0.0%) |
| 75 Years and over | 0 (0.0%) | 0 (0.0%) |
Disability Class: Ambulatory Difficulty
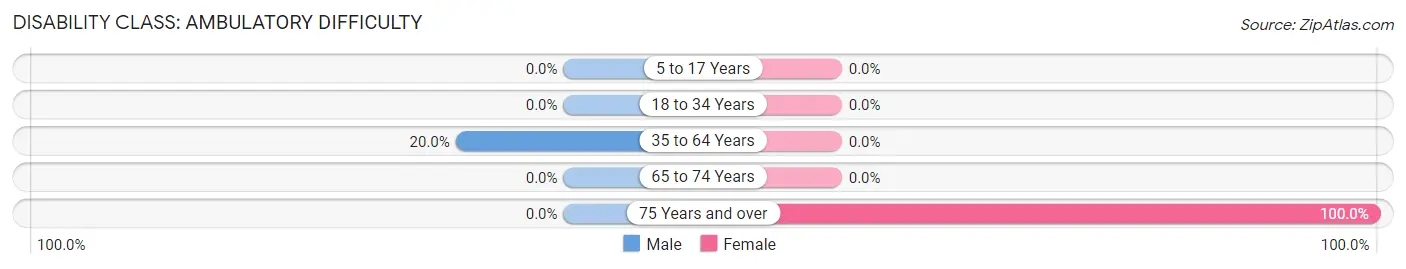
| Age Bracket | Male | Female |
| 5 to 17 Years | 0 (0.0%) | 0 (0.0%) |
| 18 to 34 Years | 0 (0.0%) | 0 (0.0%) |
| 35 to 64 Years | 1 (20.0%) | 0 (0.0%) |
| 65 to 74 Years | 0 (0.0%) | 0 (0.0%) |
| 75 Years and over | 0 (0.0%) | 1 (100.0%) |
Disability Class: Self-Care Difficulty
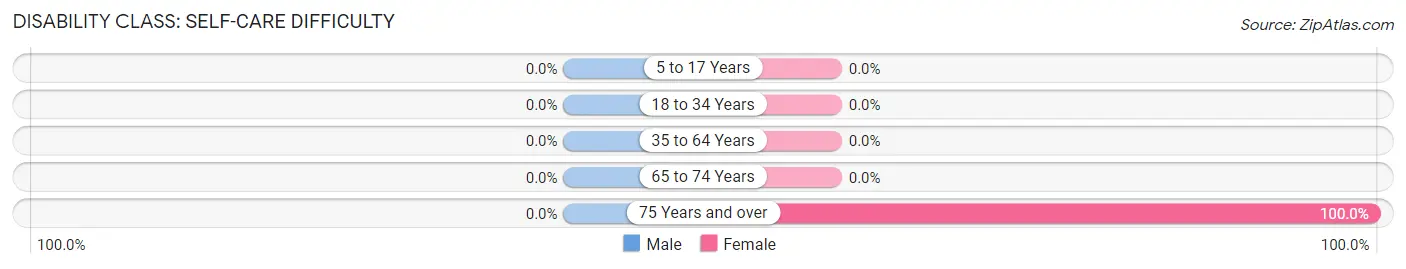
| Age Bracket | Male | Female |
| 5 to 17 Years | 0 (0.0%) | 0 (0.0%) |
| 18 to 34 Years | 0 (0.0%) | 0 (0.0%) |
| 35 to 64 Years | 0 (0.0%) | 0 (0.0%) |
| 65 to 74 Years | 0 (0.0%) | 0 (0.0%) |
| 75 Years and over | 0 (0.0%) | 1 (100.0%) |
Technology Access in Bassett
Computing Device Access in Bassett
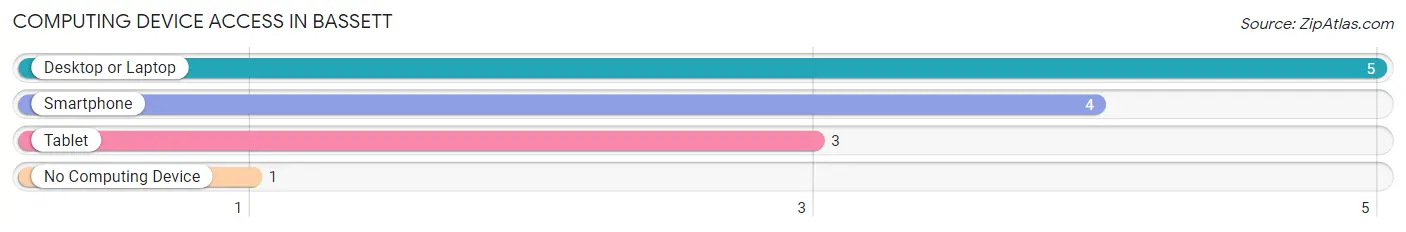
| Device Type | # Households | % Households |
| Desktop or Laptop | 5 | 83.3% |
| Smartphone | 4 | 66.7% |
| Tablet | 3 | 50.0% |
| No Computing Device | 1 | 16.7% |
| Total | 6 | 100.0% |
Internet Access in Bassett
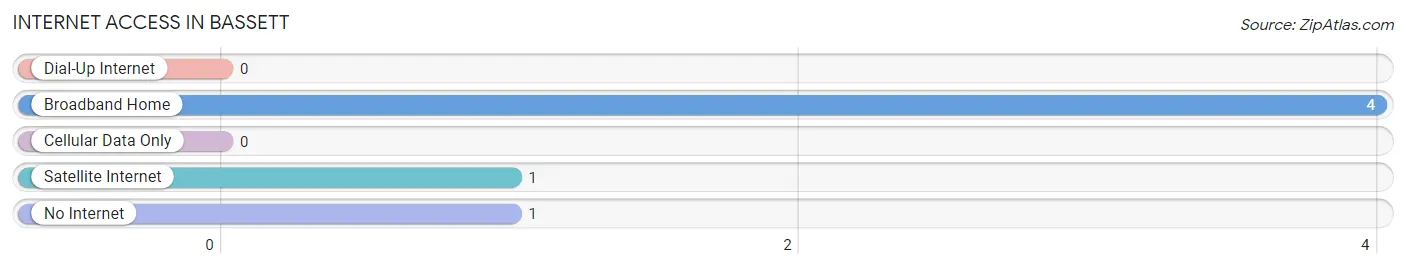
| Internet Type | # Households | % Households |
| Dial-Up Internet | 0 | 0.0% |
| Broadband Home | 4 | 66.7% |
| Cellular Data Only | 0 | 0.0% |
| Satellite Internet | 1 | 16.7% |
| No Internet | 1 | 16.7% |
| Total | 6 | 100.0% |
Bassett Summary
Bassett is a small town located in the northwest corner of Kansas, in the county of Norton. It is situated on the banks of the Republican River, and is surrounded by rolling hills and farmland. The town was founded in 1887, and has a population of just over 500 people.
Geography
Bassett is located in the northwest corner of Kansas, in the county of Norton. It is situated on the banks of the Republican River, and is surrounded by rolling hills and farmland. The town is located at an elevation of 1,845 feet above sea level. The climate in Bassett is semi-arid, with hot summers and cold winters. The average annual temperature is around 54 degrees Fahrenheit, and the average annual precipitation is around 20 inches.
Economy
The economy of Bassett is largely based on agriculture. The town is home to several farms, which produce a variety of crops, including corn, wheat, soybeans, and sorghum. The town also has a few small businesses, including a grocery store, a hardware store, and a few restaurants.
Demographics
As of the 2010 census, the population of Bassett was 514. The racial makeup of the town was 97.3% White, 0.6% African American, 0.2% Native American, 0.2% Asian, 0.2% from other races, and 1.5% from two or more races. The median household income was $37,500, and the median family income was $45,000.
History
Bassett was founded in 1887 by a group of settlers from Nebraska. The town was named after a local rancher, William Bassett. The town quickly grew, and by the early 1900s, it had become a thriving agricultural community. The town was also home to several businesses, including a bank, a hotel, and a general store.
In the early 1900s, the town was hit hard by the Great Depression, and many of the businesses closed. However, the town was able to recover, and by the 1950s, it had become a prosperous farming community.
Today, Bassett is a small, quiet town. It is home to a few small businesses, and the town is surrounded by farmland. The town is also home to a few historic buildings, including the Bassett Opera House, which was built in 1887.
Common Questions
What is Per Capita Income in Bassett?
Per Capita income in Bassett is $33,378.
What is Inequality or Gini Index in Bassett?
Inequality or Gini Index in Bassett is 0.32.
What is the Total Population of Bassett?
Total Population of Bassett is 23.
What is the Total Male Population of Bassett?
Total Male Population of Bassett is 12.
What is the Total Female Population of Bassett?
Total Female Population of Bassett is 11.
What is the Ratio of Males per 100 Females in Bassett?
There are 109.09 Males per 100 Females in Bassett.
What is the Ratio of Females per 100 Males in Bassett?
There are 91.67 Females per 100 Males in Bassett.
What is the Median Population Age in Bassett?
Median Population Age in Bassett is 49.3 Years.
What is the Average Family Size in Bassett
Average Family Size in Bassett is 3.8 People.
What is the Average Household Size in Bassett
Average Household Size in Bassett is 3.8 People.
How Large is the Labor Force in Bassett?
There are 13 People in the Labor Forcein in Bassett.
What is the Percentage of People in the Labor Force in Bassett?
59.1% of People are in the Labor Force in Bassett.
What is the Unemployment Rate in Bassett?
Unemployment Rate in Bassett is 30.8%.