Detroit, KS Map & Demographics
Detroit Map
Detroit Overview
$27,676
PER CAPITA INCOME
$101,750
AVG FAMILY INCOME
0.34
INEQUALITY / GINI INDEX
139
TOTAL POPULATION
108
MALE POPULATION
31
FEMALE POPULATION
348.39
MALES / 100 FEMALES
28.70
FEMALES / 100 MALES
33.5
MEDIAN AGE
3.1
AVG FAMILY SIZE
2.6
AVG HOUSEHOLD SIZE
65
LABOR FORCE [ PEOPLE ]
46.8%
PERCENT IN LABOR FORCE
Income in Detroit
Income Overview in Detroit
| Characteristic | Number | Measure |
| Per Capita Income | 139 | $27,676 |
| Median Family Income | 38 | $101,750 |
| Mean Family Income | 38 | $88,242 |
| Median Household Income | 53 | $0 |
| Mean Household Income | 53 | $72,177 |
| Income Deficit | 38 | $0 |
| Wage / Income Gap (%) | 139 | 0.00% |
| Wage / Income Gap ($) | 139 | 100.00¢ per $1 |
| Gini / Inequality Index | 139 | 0.34 |
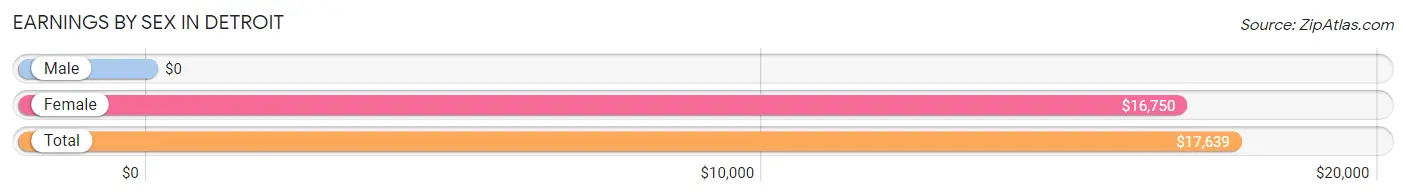
Earnings by Sex in Detroit
| Sex | Number | Average Earnings |
| Male | 68 (76.4%) | $0 |
| Female | 21 (23.6%) | $16,750 |
| Total | 89 (100.0%) | $17,639 |
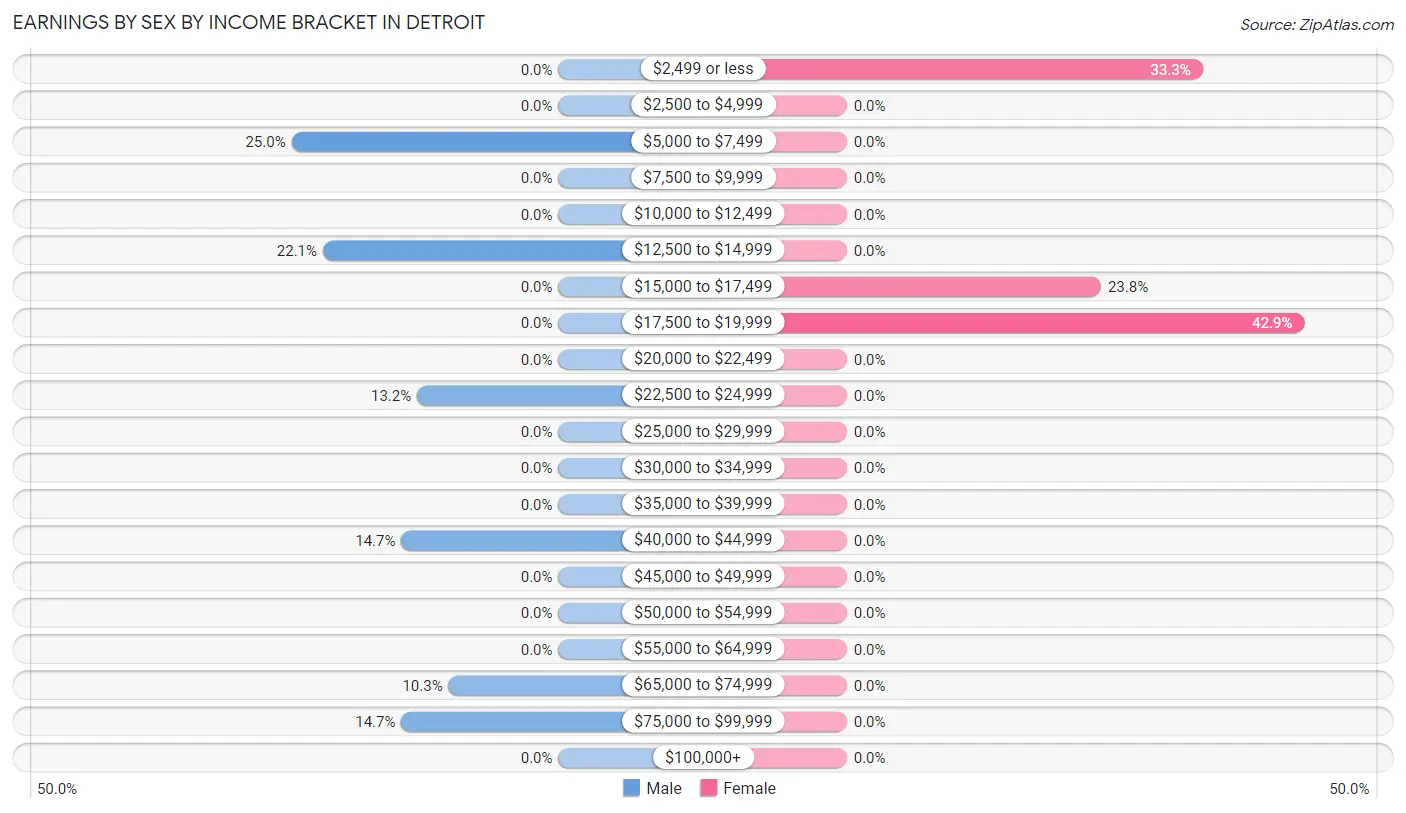
Earnings by Sex by Income Bracket in Detroit
The most common earnings brackets in Detroit are $5,000 to $7,499 for men (17 | 25.0%) and $17,500 to $19,999 for women (9 | 42.9%).
| Income | Male | Female |
| $2,499 or less | 0 (0.0%) | 7 (33.3%) |
| $2,500 to $4,999 | 0 (0.0%) | 0 (0.0%) |
| $5,000 to $7,499 | 17 (25.0%) | 0 (0.0%) |
| $7,500 to $9,999 | 0 (0.0%) | 0 (0.0%) |
| $10,000 to $12,499 | 0 (0.0%) | 0 (0.0%) |
| $12,500 to $14,999 | 15 (22.1%) | 0 (0.0%) |
| $15,000 to $17,499 | 0 (0.0%) | 5 (23.8%) |
| $17,500 to $19,999 | 0 (0.0%) | 9 (42.9%) |
| $20,000 to $22,499 | 0 (0.0%) | 0 (0.0%) |
| $22,500 to $24,999 | 9 (13.2%) | 0 (0.0%) |
| $25,000 to $29,999 | 0 (0.0%) | 0 (0.0%) |
| $30,000 to $34,999 | 0 (0.0%) | 0 (0.0%) |
| $35,000 to $39,999 | 0 (0.0%) | 0 (0.0%) |
| $40,000 to $44,999 | 10 (14.7%) | 0 (0.0%) |
| $45,000 to $49,999 | 0 (0.0%) | 0 (0.0%) |
| $50,000 to $54,999 | 0 (0.0%) | 0 (0.0%) |
| $55,000 to $64,999 | 0 (0.0%) | 0 (0.0%) |
| $65,000 to $74,999 | 7 (10.3%) | 0 (0.0%) |
| $75,000 to $99,999 | 10 (14.7%) | 0 (0.0%) |
| $100,000+ | 0 (0.0%) | 0 (0.0%) |
| Total | 68 (100.0%) | 21 (100.0%) |
Earnings by Sex by Educational Attainment in Detroit
| Educational Attainment | Male Income | Female Income |
| Less than High School | - | - |
| High School Diploma | - | - |
| College or Associate's Degree | - | - |
| Bachelor's Degree | - | - |
| Graduate Degree | - | - |
| Total | - | - |
Family Income in Detroit
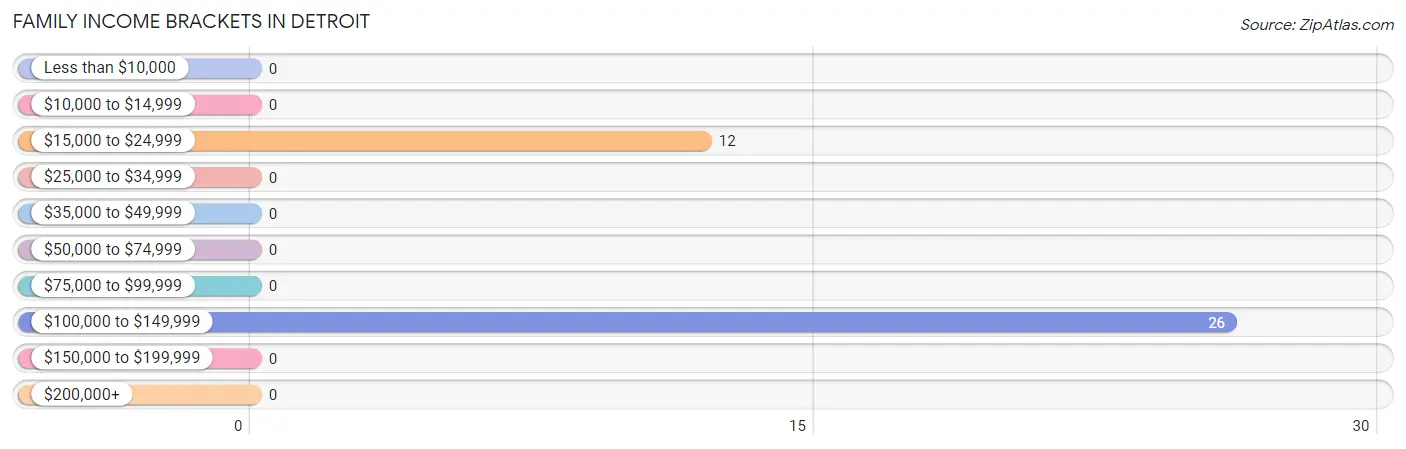
Family Income Brackets in Detroit
According to the Detroit family income data, there are 26 families falling into the $100,000 to $149,999 income range, which is the most common income bracket and makes up 68.4% of all families.
| Income Bracket | # Families | % Families |
| Less than $10,000 | 0 | 0.0% |
| $10,000 to $14,999 | 0 | 0.0% |
| $15,000 to $24,999 | 12 | 31.6% |
| $25,000 to $34,999 | 0 | 0.0% |
| $35,000 to $49,999 | 0 | 0.0% |
| $50,000 to $74,999 | 0 | 0.0% |
| $75,000 to $99,999 | 0 | 0.0% |
| $100,000 to $149,999 | 26 | 68.4% |
| $150,000 to $199,999 | 0 | 0.0% |
| $200,000+ | 0 | 0.0% |
Family Income by Famaliy Size in Detroit
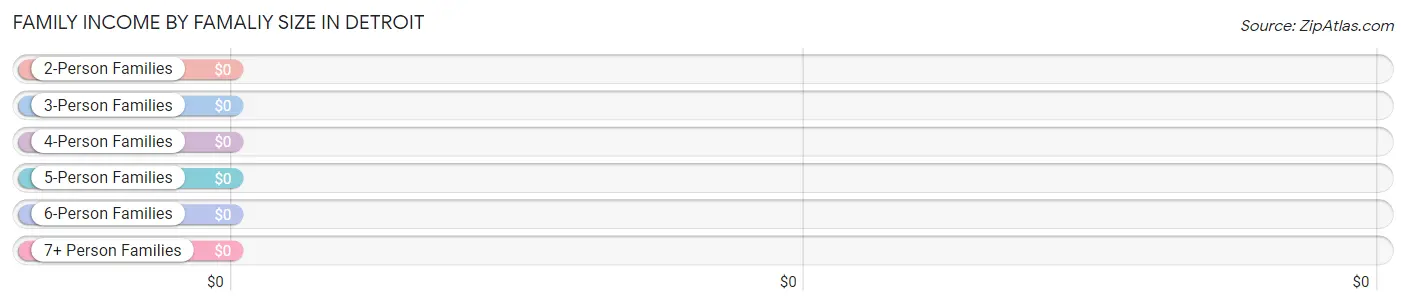
| Income Bracket | # Families | Median Income |
| 2-Person Families | 28 (73.7%) | $0 |
| 3-Person Families | 0 (0.0%) | $0 |
| 4-Person Families | 0 (0.0%) | $0 |
| 5-Person Families | 10 (26.3%) | $0 |
| 6-Person Families | 0 (0.0%) | $0 |
| 7+ Person Families | 0 (0.0%) | $0 |
| Total | 38 (100.0%) | $101,750 |
Family Income by Number of Earners in Detroit
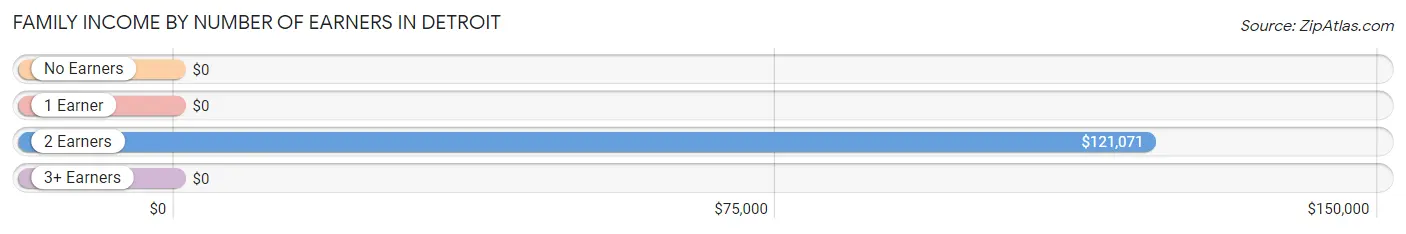
| Number of Earners | # Families | Median Income |
| No Earners | 0 (0.0%) | $0 |
| 1 Earner | 12 (31.6%) | $0 |
| 2 Earners | 26 (68.4%) | $121,071 |
| 3+ Earners | 0 (0.0%) | $0 |
| Total | 38 (100.0%) | $101,750 |
Household Income in Detroit
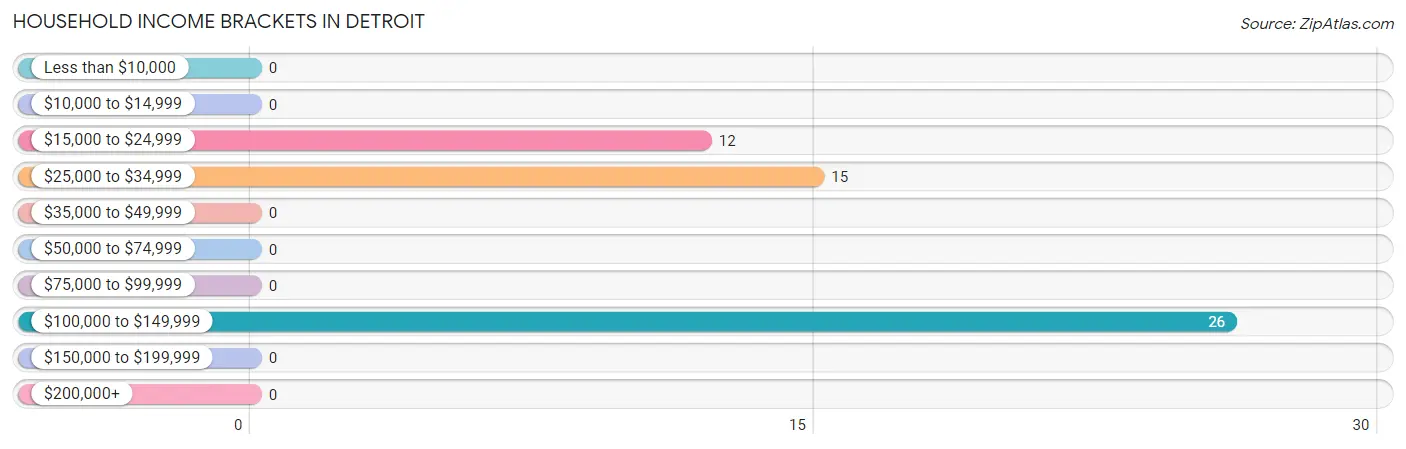
Household Income Brackets in Detroit
With 26 households falling in the category, the $100,000 to $149,999 income range is the most frequent in Detroit, accounting for 49.1% of all households.
| Income Bracket | # Households | % Households |
| Less than $10,000 | 0 | 0.0% |
| $10,000 to $14,999 | 0 | 0.0% |
| $15,000 to $24,999 | 12 | 22.6% |
| $25,000 to $34,999 | 15 | 28.3% |
| $35,000 to $49,999 | 0 | 0.0% |
| $50,000 to $74,999 | 0 | 0.0% |
| $75,000 to $99,999 | 0 | 0.0% |
| $100,000 to $149,999 | 26 | 49.1% |
| $150,000 to $199,999 | 0 | 0.0% |
| $200,000+ | 0 | 0.0% |
Household Income by Householder Age in Detroit
| Income Bracket | # Households | Median Income |
| 15 to 24 Years | 15 (28.3%) | $0 |
| 25 to 44 Years | 0 (0.0%) | $0 |
| 45 to 64 Years | 21 (39.6%) | $0 |
| 65+ Years | 17 (32.1%) | $0 |
| Total | 53 (100.0%) | $0 |
Poverty in Detroit
Income Below Poverty by Sex and Age in Detroit
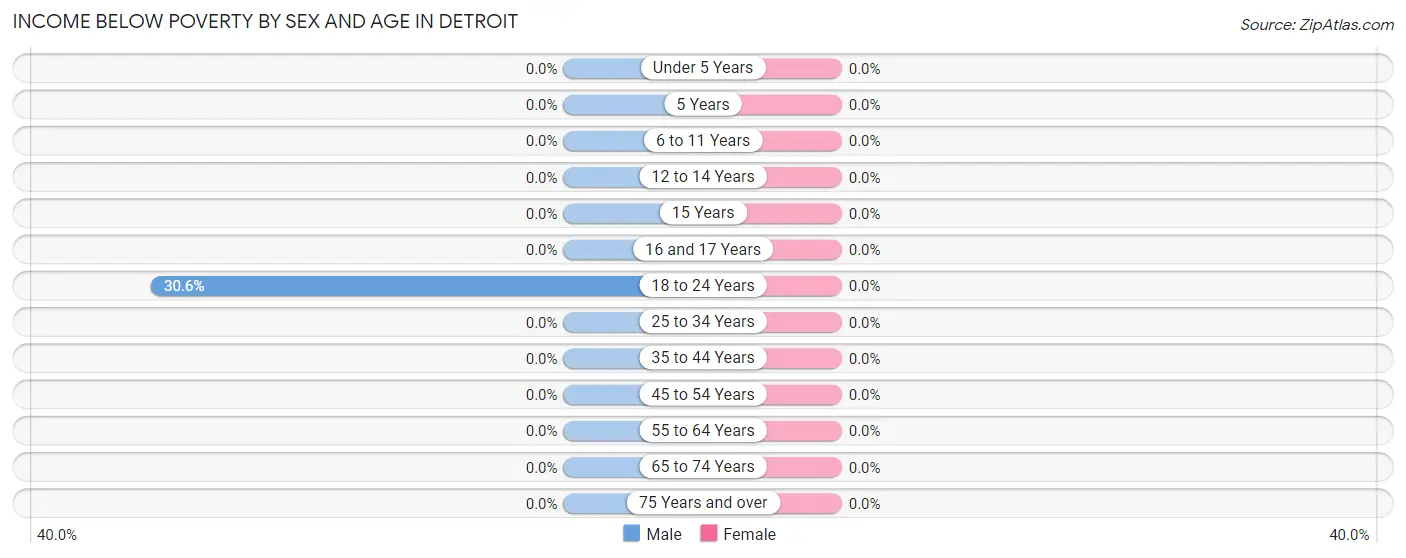
| Age Bracket | Male | Female |
| Under 5 Years | 0 (0.0%) | 0 (0.0%) |
| 5 Years | 0 (0.0%) | 0 (0.0%) |
| 6 to 11 Years | 0 (0.0%) | 0 (0.0%) |
| 12 to 14 Years | 0 (0.0%) | 0 (0.0%) |
| 15 Years | 0 (0.0%) | 0 (0.0%) |
| 16 and 17 Years | 0 (0.0%) | 0 (0.0%) |
| 18 to 24 Years | 15 (30.6%) | 0 (0.0%) |
| 25 to 34 Years | 0 (0.0%) | 0 (0.0%) |
| 35 to 44 Years | 0 (0.0%) | 0 (0.0%) |
| 45 to 54 Years | 0 (0.0%) | 0 (0.0%) |
| 55 to 64 Years | 0 (0.0%) | 0 (0.0%) |
| 65 to 74 Years | 0 (0.0%) | 0 (0.0%) |
| 75 Years and over | 0 (0.0%) | 0 (0.0%) |
| Total | 15 (13.9%) | 0 (0.0%) |
Income Above Poverty by Sex and Age in Detroit
According to the poverty statistics in Detroit, males aged 16 and 17 years and females aged 18 to 24 years are the age groups that are most secure financially, with 100.0% of males and 100.0% of females in these age groups living above the poverty line.
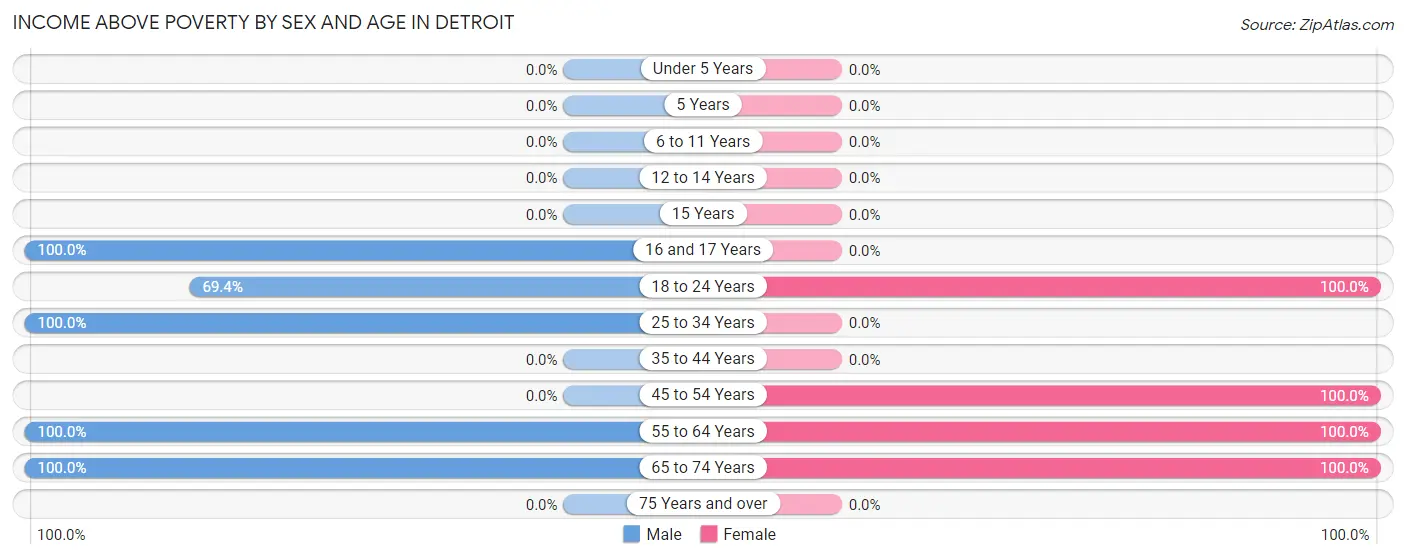
| Age Bracket | Male | Female |
| Under 5 Years | 0 (0.0%) | 0 (0.0%) |
| 5 Years | 0 (0.0%) | 0 (0.0%) |
| 6 to 11 Years | 0 (0.0%) | 0 (0.0%) |
| 12 to 14 Years | 0 (0.0%) | 0 (0.0%) |
| 15 Years | 0 (0.0%) | 0 (0.0%) |
| 16 and 17 Years | 11 (100.0%) | 0 (0.0%) |
| 18 to 24 Years | 34 (69.4%) | 5 (100.0%) |
| 25 to 34 Years | 9 (100.0%) | 0 (0.0%) |
| 35 to 44 Years | 0 (0.0%) | 0 (0.0%) |
| 45 to 54 Years | 0 (0.0%) | 9 (100.0%) |
| 55 to 64 Years | 12 (100.0%) | 10 (100.0%) |
| 65 to 74 Years | 27 (100.0%) | 7 (100.0%) |
| 75 Years and over | 0 (0.0%) | 0 (0.0%) |
| Total | 93 (86.1%) | 31 (100.0%) |
Income Below Poverty Among Married-Couple Families in Detroit
| Children | Above Poverty | Below Poverty |
| No Children | 16 (100.0%) | 0 (0.0%) |
| 1 or 2 Children | 10 (100.0%) | 0 (0.0%) |
| 3 or 4 Children | 0 (0.0%) | 0 (0.0%) |
| 5 or more Children | 0 (0.0%) | 0 (0.0%) |
| Total | 26 (100.0%) | 0 (0.0%) |
Income Below Poverty Among Single-Parent Households in Detroit
| Children | Single Father | Single Mother |
| No Children | 0 (0.0%) | 0 (0.0%) |
| 1 or 2 Children | 0 (0.0%) | 0 (0.0%) |
| 3 or 4 Children | 0 (0.0%) | 0 (0.0%) |
| 5 or more Children | 0 (0.0%) | 0 (0.0%) |
| Total | 0 (0.0%) | 0 (0.0%) |
Income Below Poverty Among Married-Couple vs Single-Parent Households in Detroit
| Children | Married-Couple Families | Single-Parent Households |
| No Children | 0 (0.0%) | 0 (0.0%) |
| 1 or 2 Children | 0 (0.0%) | 0 (0.0%) |
| 3 or 4 Children | 0 (0.0%) | 0 (0.0%) |
| 5 or more Children | 0 (0.0%) | 0 (0.0%) |
| Total | 0 (0.0%) | 0 (0.0%) |
Race in Detroit
The most populous races in Detroit are , and White / Caucasian (139 | 100.0%).
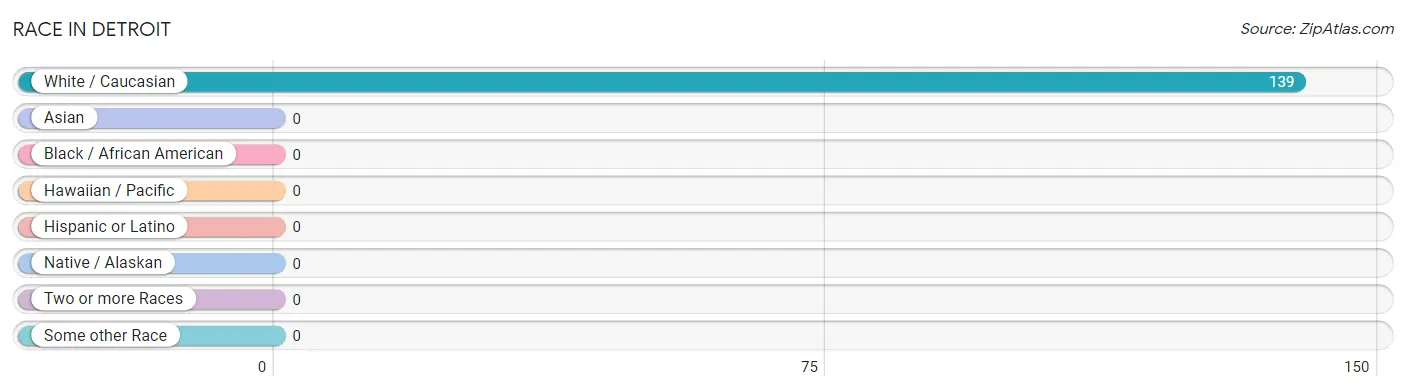
| Race | # Population | % Population |
| Asian | 0 | 0.0% |
| Black / African American | 0 | 0.0% |
| Hawaiian / Pacific | 0 | 0.0% |
| Hispanic or Latino | 0 | 0.0% |
| Native / Alaskan | 0 | 0.0% |
| White / Caucasian | 139 | 100.0% |
| Two or more Races | 0 | 0.0% |
| Some other Race | 0 | 0.0% |
| Total | 139 | 100.0% |
Ancestry in Detroit
The most populous ancestries reported in Detroit are Irish (43 | 30.9%), European (37 | 26.6%), and German (20 | 14.4%), together accounting for 72.0% of all Detroit residents.
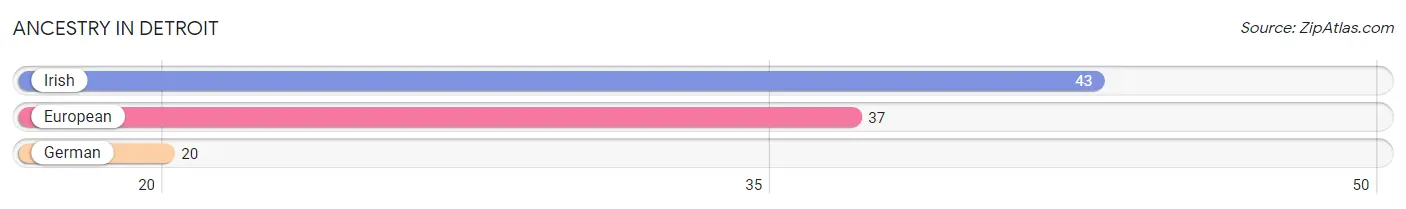
| Ancestry | # Population | % Population |
| European | 37 | 26.6% |
| German | 20 | 14.4% |
| Irish | 43 | 30.9% | View All 3 Rows |
Immigrants in Detroit

| Immigration Origin | # Population | % Population | View All 0 Rows |
Sex and Age in Detroit
Sex and Age in Detroit
The most populous age groups in Detroit are 15 to 19 Years (45 | 41.7%) for men and 60 to 64 Years (10 | 32.3%) for women.
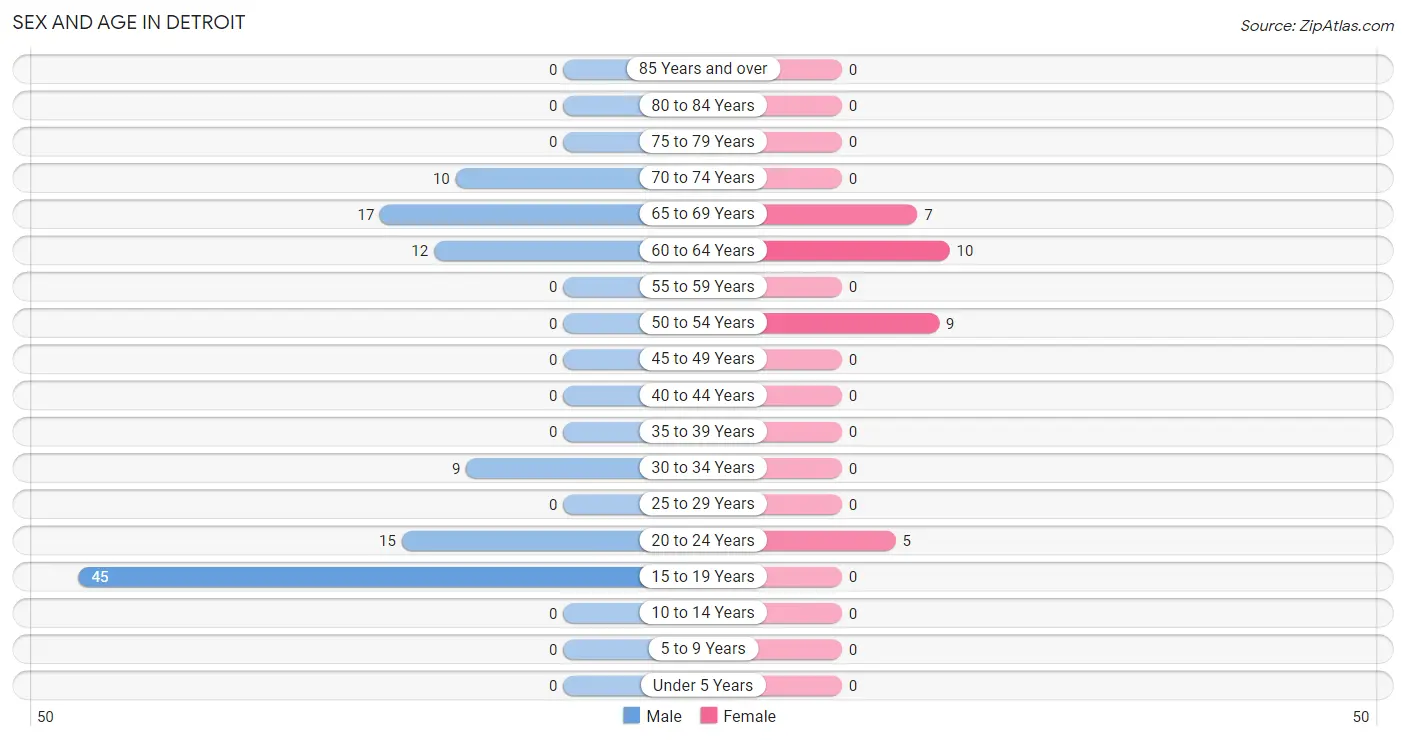
| Age Bracket | Male | Female |
| Under 5 Years | 0 (0.0%) | 0 (0.0%) |
| 5 to 9 Years | 0 (0.0%) | 0 (0.0%) |
| 10 to 14 Years | 0 (0.0%) | 0 (0.0%) |
| 15 to 19 Years | 45 (41.7%) | 0 (0.0%) |
| 20 to 24 Years | 15 (13.9%) | 5 (16.1%) |
| 25 to 29 Years | 0 (0.0%) | 0 (0.0%) |
| 30 to 34 Years | 9 (8.3%) | 0 (0.0%) |
| 35 to 39 Years | 0 (0.0%) | 0 (0.0%) |
| 40 to 44 Years | 0 (0.0%) | 0 (0.0%) |
| 45 to 49 Years | 0 (0.0%) | 0 (0.0%) |
| 50 to 54 Years | 0 (0.0%) | 9 (29.0%) |
| 55 to 59 Years | 0 (0.0%) | 0 (0.0%) |
| 60 to 64 Years | 12 (11.1%) | 10 (32.3%) |
| 65 to 69 Years | 17 (15.7%) | 7 (22.6%) |
| 70 to 74 Years | 10 (9.3%) | 0 (0.0%) |
| 75 to 79 Years | 0 (0.0%) | 0 (0.0%) |
| 80 to 84 Years | 0 (0.0%) | 0 (0.0%) |
| 85 Years and over | 0 (0.0%) | 0 (0.0%) |
| Total | 108 (100.0%) | 31 (100.0%) |
Families and Households in Detroit
Median Family Size in Detroit
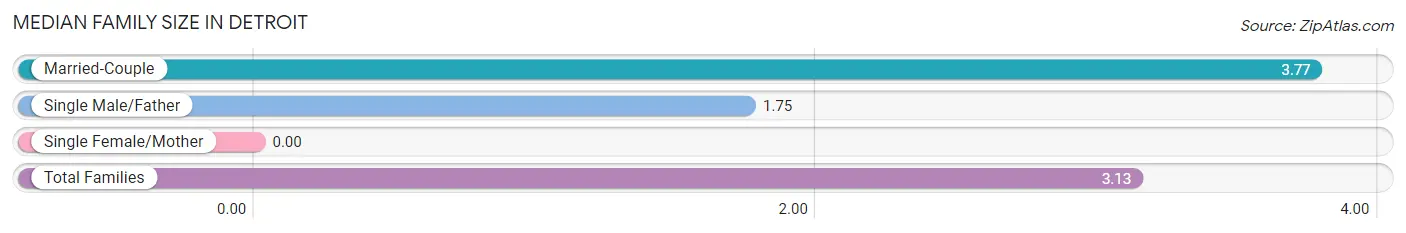
| Family Type | # Families | Family Size |
| Married-Couple | 26 (68.4%) | 3.77 |
| Single Male/Father | 12 (31.6%) | 1.75 |
| Single Female/Mother | 0 (0.0%) | - |
| Total Families | 38 (100.0%) | 3.13 |
Median Household Size in Detroit
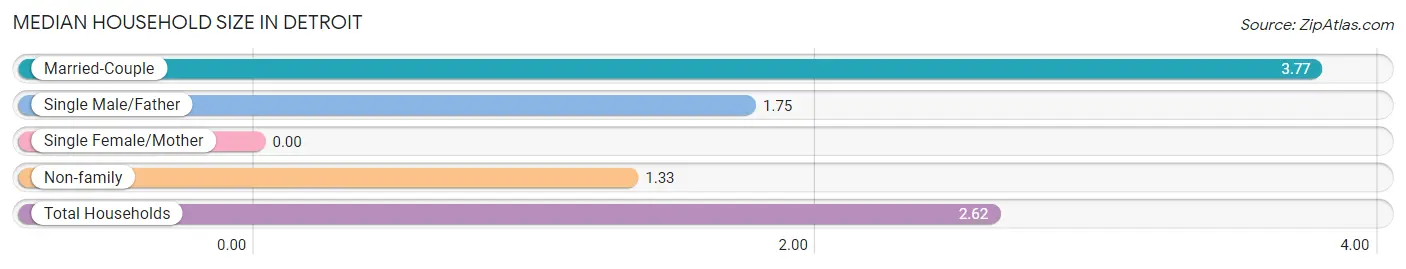
| Household Type | # Households | Household Size |
| Married-Couple | 26 (49.1%) | 3.77 |
| Single Male/Father | 12 (22.6%) | 1.75 |
| Single Female/Mother | 0 (0.0%) | - |
| Non-family | 15 (28.3%) | 1.33 |
| Total Households | 53 (100.0%) | 2.62 |
Household Size by Marriage Status in Detroit
Out of a total of 53 households in Detroit, 38 (71.7%) are family households, while 15 (28.3%) are nonfamily households. The most numerous type of family households are 2-person households, comprising 28, and the most common type of nonfamily households are 2-person households, comprising 15.
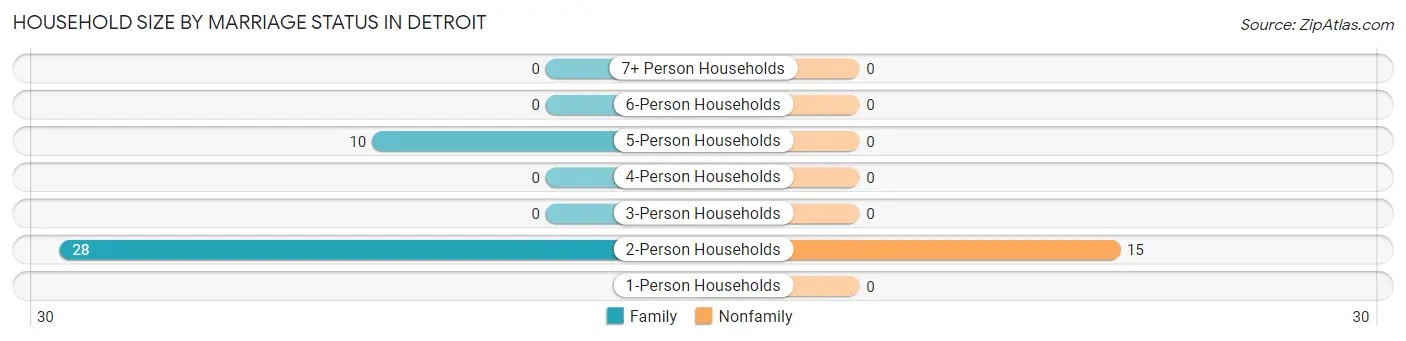
| Household Size | Family Households | Nonfamily Households |
| 1-Person Households | - | 0 (0.0%) |
| 2-Person Households | 28 (52.8%) | 15 (28.3%) |
| 3-Person Households | 0 (0.0%) | 0 (0.0%) |
| 4-Person Households | 0 (0.0%) | 0 (0.0%) |
| 5-Person Households | 10 (18.9%) | 0 (0.0%) |
| 6-Person Households | 0 (0.0%) | 0 (0.0%) |
| 7+ Person Households | 0 (0.0%) | 0 (0.0%) |
| Total | 38 (71.7%) | 15 (28.3%) |
Female Fertility in Detroit
Fertility by Age in Detroit
| Age Bracket | Women with Births | Births / 1,000 Women |
| 15 to 19 years | 0 (0.0%) | 0.0 |
| 20 to 34 years | 0 (0.0%) | 0.0 |
| 35 to 50 years | 0 (0.0%) | 0.0 |
| Total | 0 (0.0%) | 0.0 |
Fertility by Age by Marriage Status in Detroit
| Age Bracket | Married | Unmarried |
| 15 to 19 years | 0 (0.0%) | 0 (0.0%) |
| 20 to 34 years | 0 (0.0%) | 0 (0.0%) |
| 35 to 50 years | 0 (0.0%) | 0 (0.0%) |
| Total | 0 (0.0%) | 0 (0.0%) |
Fertility by Education in Detroit
| Educational Attainment | Women with Births | Births / 1,000 Women |
| Less than High School | 0 (0.0%) | 0.0 |
| High School Diploma | 0 (0.0%) | 0.0 |
| College or Associate's Degree | 0 (0.0%) | 0.0 |
| Bachelor's Degree | 0 (0.0%) | 0.0 |
| Graduate Degree | 0 (0.0%) | 0.0 |
| Total | 0 (0.0%) | 0.0 |
Fertility by Education by Marriage Status in Detroit
| Educational Attainment | Married | Unmarried |
| Less than High School | 0 (0.0%) | 0 (0.0%) |
| High School Diploma | 0 (0.0%) | 0 (0.0%) |
| College or Associate's Degree | 0 (0.0%) | 0 (0.0%) |
| Bachelor's Degree | 0 (0.0%) | 0 (0.0%) |
| Graduate Degree | 0 (0.0%) | 0 (0.0%) |
| Total | 0 (0.0%) | 0 (0.0%) |
Employment Characteristics in Detroit
Employment by Class of Employer in Detroit
Among the 65 employed individuals in Detroit, private company employees (46 | 70.8%), self-employed (not incorporated) (10 | 15.4%), and not-for-profit organizations (9 | 13.9%) make up the most common classes of employment.
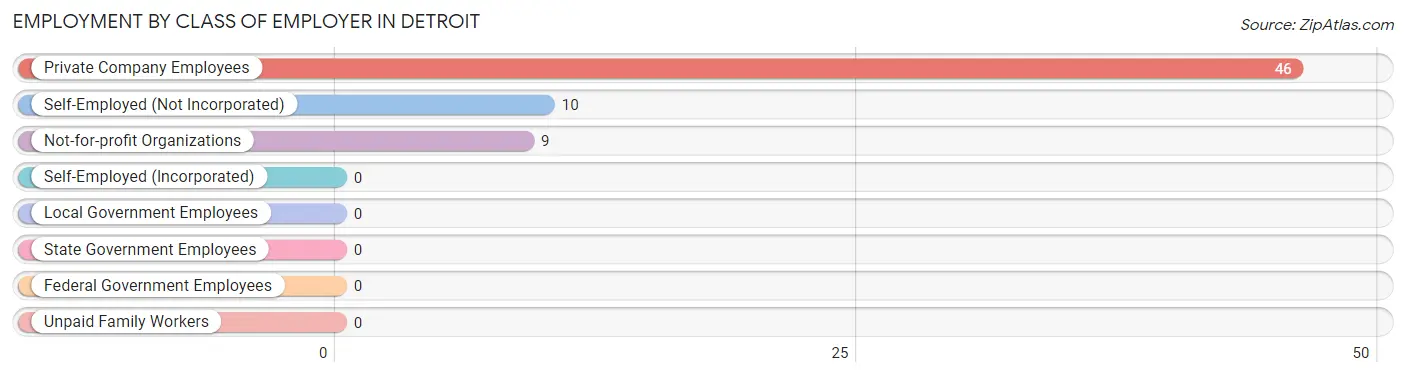
| Employer Class | # Employees | % Employees |
| Private Company Employees | 46 | 70.8% |
| Self-Employed (Incorporated) | 0 | 0.0% |
| Self-Employed (Not Incorporated) | 10 | 15.4% |
| Not-for-profit Organizations | 9 | 13.9% |
| Local Government Employees | 0 | 0.0% |
| State Government Employees | 0 | 0.0% |
| Federal Government Employees | 0 | 0.0% |
| Unpaid Family Workers | 0 | 0.0% |
| Total | 65 | 100.0% |
Employment Status by Age in Detroit
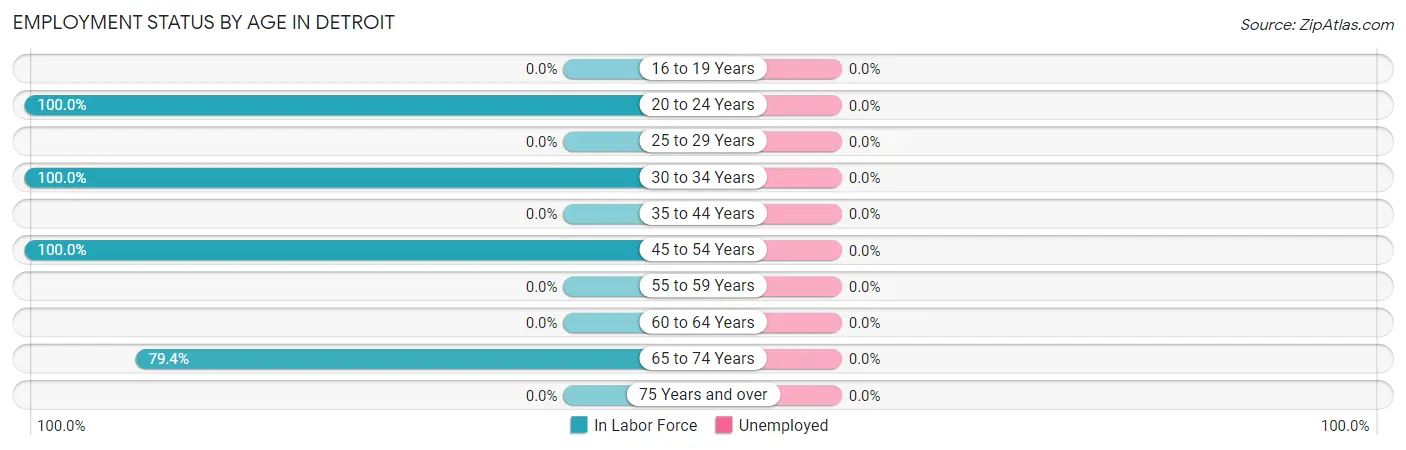
| Age Bracket | In Labor Force | Unemployed |
| 16 to 19 Years | 0 (0.0%) | 0 (0.0%) |
| 20 to 24 Years | 20 (100.0%) | 0 (0.0%) |
| 25 to 29 Years | 0 (0.0%) | 0 (0.0%) |
| 30 to 34 Years | 9 (100.0%) | 0 (0.0%) |
| 35 to 44 Years | 0 (0.0%) | 0 (0.0%) |
| 45 to 54 Years | 9 (100.0%) | 0 (0.0%) |
| 55 to 59 Years | 0 (0.0%) | 0 (0.0%) |
| 60 to 64 Years | 0 (0.0%) | 0 (0.0%) |
| 65 to 74 Years | 27 (79.4%) | 0 (0.0%) |
| 75 Years and over | 0 (0.0%) | 0 (0.0%) |
| Total | 65 (46.8%) | 0 (0.0%) |
Employment Status by Educational Attainment in Detroit
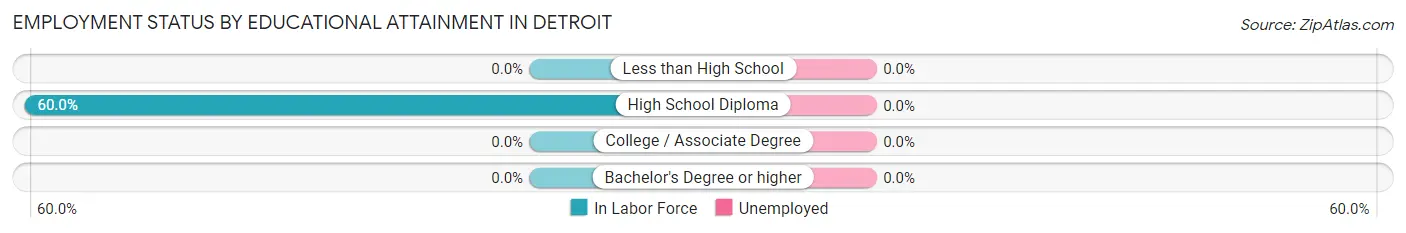
| Educational Attainment | In Labor Force | Unemployed |
| Less than High School | 0 (0.0%) | 0 (0.0%) |
| High School Diploma | 18 (60.0%) | 0 (0.0%) |
| College / Associate Degree | 0 (0.0%) | 0 (0.0%) |
| Bachelor's Degree or higher | 0 (0.0%) | 0 (0.0%) |
| Total | 18 (45.0%) | 0 (0.0%) |
Employment Occupations by Sex in Detroit
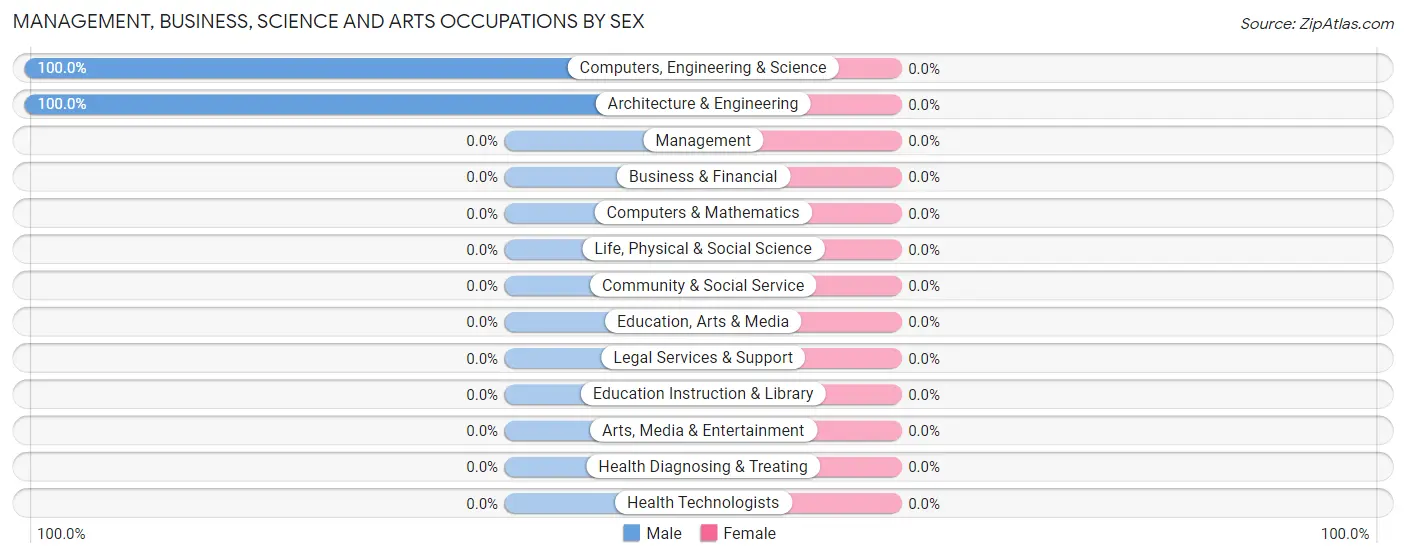
Management, Business, Science and Arts Occupations
The most common Management, Business, Science and Arts occupations in Detroit are Computers, Engineering & Science (10 | 15.4%), and Architecture & Engineering (10 | 15.4%).
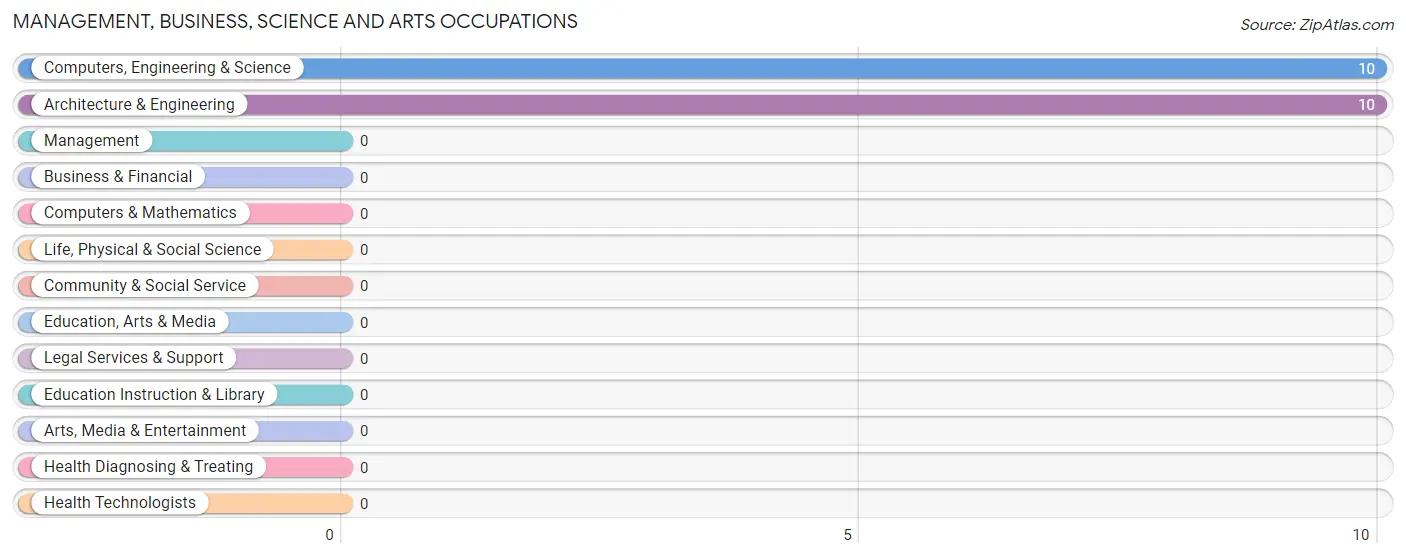
Management, Business, Science and Arts Occupations by Sex
| Occupation | Male | Female |
| Management | 0 (0.0%) | 0 (0.0%) |
| Business & Financial | 0 (0.0%) | 0 (0.0%) |
| Computers, Engineering & Science | 10 (100.0%) | 0 (0.0%) |
| Computers & Mathematics | 0 (0.0%) | 0 (0.0%) |
| Architecture & Engineering | 10 (100.0%) | 0 (0.0%) |
| Life, Physical & Social Science | 0 (0.0%) | 0 (0.0%) |
| Community & Social Service | 0 (0.0%) | 0 (0.0%) |
| Education, Arts & Media | 0 (0.0%) | 0 (0.0%) |
| Legal Services & Support | 0 (0.0%) | 0 (0.0%) |
| Education Instruction & Library | 0 (0.0%) | 0 (0.0%) |
| Arts, Media & Entertainment | 0 (0.0%) | 0 (0.0%) |
| Health Diagnosing & Treating | 0 (0.0%) | 0 (0.0%) |
| Health Technologists | 0 (0.0%) | 0 (0.0%) |
| Total (Category) | 10 (100.0%) | 0 (0.0%) |
| Total (Overall) | 44 (67.7%) | 21 (32.3%) |
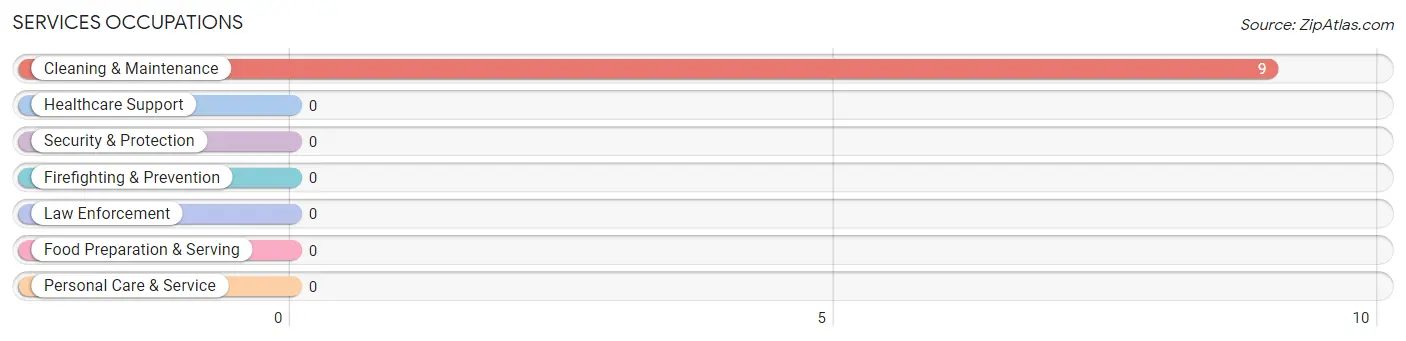
Services Occupations
The most common Services occupations in Detroit are , and Cleaning & Maintenance (9 | 13.9%).
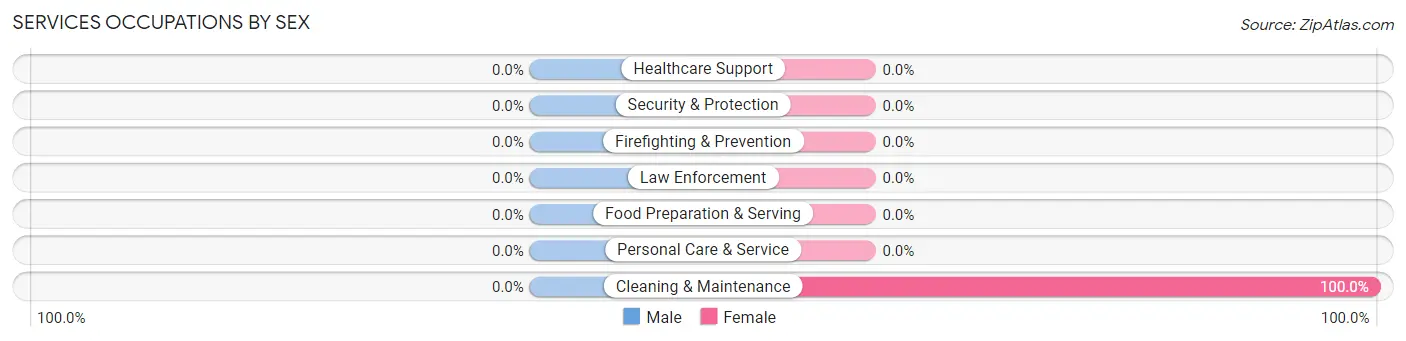
Services Occupations by Sex
| Occupation | Male | Female |
| Healthcare Support | 0 (0.0%) | 0 (0.0%) |
| Security & Protection | 0 (0.0%) | 0 (0.0%) |
| Firefighting & Prevention | 0 (0.0%) | 0 (0.0%) |
| Law Enforcement | 0 (0.0%) | 0 (0.0%) |
| Food Preparation & Serving | 0 (0.0%) | 0 (0.0%) |
| Cleaning & Maintenance | 0 (0.0%) | 9 (100.0%) |
| Personal Care & Service | 0 (0.0%) | 0 (0.0%) |
| Total (Category) | 0 (0.0%) | 9 (100.0%) |
| Total (Overall) | 44 (67.7%) | 21 (32.3%) |
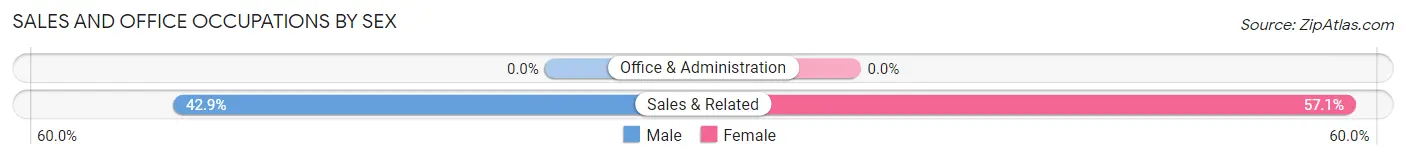
Sales and Office Occupations
The most common Sales and Office occupations in Detroit are , and Sales & Related (21 | 32.3%).

Sales and Office Occupations by Sex
| Occupation | Male | Female |
| Sales & Related | 9 (42.9%) | 12 (57.1%) |
| Office & Administration | 0 (0.0%) | 0 (0.0%) |
| Total (Category) | 9 (42.9%) | 12 (57.1%) |
| Total (Overall) | 44 (67.7%) | 21 (32.3%) |
Natural Resources, Construction and Maintenance Occupations
The most common Natural Resources, Construction and Maintenance occupations in Detroit are , and Construction & Extraction (25 | 38.5%).
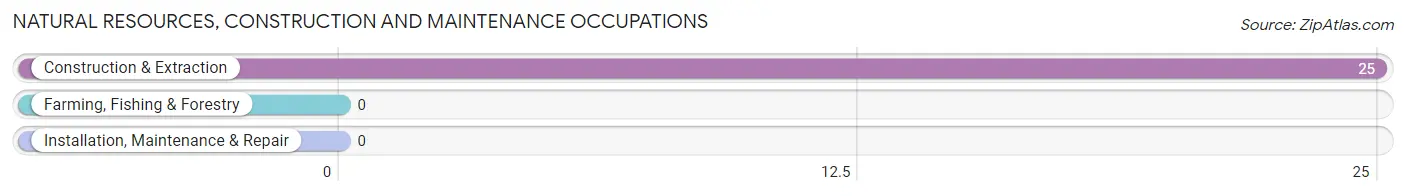
Natural Resources, Construction and Maintenance Occupations by Sex

| Occupation | Male | Female |
| Farming, Fishing & Forestry | 0 (0.0%) | 0 (0.0%) |
| Construction & Extraction | 25 (100.0%) | 0 (0.0%) |
| Installation, Maintenance & Repair | 0 (0.0%) | 0 (0.0%) |
| Total (Category) | 25 (100.0%) | 0 (0.0%) |
| Total (Overall) | 44 (67.7%) | 21 (32.3%) |
Production, Transportation and Moving Occupations
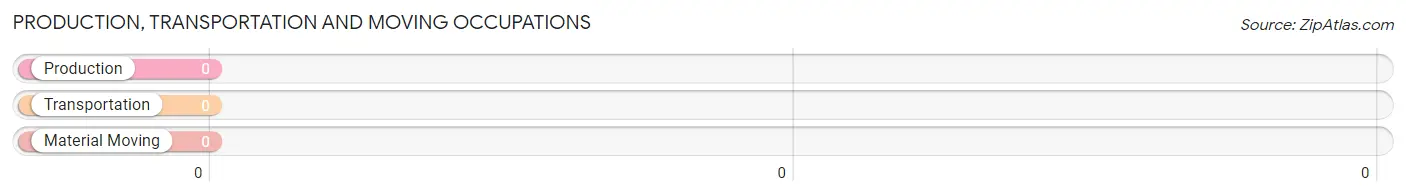
Production, Transportation and Moving Occupations by Sex
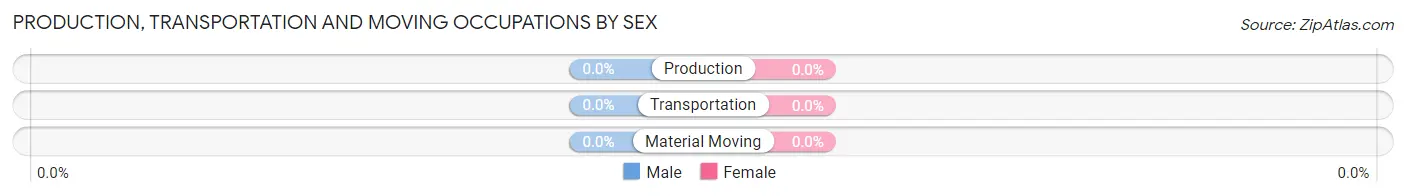
| Occupation | Male | Female |
| Production | 0 (0.0%) | 0 (0.0%) |
| Transportation | 0 (0.0%) | 0 (0.0%) |
| Material Moving | 0 (0.0%) | 0 (0.0%) |
| Total (Category) | 0 (0.0%) | 0 (0.0%) |
| Total (Overall) | 44 (67.7%) | 21 (32.3%) |
Employment Industries by Sex in Detroit
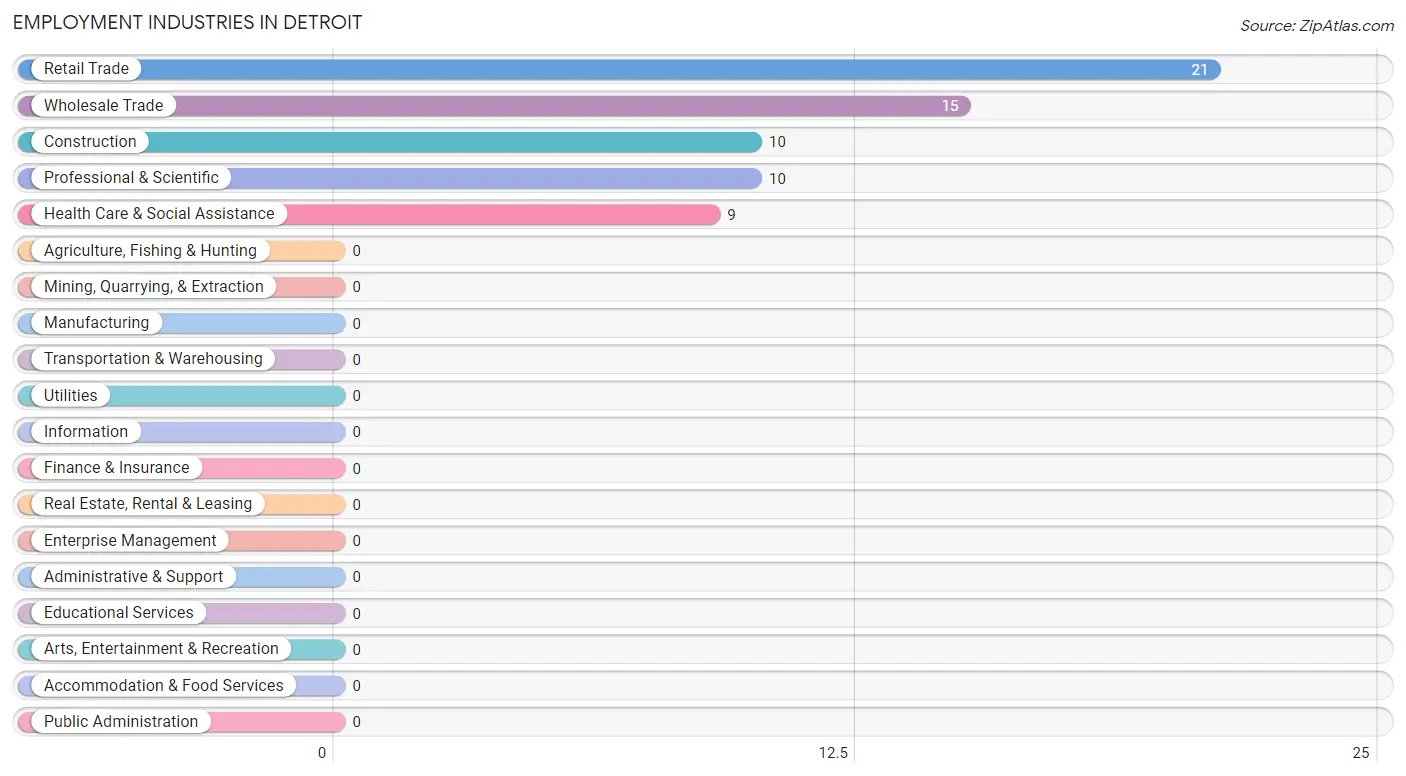
Employment Industries in Detroit
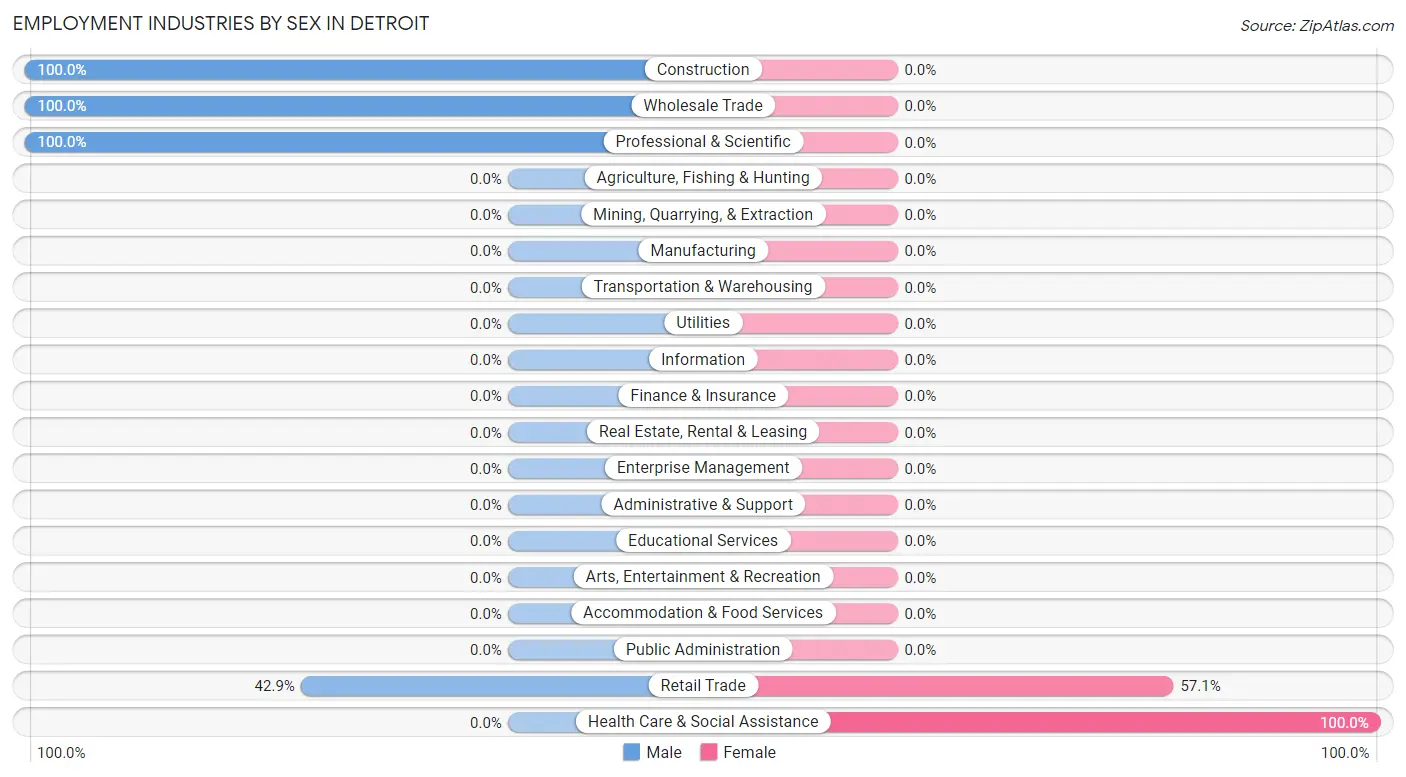
The major employment industries in Detroit include Retail Trade (21 | 32.3%), Wholesale Trade (15 | 23.1%), Construction (10 | 15.4%), Professional & Scientific (10 | 15.4%), and Health Care & Social Assistance (9 | 13.9%).
Employment Industries by Sex in Detroit
The Detroit industries that see more men than women are Construction (100.0%), Wholesale Trade (100.0%), and Professional & Scientific (100.0%), whereas the industries that tend to have a higher number of women are Health Care & Social Assistance (100.0%), and Retail Trade (57.1%).
| Industry | Male | Female |
| Agriculture, Fishing & Hunting | 0 (0.0%) | 0 (0.0%) |
| Mining, Quarrying, & Extraction | 0 (0.0%) | 0 (0.0%) |
| Construction | 10 (100.0%) | 0 (0.0%) |
| Manufacturing | 0 (0.0%) | 0 (0.0%) |
| Wholesale Trade | 15 (100.0%) | 0 (0.0%) |
| Retail Trade | 9 (42.9%) | 12 (57.1%) |
| Transportation & Warehousing | 0 (0.0%) | 0 (0.0%) |
| Utilities | 0 (0.0%) | 0 (0.0%) |
| Information | 0 (0.0%) | 0 (0.0%) |
| Finance & Insurance | 0 (0.0%) | 0 (0.0%) |
| Real Estate, Rental & Leasing | 0 (0.0%) | 0 (0.0%) |
| Professional & Scientific | 10 (100.0%) | 0 (0.0%) |
| Enterprise Management | 0 (0.0%) | 0 (0.0%) |
| Administrative & Support | 0 (0.0%) | 0 (0.0%) |
| Educational Services | 0 (0.0%) | 0 (0.0%) |
| Health Care & Social Assistance | 0 (0.0%) | 9 (100.0%) |
| Arts, Entertainment & Recreation | 0 (0.0%) | 0 (0.0%) |
| Accommodation & Food Services | 0 (0.0%) | 0 (0.0%) |
| Public Administration | 0 (0.0%) | 0 (0.0%) |
| Total | 44 (67.7%) | 21 (32.3%) |
Education in Detroit
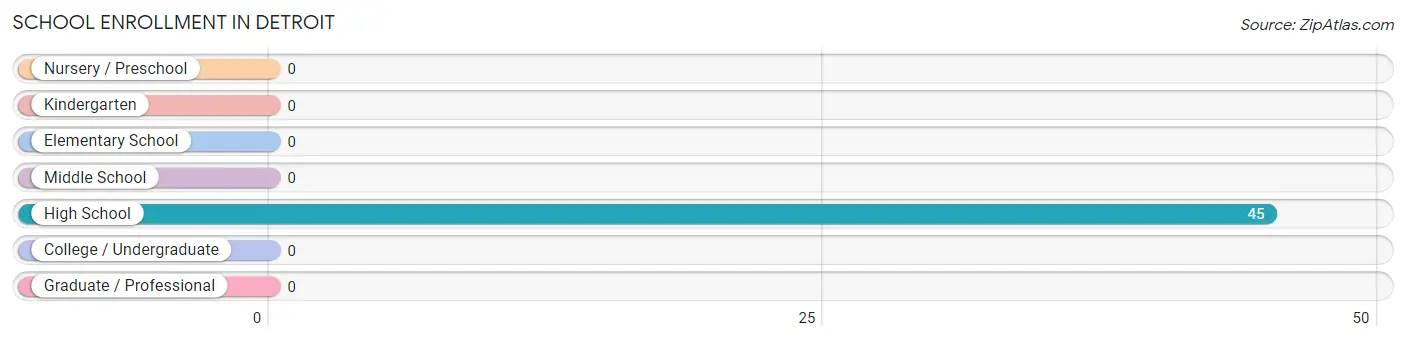
School Enrollment in Detroit
| School Level | # Students | % Students |
| Nursery / Preschool | 0 | 0.0% |
| Kindergarten | 0 | 0.0% |
| Elementary School | 0 | 0.0% |
| Middle School | 0 | 0.0% |
| High School | 45 | 100.0% |
| College / Undergraduate | 0 | 0.0% |
| Graduate / Professional | 0 | 0.0% |
| Total | 45 | 100.0% |
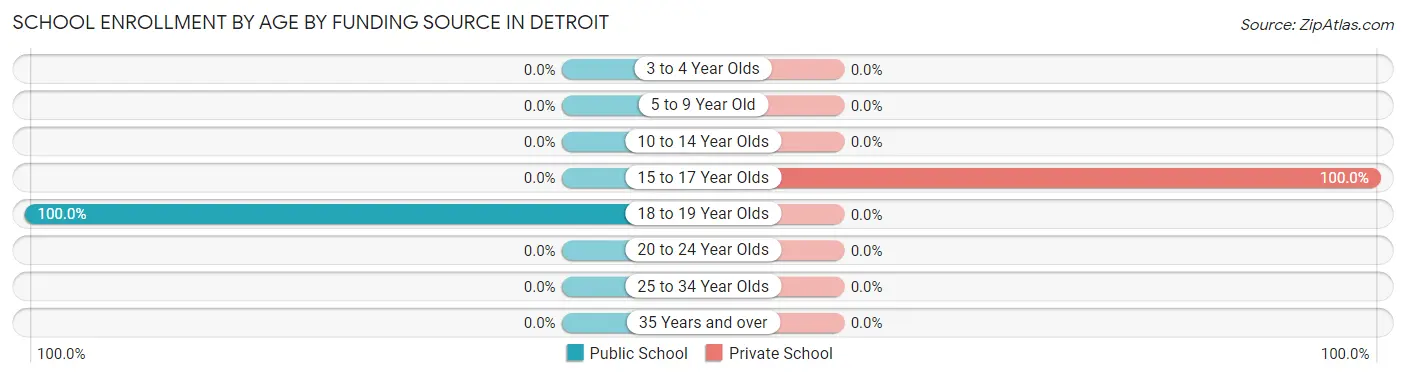
School Enrollment by Age by Funding Source in Detroit
Out of a total of 45 students who are enrolled in schools in Detroit, 11 (24.4%) attend a private institution, while the remaining 34 (75.6%) are enrolled in public schools. The age group of 15 to 17 year olds has the highest likelihood of being enrolled in private schools, with 11 (100.0% in the age bracket) enrolled. Conversely, the age group of 18 to 19 year olds has the lowest likelihood of being enrolled in a private school, with 34 (100.0% in the age bracket) attending a public institution.
| Age Bracket | Public School | Private School |
| 3 to 4 Year Olds | 0 (0.0%) | 0 (0.0%) |
| 5 to 9 Year Old | 0 (0.0%) | 0 (0.0%) |
| 10 to 14 Year Olds | 0 (0.0%) | 0 (0.0%) |
| 15 to 17 Year Olds | 0 (0.0%) | 11 (100.0%) |
| 18 to 19 Year Olds | 34 (100.0%) | 0 (0.0%) |
| 20 to 24 Year Olds | 0 (0.0%) | 0 (0.0%) |
| 25 to 34 Year Olds | 0 (0.0%) | 0 (0.0%) |
| 35 Years and over | 0 (0.0%) | 0 (0.0%) |
| Total | 34 (75.6%) | 11 (24.4%) |
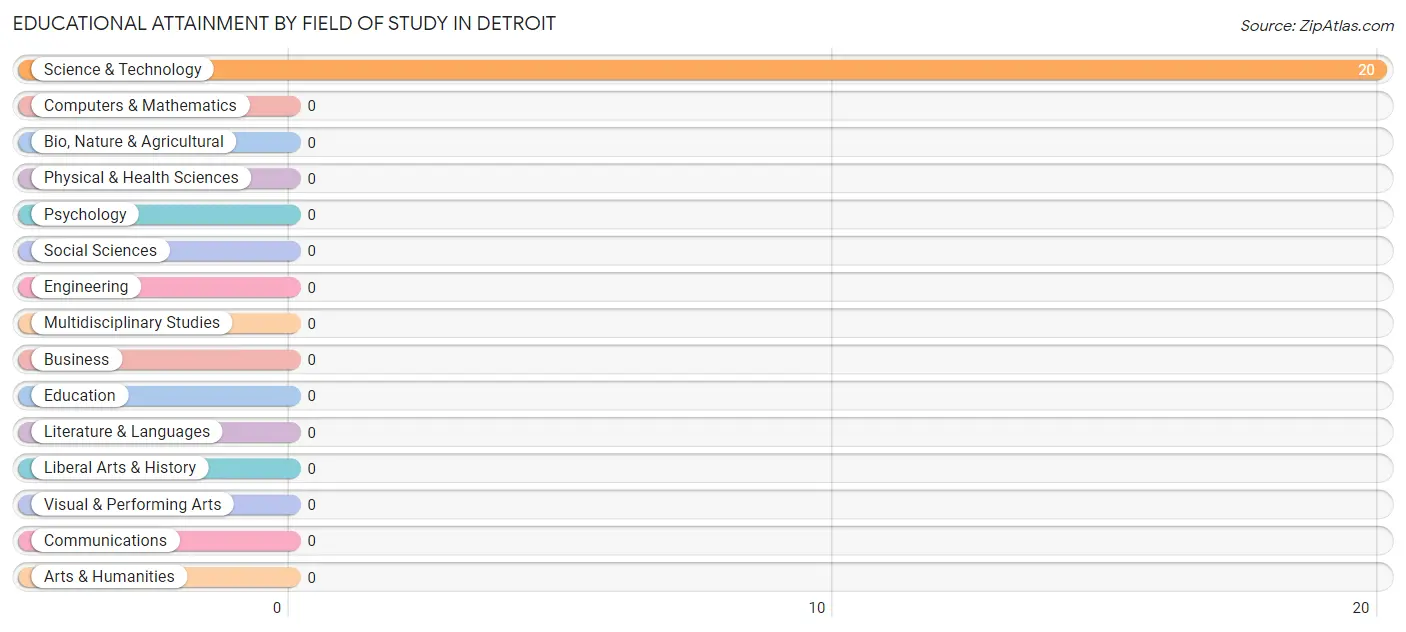
Educational Attainment by Field of Study in Detroit
, and science & technology (20 | 100.0%) are the most common fields of study among 20 individuals in Detroit who have obtained a bachelor's degree or higher.
| Field of Study | # Graduates | % Graduates |
| Computers & Mathematics | 0 | 0.0% |
| Bio, Nature & Agricultural | 0 | 0.0% |
| Physical & Health Sciences | 0 | 0.0% |
| Psychology | 0 | 0.0% |
| Social Sciences | 0 | 0.0% |
| Engineering | 0 | 0.0% |
| Multidisciplinary Studies | 0 | 0.0% |
| Science & Technology | 20 | 100.0% |
| Business | 0 | 0.0% |
| Education | 0 | 0.0% |
| Literature & Languages | 0 | 0.0% |
| Liberal Arts & History | 0 | 0.0% |
| Visual & Performing Arts | 0 | 0.0% |
| Communications | 0 | 0.0% |
| Arts & Humanities | 0 | 0.0% |
| Total | 20 | 100.0% |
Transportation & Commute in Detroit
Vehicle Availability by Sex in Detroit
The most prevalent vehicle ownership categories in Detroit are males with 5 or more vehicles (20, accounting for 45.5%) and females with 5 or more vehicles (16, making up 95.2%).
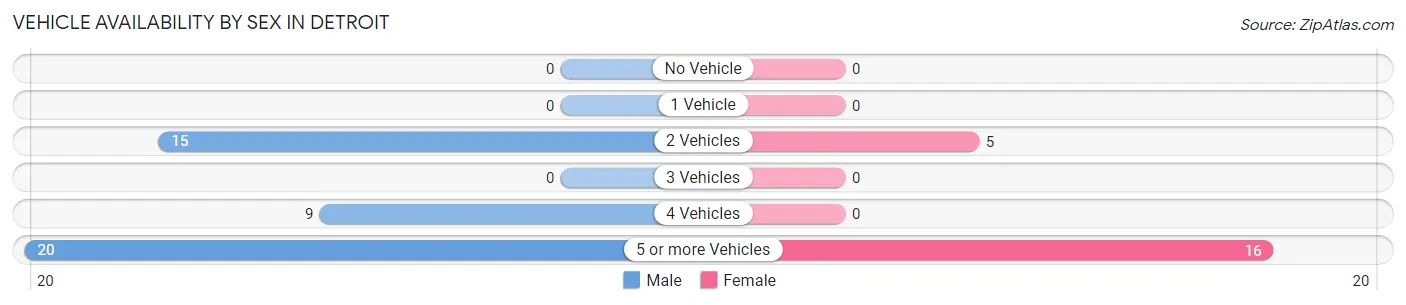
| Vehicles Available | Male | Female |
| No Vehicle | 0 (0.0%) | 0 (0.0%) |
| 1 Vehicle | 0 (0.0%) | 0 (0.0%) |
| 2 Vehicles | 15 (34.1%) | 5 (23.8%) |
| 3 Vehicles | 0 (0.0%) | 0 (0.0%) |
| 4 Vehicles | 9 (20.4%) | 0 (0.0%) |
| 5 or more Vehicles | 20 (45.5%) | 16 (76.2%) |
| Total | 44 (100.0%) | 21 (100.0%) |
Commute Time in Detroit
The most frequently occuring commute durations in Detroit are 20 to 24 minutes (25 commuters, 38.5%), 10 to 14 minutes (14 commuters, 21.5%), and 30 to 34 minutes (10 commuters, 15.4%).
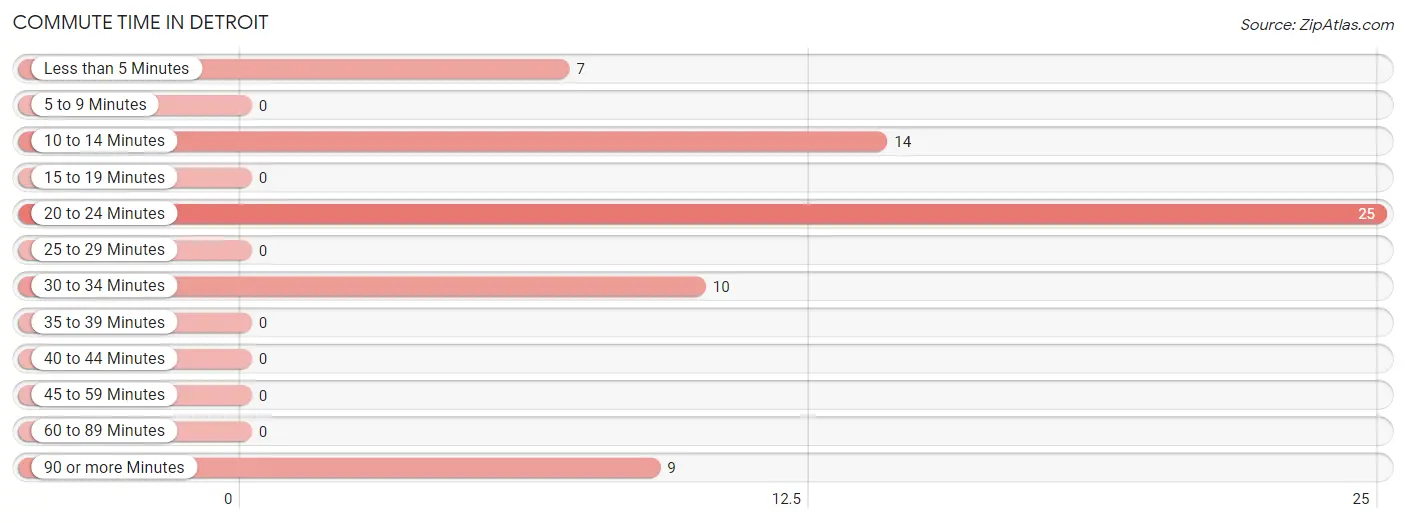
| Commute Time | # Commuters | % Commuters |
| Less than 5 Minutes | 7 | 10.8% |
| 5 to 9 Minutes | 0 | 0.0% |
| 10 to 14 Minutes | 14 | 21.5% |
| 15 to 19 Minutes | 0 | 0.0% |
| 20 to 24 Minutes | 25 | 38.5% |
| 25 to 29 Minutes | 0 | 0.0% |
| 30 to 34 Minutes | 10 | 15.4% |
| 35 to 39 Minutes | 0 | 0.0% |
| 40 to 44 Minutes | 0 | 0.0% |
| 45 to 59 Minutes | 0 | 0.0% |
| 60 to 89 Minutes | 0 | 0.0% |
| 90 or more Minutes | 9 | 13.9% |
Commute Time by Sex in Detroit
The most common commute times in Detroit are 20 to 24 minutes (25 commuters, 56.8%) for males and 10 to 14 minutes (14 commuters, 66.7%) for females.
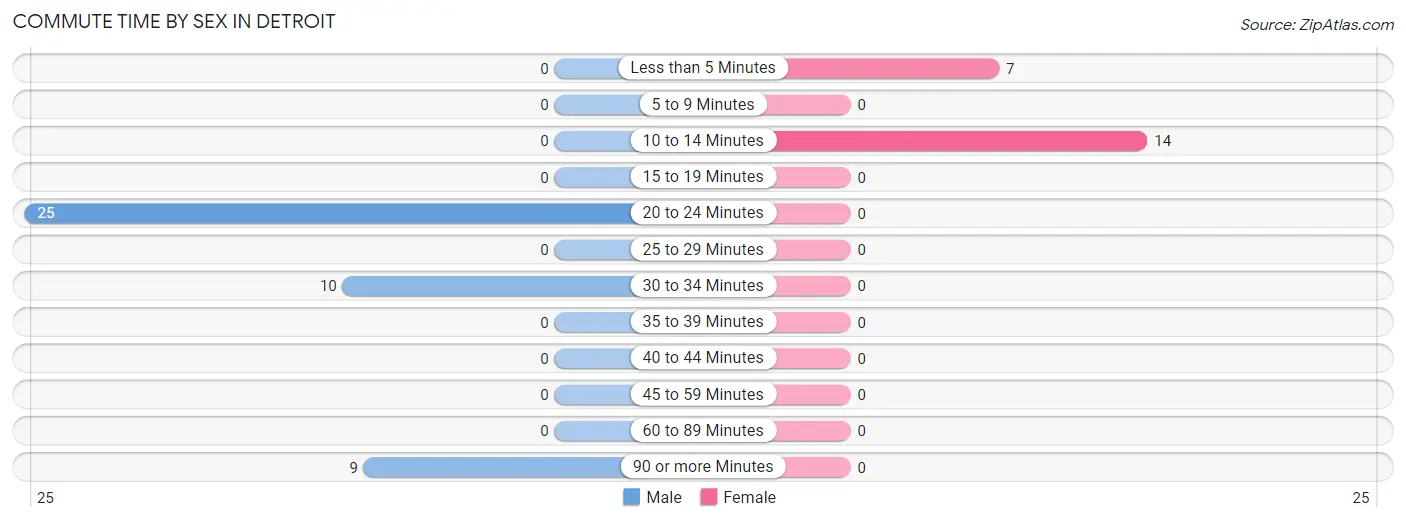
| Commute Time | Male | Female |
| Less than 5 Minutes | 0 (0.0%) | 7 (33.3%) |
| 5 to 9 Minutes | 0 (0.0%) | 0 (0.0%) |
| 10 to 14 Minutes | 0 (0.0%) | 14 (66.7%) |
| 15 to 19 Minutes | 0 (0.0%) | 0 (0.0%) |
| 20 to 24 Minutes | 25 (56.8%) | 0 (0.0%) |
| 25 to 29 Minutes | 0 (0.0%) | 0 (0.0%) |
| 30 to 34 Minutes | 10 (22.7%) | 0 (0.0%) |
| 35 to 39 Minutes | 0 (0.0%) | 0 (0.0%) |
| 40 to 44 Minutes | 0 (0.0%) | 0 (0.0%) |
| 45 to 59 Minutes | 0 (0.0%) | 0 (0.0%) |
| 60 to 89 Minutes | 0 (0.0%) | 0 (0.0%) |
| 90 or more Minutes | 9 (20.4%) | 0 (0.0%) |
Time of Departure to Work by Sex in Detroit
The most frequent times of departure to work in Detroit are 7:30 AM to 7:59 AM (35, 79.5%) for males and 5:00 AM to 5:29 AM (9, 42.9%) for females.
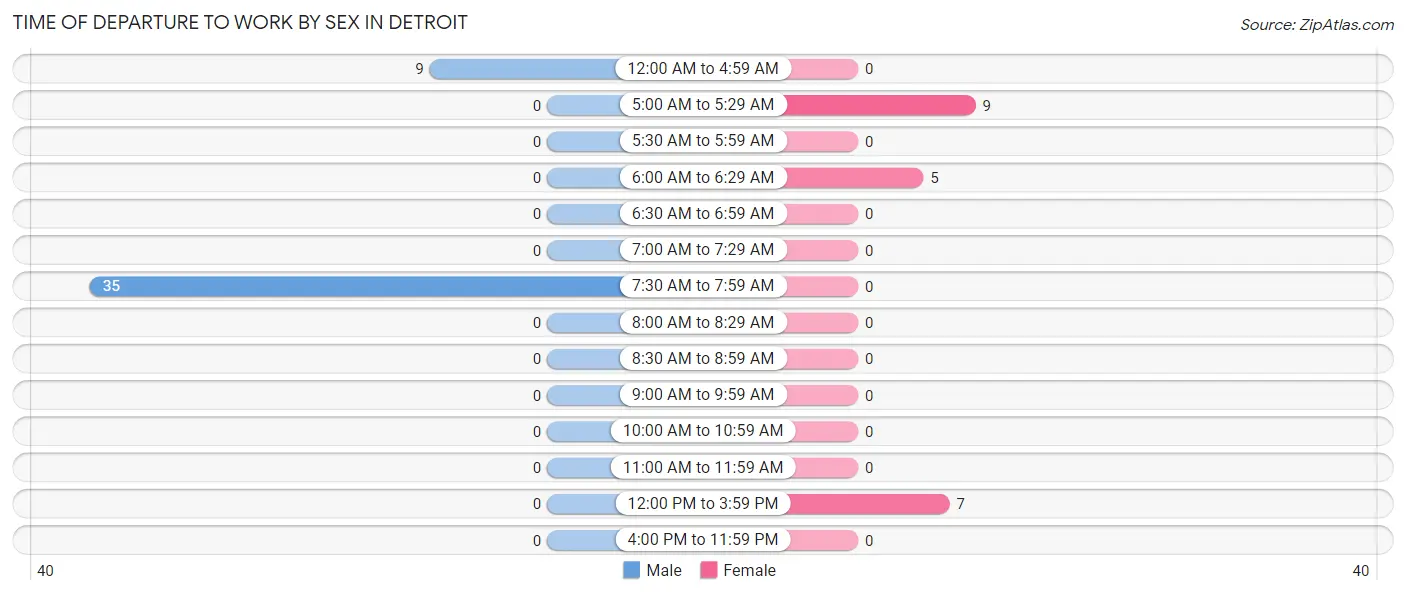
| Time of Departure | Male | Female |
| 12:00 AM to 4:59 AM | 9 (20.4%) | 0 (0.0%) |
| 5:00 AM to 5:29 AM | 0 (0.0%) | 9 (42.9%) |
| 5:30 AM to 5:59 AM | 0 (0.0%) | 0 (0.0%) |
| 6:00 AM to 6:29 AM | 0 (0.0%) | 5 (23.8%) |
| 6:30 AM to 6:59 AM | 0 (0.0%) | 0 (0.0%) |
| 7:00 AM to 7:29 AM | 0 (0.0%) | 0 (0.0%) |
| 7:30 AM to 7:59 AM | 35 (79.5%) | 0 (0.0%) |
| 8:00 AM to 8:29 AM | 0 (0.0%) | 0 (0.0%) |
| 8:30 AM to 8:59 AM | 0 (0.0%) | 0 (0.0%) |
| 9:00 AM to 9:59 AM | 0 (0.0%) | 0 (0.0%) |
| 10:00 AM to 10:59 AM | 0 (0.0%) | 0 (0.0%) |
| 11:00 AM to 11:59 AM | 0 (0.0%) | 0 (0.0%) |
| 12:00 PM to 3:59 PM | 0 (0.0%) | 7 (33.3%) |
| 4:00 PM to 11:59 PM | 0 (0.0%) | 0 (0.0%) |
| Total | 44 (100.0%) | 21 (100.0%) |
Housing Occupancy in Detroit
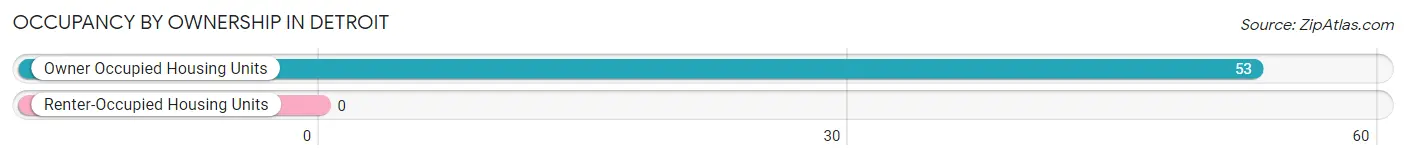
Occupancy by Ownership in Detroit
Of the total 53 dwellings in Detroit, owner-occupied units account for 53 (100.0%), while renter-occupied units make up 0 (0.0%).
| Occupancy | # Housing Units | % Housing Units |
| Owner Occupied Housing Units | 53 | 100.0% |
| Renter-Occupied Housing Units | 0 | 0.0% |
| Total Occupied Housing Units | 53 | 100.0% |
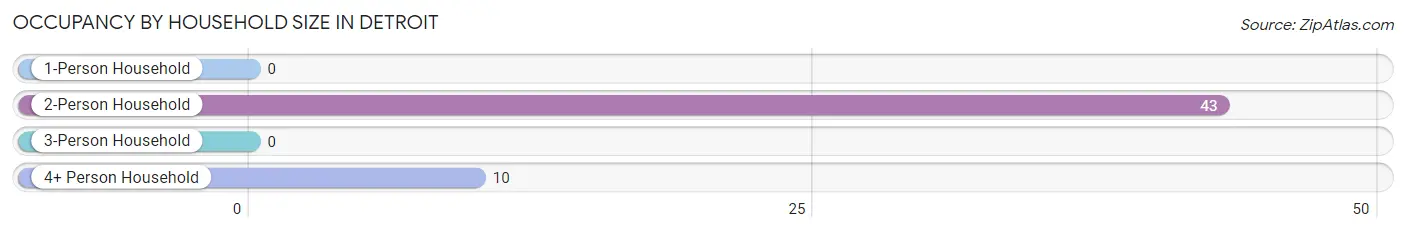
Occupancy by Household Size in Detroit
| Household Size | # Housing Units | % Housing Units |
| 1-Person Household | 0 | 0.0% |
| 2-Person Household | 43 | 81.1% |
| 3-Person Household | 0 | 0.0% |
| 4+ Person Household | 10 | 18.9% |
| Total Housing Units | 53 | 100.0% |
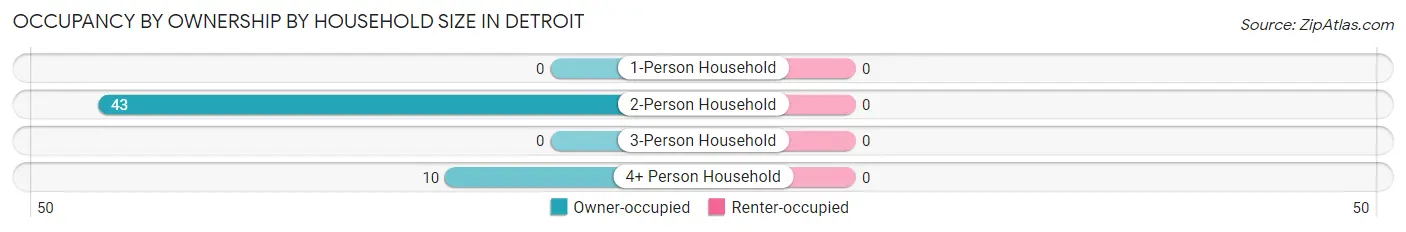
Occupancy by Ownership by Household Size in Detroit
| Household Size | Owner-occupied | Renter-occupied |
| 1-Person Household | 0 (0.0%) | 0 (0.0%) |
| 2-Person Household | 43 (100.0%) | 0 (0.0%) |
| 3-Person Household | 0 (0.0%) | 0 (0.0%) |
| 4+ Person Household | 10 (100.0%) | 0 (0.0%) |
| Total Housing Units | 53 (100.0%) | 0 (0.0%) |
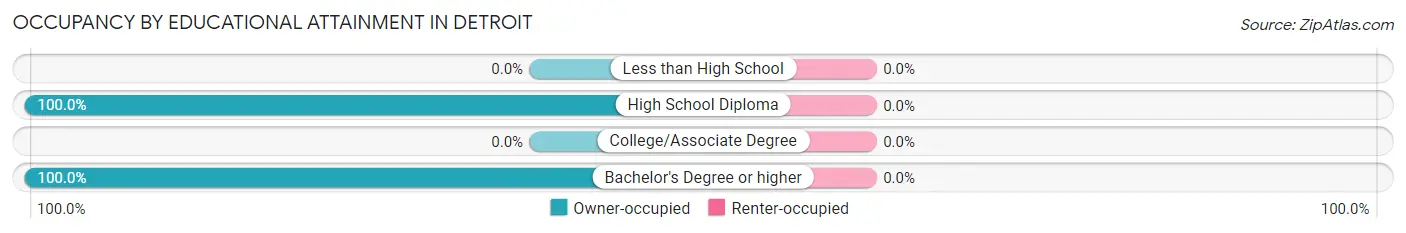
Occupancy by Educational Attainment in Detroit
| Household Size | Owner-occupied | Renter-occupied |
| Less than High School | 0 (0.0%) | 0 (0.0%) |
| High School Diploma | 43 (100.0%) | 0 (0.0%) |
| College/Associate Degree | 0 (0.0%) | 0 (0.0%) |
| Bachelor's Degree or higher | 10 (100.0%) | 0 (0.0%) |
Occupancy by Age of Householder in Detroit
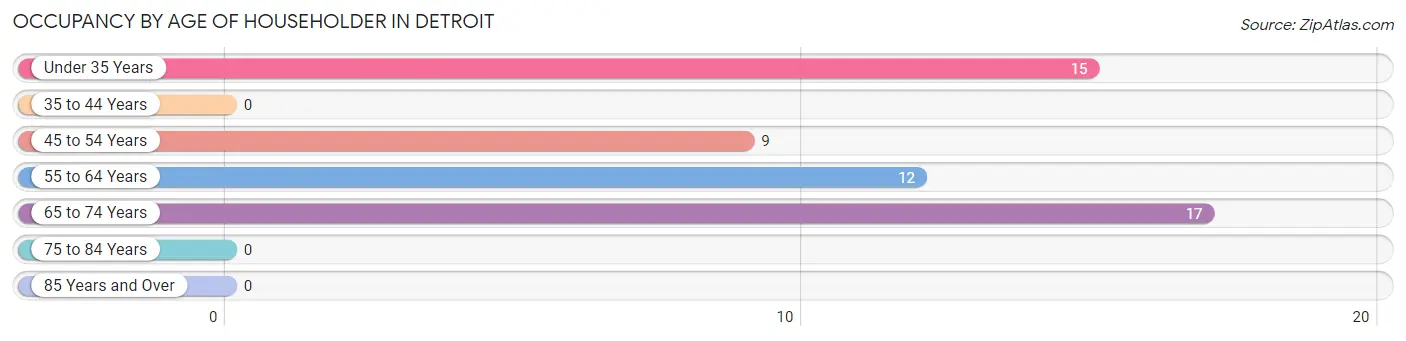
| Age Bracket | # Households | % Households |
| Under 35 Years | 15 | 28.3% |
| 35 to 44 Years | 0 | 0.0% |
| 45 to 54 Years | 9 | 17.0% |
| 55 to 64 Years | 12 | 22.6% |
| 65 to 74 Years | 17 | 32.1% |
| 75 to 84 Years | 0 | 0.0% |
| 85 Years and Over | 0 | 0.0% |
| Total | 53 | 100.0% |
Housing Finances in Detroit
Median Income by Occupancy in Detroit
| Occupancy Type | # Households | Median Income |
| Owner-Occupied | 53 (100.0%) | $0 |
| Renter-Occupied | 0 (0.0%) | $0 |
| Average | 53 (100.0%) | $0 |
Occupancy by Householder Income Bracket in Detroit
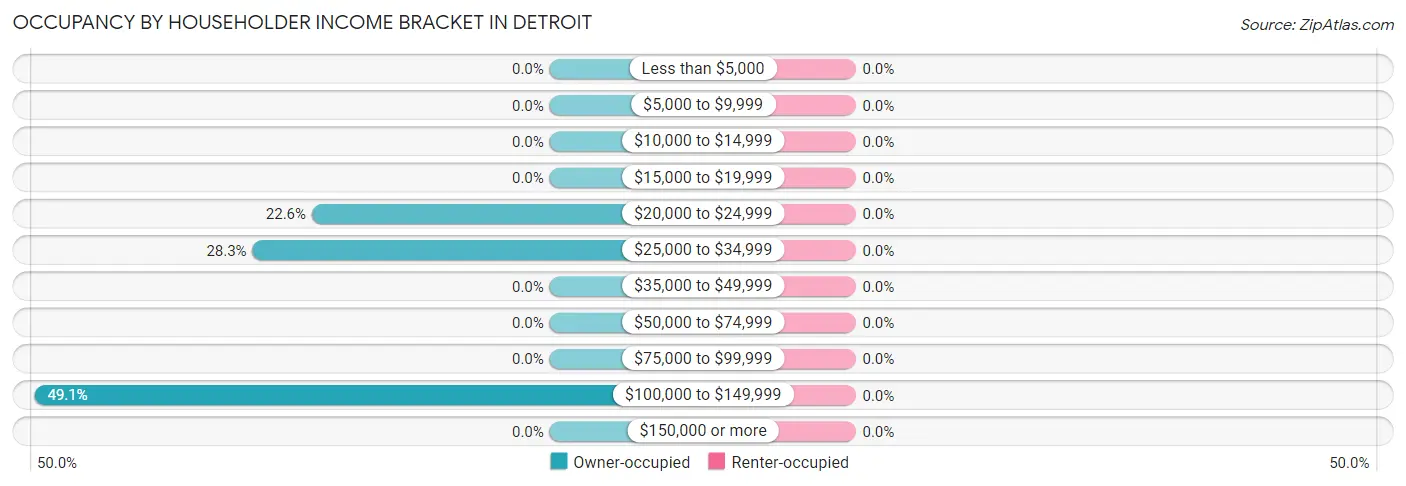
| Income Bracket | Owner-occupied | Renter-occupied |
| Less than $5,000 | 0 (0.0%) | 0 (0.0%) |
| $5,000 to $9,999 | 0 (0.0%) | 0 (0.0%) |
| $10,000 to $14,999 | 0 (0.0%) | 0 (0.0%) |
| $15,000 to $19,999 | 0 (0.0%) | 0 (0.0%) |
| $20,000 to $24,999 | 12 (22.6%) | 0 (0.0%) |
| $25,000 to $34,999 | 15 (28.3%) | 0 (0.0%) |
| $35,000 to $49,999 | 0 (0.0%) | 0 (0.0%) |
| $50,000 to $74,999 | 0 (0.0%) | 0 (0.0%) |
| $75,000 to $99,999 | 0 (0.0%) | 0 (0.0%) |
| $100,000 to $149,999 | 26 (49.1%) | 0 (0.0%) |
| $150,000 or more | 0 (0.0%) | 0 (0.0%) |
| Total | 53 (100.0%) | 0 (0.0%) |
Monthly Housing Cost Tiers in Detroit
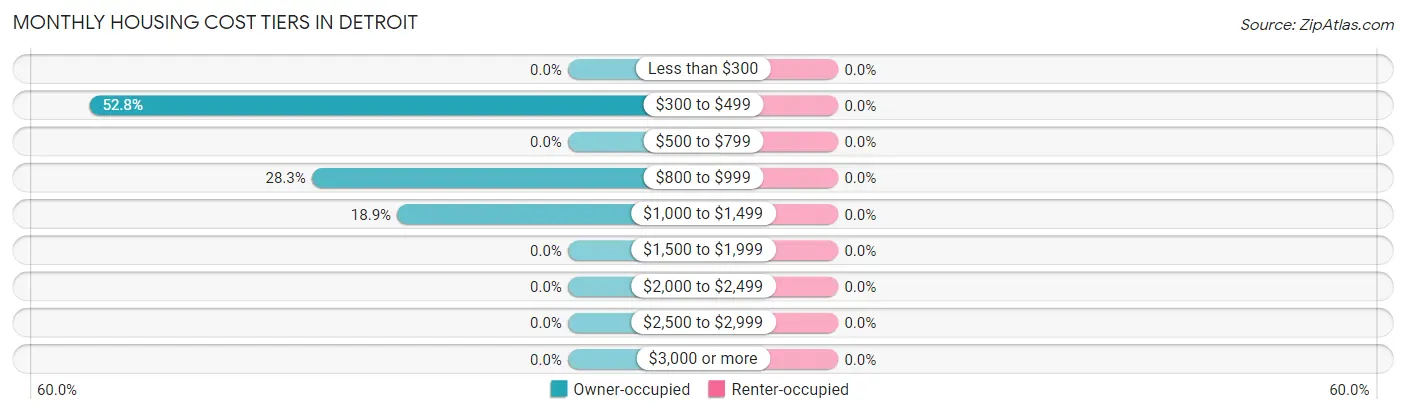
| Monthly Cost | Owner-occupied | Renter-occupied |
| Less than $300 | 0 (0.0%) | 0 (0.0%) |
| $300 to $499 | 28 (52.8%) | 0 (0.0%) |
| $500 to $799 | 0 (0.0%) | 0 (0.0%) |
| $800 to $999 | 15 (28.3%) | 0 (0.0%) |
| $1,000 to $1,499 | 10 (18.9%) | 0 (0.0%) |
| $1,500 to $1,999 | 0 (0.0%) | 0 (0.0%) |
| $2,000 to $2,499 | 0 (0.0%) | 0 (0.0%) |
| $2,500 to $2,999 | 0 (0.0%) | 0 (0.0%) |
| $3,000 or more | 0 (0.0%) | 0 (0.0%) |
| Total | 53 (100.0%) | 0 (0.0%) |
Physical Housing Characteristics in Detroit
Housing Structures in Detroit
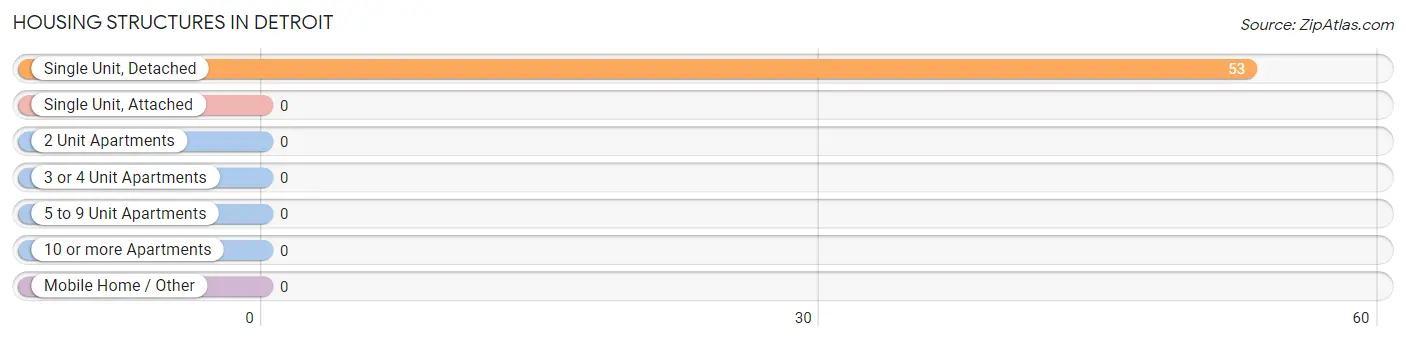
| Structure Type | # Housing Units | % Housing Units |
| Single Unit, Detached | 53 | 100.0% |
| Single Unit, Attached | 0 | 0.0% |
| 2 Unit Apartments | 0 | 0.0% |
| 3 or 4 Unit Apartments | 0 | 0.0% |
| 5 to 9 Unit Apartments | 0 | 0.0% |
| 10 or more Apartments | 0 | 0.0% |
| Mobile Home / Other | 0 | 0.0% |
| Total | 53 | 100.0% |
Housing Structures by Occupancy in Detroit
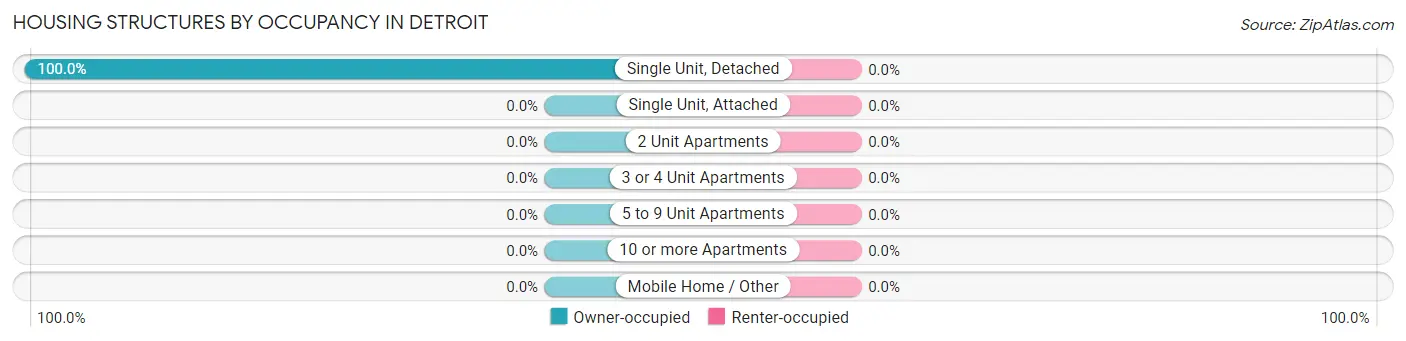
| Structure Type | Owner-occupied | Renter-occupied |
| Single Unit, Detached | 53 (100.0%) | 0 (0.0%) |
| Single Unit, Attached | 0 (0.0%) | 0 (0.0%) |
| 2 Unit Apartments | 0 (0.0%) | 0 (0.0%) |
| 3 or 4 Unit Apartments | 0 (0.0%) | 0 (0.0%) |
| 5 to 9 Unit Apartments | 0 (0.0%) | 0 (0.0%) |
| 10 or more Apartments | 0 (0.0%) | 0 (0.0%) |
| Mobile Home / Other | 0 (0.0%) | 0 (0.0%) |
| Total | 53 (100.0%) | 0 (0.0%) |
Housing Structures by Number of Rooms in Detroit
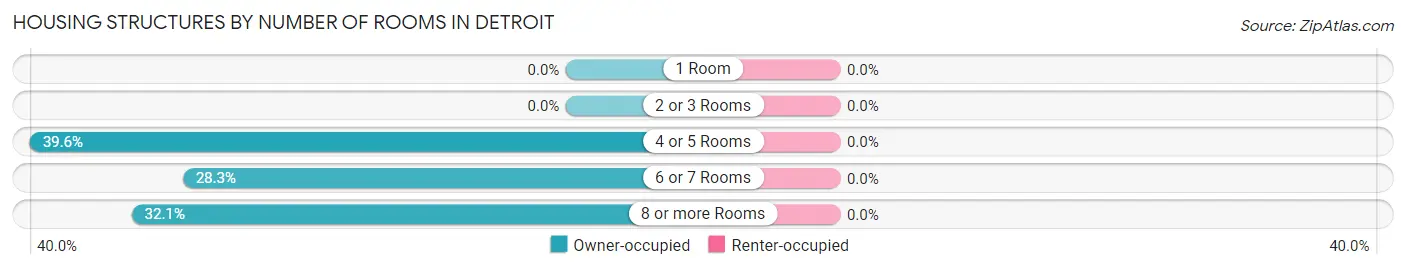
| Number of Rooms | Owner-occupied | Renter-occupied |
| 1 Room | 0 (0.0%) | 0 (0.0%) |
| 2 or 3 Rooms | 0 (0.0%) | 0 (0.0%) |
| 4 or 5 Rooms | 21 (39.6%) | 0 (0.0%) |
| 6 or 7 Rooms | 15 (28.3%) | 0 (0.0%) |
| 8 or more Rooms | 17 (32.1%) | 0 (0.0%) |
| Total | 53 (100.0%) | 0 (0.0%) |
Housing Structure by Heating Type in Detroit
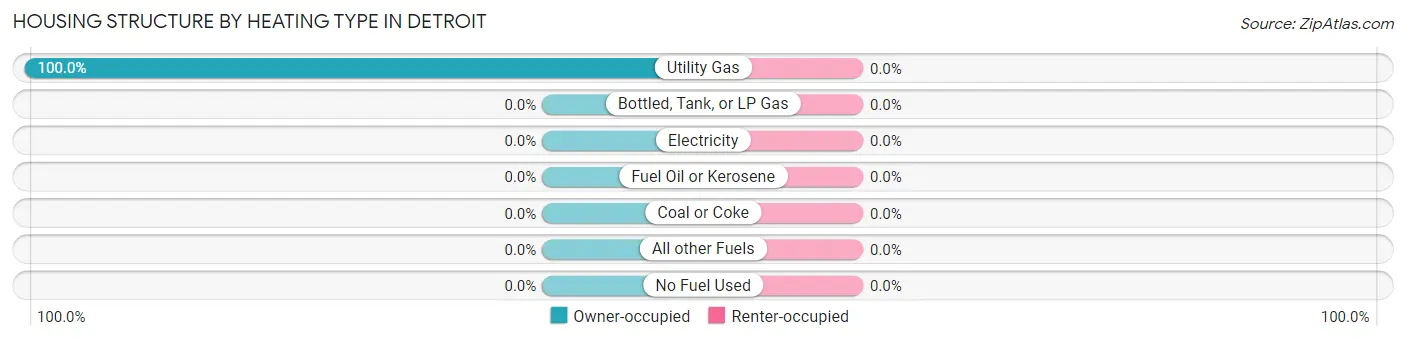
| Heating Type | Owner-occupied | Renter-occupied |
| Utility Gas | 53 (100.0%) | 0 (0.0%) |
| Bottled, Tank, or LP Gas | 0 (0.0%) | 0 (0.0%) |
| Electricity | 0 (0.0%) | 0 (0.0%) |
| Fuel Oil or Kerosene | 0 (0.0%) | 0 (0.0%) |
| Coal or Coke | 0 (0.0%) | 0 (0.0%) |
| All other Fuels | 0 (0.0%) | 0 (0.0%) |
| No Fuel Used | 0 (0.0%) | 0 (0.0%) |
| Total | 53 (100.0%) | 0 (0.0%) |
Household Vehicle Usage in Detroit
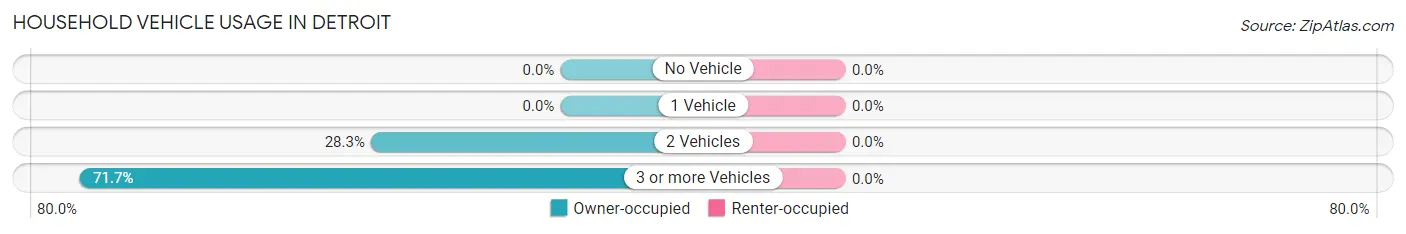
| Vehicles per Household | Owner-occupied | Renter-occupied |
| No Vehicle | 0 (0.0%) | 0 (0.0%) |
| 1 Vehicle | 0 (0.0%) | 0 (0.0%) |
| 2 Vehicles | 15 (28.3%) | 0 (0.0%) |
| 3 or more Vehicles | 38 (71.7%) | 0 (0.0%) |
| Total | 53 (100.0%) | 0 (0.0%) |
Real Estate & Mortgages in Detroit
Real Estate and Mortgage Overview in Detroit
| Characteristic | Without Mortgage | With Mortgage |
| Housing Units | 28 | 25 |
| Median Property Value | $105,600 | $0 |
| Median Household Income | - | - |
| Monthly Housing Costs | $426 | $0 |
| Real Estate Taxes | - | - |
Property Value by Mortgage Status in Detroit
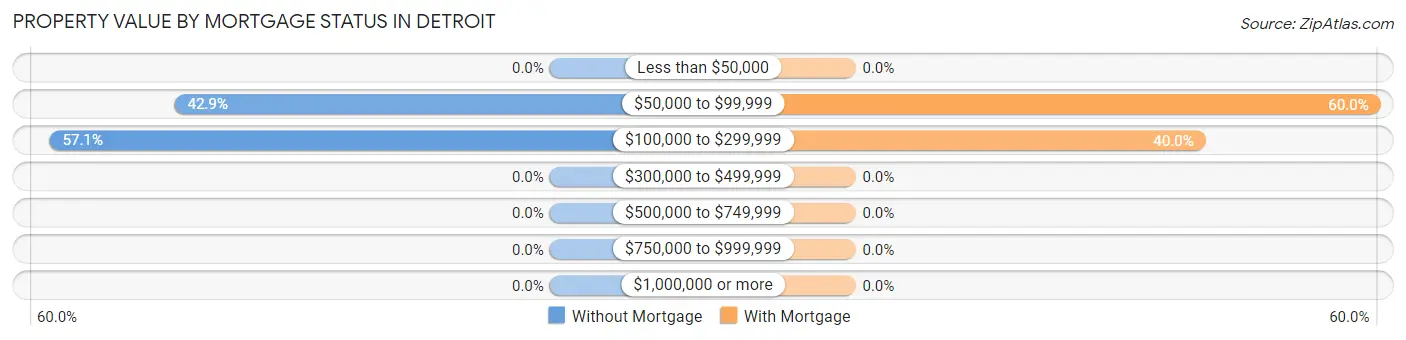
| Property Value | Without Mortgage | With Mortgage |
| Less than $50,000 | 0 (0.0%) | 0 (0.0%) |
| $50,000 to $99,999 | 12 (42.9%) | 15 (60.0%) |
| $100,000 to $299,999 | 16 (57.1%) | 10 (40.0%) |
| $300,000 to $499,999 | 0 (0.0%) | 0 (0.0%) |
| $500,000 to $749,999 | 0 (0.0%) | 0 (0.0%) |
| $750,000 to $999,999 | 0 (0.0%) | 0 (0.0%) |
| $1,000,000 or more | 0 (0.0%) | 0 (0.0%) |
| Total | 28 (100.0%) | 25 (100.0%) |
Household Income by Mortgage Status in Detroit
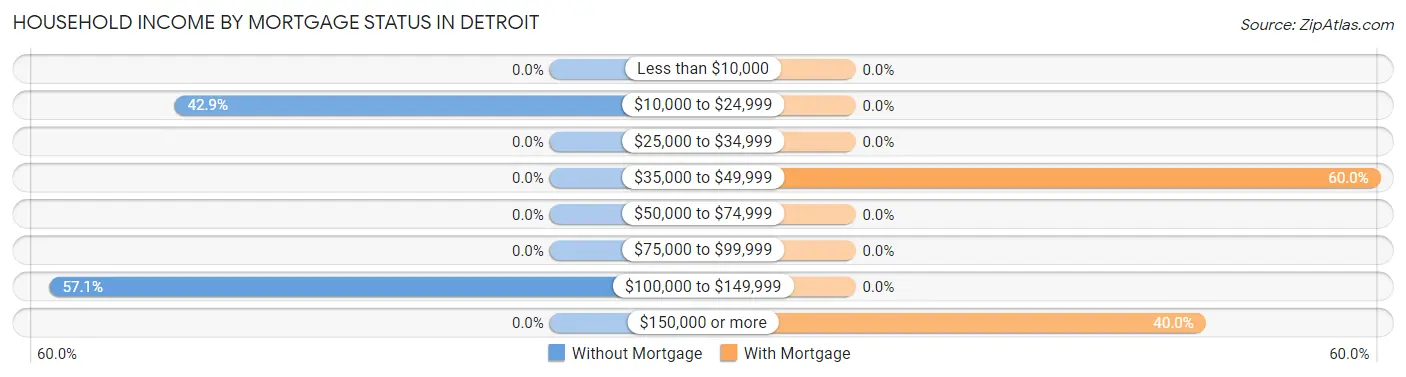
| Household Income | Without Mortgage | With Mortgage |
| Less than $10,000 | 0 (0.0%) | 0 (0.0%) |
| $10,000 to $24,999 | 12 (42.9%) | 0 (0.0%) |
| $25,000 to $34,999 | 0 (0.0%) | 0 (0.0%) |
| $35,000 to $49,999 | 0 (0.0%) | 15 (60.0%) |
| $50,000 to $74,999 | 0 (0.0%) | 0 (0.0%) |
| $75,000 to $99,999 | 0 (0.0%) | 0 (0.0%) |
| $100,000 to $149,999 | 16 (57.1%) | 0 (0.0%) |
| $150,000 or more | 0 (0.0%) | 10 (40.0%) |
| Total | 28 (100.0%) | 25 (100.0%) |
Property Value to Household Income Ratio in Detroit
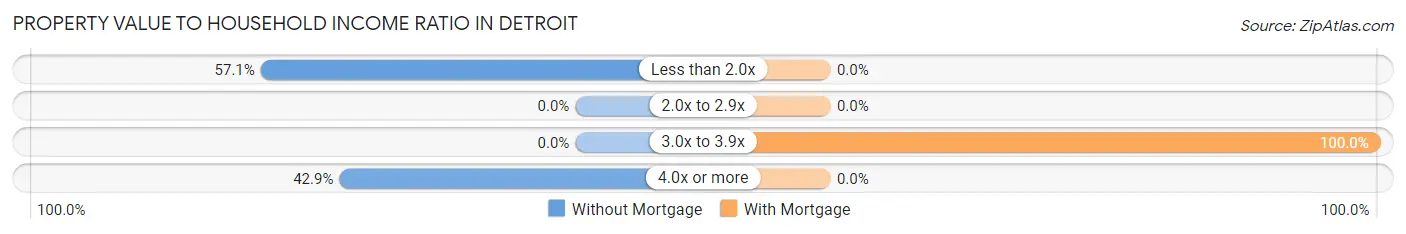
| Value-to-Income Ratio | Without Mortgage | With Mortgage |
| Less than 2.0x | 16 (57.1%) | 0 (0.0%) |
| 2.0x to 2.9x | 0 (0.0%) | 0 (0.0%) |
| 3.0x to 3.9x | 0 (0.0%) | 25 (100.0%) |
| 4.0x or more | 12 (42.9%) | 0 (0.0%) |
| Total | 28 (100.0%) | 25 (100.0%) |
Real Estate Taxes by Mortgage Status in Detroit
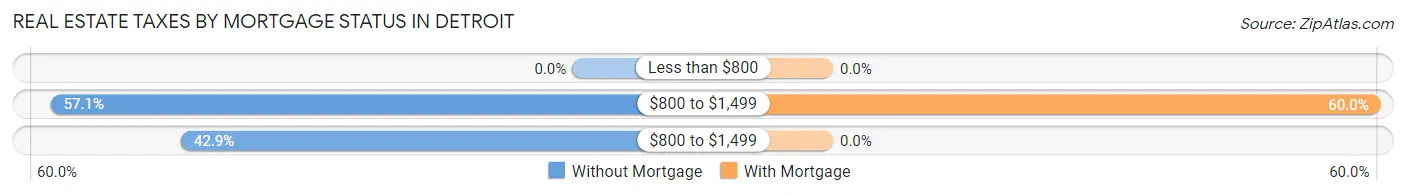
| Property Taxes | Without Mortgage | With Mortgage |
| Less than $800 | 0 (0.0%) | 0 (0.0%) |
| $800 to $1,499 | 16 (57.1%) | 15 (60.0%) |
| $800 to $1,499 | 12 (42.9%) | 0 (0.0%) |
| Total | 28 (100.0%) | 25 (100.0%) |
Health & Disability in Detroit
Health Insurance Coverage by Age in Detroit
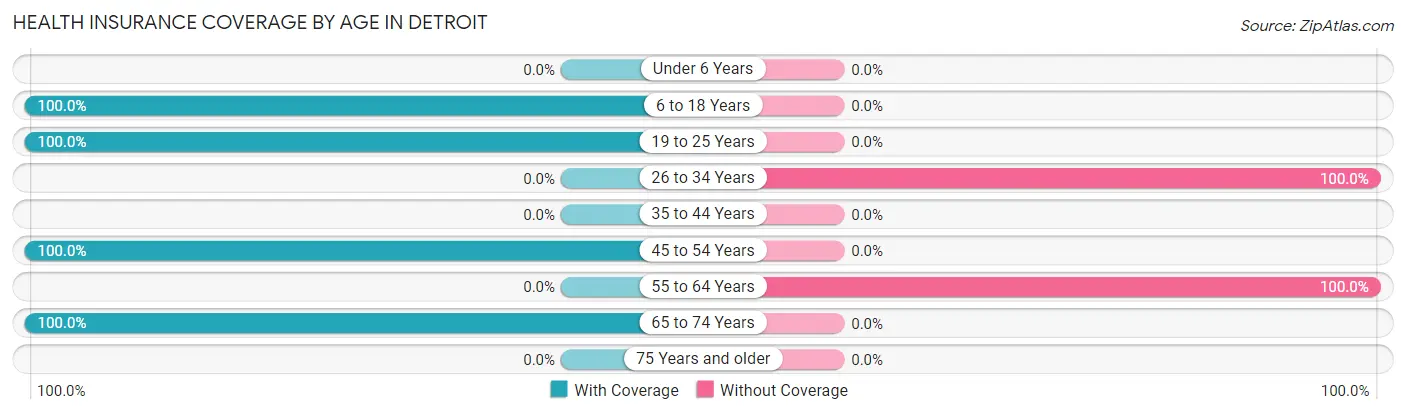
| Age Bracket | With Coverage | Without Coverage |
| Under 6 Years | 0 (0.0%) | 0 (0.0%) |
| 6 to 18 Years | 45 (100.0%) | 0 (0.0%) |
| 19 to 25 Years | 20 (100.0%) | 0 (0.0%) |
| 26 to 34 Years | 0 (0.0%) | 9 (100.0%) |
| 35 to 44 Years | 0 (0.0%) | 0 (0.0%) |
| 45 to 54 Years | 9 (100.0%) | 0 (0.0%) |
| 55 to 64 Years | 0 (0.0%) | 22 (100.0%) |
| 65 to 74 Years | 34 (100.0%) | 0 (0.0%) |
| 75 Years and older | 0 (0.0%) | 0 (0.0%) |
| Total | 108 (77.7%) | 31 (22.3%) |
Health Insurance Coverage by Citizenship Status in Detroit
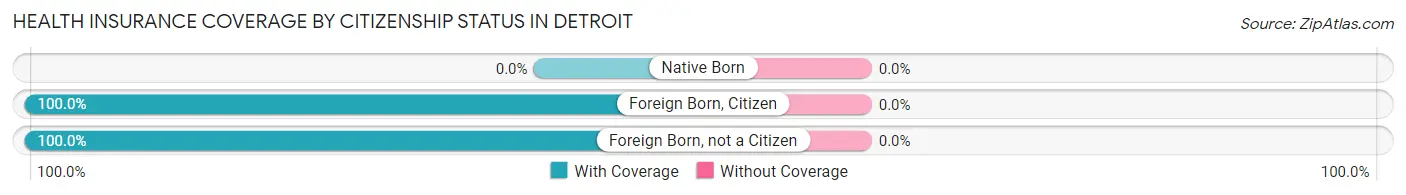
| Citizenship Status | With Coverage | Without Coverage |
| Native Born | 0 (0.0%) | 0 (0.0%) |
| Foreign Born, Citizen | 45 (100.0%) | 0 (0.0%) |
| Foreign Born, not a Citizen | 20 (100.0%) | 0 (0.0%) |
Health Insurance Coverage by Household Income in Detroit
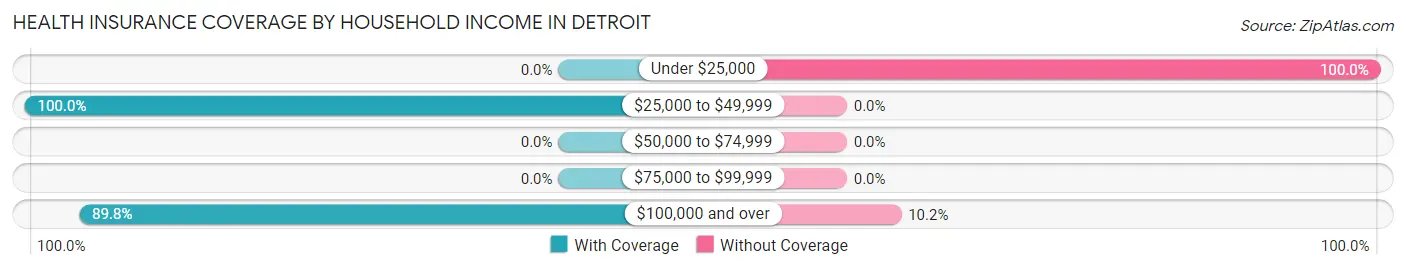
| Household Income | With Coverage | Without Coverage |
| Under $25,000 | 0 (0.0%) | 21 (100.0%) |
| $25,000 to $49,999 | 20 (100.0%) | 0 (0.0%) |
| $50,000 to $74,999 | 0 (0.0%) | 0 (0.0%) |
| $75,000 to $99,999 | 0 (0.0%) | 0 (0.0%) |
| $100,000 and over | 88 (89.8%) | 10 (10.2%) |
Public vs Private Health Insurance Coverage by Age in Detroit
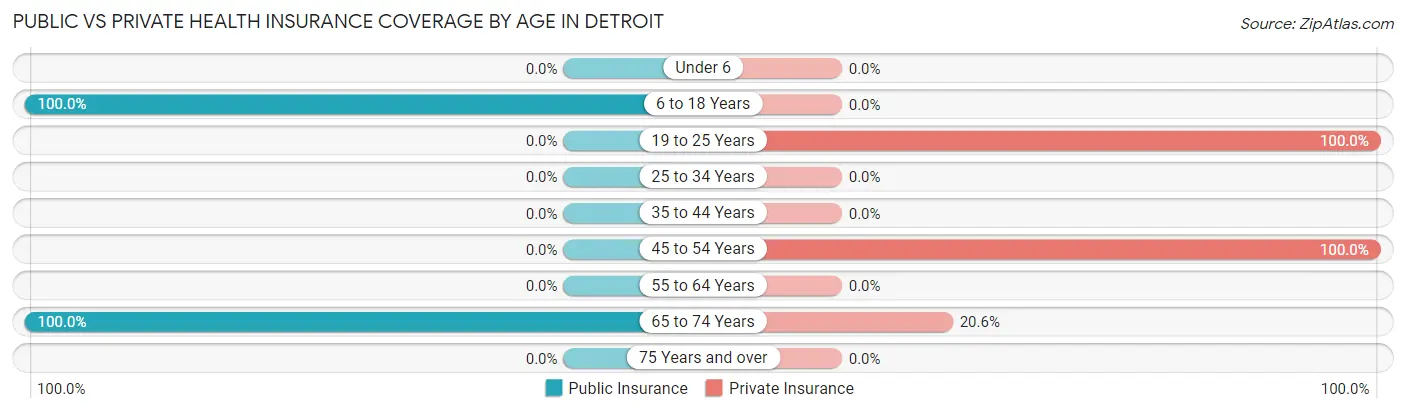
| Age Bracket | Public Insurance | Private Insurance |
| Under 6 | 0 (0.0%) | 0 (0.0%) |
| 6 to 18 Years | 45 (100.0%) | 0 (0.0%) |
| 19 to 25 Years | 0 (0.0%) | 20 (100.0%) |
| 25 to 34 Years | 0 (0.0%) | 0 (0.0%) |
| 35 to 44 Years | 0 (0.0%) | 0 (0.0%) |
| 45 to 54 Years | 0 (0.0%) | 9 (100.0%) |
| 55 to 64 Years | 0 (0.0%) | 0 (0.0%) |
| 65 to 74 Years | 34 (100.0%) | 7 (20.6%) |
| 75 Years and over | 0 (0.0%) | 0 (0.0%) |
| Total | 79 (56.8%) | 36 (25.9%) |
Disability Status by Sex by Age in Detroit
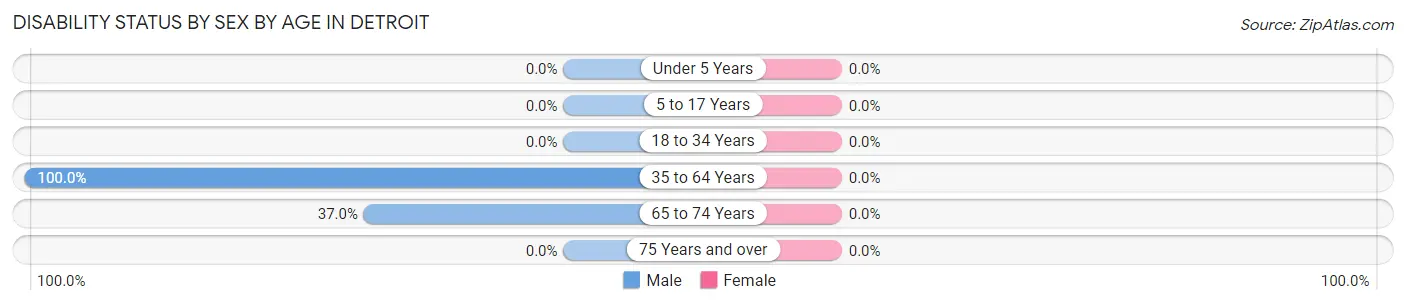
| Age Bracket | Male | Female |
| Under 5 Years | 0 (0.0%) | 0 (0.0%) |
| 5 to 17 Years | 0 (0.0%) | 0 (0.0%) |
| 18 to 34 Years | 0 (0.0%) | 0 (0.0%) |
| 35 to 64 Years | 12 (100.0%) | 0 (0.0%) |
| 65 to 74 Years | 10 (37.0%) | 0 (0.0%) |
| 75 Years and over | 0 (0.0%) | 0 (0.0%) |
Disability Class by Sex by Age in Detroit
Disability Class: Hearing Difficulty
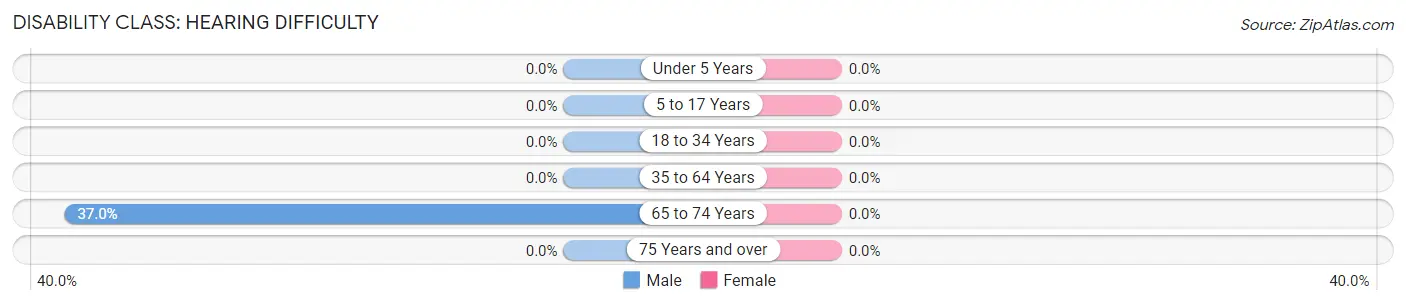
| Age Bracket | Male | Female |
| Under 5 Years | 0 (0.0%) | 0 (0.0%) |
| 5 to 17 Years | 0 (0.0%) | 0 (0.0%) |
| 18 to 34 Years | 0 (0.0%) | 0 (0.0%) |
| 35 to 64 Years | 0 (0.0%) | 0 (0.0%) |
| 65 to 74 Years | 10 (37.0%) | 0 (0.0%) |
| 75 Years and over | 0 (0.0%) | 0 (0.0%) |
Disability Class: Vision Difficulty
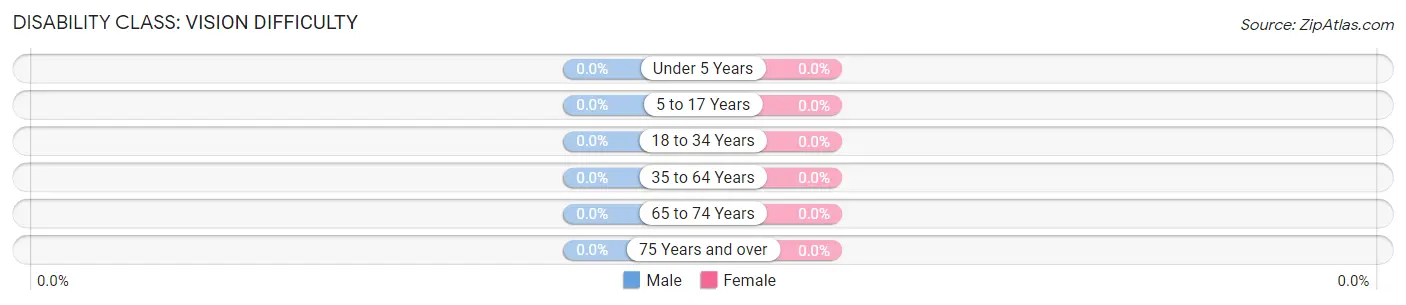
| Age Bracket | Male | Female |
| Under 5 Years | 0 (0.0%) | 0 (0.0%) |
| 5 to 17 Years | 0 (0.0%) | 0 (0.0%) |
| 18 to 34 Years | 0 (0.0%) | 0 (0.0%) |
| 35 to 64 Years | 0 (0.0%) | 0 (0.0%) |
| 65 to 74 Years | 0 (0.0%) | 0 (0.0%) |
| 75 Years and over | 0 (0.0%) | 0 (0.0%) |
Disability Class: Cognitive Difficulty

| Age Bracket | Male | Female |
| 5 to 17 Years | 0 (0.0%) | 0 (0.0%) |
| 18 to 34 Years | 0 (0.0%) | 0 (0.0%) |
| 35 to 64 Years | 12 (100.0%) | 0 (0.0%) |
| 65 to 74 Years | 0 (0.0%) | 0 (0.0%) |
| 75 Years and over | 0 (0.0%) | 0 (0.0%) |
Disability Class: Ambulatory Difficulty
| Age Bracket | Male | Female |
| 5 to 17 Years | 0 (0.0%) | 0 (0.0%) |
| 18 to 34 Years | 0 (0.0%) | 0 (0.0%) |
| 35 to 64 Years | 0 (0.0%) | 0 (0.0%) |
| 65 to 74 Years | 0 (0.0%) | 0 (0.0%) |
| 75 Years and over | 0 (0.0%) | 0 (0.0%) |
Disability Class: Self-Care Difficulty
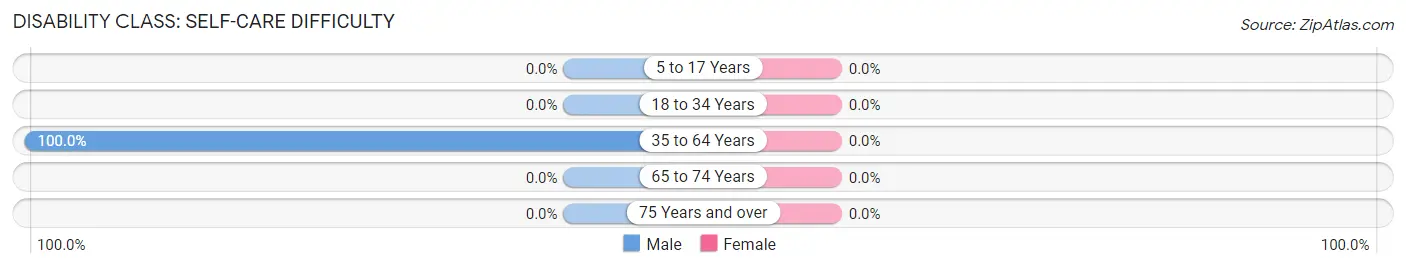
| Age Bracket | Male | Female |
| 5 to 17 Years | 0 (0.0%) | 0 (0.0%) |
| 18 to 34 Years | 0 (0.0%) | 0 (0.0%) |
| 35 to 64 Years | 12 (100.0%) | 0 (0.0%) |
| 65 to 74 Years | 0 (0.0%) | 0 (0.0%) |
| 75 Years and over | 0 (0.0%) | 0 (0.0%) |
Technology Access in Detroit
Computing Device Access in Detroit
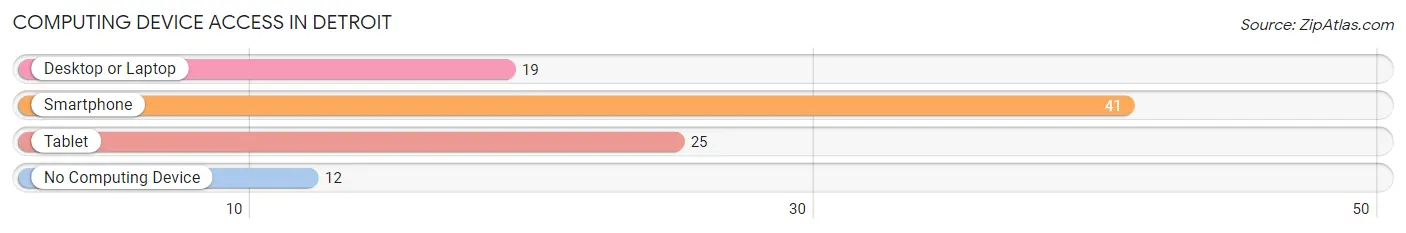
| Device Type | # Households | % Households |
| Desktop or Laptop | 19 | 35.8% |
| Smartphone | 41 | 77.4% |
| Tablet | 25 | 47.2% |
| No Computing Device | 12 | 22.6% |
| Total | 53 | 100.0% |
Internet Access in Detroit
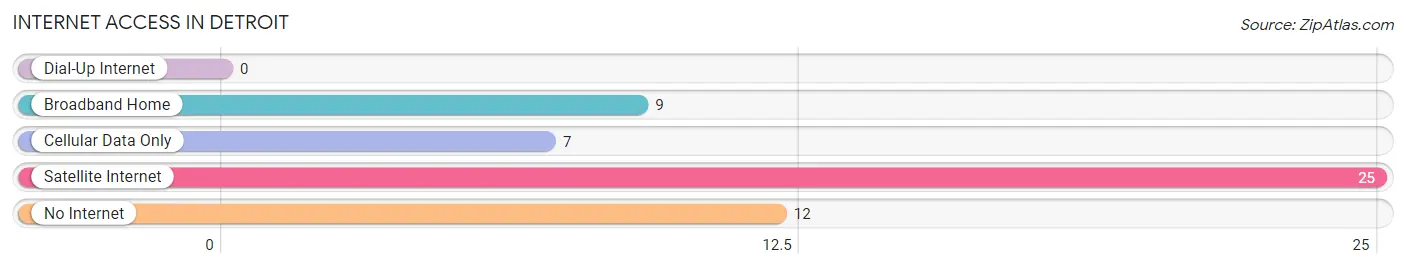
| Internet Type | # Households | % Households |
| Dial-Up Internet | 0 | 0.0% |
| Broadband Home | 9 | 17.0% |
| Cellular Data Only | 7 | 13.2% |
| Satellite Internet | 25 | 47.2% |
| No Internet | 12 | 22.6% |
| Total | 53 | 100.0% |
Detroit Summary
Detroit, Kansas is a small town located in the northeast corner of Kansas, in the county of Doniphan. It is situated on the banks of the Missouri River, and is part of the St. Joseph, Missouri metropolitan area. The town was founded in 1854, and has a population of approximately 1,000 people.
History
The town of Detroit was founded in 1854 by a group of settlers from the nearby town of St. Joseph, Missouri. The settlers were looking for a place to settle and start a new life, and they chose the area around the Missouri River. The town was named after the nearby Detroit River, which was named after the French word for “the strait”.
The town quickly grew, and by the late 1800s, it had become a thriving community. The town was home to a variety of businesses, including a flour mill, a sawmill, a blacksmith shop, and a general store. The town also had a school, a post office, and a church.
In the early 1900s, the town began to decline. The Great Depression hit the town hard, and many of the businesses closed. The population of the town decreased, and by the 1950s, the town was nearly abandoned.
In the late 1970s, the town began to experience a resurgence. The population began to increase, and new businesses began to open. Today, the town is a thriving community, with a variety of businesses, including a grocery store, a hardware store, a restaurant, and a bank.
Geography
Detroit is located in the northeast corner of Kansas, in the county of Doniphan. It is situated on the banks of the Missouri River, and is part of the St. Joseph, Missouri metropolitan area. The town is located at an elevation of 845 feet above sea level.
The town is surrounded by rolling hills and farmland. The climate is generally mild, with hot summers and cold winters. The average annual temperature is around 50 degrees Fahrenheit.
Economy
The economy of Detroit is largely based on agriculture. The town is home to a variety of farms, including dairy farms, beef farms, and vegetable farms. The town also has a variety of small businesses, including a grocery store, a hardware store, a restaurant, and a bank.
The town is also home to a variety of manufacturing businesses, including a furniture factory, a metal fabrication plant, and a plastics factory. The town is also home to a variety of service businesses, including a car repair shop, a beauty salon, and a dry cleaner.
Demographics
As of the 2010 census, the population of Detroit was 1,000 people. The racial makeup of the town was 97.2% White, 0.7% African American, 0.3% Native American, 0.2% Asian, 0.1% Pacific Islander, and 1.5% from other races. The median household income was $37,500, and the median family income was $45,000.
Conclusion
Detroit, Kansas is a small town located in the northeast corner of Kansas, in the county of Doniphan. It is situated on the banks of the Missouri River, and is part of the St. Joseph, Missouri metropolitan area. The town was founded in 1854, and has a population of approximately 1,000 people. The town’s economy is largely based on agriculture, and it is home to a variety of small businesses. The racial makeup of the town is 97.2% White, 0.7% African American, 0.3% Native American, 0.2% Asian, 0.1% Pacific Islander, and 1.5% from other races. The median household income was $37,500, and the median family income was $45,000.
Common Questions
What is Per Capita Income in Detroit?
Per Capita income in Detroit is $27,676.
What is the Median Family Income in Detroit?
Median Family Income in Detroit is $101,750.
What is Inequality or Gini Index in Detroit?
Inequality or Gini Index in Detroit is 0.34.
What is the Total Population of Detroit?
Total Population of Detroit is 139.
What is the Total Male Population of Detroit?
Total Male Population of Detroit is 108.
What is the Total Female Population of Detroit?
Total Female Population of Detroit is 31.
What is the Ratio of Males per 100 Females in Detroit?
There are 348.39 Males per 100 Females in Detroit.
What is the Ratio of Females per 100 Males in Detroit?
There are 28.70 Females per 100 Males in Detroit.
What is the Median Population Age in Detroit?
Median Population Age in Detroit is 33.5 Years.
What is the Average Family Size in Detroit
Average Family Size in Detroit is 3.1 People.
What is the Average Household Size in Detroit
Average Household Size in Detroit is 2.6 People.
How Large is the Labor Force in Detroit?
There are 65 People in the Labor Forcein in Detroit.
What is the Percentage of People in the Labor Force in Detroit?
46.8% of People are in the Labor Force in Detroit.