Porcupine, ND Map & Demographics
Porcupine Map
Porcupine Overview
$11,586
PER CAPITA INCOME
$73,333
AVG FAMILY INCOME
$54,583
AVG HOUSEHOLD INCOME
9.5%
WAGE / INCOME GAP [ % ]
90.5¢/ $1
WAGE / INCOME GAP [ $ ]
0.29
INEQUALITY / GINI INDEX
116
TOTAL POPULATION
56
MALE POPULATION
60
FEMALE POPULATION
93.33
MALES / 100 FEMALES
107.14
FEMALES / 100 MALES
17.0
MEDIAN AGE
5.0
AVG FAMILY SIZE
4.6
AVG HOUSEHOLD SIZE
37
LABOR FORCE [ PEOPLE ]
52.1%
PERCENT IN LABOR FORCE
27.0%
UNEMPLOYMENT RATE
Income in Porcupine
Income Overview in Porcupine
Per Capita Income in Porcupine is $11,586, while median incomes of families and households are $73,333 and $54,583 respectively.
| Characteristic | Number | Measure |
| Per Capita Income | 116 | $11,586 |
| Median Family Income | 20 | $73,333 |
| Mean Family Income | 20 | $68,300 |
| Median Household Income | 25 | $54,583 |
| Mean Household Income | 25 | $57,916 |
| Income Deficit | 20 | $0 |
| Wage / Income Gap (%) | 116 | 9.55% |
| Wage / Income Gap ($) | 116 | 90.45¢ per $1 |
| Gini / Inequality Index | 116 | 0.29 |
Earnings by Sex in Porcupine
Average Earnings in Porcupine are $45,227, $45,227 for men and $50,000 for women, a difference of 9.6%.
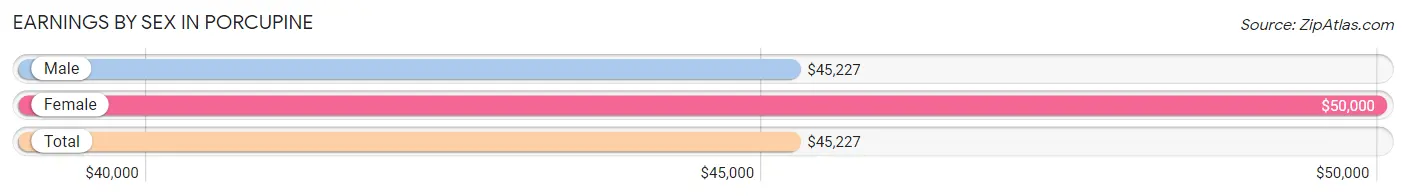
| Sex | Number | Average Earnings |
| Male | 20 (62.5%) | $45,227 |
| Female | 12 (37.5%) | $50,000 |
| Total | 32 (100.0%) | $45,227 |
Earnings by Sex by Income Bracket in Porcupine
The most common earnings brackets in Porcupine are $45,000 to $49,999 for men (11 | 55.0%) and $55,000 to $64,999 for women (6 | 50.0%).
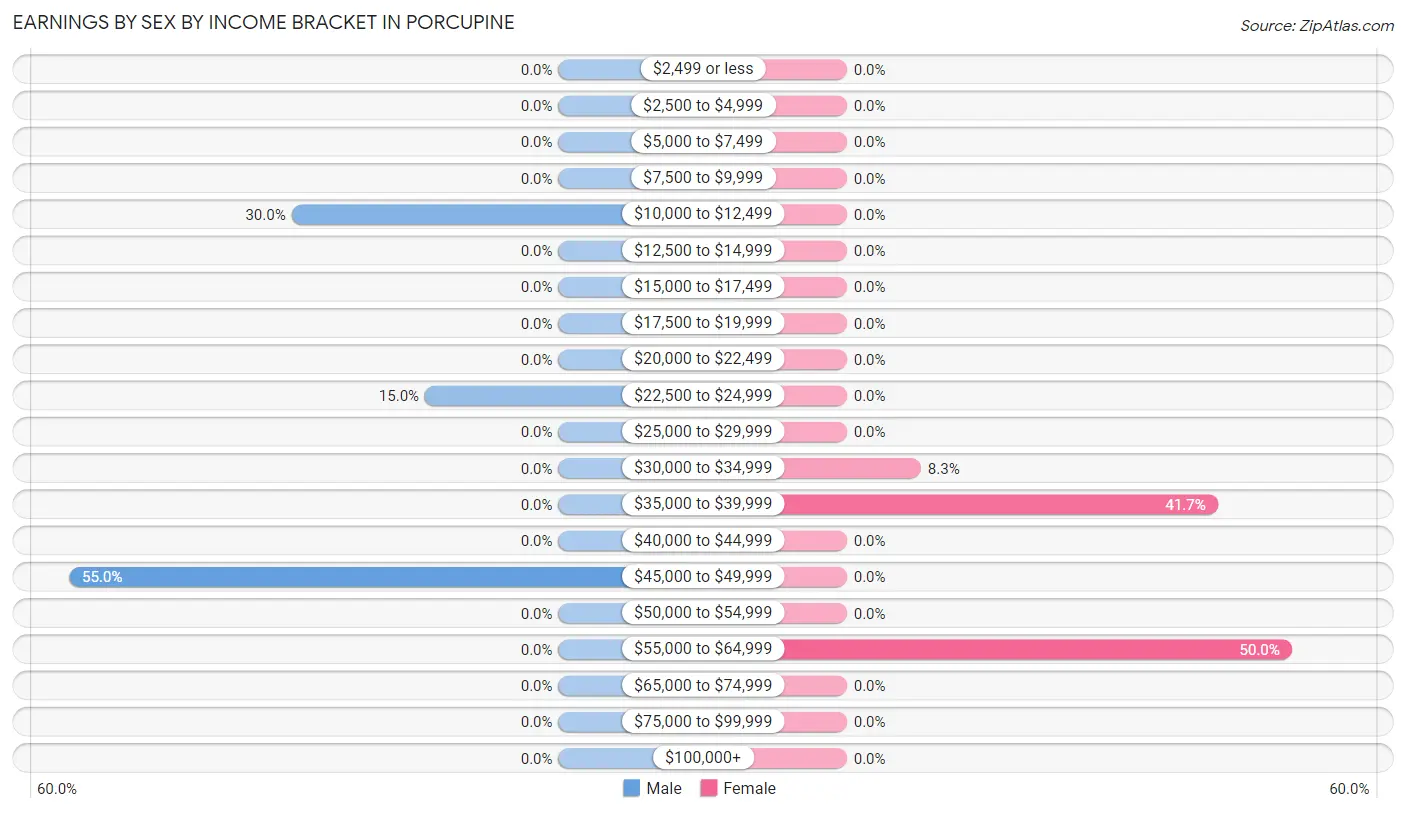
| Income | Male | Female |
| $2,499 or less | 0 (0.0%) | 0 (0.0%) |
| $2,500 to $4,999 | 0 (0.0%) | 0 (0.0%) |
| $5,000 to $7,499 | 0 (0.0%) | 0 (0.0%) |
| $7,500 to $9,999 | 0 (0.0%) | 0 (0.0%) |
| $10,000 to $12,499 | 6 (30.0%) | 0 (0.0%) |
| $12,500 to $14,999 | 0 (0.0%) | 0 (0.0%) |
| $15,000 to $17,499 | 0 (0.0%) | 0 (0.0%) |
| $17,500 to $19,999 | 0 (0.0%) | 0 (0.0%) |
| $20,000 to $22,499 | 0 (0.0%) | 0 (0.0%) |
| $22,500 to $24,999 | 3 (15.0%) | 0 (0.0%) |
| $25,000 to $29,999 | 0 (0.0%) | 0 (0.0%) |
| $30,000 to $34,999 | 0 (0.0%) | 1 (8.3%) |
| $35,000 to $39,999 | 0 (0.0%) | 5 (41.7%) |
| $40,000 to $44,999 | 0 (0.0%) | 0 (0.0%) |
| $45,000 to $49,999 | 11 (55.0%) | 0 (0.0%) |
| $50,000 to $54,999 | 0 (0.0%) | 0 (0.0%) |
| $55,000 to $64,999 | 0 (0.0%) | 6 (50.0%) |
| $65,000 to $74,999 | 0 (0.0%) | 0 (0.0%) |
| $75,000 to $99,999 | 0 (0.0%) | 0 (0.0%) |
| $100,000+ | 0 (0.0%) | 0 (0.0%) |
| Total | 20 (100.0%) | 12 (100.0%) |
Earnings by Sex by Educational Attainment in Porcupine
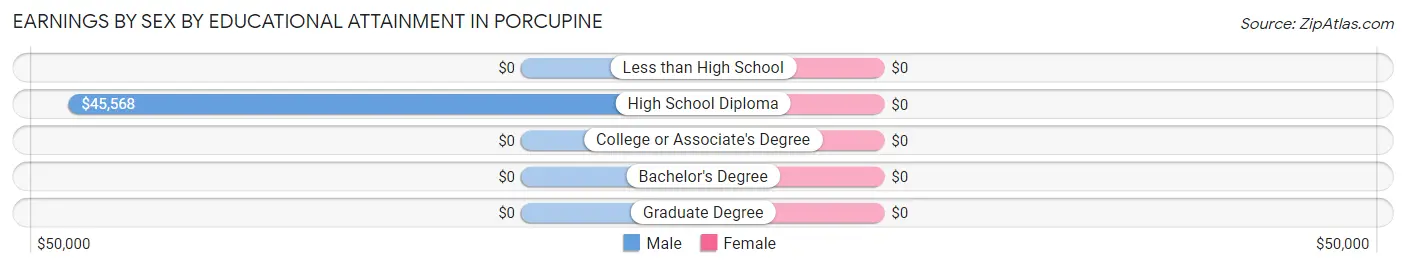
| Educational Attainment | Male Income | Female Income |
| Less than High School | - | - |
| High School Diploma | $45,568 | $0 |
| College or Associate's Degree | - | - |
| Bachelor's Degree | - | - |
| Graduate Degree | - | - |
| Total | $45,227 | $50,000 |
Family Income in Porcupine
Family Income Brackets in Porcupine
According to the Porcupine family income data, there are 9 families falling into the $50,000 to $74,999 income range, which is the most common income bracket and makes up 45.0% of all families.
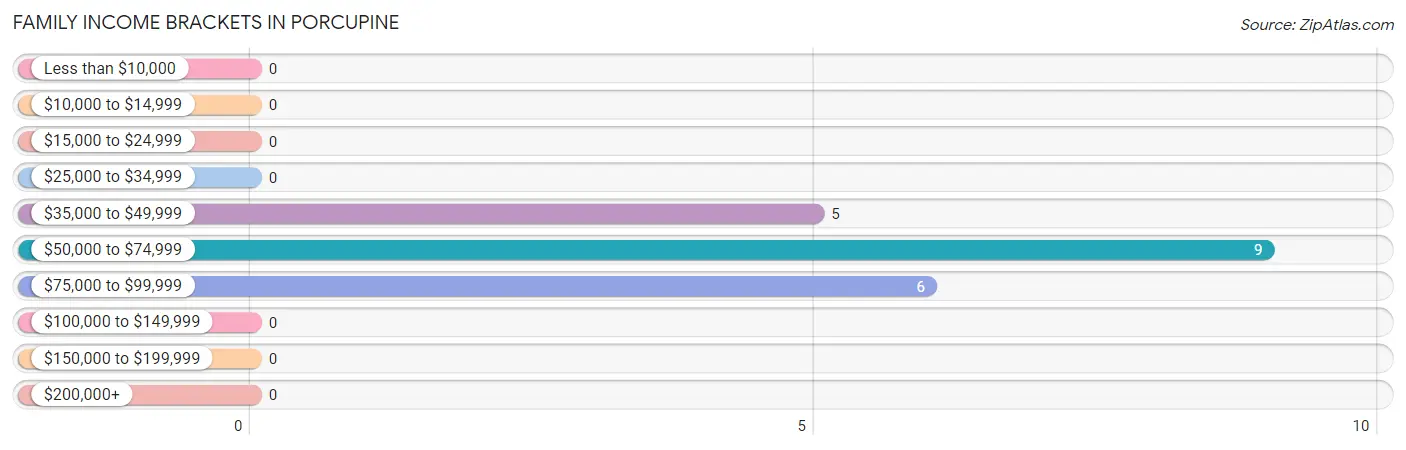
| Income Bracket | # Families | % Families |
| Less than $10,000 | 0 | 0.0% |
| $10,000 to $14,999 | 0 | 0.0% |
| $15,000 to $24,999 | 0 | 0.0% |
| $25,000 to $34,999 | 0 | 0.0% |
| $35,000 to $49,999 | 5 | 25.0% |
| $50,000 to $74,999 | 9 | 45.0% |
| $75,000 to $99,999 | 6 | 30.0% |
| $100,000 to $149,999 | 0 | 0.0% |
| $150,000 to $199,999 | 0 | 0.0% |
| $200,000+ | 0 | 0.0% |
Family Income by Famaliy Size in Porcupine
| Income Bracket | # Families | Median Income |
| 2-Person Families | 5 (25.0%) | $0 |
| 3-Person Families | 3 (15.0%) | $0 |
| 4-Person Families | 0 (0.0%) | $0 |
| 5-Person Families | 6 (30.0%) | $0 |
| 6-Person Families | 0 (0.0%) | $0 |
| 7+ Person Families | 6 (30.0%) | $0 |
| Total | 20 (100.0%) | $73,333 |
Family Income by Number of Earners in Porcupine
| Number of Earners | # Families | Median Income |
| No Earners | 0 (0.0%) | $0 |
| 1 Earner | 11 (55.0%) | $0 |
| 2 Earners | 9 (45.0%) | $0 |
| 3+ Earners | 0 (0.0%) | $0 |
| Total | 20 (100.0%) | $73,333 |
Household Income in Porcupine
Household Income Brackets in Porcupine
With 12 households falling in the category, the $75,000 to $99,999 income range is the most frequent in Porcupine, accounting for 48.0% of all households.
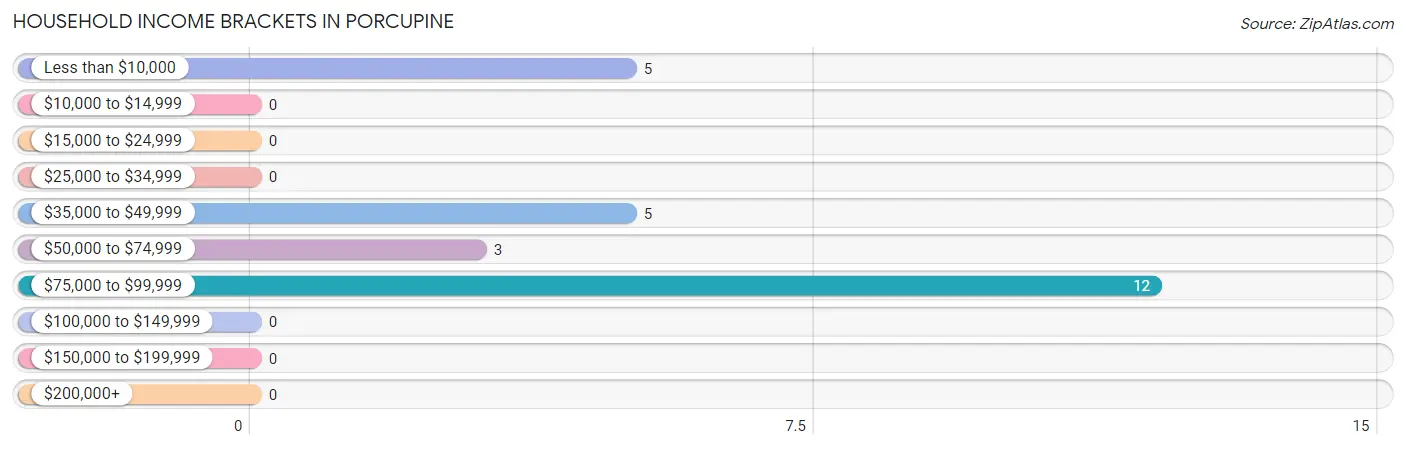
| Income Bracket | # Households | % Households |
| Less than $10,000 | 5 | 20.0% |
| $10,000 to $14,999 | 0 | 0.0% |
| $15,000 to $24,999 | 0 | 0.0% |
| $25,000 to $34,999 | 0 | 0.0% |
| $35,000 to $49,999 | 5 | 20.0% |
| $50,000 to $74,999 | 3 | 12.0% |
| $75,000 to $99,999 | 12 | 48.0% |
| $100,000 to $149,999 | 0 | 0.0% |
| $150,000 to $199,999 | 0 | 0.0% |
| $200,000+ | 0 | 0.0% |
Household Income by Householder Age in Porcupine
The median household income in Porcupine is $54,583, with the highest median household income of $47,250 found in the 45 to 64 years age bracket for the primary householder. A total of 19 households (76.0%) fall into this category.
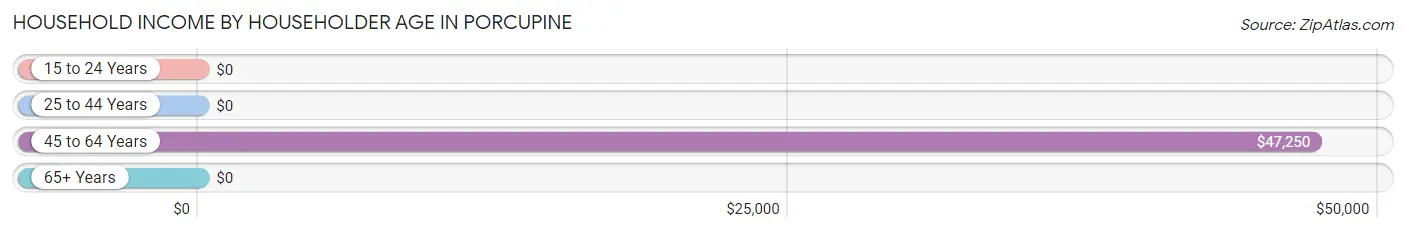
| Income Bracket | # Households | Median Income |
| 15 to 24 Years | 0 (0.0%) | $0 |
| 25 to 44 Years | 6 (24.0%) | $0 |
| 45 to 64 Years | 19 (76.0%) | $47,250 |
| 65+ Years | 0 (0.0%) | $0 |
| Total | 25 (100.0%) | $54,583 |
Poverty in Porcupine
Income Below Poverty by Sex and Age in Porcupine
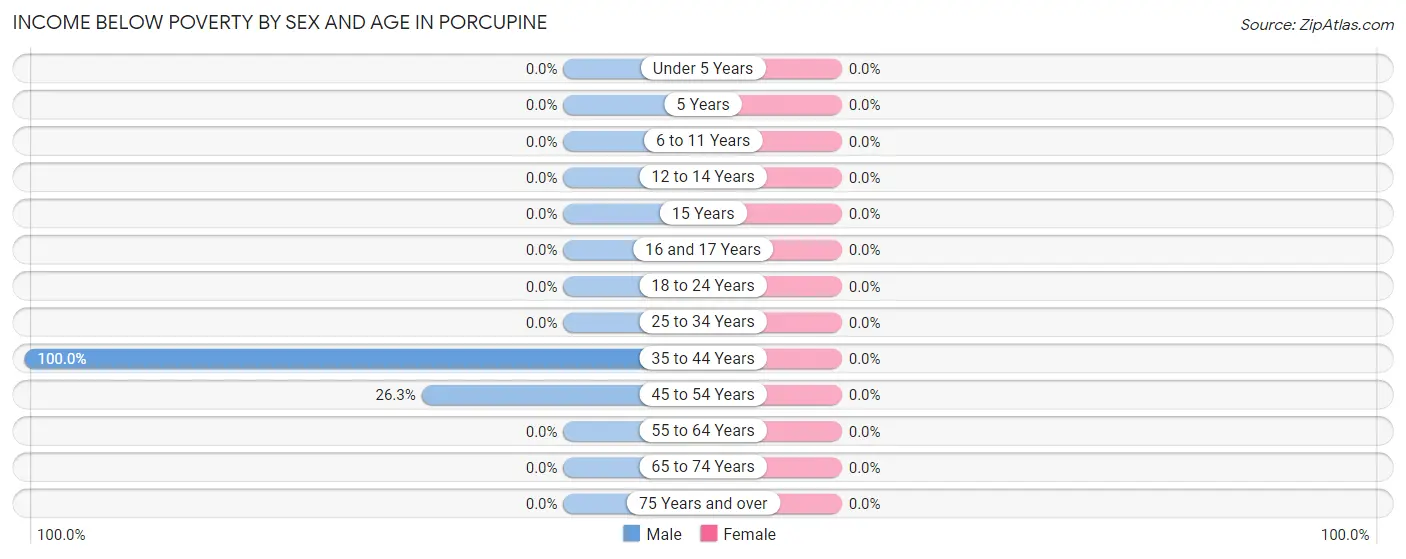
| Age Bracket | Male | Female |
| Under 5 Years | 0 (0.0%) | 0 (0.0%) |
| 5 Years | 0 (0.0%) | 0 (0.0%) |
| 6 to 11 Years | 0 (0.0%) | 0 (0.0%) |
| 12 to 14 Years | 0 (0.0%) | 0 (0.0%) |
| 15 Years | 0 (0.0%) | 0 (0.0%) |
| 16 and 17 Years | 0 (0.0%) | 0 (0.0%) |
| 18 to 24 Years | 0 (0.0%) | 0 (0.0%) |
| 25 to 34 Years | 0 (0.0%) | 0 (0.0%) |
| 35 to 44 Years | 6 (100.0%) | 0 (0.0%) |
| 45 to 54 Years | 5 (26.3%) | 0 (0.0%) |
| 55 to 64 Years | 0 (0.0%) | 0 (0.0%) |
| 65 to 74 Years | 0 (0.0%) | 0 (0.0%) |
| 75 Years and over | 0 (0.0%) | 0 (0.0%) |
| Total | 11 (19.6%) | 0 (0.0%) |
Income Above Poverty by Sex and Age in Porcupine
According to the poverty statistics in Porcupine, males aged under 5 years and females aged 6 to 11 years are the age groups that are most secure financially, with 100.0% of males and 100.0% of females in these age groups living above the poverty line.
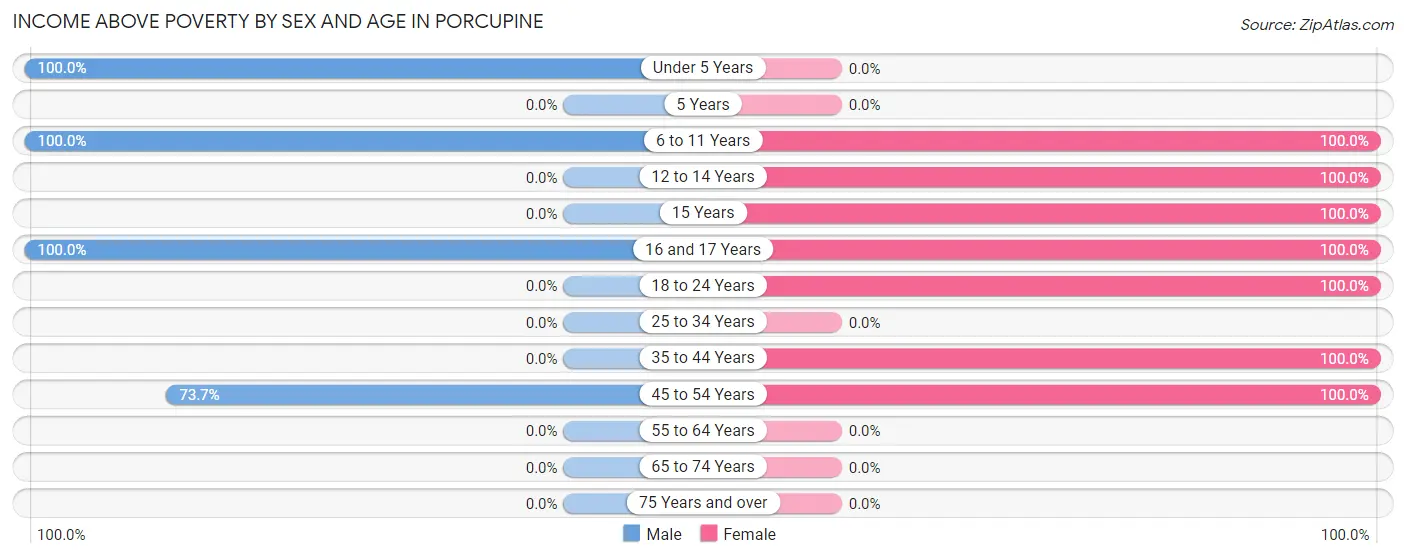
| Age Bracket | Male | Female |
| Under 5 Years | 5 (100.0%) | 0 (0.0%) |
| 5 Years | 0 (0.0%) | 0 (0.0%) |
| 6 to 11 Years | 13 (100.0%) | 14 (100.0%) |
| 12 to 14 Years | 0 (0.0%) | 6 (100.0%) |
| 15 Years | 0 (0.0%) | 2 (100.0%) |
| 16 and 17 Years | 13 (100.0%) | 4 (100.0%) |
| 18 to 24 Years | 0 (0.0%) | 11 (100.0%) |
| 25 to 34 Years | 0 (0.0%) | 0 (0.0%) |
| 35 to 44 Years | 0 (0.0%) | 11 (100.0%) |
| 45 to 54 Years | 14 (73.7%) | 7 (100.0%) |
| 55 to 64 Years | 0 (0.0%) | 0 (0.0%) |
| 65 to 74 Years | 0 (0.0%) | 0 (0.0%) |
| 75 Years and over | 0 (0.0%) | 0 (0.0%) |
| Total | 45 (80.4%) | 55 (100.0%) |
Income Below Poverty Among Married-Couple Families in Porcupine
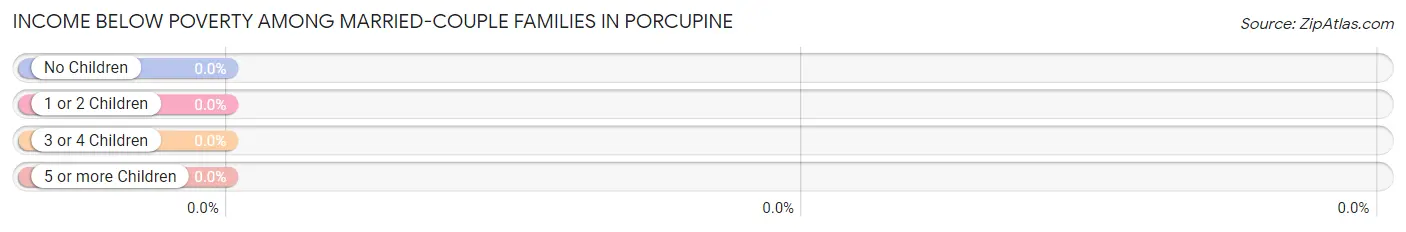
| Children | Above Poverty | Below Poverty |
| No Children | 5 (100.0%) | 0 (0.0%) |
| 1 or 2 Children | 3 (100.0%) | 0 (0.0%) |
| 3 or 4 Children | 0 (0.0%) | 0 (0.0%) |
| 5 or more Children | 6 (100.0%) | 0 (0.0%) |
| Total | 14 (100.0%) | 0 (0.0%) |
Income Below Poverty Among Single-Parent Households in Porcupine
| Children | Single Father | Single Mother |
| No Children | 0 (0.0%) | 0 (0.0%) |
| 1 or 2 Children | 0 (0.0%) | 0 (0.0%) |
| 3 or 4 Children | 0 (0.0%) | 0 (0.0%) |
| 5 or more Children | 0 (0.0%) | 0 (0.0%) |
| Total | 0 (0.0%) | 0 (0.0%) |
Income Below Poverty Among Married-Couple vs Single-Parent Households in Porcupine
| Children | Married-Couple Families | Single-Parent Households |
| No Children | 0 (0.0%) | 0 (0.0%) |
| 1 or 2 Children | 0 (0.0%) | 0 (0.0%) |
| 3 or 4 Children | 0 (0.0%) | 0 (0.0%) |
| 5 or more Children | 0 (0.0%) | 0 (0.0%) |
| Total | 0 (0.0%) | 0 (0.0%) |
Race in Porcupine
The most populous races in Porcupine are Native / Alaskan (103 | 88.8%), Hispanic or Latino (8 | 6.9%), and Some other Race (8 | 6.9%).
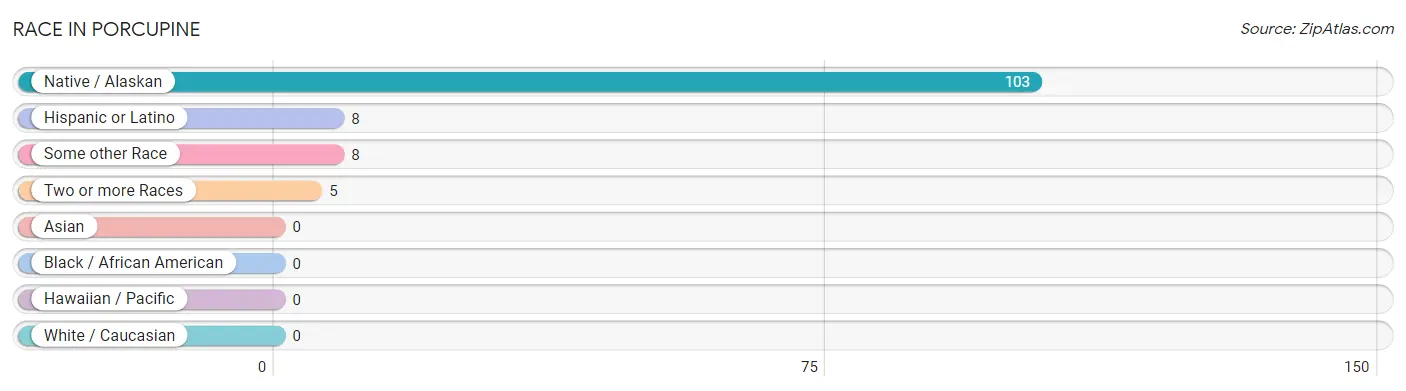
| Race | # Population | % Population |
| Asian | 0 | 0.0% |
| Black / African American | 0 | 0.0% |
| Hawaiian / Pacific | 0 | 0.0% |
| Hispanic or Latino | 8 | 6.9% |
| Native / Alaskan | 103 | 88.8% |
| White / Caucasian | 0 | 0.0% |
| Two or more Races | 5 | 4.3% |
| Some other Race | 8 | 6.9% |
| Total | 116 | 100.0% |
Ancestry in Porcupine
The most populous ancestries reported in Porcupine are Sioux (90 | 77.6%), German (48 | 41.4%), Spanish (5 | 4.3%), and Spaniard (3 | 2.6%), together accounting for 125.9% of all Porcupine residents.
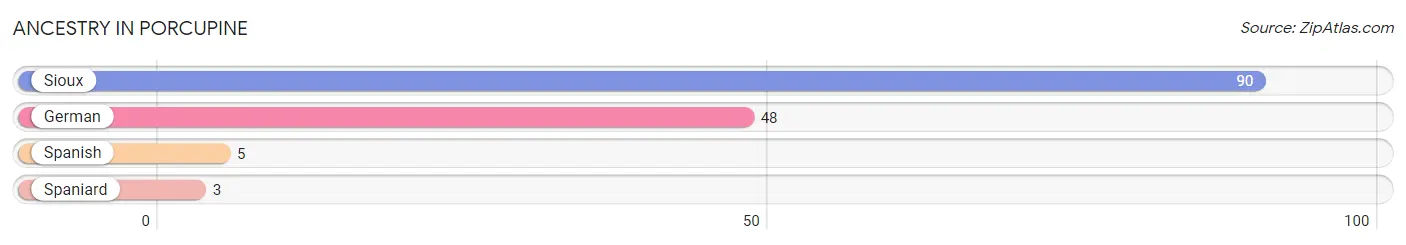
| Ancestry | # Population | % Population |
| German | 48 | 41.4% |
| Sioux | 90 | 77.6% |
| Spaniard | 3 | 2.6% |
| Spanish | 5 | 4.3% | View All 4 Rows |
Immigrants in Porcupine

| Immigration Origin | # Population | % Population | View All 0 Rows |
Sex and Age in Porcupine
Sex and Age in Porcupine
The most populous age groups in Porcupine are 15 to 19 Years (13 | 23.2%) for men and 15 to 19 Years (17 | 28.3%) for women.
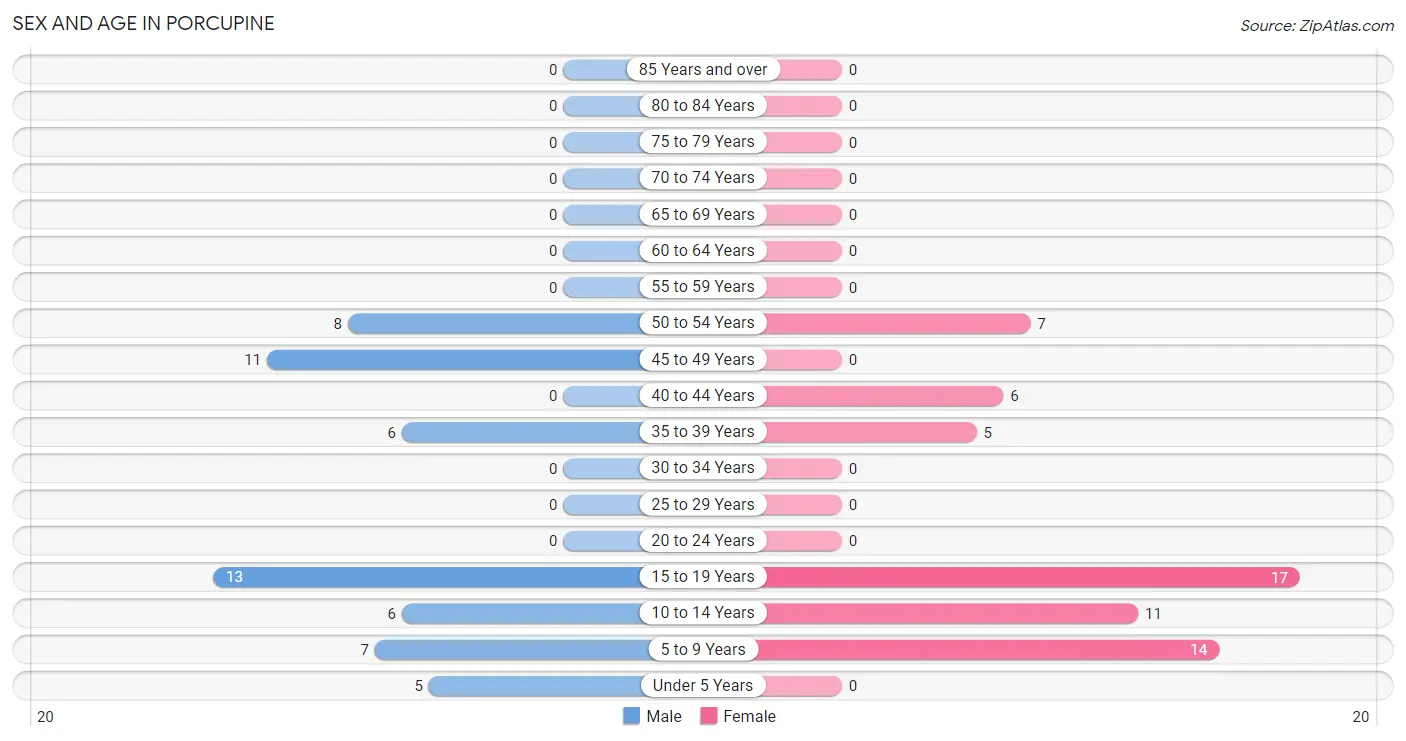
| Age Bracket | Male | Female |
| Under 5 Years | 5 (8.9%) | 0 (0.0%) |
| 5 to 9 Years | 7 (12.5%) | 14 (23.3%) |
| 10 to 14 Years | 6 (10.7%) | 11 (18.3%) |
| 15 to 19 Years | 13 (23.2%) | 17 (28.3%) |
| 20 to 24 Years | 0 (0.0%) | 0 (0.0%) |
| 25 to 29 Years | 0 (0.0%) | 0 (0.0%) |
| 30 to 34 Years | 0 (0.0%) | 0 (0.0%) |
| 35 to 39 Years | 6 (10.7%) | 5 (8.3%) |
| 40 to 44 Years | 0 (0.0%) | 6 (10.0%) |
| 45 to 49 Years | 11 (19.6%) | 0 (0.0%) |
| 50 to 54 Years | 8 (14.3%) | 7 (11.7%) |
| 55 to 59 Years | 0 (0.0%) | 0 (0.0%) |
| 60 to 64 Years | 0 (0.0%) | 0 (0.0%) |
| 65 to 69 Years | 0 (0.0%) | 0 (0.0%) |
| 70 to 74 Years | 0 (0.0%) | 0 (0.0%) |
| 75 to 79 Years | 0 (0.0%) | 0 (0.0%) |
| 80 to 84 Years | 0 (0.0%) | 0 (0.0%) |
| 85 Years and over | 0 (0.0%) | 0 (0.0%) |
| Total | 56 (100.0%) | 60 (100.0%) |
Families and Households in Porcupine
Median Family Size in Porcupine
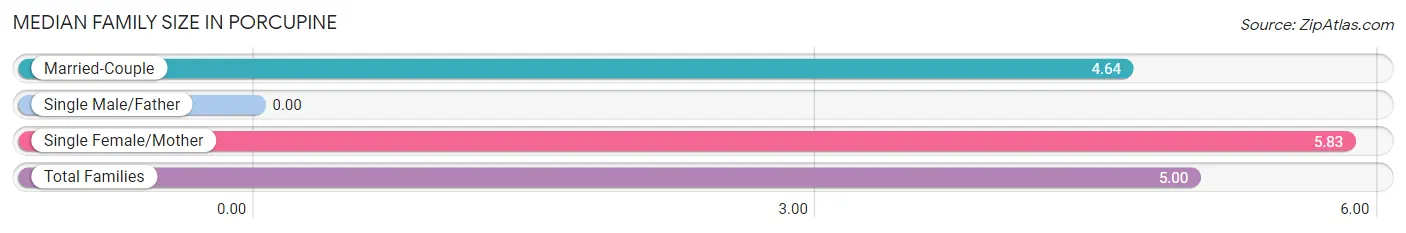
| Family Type | # Families | Family Size |
| Married-Couple | 14 (70.0%) | 4.64 |
| Single Male/Father | 0 (0.0%) | - |
| Single Female/Mother | 6 (30.0%) | 5.83 |
| Total Families | 20 (100.0%) | 5.00 |
Median Household Size in Porcupine
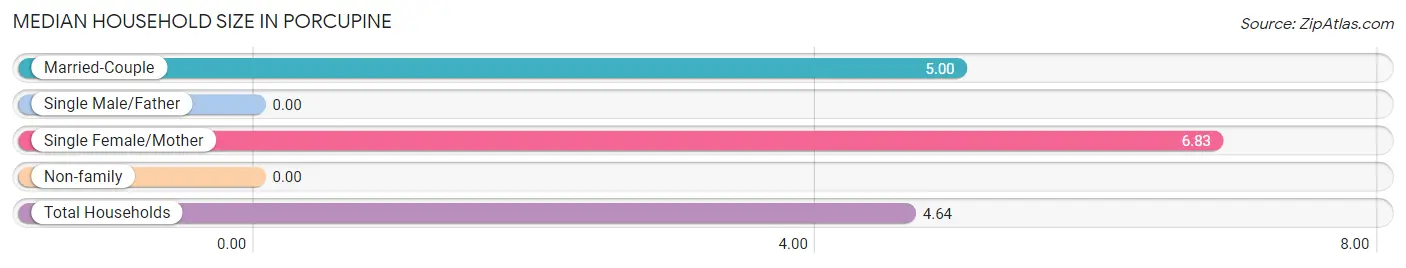
| Household Type | # Households | Household Size |
| Married-Couple | 14 (56.0%) | 5.00 |
| Single Male/Father | 0 (0.0%) | - |
| Single Female/Mother | 6 (24.0%) | 6.83 |
| Non-family | 5 (20.0%) | - |
| Total Households | 25 (100.0%) | 4.64 |
Household Size by Marriage Status in Porcupine
Out of a total of 25 households in Porcupine, 20 (80.0%) are family households, while 5 (20.0%) are nonfamily households. The most numerous type of family households are 3-person households, comprising 8, and the most common type of nonfamily households are 1-person households, comprising 5.
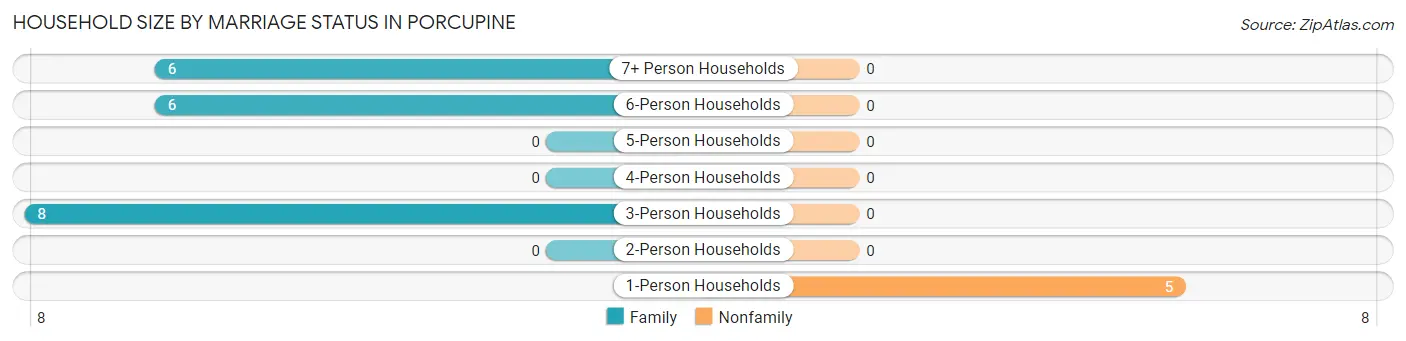
| Household Size | Family Households | Nonfamily Households |
| 1-Person Households | - | 5 (20.0%) |
| 2-Person Households | 0 (0.0%) | 0 (0.0%) |
| 3-Person Households | 8 (32.0%) | 0 (0.0%) |
| 4-Person Households | 0 (0.0%) | 0 (0.0%) |
| 5-Person Households | 0 (0.0%) | 0 (0.0%) |
| 6-Person Households | 6 (24.0%) | 0 (0.0%) |
| 7+ Person Households | 6 (24.0%) | 0 (0.0%) |
| Total | 20 (80.0%) | 5 (20.0%) |
Female Fertility in Porcupine
Fertility by Age in Porcupine
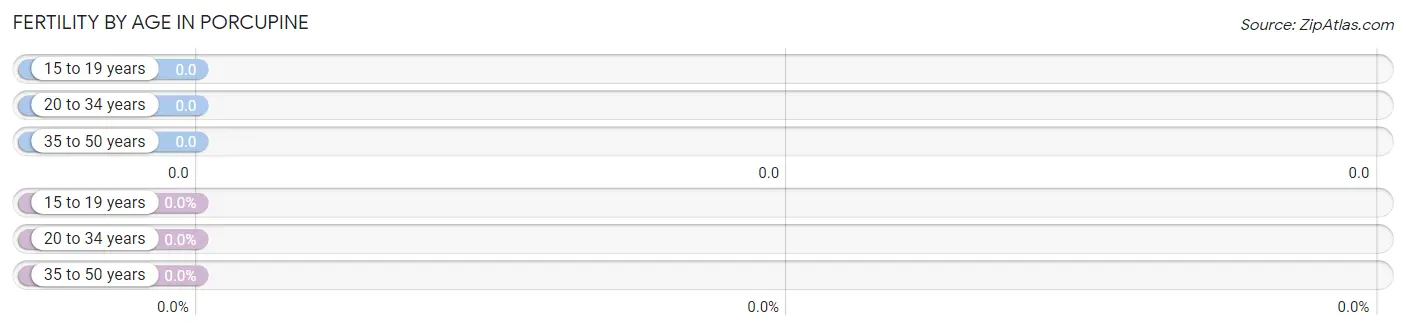
| Age Bracket | Women with Births | Births / 1,000 Women |
| 15 to 19 years | 0 (0.0%) | 0.0 |
| 20 to 34 years | 0 (0.0%) | 0.0 |
| 35 to 50 years | 0 (0.0%) | 0.0 |
| Total | 0 (0.0%) | 0.0 |
Fertility by Age by Marriage Status in Porcupine
| Age Bracket | Married | Unmarried |
| 15 to 19 years | 0 (0.0%) | 0 (0.0%) |
| 20 to 34 years | 0 (0.0%) | 0 (0.0%) |
| 35 to 50 years | 0 (0.0%) | 0 (0.0%) |
| Total | 0 (0.0%) | 0 (0.0%) |
Fertility by Education in Porcupine
| Educational Attainment | Women with Births | Births / 1,000 Women |
| Less than High School | 0 (0.0%) | 0.0 |
| High School Diploma | 0 (0.0%) | 0.0 |
| College or Associate's Degree | 0 (0.0%) | 0.0 |
| Bachelor's Degree | 0 (0.0%) | 0.0 |
| Graduate Degree | 0 (0.0%) | 0.0 |
| Total | 0 (0.0%) | 0.0 |
Fertility by Education by Marriage Status in Porcupine
| Educational Attainment | Married | Unmarried |
| Less than High School | 0 (0.0%) | 0 (0.0%) |
| High School Diploma | 0 (0.0%) | 0 (0.0%) |
| College or Associate's Degree | 0 (0.0%) | 0 (0.0%) |
| Bachelor's Degree | 0 (0.0%) | 0 (0.0%) |
| Graduate Degree | 0 (0.0%) | 0 (0.0%) |
| Total | 0 (0.0%) | 0 (0.0%) |
Employment Characteristics in Porcupine
Employment by Class of Employer in Porcupine
Among the 27 employed individuals in Porcupine, local government employees (13 | 48.1%), self-employed (not incorporated) (8 | 29.6%), and federal government employees (6 | 22.2%) make up the most common classes of employment.
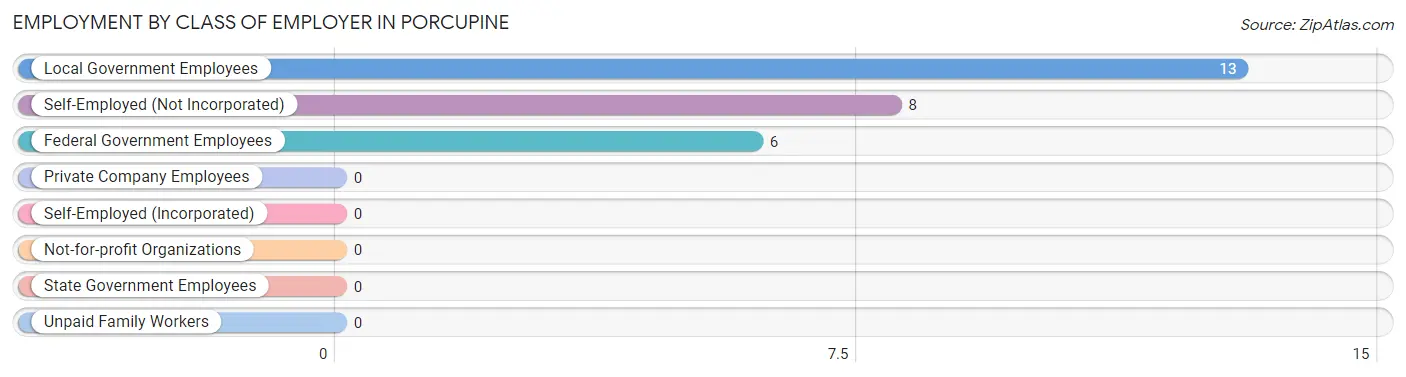
| Employer Class | # Employees | % Employees |
| Private Company Employees | 0 | 0.0% |
| Self-Employed (Incorporated) | 0 | 0.0% |
| Self-Employed (Not Incorporated) | 8 | 29.6% |
| Not-for-profit Organizations | 0 | 0.0% |
| Local Government Employees | 13 | 48.1% |
| State Government Employees | 0 | 0.0% |
| Federal Government Employees | 6 | 22.2% |
| Unpaid Family Workers | 0 | 0.0% |
| Total | 27 | 100.0% |
Employment Status by Age in Porcupine
According to the labor force statistics for Porcupine, out of the total population over 16 years of age (71), 52.1% or 37 individuals are in the labor force, with 27.0% or 10 of them unemployed. The age group with the highest labor force participation rate is 35 to 44 years, with 100.0% or 17 individuals in the labor force. Within the labor force, the 35 to 44 years age range has the highest percentage of unemployed individuals, with 29.4% or 5 of them being unemployed.
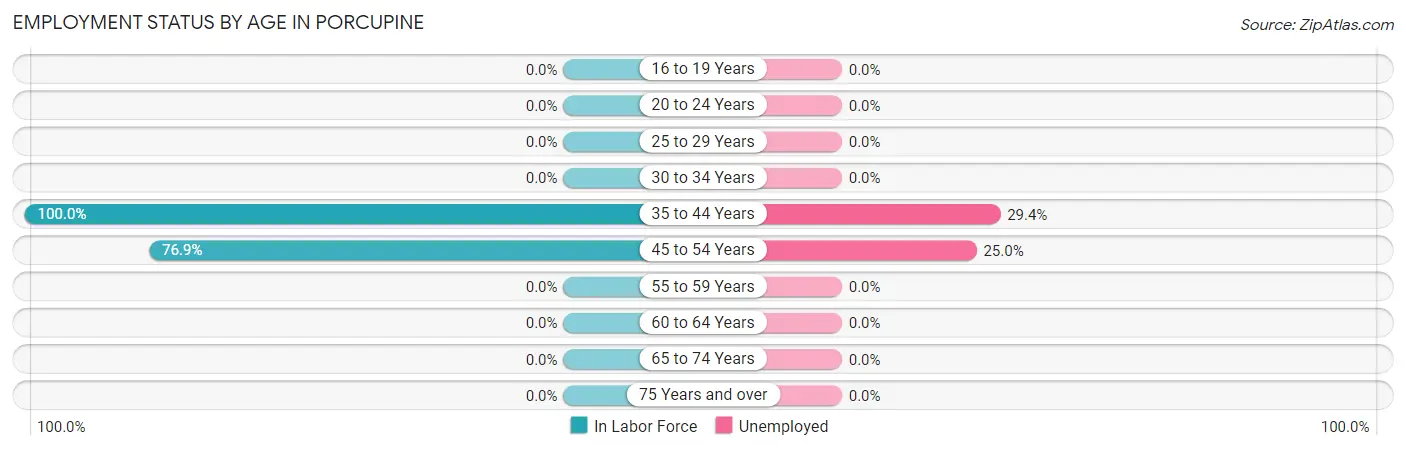
| Age Bracket | In Labor Force | Unemployed |
| 16 to 19 Years | 0 (0.0%) | 0 (0.0%) |
| 20 to 24 Years | 0 (0.0%) | 0 (0.0%) |
| 25 to 29 Years | 0 (0.0%) | 0 (0.0%) |
| 30 to 34 Years | 0 (0.0%) | 0 (0.0%) |
| 35 to 44 Years | 17 (100.0%) | 5 (29.4%) |
| 45 to 54 Years | 20 (76.9%) | 5 (25.0%) |
| 55 to 59 Years | 0 (0.0%) | 0 (0.0%) |
| 60 to 64 Years | 0 (0.0%) | 0 (0.0%) |
| 65 to 74 Years | 0 (0.0%) | 0 (0.0%) |
| 75 Years and over | 0 (0.0%) | 0 (0.0%) |
| Total | 37 (52.1%) | 10 (27.0%) |
Employment Status by Educational Attainment in Porcupine
According to labor force statistics for Porcupine, 86.0% of individuals (37) out of the total population between 25 and 64 years of age (43) are in the labor force, with 27.0% or 10 of them being unemployed. The group with the highest labor force participation rate are those with the educational attainment of less than high school, with 100.0% or 3 individuals in the labor force. Within the labor force, individuals with college / associate degree education have the highest percentage of unemployment, with 62.5% or 10 of them being unemployed.
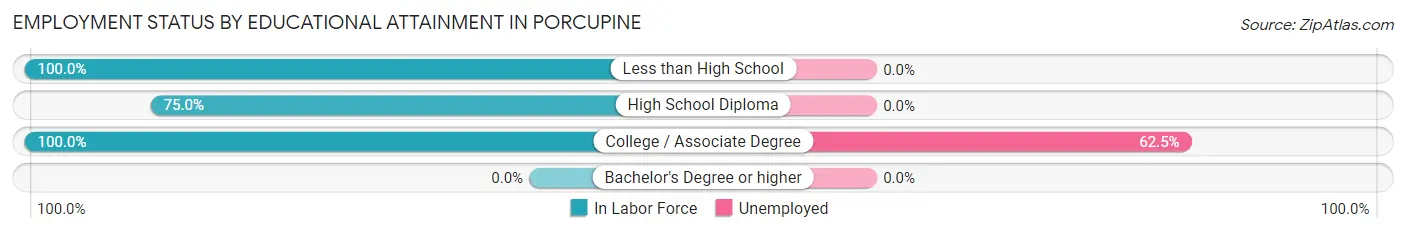
| Educational Attainment | In Labor Force | Unemployed |
| Less than High School | 3 (100.0%) | 0 (0.0%) |
| High School Diploma | 18 (75.0%) | 0 (0.0%) |
| College / Associate Degree | 16 (100.0%) | 10 (62.5%) |
| Bachelor's Degree or higher | 0 (0.0%) | 0 (0.0%) |
| Total | 37 (86.0%) | 12 (27.0%) |
Employment Occupations by Sex in Porcupine
Management, Business, Science and Arts Occupations
The most common Management, Business, Science and Arts occupations in Porcupine are , and Management (11 | 40.7%).
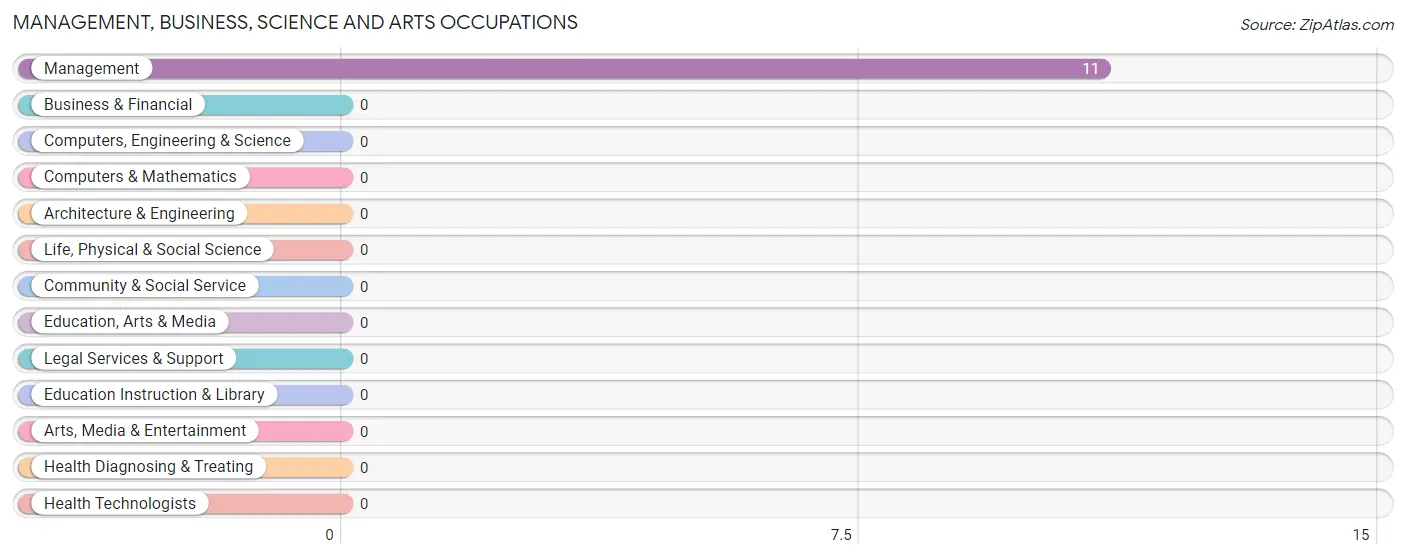
Management, Business, Science and Arts Occupations by Sex
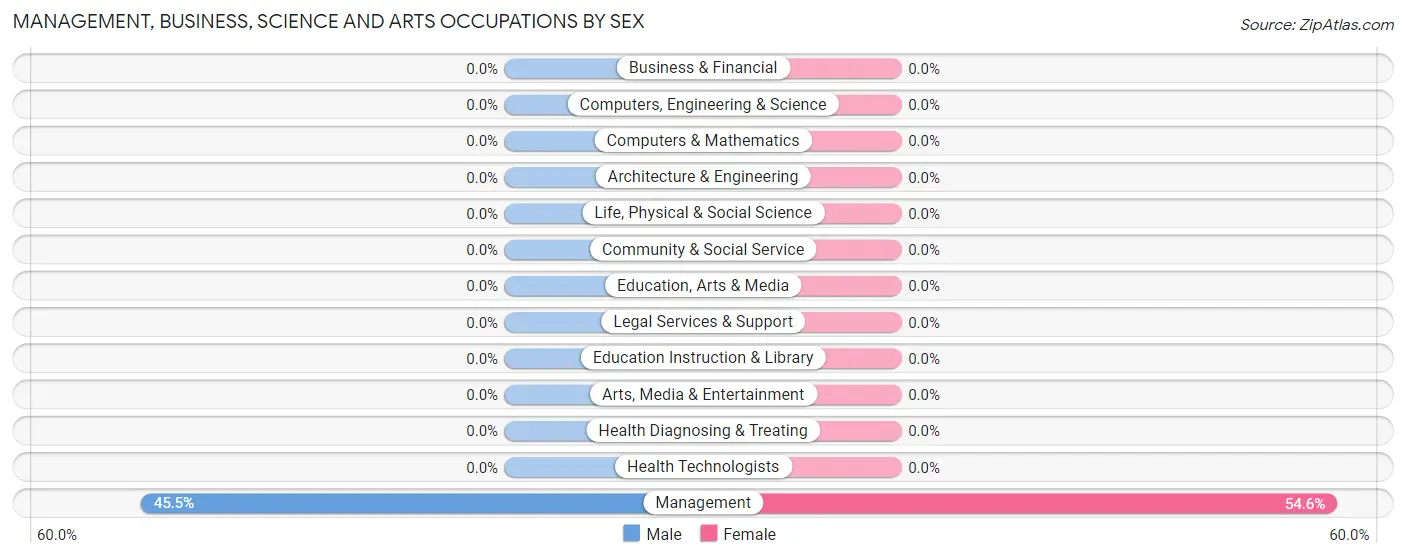
| Occupation | Male | Female |
| Management | 5 (45.5%) | 6 (54.5%) |
| Business & Financial | 0 (0.0%) | 0 (0.0%) |
| Computers, Engineering & Science | 0 (0.0%) | 0 (0.0%) |
| Computers & Mathematics | 0 (0.0%) | 0 (0.0%) |
| Architecture & Engineering | 0 (0.0%) | 0 (0.0%) |
| Life, Physical & Social Science | 0 (0.0%) | 0 (0.0%) |
| Community & Social Service | 0 (0.0%) | 0 (0.0%) |
| Education, Arts & Media | 0 (0.0%) | 0 (0.0%) |
| Legal Services & Support | 0 (0.0%) | 0 (0.0%) |
| Education Instruction & Library | 0 (0.0%) | 0 (0.0%) |
| Arts, Media & Entertainment | 0 (0.0%) | 0 (0.0%) |
| Health Diagnosing & Treating | 0 (0.0%) | 0 (0.0%) |
| Health Technologists | 0 (0.0%) | 0 (0.0%) |
| Total (Category) | 5 (45.5%) | 6 (54.5%) |
| Total (Overall) | 20 (74.1%) | 7 (25.9%) |
Services Occupations
Services Occupations by Sex
| Occupation | Male | Female |
| Healthcare Support | 0 (0.0%) | 0 (0.0%) |
| Security & Protection | 0 (0.0%) | 0 (0.0%) |
| Firefighting & Prevention | 0 (0.0%) | 0 (0.0%) |
| Law Enforcement | 0 (0.0%) | 0 (0.0%) |
| Food Preparation & Serving | 0 (0.0%) | 0 (0.0%) |
| Cleaning & Maintenance | 0 (0.0%) | 0 (0.0%) |
| Personal Care & Service | 0 (0.0%) | 0 (0.0%) |
| Total (Category) | 0 (0.0%) | 0 (0.0%) |
| Total (Overall) | 20 (74.1%) | 7 (25.9%) |
Sales and Office Occupations
Sales and Office Occupations by Sex
| Occupation | Male | Female |
| Sales & Related | 0 (0.0%) | 0 (0.0%) |
| Office & Administration | 0 (0.0%) | 0 (0.0%) |
| Total (Category) | 0 (0.0%) | 0 (0.0%) |
| Total (Overall) | 20 (74.1%) | 7 (25.9%) |
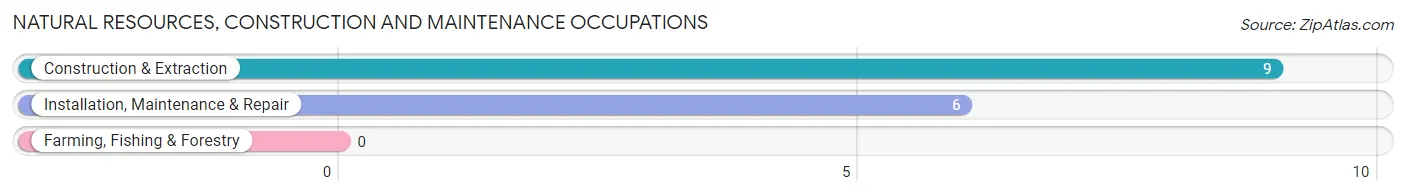
Natural Resources, Construction and Maintenance Occupations
The most common Natural Resources, Construction and Maintenance occupations in Porcupine are Construction & Extraction (9 | 33.3%), and Installation, Maintenance & Repair (6 | 22.2%).
Natural Resources, Construction and Maintenance Occupations by Sex
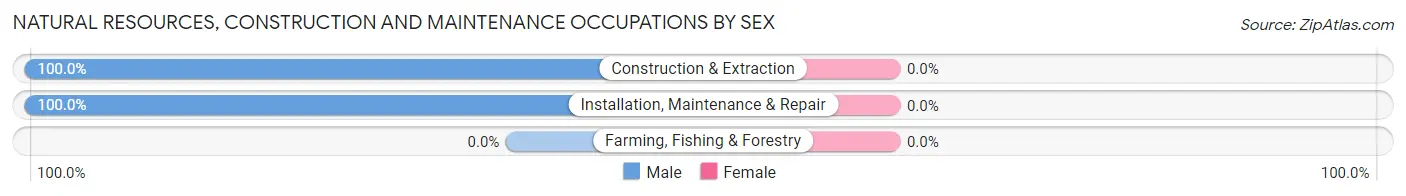
| Occupation | Male | Female |
| Farming, Fishing & Forestry | 0 (0.0%) | 0 (0.0%) |
| Construction & Extraction | 9 (100.0%) | 0 (0.0%) |
| Installation, Maintenance & Repair | 6 (100.0%) | 0 (0.0%) |
| Total (Category) | 15 (100.0%) | 0 (0.0%) |
| Total (Overall) | 20 (74.1%) | 7 (25.9%) |
Production, Transportation and Moving Occupations
The most common Production, Transportation and Moving occupations in Porcupine are , and Production (1 | 3.7%).
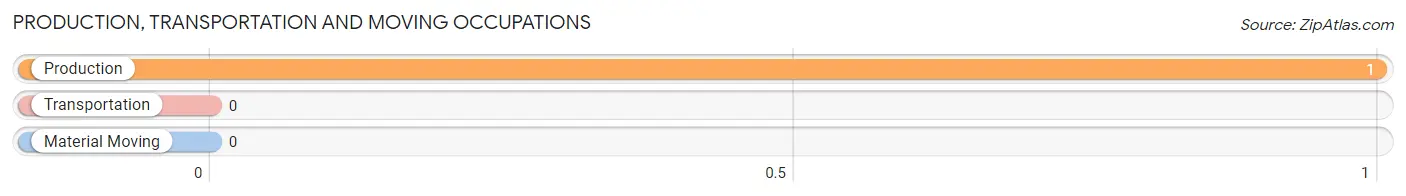
Production, Transportation and Moving Occupations by Sex
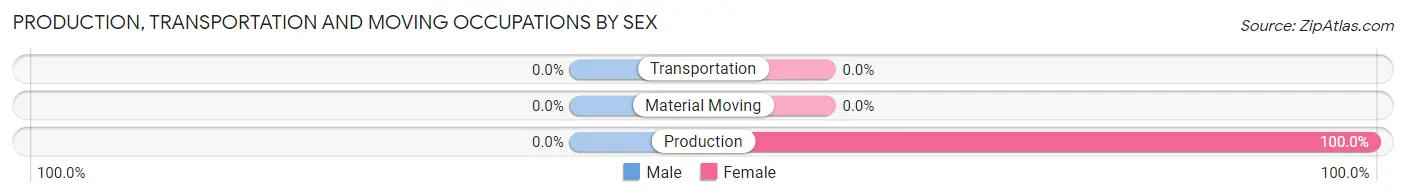
| Occupation | Male | Female |
| Production | 0 (0.0%) | 1 (100.0%) |
| Transportation | 0 (0.0%) | 0 (0.0%) |
| Material Moving | 0 (0.0%) | 0 (0.0%) |
| Total (Category) | 0 (0.0%) | 1 (100.0%) |
| Total (Overall) | 20 (74.1%) | 7 (25.9%) |
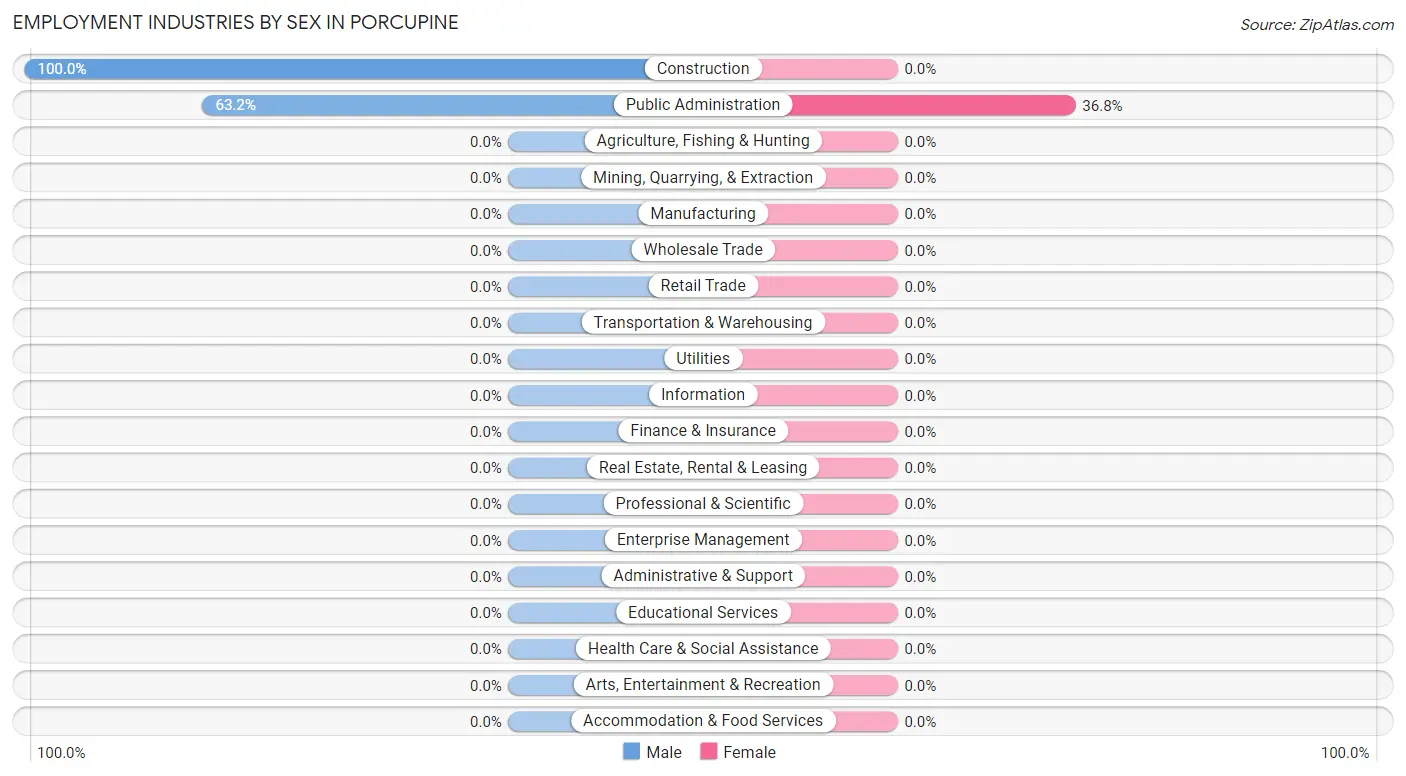
Employment Industries by Sex in Porcupine
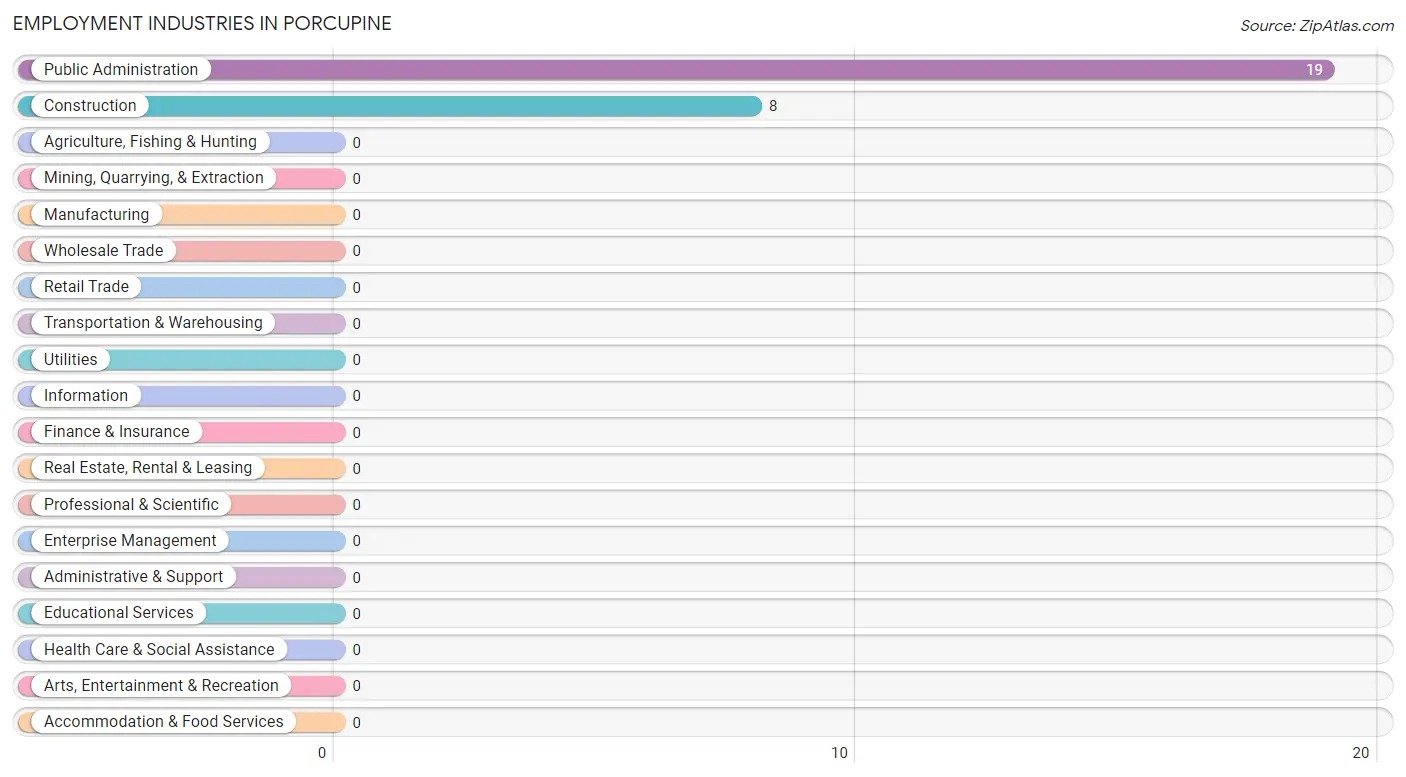
Employment Industries in Porcupine
The major employment industries in Porcupine include Public Administration (19 | 70.4%), and Construction (8 | 29.6%).
Employment Industries by Sex in Porcupine
| Industry | Male | Female |
| Agriculture, Fishing & Hunting | 0 (0.0%) | 0 (0.0%) |
| Mining, Quarrying, & Extraction | 0 (0.0%) | 0 (0.0%) |
| Construction | 8 (100.0%) | 0 (0.0%) |
| Manufacturing | 0 (0.0%) | 0 (0.0%) |
| Wholesale Trade | 0 (0.0%) | 0 (0.0%) |
| Retail Trade | 0 (0.0%) | 0 (0.0%) |
| Transportation & Warehousing | 0 (0.0%) | 0 (0.0%) |
| Utilities | 0 (0.0%) | 0 (0.0%) |
| Information | 0 (0.0%) | 0 (0.0%) |
| Finance & Insurance | 0 (0.0%) | 0 (0.0%) |
| Real Estate, Rental & Leasing | 0 (0.0%) | 0 (0.0%) |
| Professional & Scientific | 0 (0.0%) | 0 (0.0%) |
| Enterprise Management | 0 (0.0%) | 0 (0.0%) |
| Administrative & Support | 0 (0.0%) | 0 (0.0%) |
| Educational Services | 0 (0.0%) | 0 (0.0%) |
| Health Care & Social Assistance | 0 (0.0%) | 0 (0.0%) |
| Arts, Entertainment & Recreation | 0 (0.0%) | 0 (0.0%) |
| Accommodation & Food Services | 0 (0.0%) | 0 (0.0%) |
| Public Administration | 12 (63.2%) | 7 (36.8%) |
| Total | 20 (74.1%) | 7 (25.9%) |
Education in Porcupine
School Enrollment in Porcupine
The most common levels of schooling among the 73 students in Porcupine are high school (35 | 47.9%), elementary school (21 | 28.8%), and middle school (12 | 16.4%).
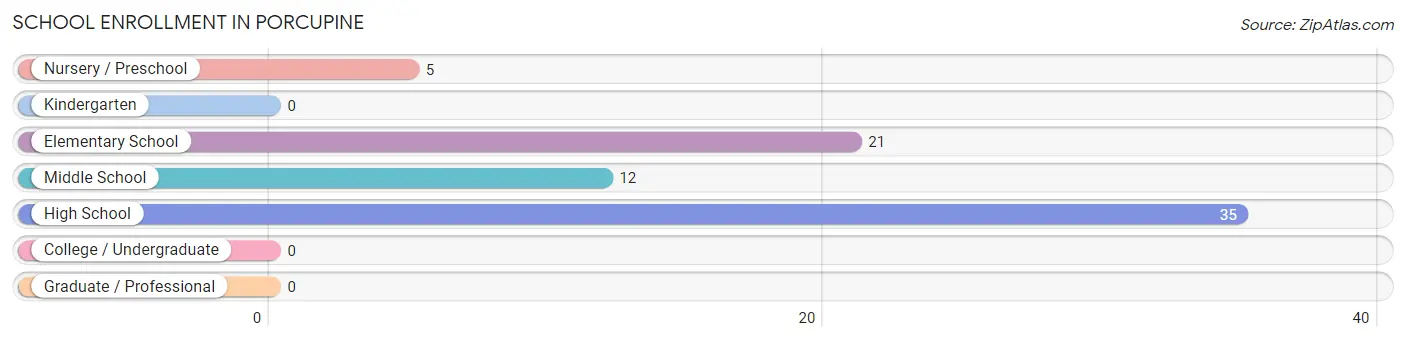
| School Level | # Students | % Students |
| Nursery / Preschool | 5 | 6.9% |
| Kindergarten | 0 | 0.0% |
| Elementary School | 21 | 28.8% |
| Middle School | 12 | 16.4% |
| High School | 35 | 47.9% |
| College / Undergraduate | 0 | 0.0% |
| Graduate / Professional | 0 | 0.0% |
| Total | 73 | 100.0% |
School Enrollment by Age by Funding Source in Porcupine
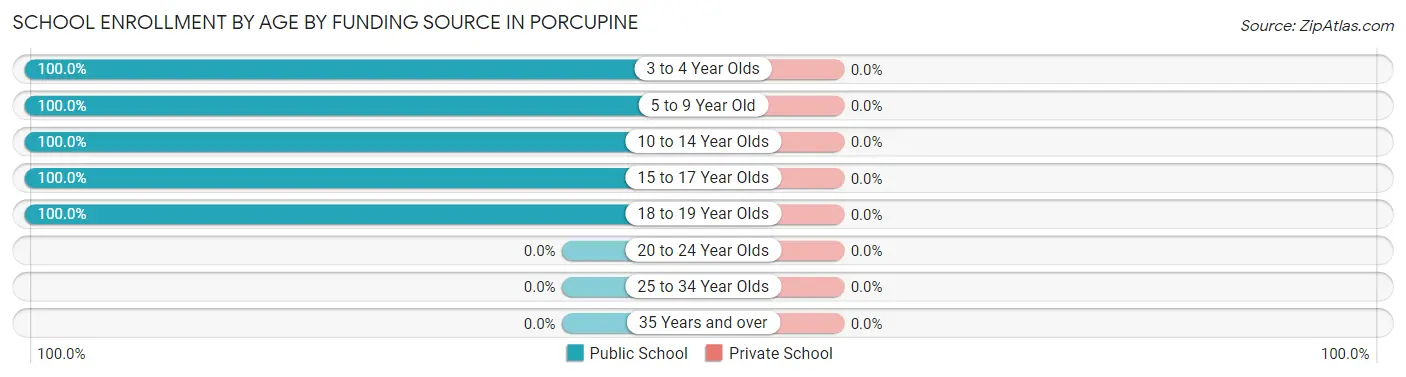
| Age Bracket | Public School | Private School |
| 3 to 4 Year Olds | 5 (100.0%) | 0 (0.0%) |
| 5 to 9 Year Old | 21 (100.0%) | 0 (0.0%) |
| 10 to 14 Year Olds | 17 (100.0%) | 0 (0.0%) |
| 15 to 17 Year Olds | 19 (100.0%) | 0 (0.0%) |
| 18 to 19 Year Olds | 11 (100.0%) | 0 (0.0%) |
| 20 to 24 Year Olds | 0 (0.0%) | 0 (0.0%) |
| 25 to 34 Year Olds | 0 (0.0%) | 0 (0.0%) |
| 35 Years and over | 0 (0.0%) | 0 (0.0%) |
| Total | 73 (100.0%) | 0 (0.0%) |
Educational Attainment by Field of Study in Porcupine
| Field of Study | # Graduates | % Graduates |
| Computers & Mathematics | 0 | 0.0% |
| Bio, Nature & Agricultural | 0 | 0.0% |
| Physical & Health Sciences | 0 | 0.0% |
| Psychology | 0 | 0.0% |
| Social Sciences | 0 | 0.0% |
| Engineering | 0 | 0.0% |
| Multidisciplinary Studies | 0 | 0.0% |
| Science & Technology | 0 | 0.0% |
| Business | 0 | 0.0% |
| Education | 0 | 0.0% |
| Literature & Languages | 0 | 0.0% |
| Liberal Arts & History | 0 | 0.0% |
| Visual & Performing Arts | 0 | 0.0% |
| Communications | 0 | 0.0% |
| Arts & Humanities | 0 | 0.0% |
| Total | 0 | 0.0% |
Transportation & Commute in Porcupine
Vehicle Availability by Sex in Porcupine
The most prevalent vehicle ownership categories in Porcupine are males with 3 vehicles (6, accounting for 30.0%) and females with 3 vehicles (0, making up 85.7%).
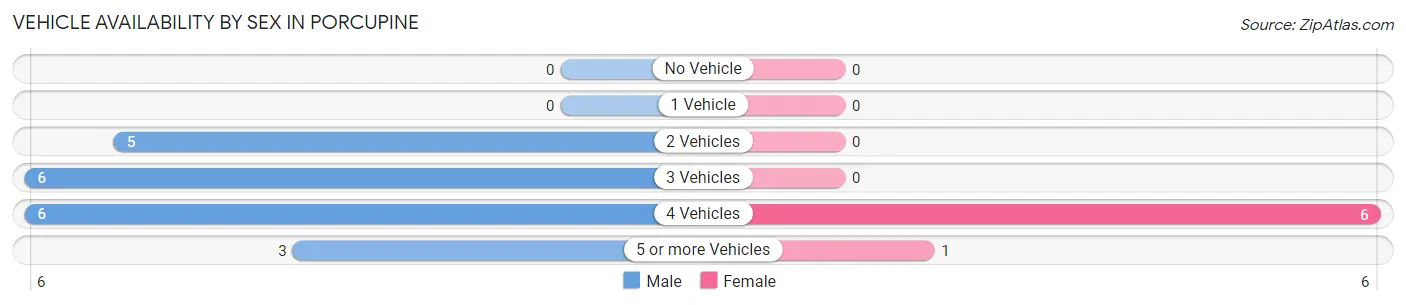
| Vehicles Available | Male | Female |
| No Vehicle | 0 (0.0%) | 0 (0.0%) |
| 1 Vehicle | 0 (0.0%) | 0 (0.0%) |
| 2 Vehicles | 5 (25.0%) | 0 (0.0%) |
| 3 Vehicles | 6 (30.0%) | 0 (0.0%) |
| 4 Vehicles | 6 (30.0%) | 6 (85.7%) |
| 5 or more Vehicles | 3 (15.0%) | 1 (14.3%) |
| Total | 20 (100.0%) | 7 (100.0%) |
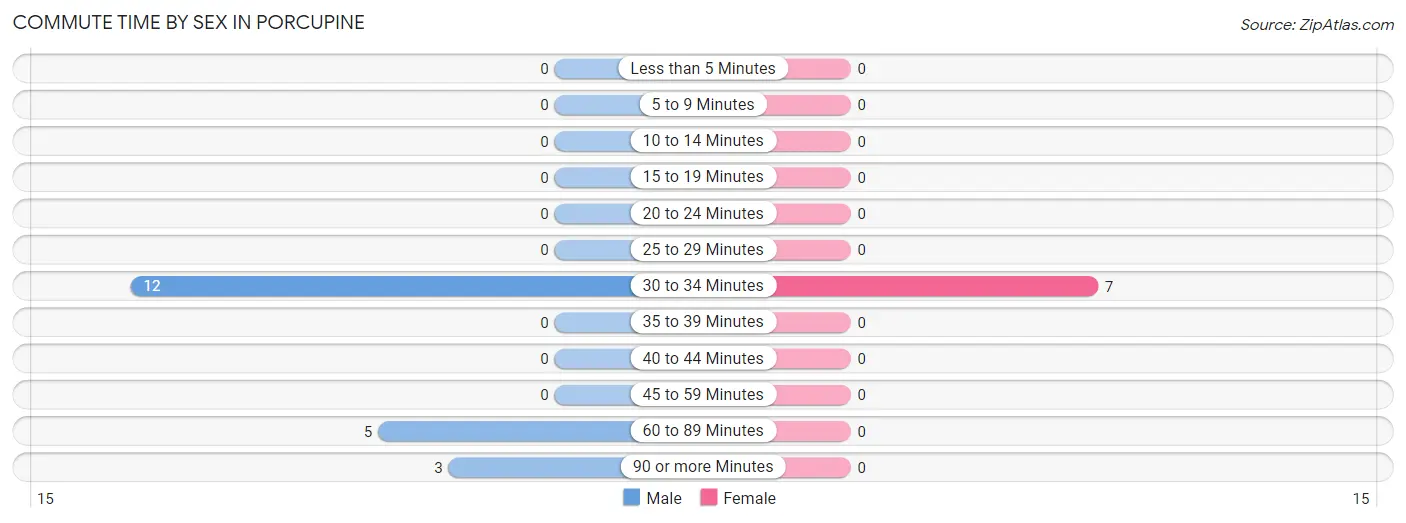
Commute Time in Porcupine
The most frequently occuring commute durations in Porcupine are 30 to 34 minutes (19 commuters, 70.4%), 60 to 89 minutes (5 commuters, 18.5%), and 90 or more minutes (3 commuters, 11.1%).
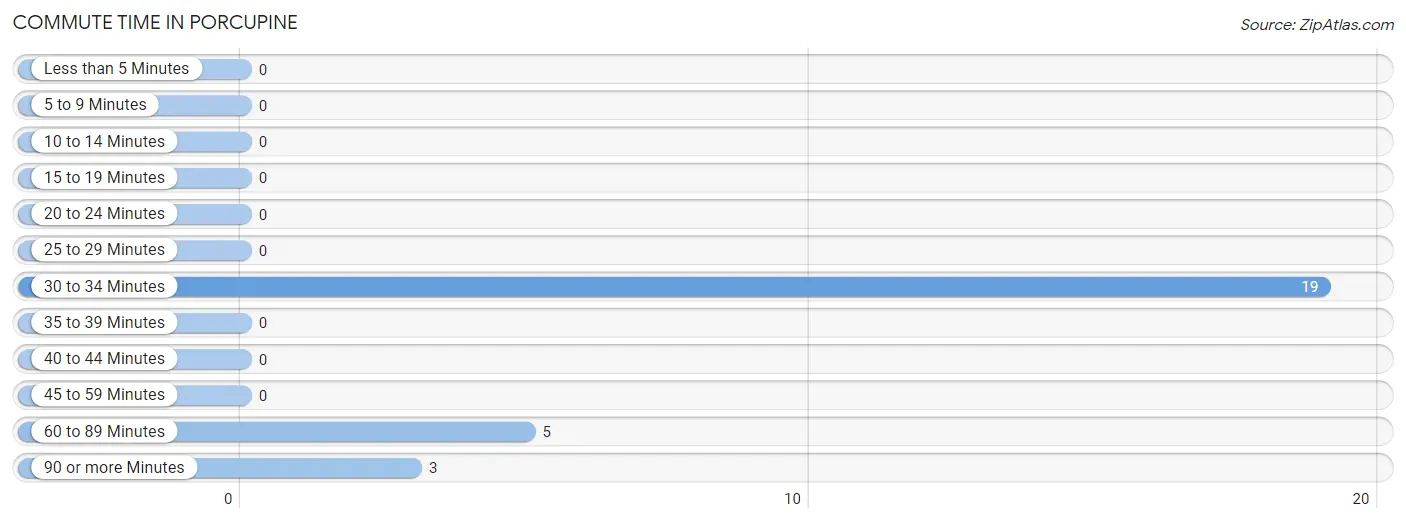
| Commute Time | # Commuters | % Commuters |
| Less than 5 Minutes | 0 | 0.0% |
| 5 to 9 Minutes | 0 | 0.0% |
| 10 to 14 Minutes | 0 | 0.0% |
| 15 to 19 Minutes | 0 | 0.0% |
| 20 to 24 Minutes | 0 | 0.0% |
| 25 to 29 Minutes | 0 | 0.0% |
| 30 to 34 Minutes | 19 | 70.4% |
| 35 to 39 Minutes | 0 | 0.0% |
| 40 to 44 Minutes | 0 | 0.0% |
| 45 to 59 Minutes | 0 | 0.0% |
| 60 to 89 Minutes | 5 | 18.5% |
| 90 or more Minutes | 3 | 11.1% |
Commute Time by Sex in Porcupine
The most common commute times in Porcupine are 30 to 34 minutes (12 commuters, 60.0%) for males and 30 to 34 minutes (7 commuters, 100.0%) for females.
| Commute Time | Male | Female |
| Less than 5 Minutes | 0 (0.0%) | 0 (0.0%) |
| 5 to 9 Minutes | 0 (0.0%) | 0 (0.0%) |
| 10 to 14 Minutes | 0 (0.0%) | 0 (0.0%) |
| 15 to 19 Minutes | 0 (0.0%) | 0 (0.0%) |
| 20 to 24 Minutes | 0 (0.0%) | 0 (0.0%) |
| 25 to 29 Minutes | 0 (0.0%) | 0 (0.0%) |
| 30 to 34 Minutes | 12 (60.0%) | 7 (100.0%) |
| 35 to 39 Minutes | 0 (0.0%) | 0 (0.0%) |
| 40 to 44 Minutes | 0 (0.0%) | 0 (0.0%) |
| 45 to 59 Minutes | 0 (0.0%) | 0 (0.0%) |
| 60 to 89 Minutes | 5 (25.0%) | 0 (0.0%) |
| 90 or more Minutes | 3 (15.0%) | 0 (0.0%) |
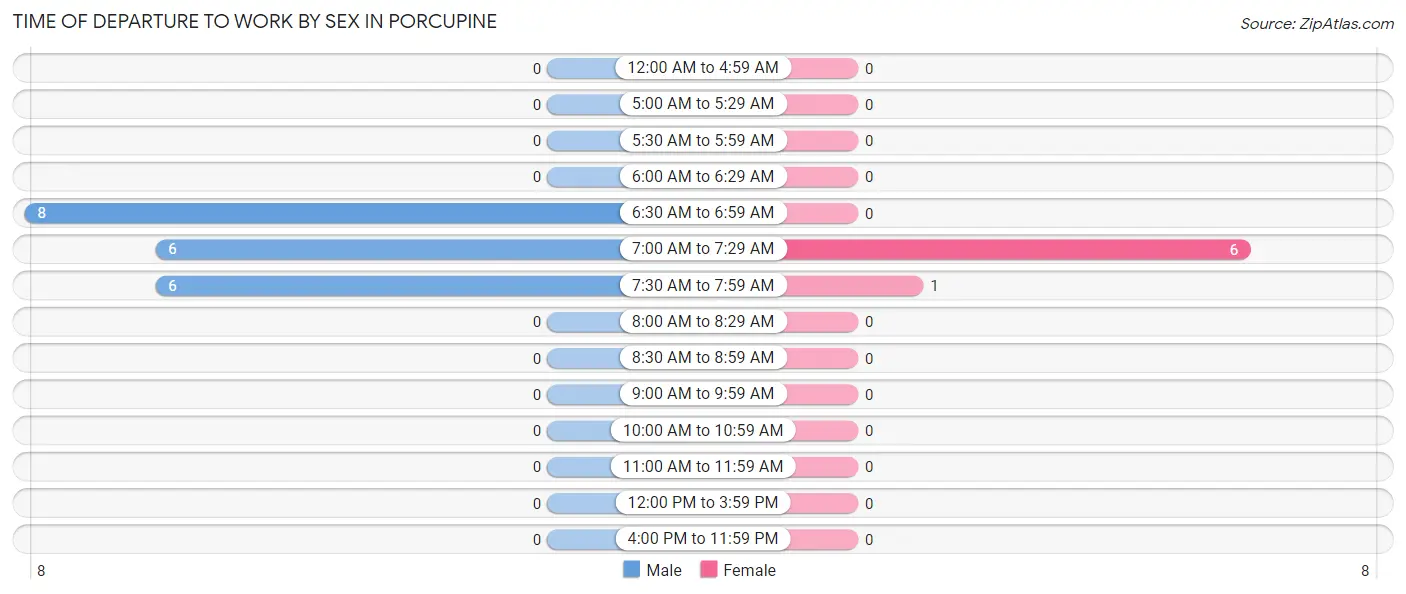
Time of Departure to Work by Sex in Porcupine
The most frequent times of departure to work in Porcupine are 6:30 AM to 6:59 AM (8, 40.0%) for males and 7:00 AM to 7:29 AM (6, 85.7%) for females.
| Time of Departure | Male | Female |
| 12:00 AM to 4:59 AM | 0 (0.0%) | 0 (0.0%) |
| 5:00 AM to 5:29 AM | 0 (0.0%) | 0 (0.0%) |
| 5:30 AM to 5:59 AM | 0 (0.0%) | 0 (0.0%) |
| 6:00 AM to 6:29 AM | 0 (0.0%) | 0 (0.0%) |
| 6:30 AM to 6:59 AM | 8 (40.0%) | 0 (0.0%) |
| 7:00 AM to 7:29 AM | 6 (30.0%) | 6 (85.7%) |
| 7:30 AM to 7:59 AM | 6 (30.0%) | 1 (14.3%) |
| 8:00 AM to 8:29 AM | 0 (0.0%) | 0 (0.0%) |
| 8:30 AM to 8:59 AM | 0 (0.0%) | 0 (0.0%) |
| 9:00 AM to 9:59 AM | 0 (0.0%) | 0 (0.0%) |
| 10:00 AM to 10:59 AM | 0 (0.0%) | 0 (0.0%) |
| 11:00 AM to 11:59 AM | 0 (0.0%) | 0 (0.0%) |
| 12:00 PM to 3:59 PM | 0 (0.0%) | 0 (0.0%) |
| 4:00 PM to 11:59 PM | 0 (0.0%) | 0 (0.0%) |
| Total | 20 (100.0%) | 7 (100.0%) |
Housing Occupancy in Porcupine
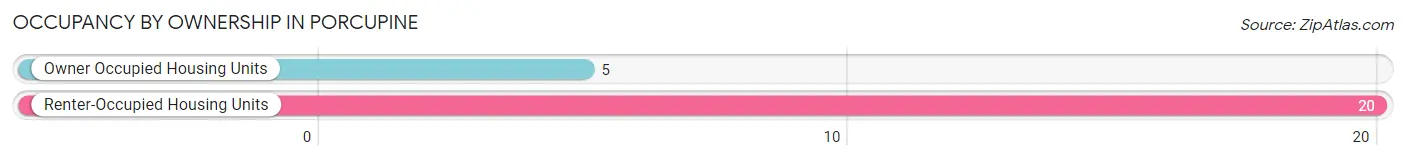
Occupancy by Ownership in Porcupine
Of the total 25 dwellings in Porcupine, owner-occupied units account for 5 (20.0%), while renter-occupied units make up 20 (80.0%).
| Occupancy | # Housing Units | % Housing Units |
| Owner Occupied Housing Units | 5 | 20.0% |
| Renter-Occupied Housing Units | 20 | 80.0% |
| Total Occupied Housing Units | 25 | 100.0% |
Occupancy by Household Size in Porcupine
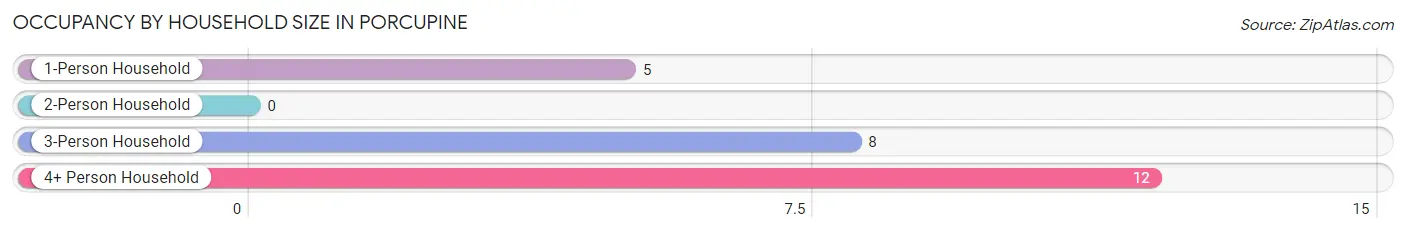
| Household Size | # Housing Units | % Housing Units |
| 1-Person Household | 5 | 20.0% |
| 2-Person Household | 0 | 0.0% |
| 3-Person Household | 8 | 32.0% |
| 4+ Person Household | 12 | 48.0% |
| Total Housing Units | 25 | 100.0% |
Occupancy by Ownership by Household Size in Porcupine
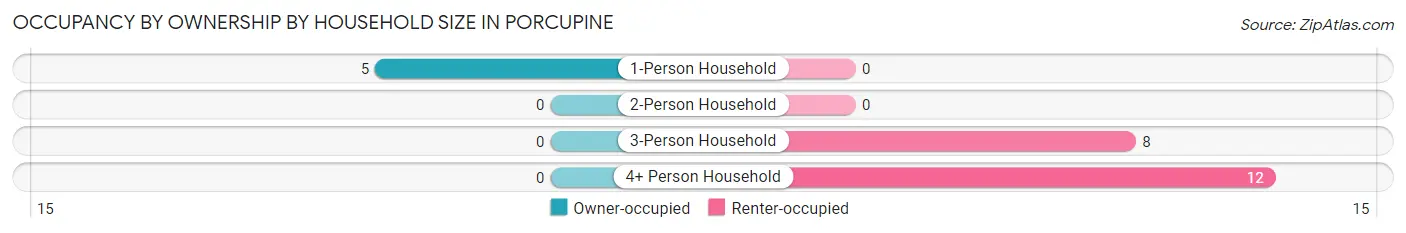
| Household Size | Owner-occupied | Renter-occupied |
| 1-Person Household | 5 (100.0%) | 0 (0.0%) |
| 2-Person Household | 0 (0.0%) | 0 (0.0%) |
| 3-Person Household | 0 (0.0%) | 8 (100.0%) |
| 4+ Person Household | 0 (0.0%) | 12 (100.0%) |
| Total Housing Units | 5 (20.0%) | 20 (80.0%) |
Occupancy by Educational Attainment in Porcupine
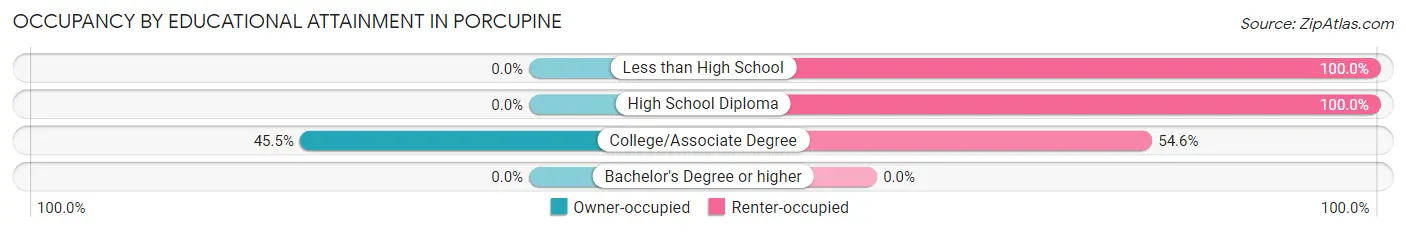
| Household Size | Owner-occupied | Renter-occupied |
| Less than High School | 0 (0.0%) | 3 (100.0%) |
| High School Diploma | 0 (0.0%) | 11 (100.0%) |
| College/Associate Degree | 5 (45.5%) | 6 (54.5%) |
| Bachelor's Degree or higher | 0 (0.0%) | 0 (0.0%) |
Occupancy by Age of Householder in Porcupine
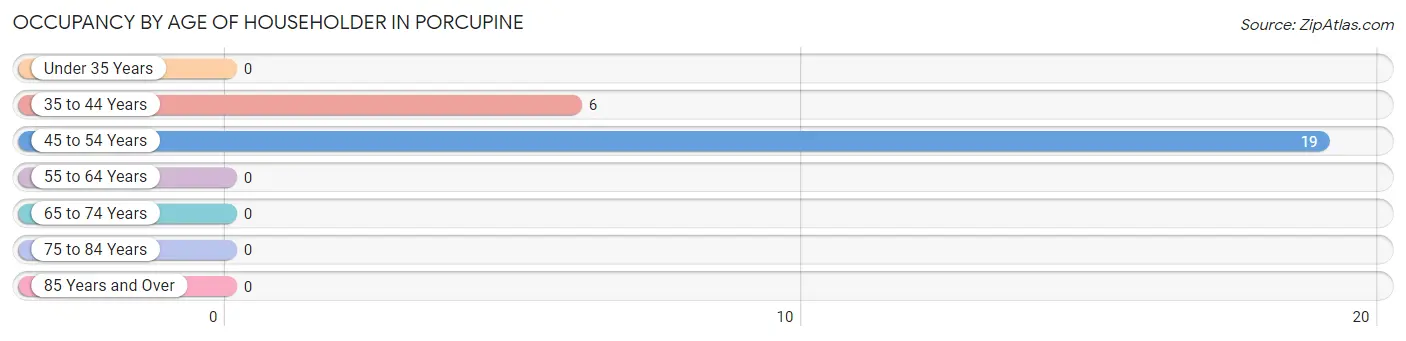
| Age Bracket | # Households | % Households |
| Under 35 Years | 0 | 0.0% |
| 35 to 44 Years | 6 | 24.0% |
| 45 to 54 Years | 19 | 76.0% |
| 55 to 64 Years | 0 | 0.0% |
| 65 to 74 Years | 0 | 0.0% |
| 75 to 84 Years | 0 | 0.0% |
| 85 Years and Over | 0 | 0.0% |
| Total | 25 | 100.0% |
Housing Finances in Porcupine
Median Income by Occupancy in Porcupine
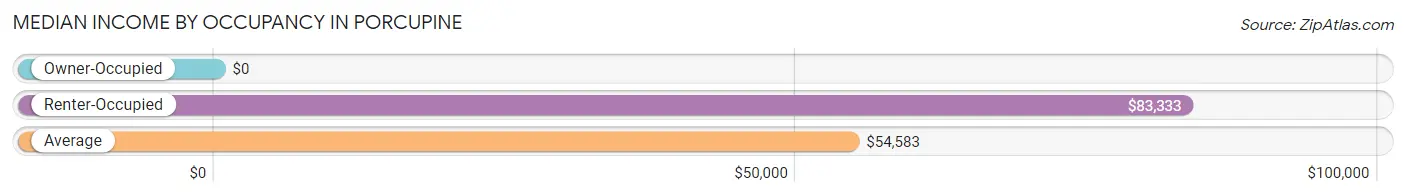
| Occupancy Type | # Households | Median Income |
| Owner-Occupied | 5 (20.0%) | $0 |
| Renter-Occupied | 20 (80.0%) | $83,333 |
| Average | 25 (100.0%) | $54,583 |
Occupancy by Householder Income Bracket in Porcupine
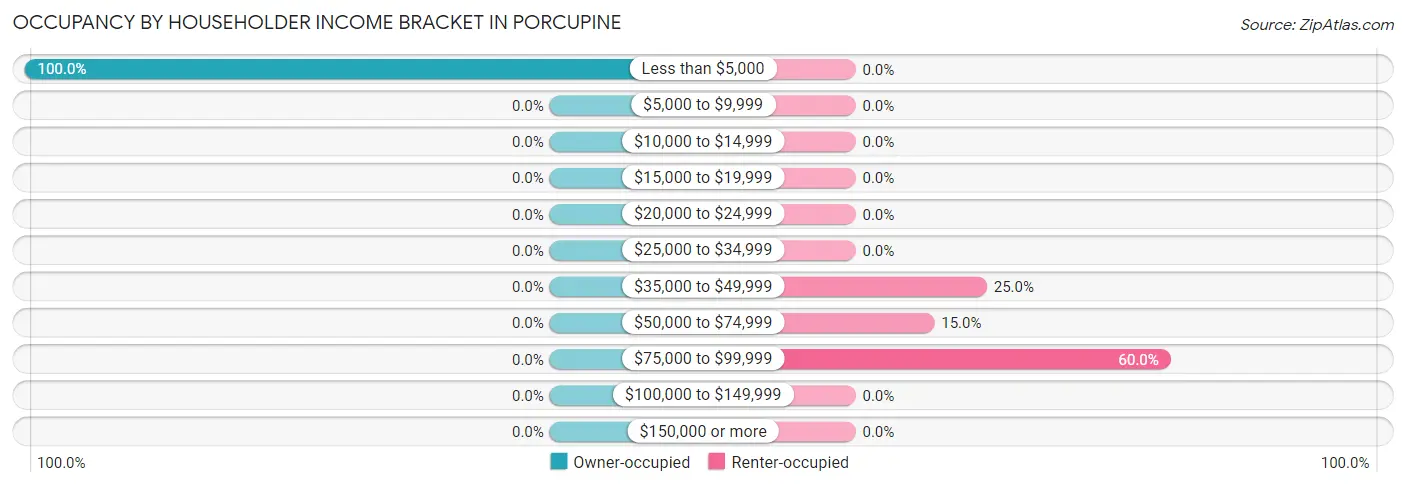
| Income Bracket | Owner-occupied | Renter-occupied |
| Less than $5,000 | 5 (100.0%) | 0 (0.0%) |
| $5,000 to $9,999 | 0 (0.0%) | 0 (0.0%) |
| $10,000 to $14,999 | 0 (0.0%) | 0 (0.0%) |
| $15,000 to $19,999 | 0 (0.0%) | 0 (0.0%) |
| $20,000 to $24,999 | 0 (0.0%) | 0 (0.0%) |
| $25,000 to $34,999 | 0 (0.0%) | 0 (0.0%) |
| $35,000 to $49,999 | 0 (0.0%) | 5 (25.0%) |
| $50,000 to $74,999 | 0 (0.0%) | 3 (15.0%) |
| $75,000 to $99,999 | 0 (0.0%) | 12 (60.0%) |
| $100,000 to $149,999 | 0 (0.0%) | 0 (0.0%) |
| $150,000 or more | 0 (0.0%) | 0 (0.0%) |
| Total | 5 (100.0%) | 20 (100.0%) |
Monthly Housing Cost Tiers in Porcupine
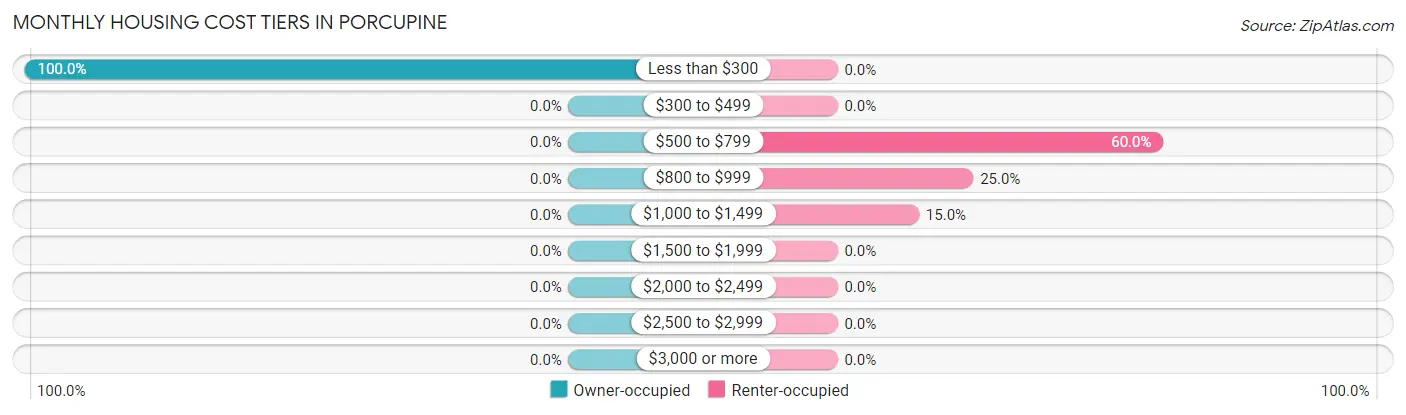
| Monthly Cost | Owner-occupied | Renter-occupied |
| Less than $300 | 5 (100.0%) | 0 (0.0%) |
| $300 to $499 | 0 (0.0%) | 0 (0.0%) |
| $500 to $799 | 0 (0.0%) | 12 (60.0%) |
| $800 to $999 | 0 (0.0%) | 5 (25.0%) |
| $1,000 to $1,499 | 0 (0.0%) | 3 (15.0%) |
| $1,500 to $1,999 | 0 (0.0%) | 0 (0.0%) |
| $2,000 to $2,499 | 0 (0.0%) | 0 (0.0%) |
| $2,500 to $2,999 | 0 (0.0%) | 0 (0.0%) |
| $3,000 or more | 0 (0.0%) | 0 (0.0%) |
| Total | 5 (100.0%) | 20 (100.0%) |
Physical Housing Characteristics in Porcupine
Housing Structures in Porcupine
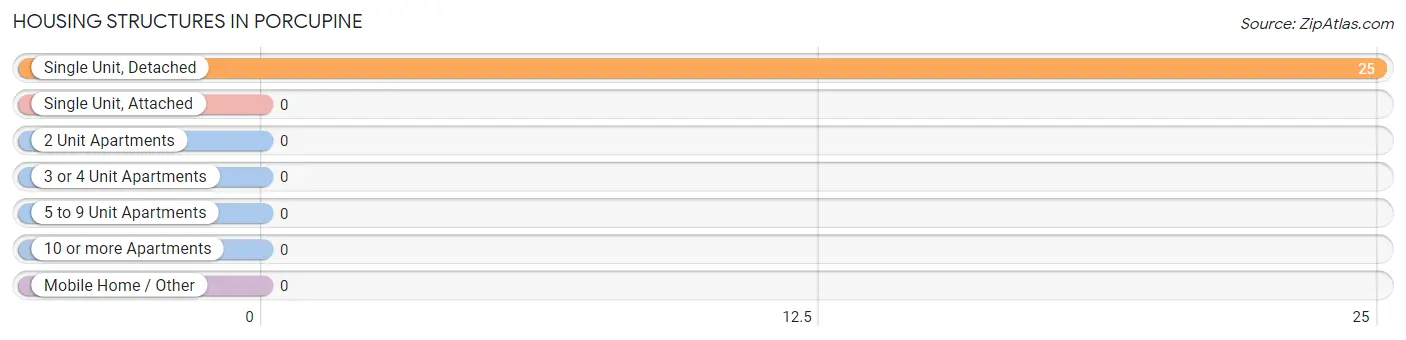
| Structure Type | # Housing Units | % Housing Units |
| Single Unit, Detached | 25 | 100.0% |
| Single Unit, Attached | 0 | 0.0% |
| 2 Unit Apartments | 0 | 0.0% |
| 3 or 4 Unit Apartments | 0 | 0.0% |
| 5 to 9 Unit Apartments | 0 | 0.0% |
| 10 or more Apartments | 0 | 0.0% |
| Mobile Home / Other | 0 | 0.0% |
| Total | 25 | 100.0% |
Housing Structures by Occupancy in Porcupine
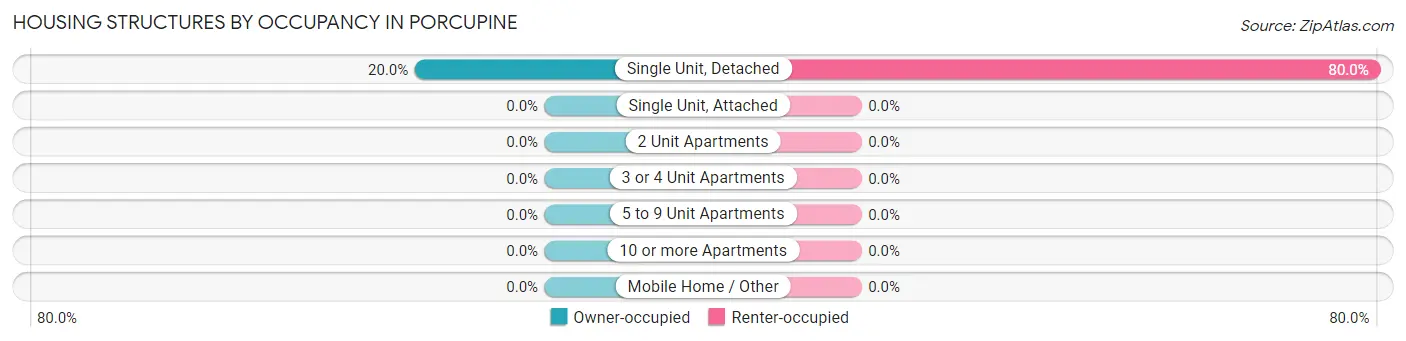
| Structure Type | Owner-occupied | Renter-occupied |
| Single Unit, Detached | 5 (20.0%) | 20 (80.0%) |
| Single Unit, Attached | 0 (0.0%) | 0 (0.0%) |
| 2 Unit Apartments | 0 (0.0%) | 0 (0.0%) |
| 3 or 4 Unit Apartments | 0 (0.0%) | 0 (0.0%) |
| 5 to 9 Unit Apartments | 0 (0.0%) | 0 (0.0%) |
| 10 or more Apartments | 0 (0.0%) | 0 (0.0%) |
| Mobile Home / Other | 0 (0.0%) | 0 (0.0%) |
| Total | 5 (20.0%) | 20 (80.0%) |
Housing Structures by Number of Rooms in Porcupine
| Number of Rooms | Owner-occupied | Renter-occupied |
| 1 Room | 0 (0.0%) | 0 (0.0%) |
| 2 or 3 Rooms | 0 (0.0%) | 0 (0.0%) |
| 4 or 5 Rooms | 5 (100.0%) | 6 (30.0%) |
| 6 or 7 Rooms | 0 (0.0%) | 14 (70.0%) |
| 8 or more Rooms | 0 (0.0%) | 0 (0.0%) |
| Total | 5 (100.0%) | 20 (100.0%) |
Housing Structure by Heating Type in Porcupine
| Heating Type | Owner-occupied | Renter-occupied |
| Utility Gas | 0 (0.0%) | 0 (0.0%) |
| Bottled, Tank, or LP Gas | 0 (0.0%) | 20 (100.0%) |
| Electricity | 5 (100.0%) | 0 (0.0%) |
| Fuel Oil or Kerosene | 0 (0.0%) | 0 (0.0%) |
| Coal or Coke | 0 (0.0%) | 0 (0.0%) |
| All other Fuels | 0 (0.0%) | 0 (0.0%) |
| No Fuel Used | 0 (0.0%) | 0 (0.0%) |
| Total | 5 (100.0%) | 20 (100.0%) |
Household Vehicle Usage in Porcupine
| Vehicles per Household | Owner-occupied | Renter-occupied |
| No Vehicle | 5 (100.0%) | 0 (0.0%) |
| 1 Vehicle | 0 (0.0%) | 0 (0.0%) |
| 2 Vehicles | 0 (0.0%) | 5 (25.0%) |
| 3 or more Vehicles | 0 (0.0%) | 15 (75.0%) |
| Total | 5 (100.0%) | 20 (100.0%) |
Real Estate & Mortgages in Porcupine
Real Estate and Mortgage Overview in Porcupine
| Characteristic | Without Mortgage | With Mortgage |
| Housing Units | 5 | 0 |
| Median Property Value | - | - |
| Median Household Income | - | - |
| Monthly Housing Costs | - | - |
| Real Estate Taxes | - | - |
Property Value by Mortgage Status in Porcupine
| Property Value | Without Mortgage | With Mortgage |
| Less than $50,000 | 5 (100.0%) | 0 (0.0%) |
| $50,000 to $99,999 | 0 (0.0%) | 0 (0.0%) |
| $100,000 to $299,999 | 0 (0.0%) | 0 (0.0%) |
| $300,000 to $499,999 | 0 (0.0%) | 0 (0.0%) |
| $500,000 to $749,999 | 0 (0.0%) | 0 (0.0%) |
| $750,000 to $999,999 | 0 (0.0%) | 0 (0.0%) |
| $1,000,000 or more | 0 (0.0%) | 0 (0.0%) |
| Total | 5 (100.0%) | 0 (0.0%) |
Household Income by Mortgage Status in Porcupine
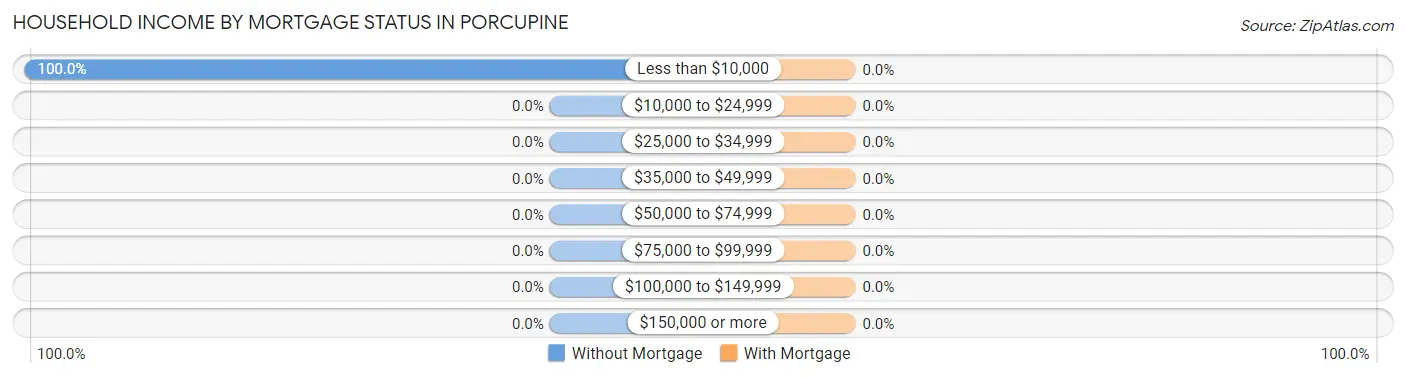
| Household Income | Without Mortgage | With Mortgage |
| Less than $10,000 | 5 (100.0%) | 0 (0.0%) |
| $10,000 to $24,999 | 0 (0.0%) | 0 (0.0%) |
| $25,000 to $34,999 | 0 (0.0%) | 0 (0.0%) |
| $35,000 to $49,999 | 0 (0.0%) | 0 (0.0%) |
| $50,000 to $74,999 | 0 (0.0%) | 0 (0.0%) |
| $75,000 to $99,999 | 0 (0.0%) | 0 (0.0%) |
| $100,000 to $149,999 | 0 (0.0%) | 0 (0.0%) |
| $150,000 or more | 0 (0.0%) | 0 (0.0%) |
| Total | 5 (100.0%) | 0 (0.0%) |
Property Value to Household Income Ratio in Porcupine
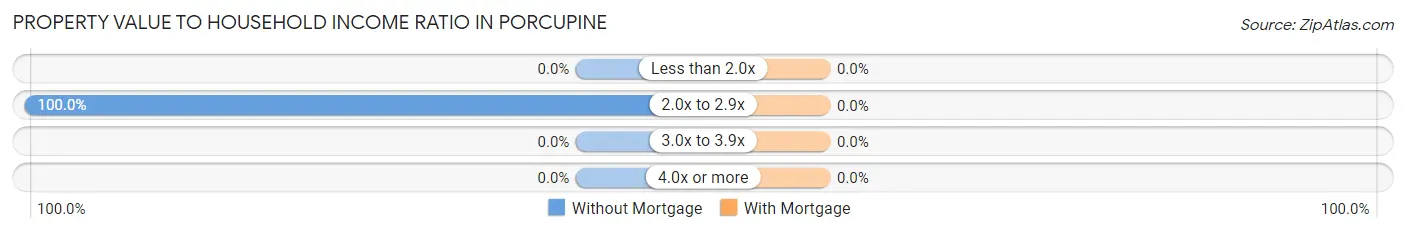
| Value-to-Income Ratio | Without Mortgage | With Mortgage |
| Less than 2.0x | 0 (0.0%) | 0 (0.0%) |
| 2.0x to 2.9x | 5 (100.0%) | 0 (0.0%) |
| 3.0x to 3.9x | 0 (0.0%) | 0 (0.0%) |
| 4.0x or more | 0 (0.0%) | 0 (0.0%) |
| Total | 5 (100.0%) | 0 (0.0%) |
Real Estate Taxes by Mortgage Status in Porcupine
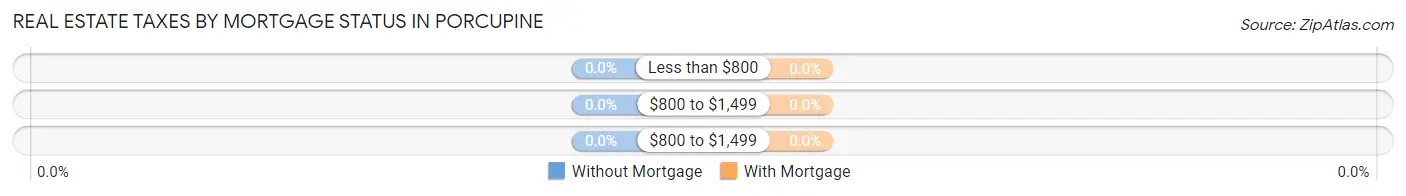
| Property Taxes | Without Mortgage | With Mortgage |
| Less than $800 | 0 (0.0%) | 0 (0.0%) |
| $800 to $1,499 | 0 (0.0%) | 0 (0.0%) |
| $800 to $1,499 | 0 (0.0%) | 0 (0.0%) |
| Total | 5 (100.0%) | 0 (0.0%) |
Health & Disability in Porcupine
Health Insurance Coverage by Age in Porcupine
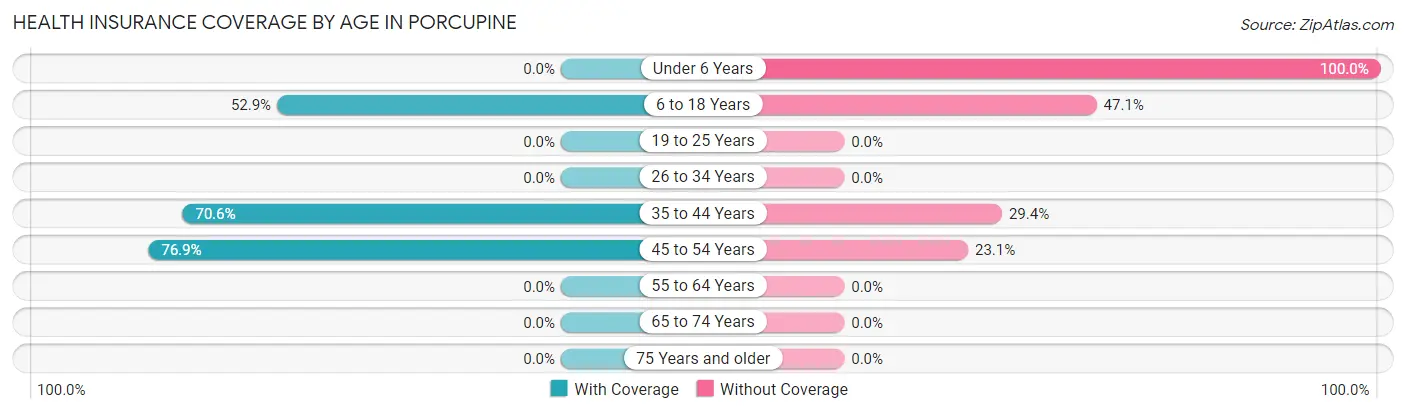
| Age Bracket | With Coverage | Without Coverage |
| Under 6 Years | 0 (0.0%) | 5 (100.0%) |
| 6 to 18 Years | 36 (52.9%) | 32 (47.1%) |
| 19 to 25 Years | 0 (0.0%) | 0 (0.0%) |
| 26 to 34 Years | 0 (0.0%) | 0 (0.0%) |
| 35 to 44 Years | 12 (70.6%) | 5 (29.4%) |
| 45 to 54 Years | 20 (76.9%) | 6 (23.1%) |
| 55 to 64 Years | 0 (0.0%) | 0 (0.0%) |
| 65 to 74 Years | 0 (0.0%) | 0 (0.0%) |
| 75 Years and older | 0 (0.0%) | 0 (0.0%) |
| Total | 68 (58.6%) | 48 (41.4%) |
Health Insurance Coverage by Citizenship Status in Porcupine
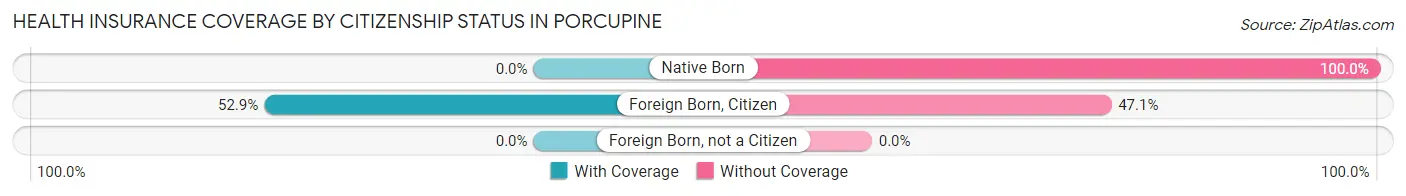
| Citizenship Status | With Coverage | Without Coverage |
| Native Born | 0 (0.0%) | 5 (100.0%) |
| Foreign Born, Citizen | 36 (52.9%) | 32 (47.1%) |
| Foreign Born, not a Citizen | 0 (0.0%) | 0 (0.0%) |
Health Insurance Coverage by Household Income in Porcupine
| Household Income | With Coverage | Without Coverage |
| Under $25,000 | 5 (100.0%) | 0 (0.0%) |
| $25,000 to $49,999 | 10 (62.5%) | 6 (37.5%) |
| $50,000 to $74,999 | 6 (100.0%) | 0 (0.0%) |
| $75,000 to $99,999 | 47 (52.8%) | 42 (47.2%) |
| $100,000 and over | 0 (0.0%) | 0 (0.0%) |
Public vs Private Health Insurance Coverage by Age in Porcupine
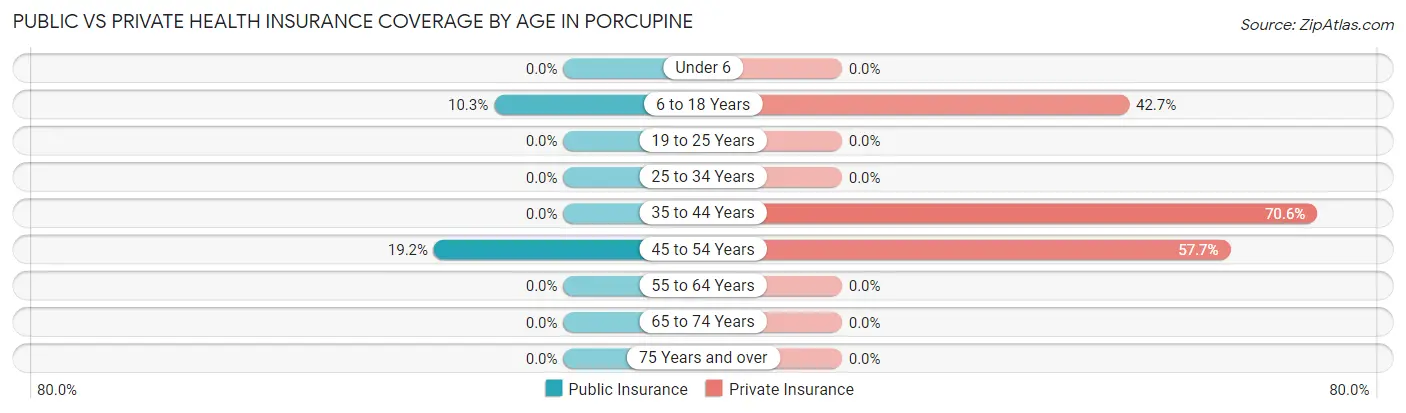
| Age Bracket | Public Insurance | Private Insurance |
| Under 6 | 0 (0.0%) | 0 (0.0%) |
| 6 to 18 Years | 7 (10.3%) | 29 (42.6%) |
| 19 to 25 Years | 0 (0.0%) | 0 (0.0%) |
| 25 to 34 Years | 0 (0.0%) | 0 (0.0%) |
| 35 to 44 Years | 0 (0.0%) | 12 (70.6%) |
| 45 to 54 Years | 5 (19.2%) | 15 (57.7%) |
| 55 to 64 Years | 0 (0.0%) | 0 (0.0%) |
| 65 to 74 Years | 0 (0.0%) | 0 (0.0%) |
| 75 Years and over | 0 (0.0%) | 0 (0.0%) |
| Total | 12 (10.3%) | 56 (48.3%) |
Disability Status by Sex by Age in Porcupine
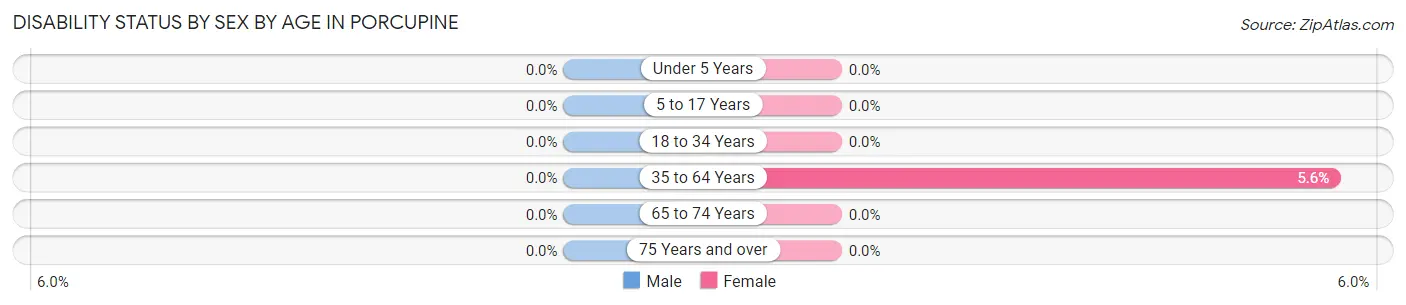
| Age Bracket | Male | Female |
| Under 5 Years | 0 (0.0%) | 0 (0.0%) |
| 5 to 17 Years | 0 (0.0%) | 0 (0.0%) |
| 18 to 34 Years | 0 (0.0%) | 0 (0.0%) |
| 35 to 64 Years | 0 (0.0%) | 1 (5.6%) |
| 65 to 74 Years | 0 (0.0%) | 0 (0.0%) |
| 75 Years and over | 0 (0.0%) | 0 (0.0%) |
Disability Class by Sex by Age in Porcupine
Disability Class: Hearing Difficulty
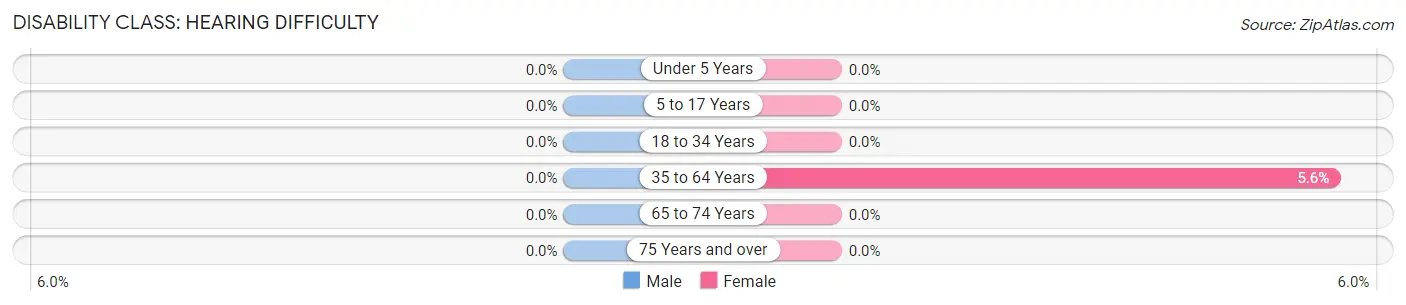
| Age Bracket | Male | Female |
| Under 5 Years | 0 (0.0%) | 0 (0.0%) |
| 5 to 17 Years | 0 (0.0%) | 0 (0.0%) |
| 18 to 34 Years | 0 (0.0%) | 0 (0.0%) |
| 35 to 64 Years | 0 (0.0%) | 1 (5.6%) |
| 65 to 74 Years | 0 (0.0%) | 0 (0.0%) |
| 75 Years and over | 0 (0.0%) | 0 (0.0%) |
Disability Class: Vision Difficulty
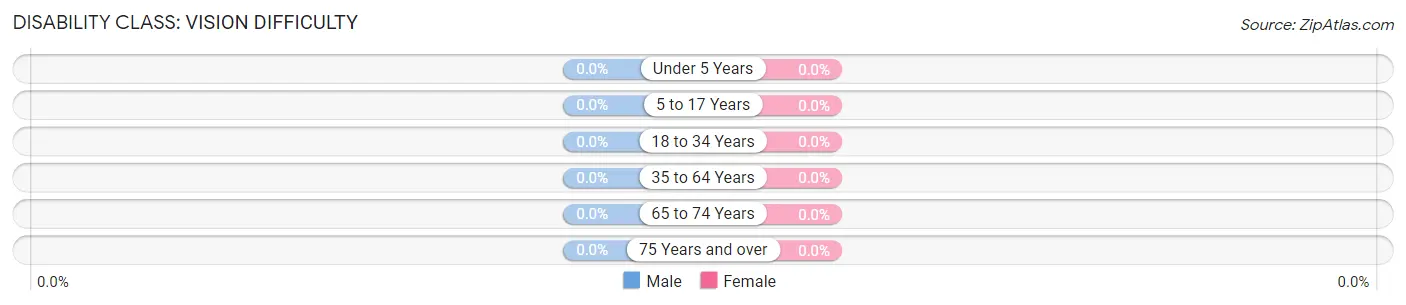
| Age Bracket | Male | Female |
| Under 5 Years | 0 (0.0%) | 0 (0.0%) |
| 5 to 17 Years | 0 (0.0%) | 0 (0.0%) |
| 18 to 34 Years | 0 (0.0%) | 0 (0.0%) |
| 35 to 64 Years | 0 (0.0%) | 0 (0.0%) |
| 65 to 74 Years | 0 (0.0%) | 0 (0.0%) |
| 75 Years and over | 0 (0.0%) | 0 (0.0%) |
Disability Class: Cognitive Difficulty

| Age Bracket | Male | Female |
| 5 to 17 Years | 0 (0.0%) | 0 (0.0%) |
| 18 to 34 Years | 0 (0.0%) | 0 (0.0%) |
| 35 to 64 Years | 0 (0.0%) | 0 (0.0%) |
| 65 to 74 Years | 0 (0.0%) | 0 (0.0%) |
| 75 Years and over | 0 (0.0%) | 0 (0.0%) |
Disability Class: Ambulatory Difficulty
| Age Bracket | Male | Female |
| 5 to 17 Years | 0 (0.0%) | 0 (0.0%) |
| 18 to 34 Years | 0 (0.0%) | 0 (0.0%) |
| 35 to 64 Years | 0 (0.0%) | 0 (0.0%) |
| 65 to 74 Years | 0 (0.0%) | 0 (0.0%) |
| 75 Years and over | 0 (0.0%) | 0 (0.0%) |
Disability Class: Self-Care Difficulty
| Age Bracket | Male | Female |
| 5 to 17 Years | 0 (0.0%) | 0 (0.0%) |
| 18 to 34 Years | 0 (0.0%) | 0 (0.0%) |
| 35 to 64 Years | 0 (0.0%) | 0 (0.0%) |
| 65 to 74 Years | 0 (0.0%) | 0 (0.0%) |
| 75 Years and over | 0 (0.0%) | 0 (0.0%) |
Technology Access in Porcupine
Computing Device Access in Porcupine
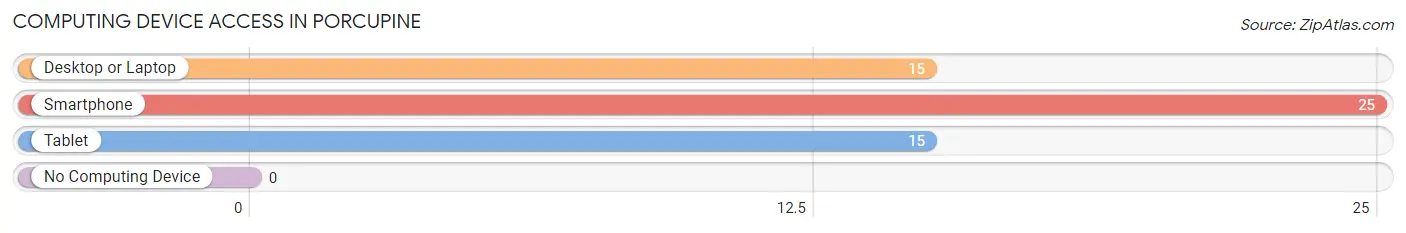
| Device Type | # Households | % Households |
| Desktop or Laptop | 15 | 60.0% |
| Smartphone | 25 | 100.0% |
| Tablet | 15 | 60.0% |
| No Computing Device | 0 | 0.0% |
| Total | 25 | 100.0% |
Internet Access in Porcupine
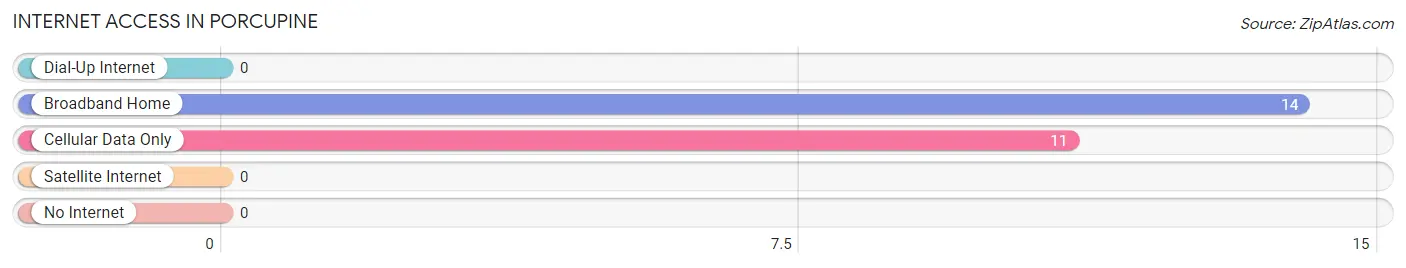
| Internet Type | # Households | % Households |
| Dial-Up Internet | 0 | 0.0% |
| Broadband Home | 14 | 56.0% |
| Cellular Data Only | 11 | 44.0% |
| Satellite Internet | 0 | 0.0% |
| No Internet | 0 | 0.0% |
| Total | 25 | 100.0% |
Porcupine Summary
Porcupine, North Dakota is a small town located in the southwestern corner of the state. It is situated in the heart of the Missouri Coteau, a region of rolling hills and prairie grasslands. The town was founded in 1882 and has a population of approximately 200 people.
Geography
Porcupine is located in the southwestern corner of North Dakota, in the heart of the Missouri Coteau. The town is situated on the banks of the Little Missouri River, which flows through the area. The town is surrounded by rolling hills and prairie grasslands, and is home to a variety of wildlife, including deer, antelope, and coyotes. The area is also known for its abundance of wildflowers, which bloom in the spring and summer months.
Economy
The economy of Porcupine is largely based on agriculture. The town is home to several farms, which produce a variety of crops, including wheat, corn, and soybeans. The town also has a small manufacturing sector, which produces a variety of products, including furniture and clothing.
Demographics
As of the 2010 census, the population of Porcupine was 200 people. The town is predominantly white, with a small minority population of Native Americans. The median household income in Porcupine is $37,500, and the median age is 44.
History
Porcupine was founded in 1882 by a group of settlers from Minnesota. The town was named after the porcupine, which was a common sight in the area. The town quickly grew, and by the early 1900s, it had become a bustling community. The town was home to several businesses, including a general store, a blacksmith, and a hotel.
In the early 1900s, the town was also home to a large population of Native Americans. The town was a popular trading post for the Sioux, who would come to trade goods and services. The town was also home to a large population of immigrants, who came to the area to work in the mines and on the farms.
In the late 1900s, the town began to decline. The mines closed, and the population began to dwindle. Today, Porcupine is a small, quiet town, with a population of approximately 200 people. The town is still home to a few businesses, including a general store and a hotel.
Conclusion
Porcupine, North Dakota is a small town located in the southwestern corner of the state. It is situated in the heart of the Missouri Coteau, a region of rolling hills and prairie grasslands. The town was founded in 1882 and has a population of approximately 200 people. The economy of Porcupine is largely based on agriculture, and the town is home to a variety of businesses, including a general store and a hotel. The town is predominantly white, with a small minority population of Native Americans. Porcupine is a small, quiet town, with a population of approximately 200 people.
Common Questions
What is Per Capita Income in Porcupine?
Per Capita income in Porcupine is $11,586.
What is the Median Family Income in Porcupine?
Median Family Income in Porcupine is $73,333.
What is the Median Household income in Porcupine?
Median Household Income in Porcupine is $54,583.
What is Income or Wage Gap in Porcupine?
Income or Wage Gap in Porcupine is 9.5%.
Women in Porcupine earn 90.5 cents for every dollar earned by a man.
What is Inequality or Gini Index in Porcupine?
Inequality or Gini Index in Porcupine is 0.29.
What is the Total Population of Porcupine?
Total Population of Porcupine is 116.
What is the Total Male Population of Porcupine?
Total Male Population of Porcupine is 56.
What is the Total Female Population of Porcupine?
Total Female Population of Porcupine is 60.
What is the Ratio of Males per 100 Females in Porcupine?
There are 93.33 Males per 100 Females in Porcupine.
What is the Ratio of Females per 100 Males in Porcupine?
There are 107.14 Females per 100 Males in Porcupine.
What is the Median Population Age in Porcupine?
Median Population Age in Porcupine is 17.0 Years.
What is the Average Family Size in Porcupine
Average Family Size in Porcupine is 5.0 People.
What is the Average Household Size in Porcupine
Average Household Size in Porcupine is 4.6 People.
How Large is the Labor Force in Porcupine?
There are 37 People in the Labor Forcein in Porcupine.
What is the Percentage of People in the Labor Force in Porcupine?
52.1% of People are in the Labor Force in Porcupine.
What is the Unemployment Rate in Porcupine?
Unemployment Rate in Porcupine is 27.0%.