Fall River Mills, CA Map & Demographics
Fall River Mills Map
Fall River Mills Overview
$20,668
PER CAPITA INCOME
0.37
INEQUALITY / GINI INDEX
678
TOTAL POPULATION
331
MALE POPULATION
347
FEMALE POPULATION
95.39
MALES / 100 FEMALES
104.83
FEMALES / 100 MALES
27.7
MEDIAN AGE
3.3
AVG FAMILY SIZE
2.7
AVG HOUSEHOLD SIZE
242
LABOR FORCE [ PEOPLE ]
48.2%
PERCENT IN LABOR FORCE
25.1%
UNEMPLOYMENT RATE
Fall River Mills Zip Codes
Fall River Mills Area Codes
Income in Fall River Mills
Income Overview in Fall River Mills
| Characteristic | Number | Measure |
| Per Capita Income | 678 | $20,668 |
| Median Family Income | 170 | $0 |
| Mean Family Income | 170 | $81,876 |
| Median Household Income | 227 | $0 |
| Mean Household Income | 227 | $68,254 |
| Income Deficit | 170 | $0 |
| Wage / Income Gap (%) | 678 | 0.00% |
| Wage / Income Gap ($) | 678 | 100.00¢ per $1 |
| Gini / Inequality Index | 678 | 0.37 |
Earnings by Sex in Fall River Mills
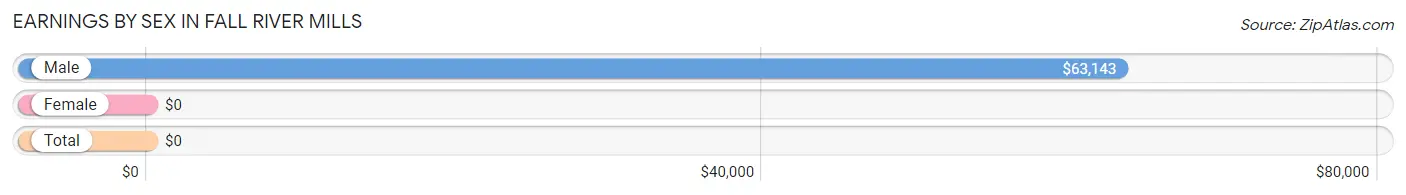
| Sex | Number | Average Earnings |
| Male | 101 (41.7%) | $63,143 |
| Female | 141 (58.3%) | $0 |
| Total | 242 (100.0%) | $0 |
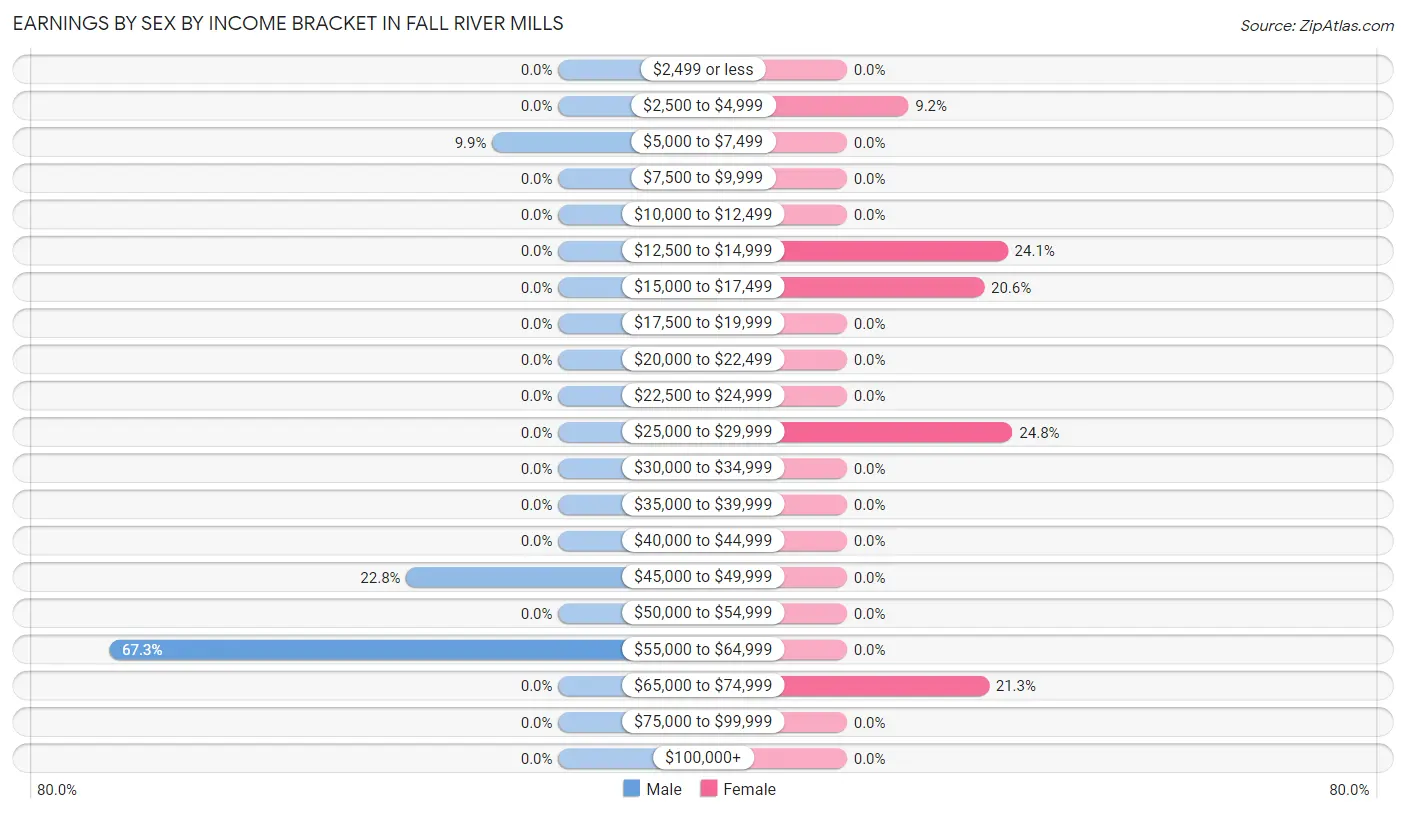
Earnings by Sex by Income Bracket in Fall River Mills
The most common earnings brackets in Fall River Mills are $55,000 to $64,999 for men (68 | 67.3%) and $25,000 to $29,999 for women (35 | 24.8%).
| Income | Male | Female |
| $2,499 or less | 0 (0.0%) | 0 (0.0%) |
| $2,500 to $4,999 | 0 (0.0%) | 13 (9.2%) |
| $5,000 to $7,499 | 10 (9.9%) | 0 (0.0%) |
| $7,500 to $9,999 | 0 (0.0%) | 0 (0.0%) |
| $10,000 to $12,499 | 0 (0.0%) | 0 (0.0%) |
| $12,500 to $14,999 | 0 (0.0%) | 34 (24.1%) |
| $15,000 to $17,499 | 0 (0.0%) | 29 (20.6%) |
| $17,500 to $19,999 | 0 (0.0%) | 0 (0.0%) |
| $20,000 to $22,499 | 0 (0.0%) | 0 (0.0%) |
| $22,500 to $24,999 | 0 (0.0%) | 0 (0.0%) |
| $25,000 to $29,999 | 0 (0.0%) | 35 (24.8%) |
| $30,000 to $34,999 | 0 (0.0%) | 0 (0.0%) |
| $35,000 to $39,999 | 0 (0.0%) | 0 (0.0%) |
| $40,000 to $44,999 | 0 (0.0%) | 0 (0.0%) |
| $45,000 to $49,999 | 23 (22.8%) | 0 (0.0%) |
| $50,000 to $54,999 | 0 (0.0%) | 0 (0.0%) |
| $55,000 to $64,999 | 68 (67.3%) | 0 (0.0%) |
| $65,000 to $74,999 | 0 (0.0%) | 30 (21.3%) |
| $75,000 to $99,999 | 0 (0.0%) | 0 (0.0%) |
| $100,000+ | 0 (0.0%) | 0 (0.0%) |
| Total | 101 (100.0%) | 141 (100.0%) |
Earnings by Sex by Educational Attainment in Fall River Mills
| Educational Attainment | Male Income | Female Income |
| Less than High School | - | - |
| High School Diploma | - | - |
| College or Associate's Degree | - | - |
| Bachelor's Degree | - | - |
| Graduate Degree | - | - |
| Total | - | - |
Family Income in Fall River Mills
Family Income Brackets in Fall River Mills
According to the Fall River Mills family income data, there are 68 families falling into the $100,000 to $149,999 income range, which is the most common income bracket and makes up 40.0% of all families.
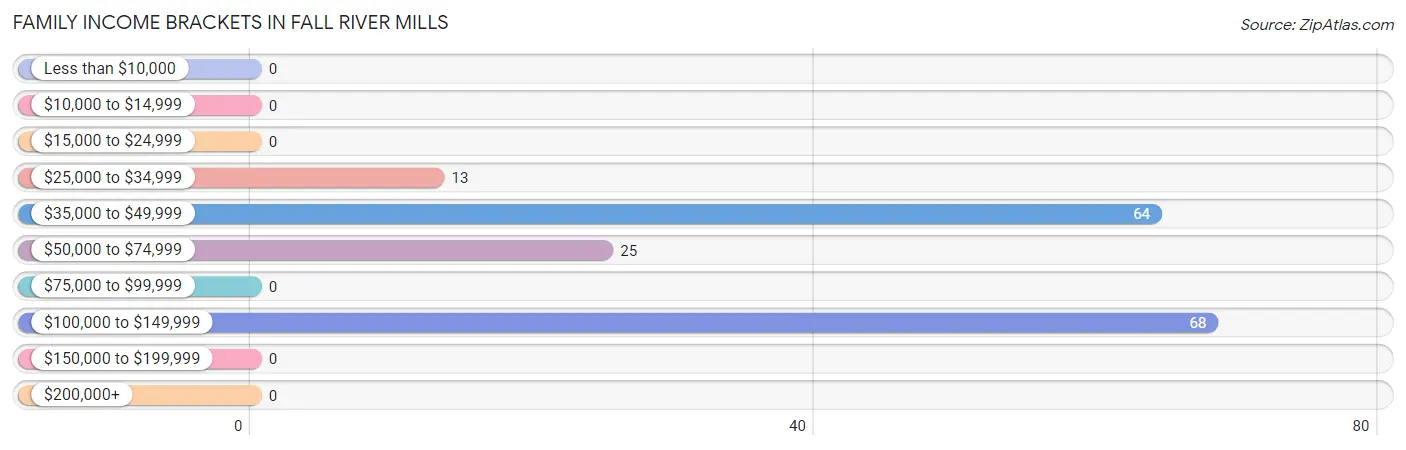
| Income Bracket | # Families | % Families |
| Less than $10,000 | 0 | 0.0% |
| $10,000 to $14,999 | 0 | 0.0% |
| $15,000 to $24,999 | 0 | 0.0% |
| $25,000 to $34,999 | 13 | 7.6% |
| $35,000 to $49,999 | 64 | 37.6% |
| $50,000 to $74,999 | 25 | 14.7% |
| $75,000 to $99,999 | 0 | 0.0% |
| $100,000 to $149,999 | 68 | 40.0% |
| $150,000 to $199,999 | 0 | 0.0% |
| $200,000+ | 0 | 0.0% |
Family Income by Famaliy Size in Fall River Mills
3-person families (77 | 45.3%) account for the highest median family income in Fall River Mills with $40,996 per family, while 3-person families (77 | 45.3%) have the highest median income of $13,665 per family member.
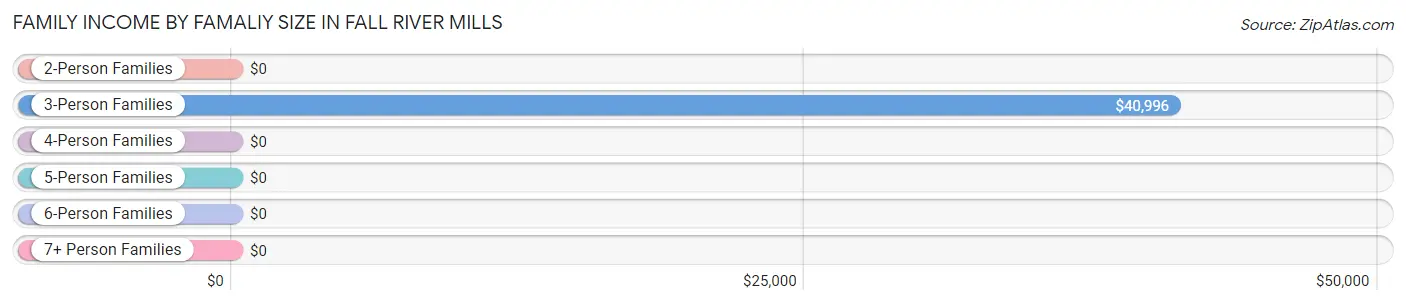
| Income Bracket | # Families | Median Income |
| 2-Person Families | 25 (14.7%) | $0 |
| 3-Person Families | 77 (45.3%) | $40,996 |
| 4-Person Families | 68 (40.0%) | $0 |
| 5-Person Families | 0 (0.0%) | $0 |
| 6-Person Families | 0 (0.0%) | $0 |
| 7+ Person Families | 0 (0.0%) | $0 |
| Total | 170 (100.0%) | $0 |
Family Income by Number of Earners in Fall River Mills
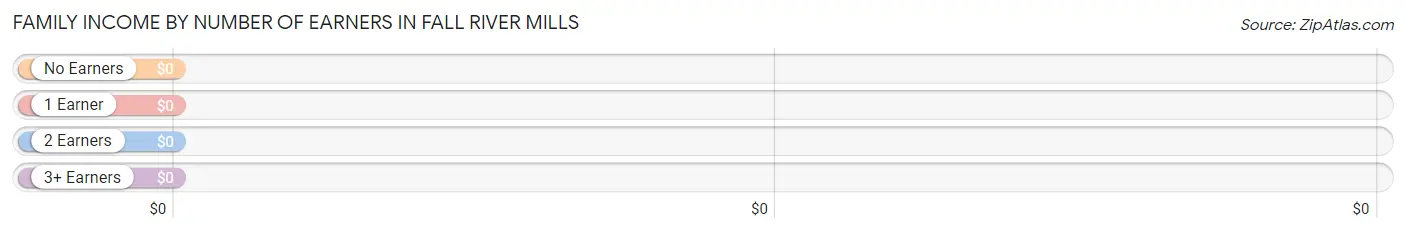
| Number of Earners | # Families | Median Income |
| No Earners | 25 (14.7%) | $0 |
| 1 Earner | 29 (17.1%) | $0 |
| 2 Earners | 116 (68.2%) | $0 |
| 3+ Earners | 0 (0.0%) | $0 |
| Total | 170 (100.0%) | $0 |
Household Income in Fall River Mills
Household Income Brackets in Fall River Mills
With 87 households falling in the category, the $35,000 to $49,999 income range is the most frequent in Fall River Mills, accounting for 38.3% of all households.
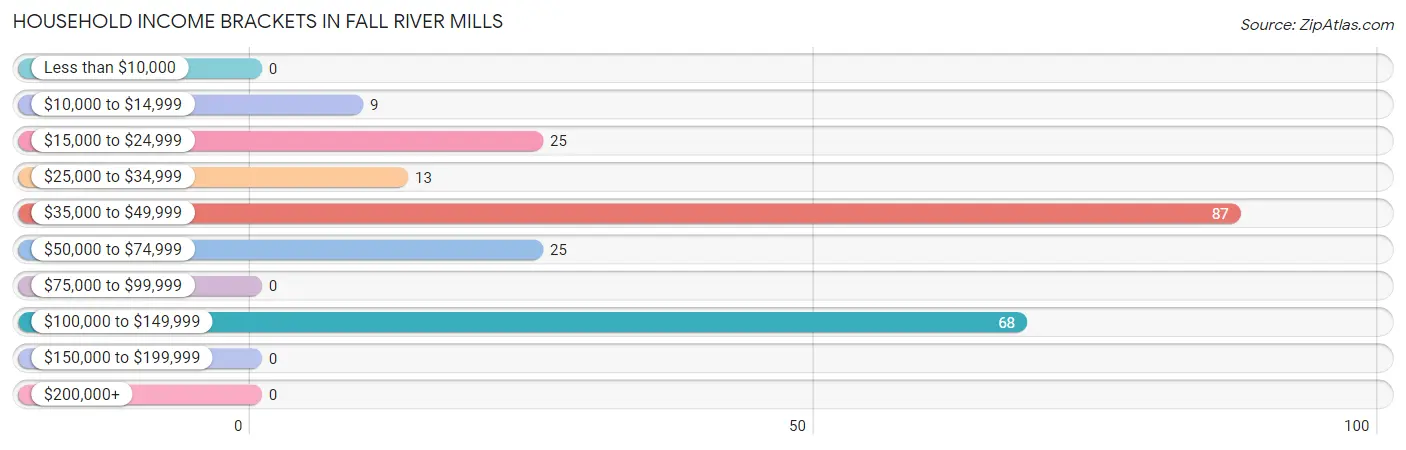
| Income Bracket | # Households | % Households |
| Less than $10,000 | 0 | 0.0% |
| $10,000 to $14,999 | 9 | 4.0% |
| $15,000 to $24,999 | 25 | 11.0% |
| $25,000 to $34,999 | 13 | 5.7% |
| $35,000 to $49,999 | 87 | 38.3% |
| $50,000 to $74,999 | 25 | 11.0% |
| $75,000 to $99,999 | 0 | 0.0% |
| $100,000 to $149,999 | 68 | 30.0% |
| $150,000 to $199,999 | 0 | 0.0% |
| $200,000+ | 0 | 0.0% |
Household Income by Householder Age in Fall River Mills
The median household income in Fall River Mills is $0, with the highest median household income of $16,450 found in the 45 to 64 years age bracket for the primary householder. A total of 47 households (20.7%) fall into this category.
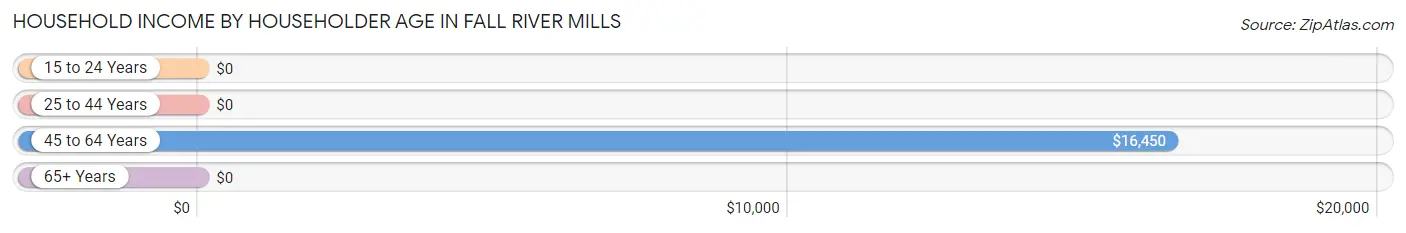
| Income Bracket | # Households | Median Income |
| 15 to 24 Years | 0 (0.0%) | $0 |
| 25 to 44 Years | 132 (58.2%) | $0 |
| 45 to 64 Years | 47 (20.7%) | $16,450 |
| 65+ Years | 48 (21.1%) | $0 |
| Total | 227 (100.0%) | $0 |
Poverty in Fall River Mills
Income Below Poverty by Sex and Age in Fall River Mills
With 2.6% poverty level for males and 4.9% for females among the residents of Fall River Mills, 25 to 34 year old males and 18 to 24 year old females are the most vulnerable to poverty, with 8 males (100.0%) and 7 females (100.0%) in their respective age groups living below the poverty level.
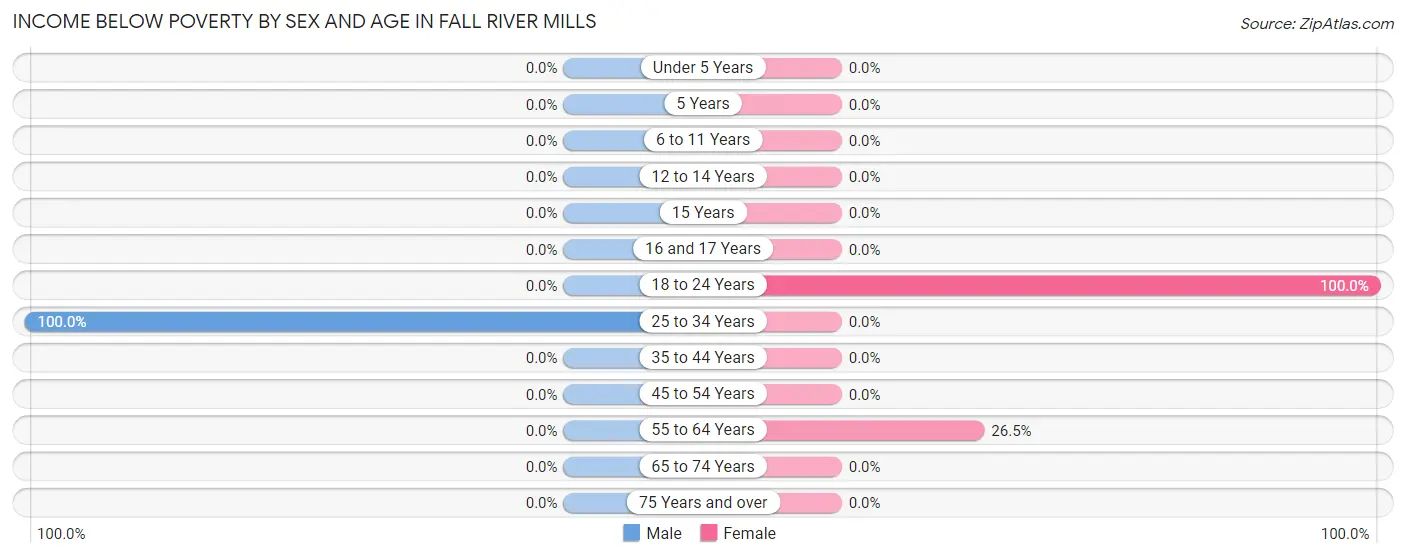
| Age Bracket | Male | Female |
| Under 5 Years | 0 (0.0%) | 0 (0.0%) |
| 5 Years | 0 (0.0%) | 0 (0.0%) |
| 6 to 11 Years | 0 (0.0%) | 0 (0.0%) |
| 12 to 14 Years | 0 (0.0%) | 0 (0.0%) |
| 15 Years | 0 (0.0%) | 0 (0.0%) |
| 16 and 17 Years | 0 (0.0%) | 0 (0.0%) |
| 18 to 24 Years | 0 (0.0%) | 7 (100.0%) |
| 25 to 34 Years | 8 (100.0%) | 0 (0.0%) |
| 35 to 44 Years | 0 (0.0%) | 0 (0.0%) |
| 45 to 54 Years | 0 (0.0%) | 0 (0.0%) |
| 55 to 64 Years | 0 (0.0%) | 9 (26.5%) |
| 65 to 74 Years | 0 (0.0%) | 0 (0.0%) |
| 75 Years and over | 0 (0.0%) | 0 (0.0%) |
| Total | 8 (2.6%) | 16 (4.9%) |
Income Above Poverty by Sex and Age in Fall River Mills
According to the poverty statistics in Fall River Mills, males aged under 5 years and females aged under 5 years are the age groups that are most secure financially, with 100.0% of males and 100.0% of females in these age groups living above the poverty line.
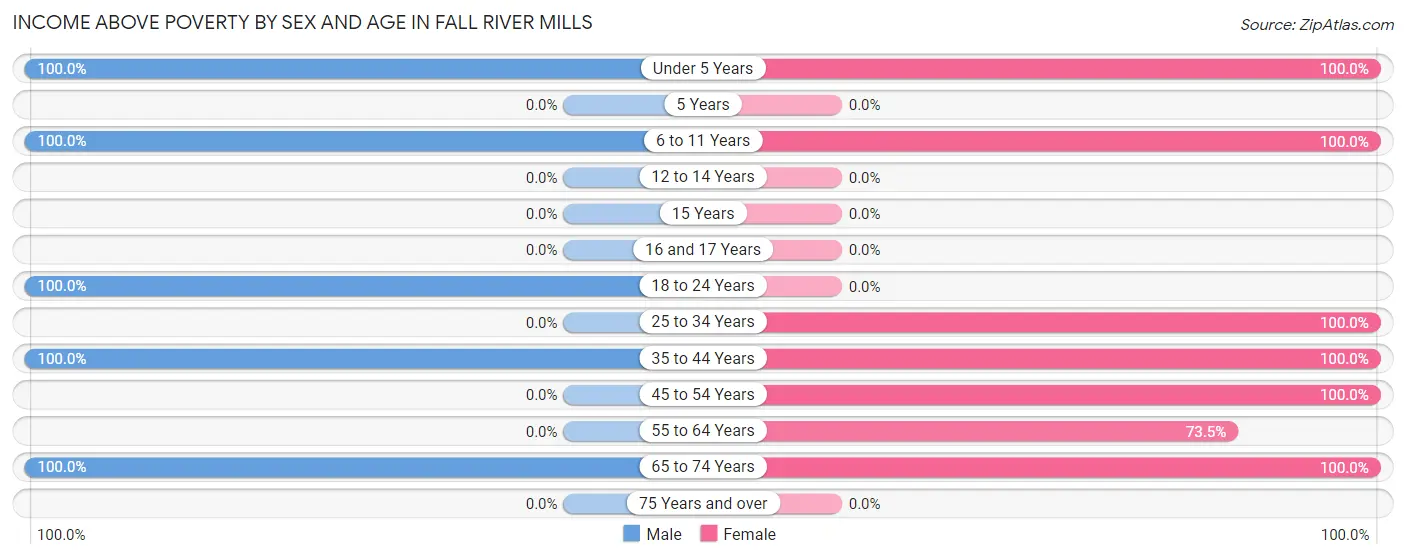
| Age Bracket | Male | Female |
| Under 5 Years | 31 (100.0%) | 99 (100.0%) |
| 5 Years | 0 (0.0%) | 0 (0.0%) |
| 6 to 11 Years | 26 (100.0%) | 20 (100.0%) |
| 12 to 14 Years | 0 (0.0%) | 0 (0.0%) |
| 15 Years | 0 (0.0%) | 0 (0.0%) |
| 16 and 17 Years | 0 (0.0%) | 0 (0.0%) |
| 18 to 24 Years | 122 (100.0%) | 0 (0.0%) |
| 25 to 34 Years | 0 (0.0%) | 98 (100.0%) |
| 35 to 44 Years | 68 (100.0%) | 30 (100.0%) |
| 45 to 54 Years | 0 (0.0%) | 13 (100.0%) |
| 55 to 64 Years | 0 (0.0%) | 25 (73.5%) |
| 65 to 74 Years | 48 (100.0%) | 24 (100.0%) |
| 75 Years and over | 0 (0.0%) | 0 (0.0%) |
| Total | 295 (97.4%) | 309 (95.1%) |
Income Below Poverty Among Married-Couple Families in Fall River Mills
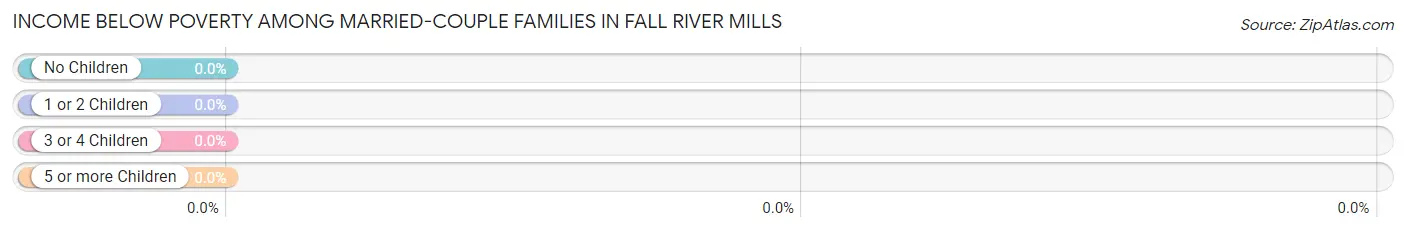
| Children | Above Poverty | Below Poverty |
| No Children | 93 (100.0%) | 0 (0.0%) |
| 1 or 2 Children | 35 (100.0%) | 0 (0.0%) |
| 3 or 4 Children | 0 (0.0%) | 0 (0.0%) |
| 5 or more Children | 0 (0.0%) | 0 (0.0%) |
| Total | 128 (100.0%) | 0 (0.0%) |
Income Below Poverty Among Single-Parent Households in Fall River Mills
| Children | Single Father | Single Mother |
| No Children | 0 (0.0%) | 0 (0.0%) |
| 1 or 2 Children | 0 (0.0%) | 0 (0.0%) |
| 3 or 4 Children | 0 (0.0%) | 0 (0.0%) |
| 5 or more Children | 0 (0.0%) | 0 (0.0%) |
| Total | 0 (0.0%) | 0 (0.0%) |
Income Below Poverty Among Married-Couple vs Single-Parent Households in Fall River Mills
| Children | Married-Couple Families | Single-Parent Households |
| No Children | 0 (0.0%) | 0 (0.0%) |
| 1 or 2 Children | 0 (0.0%) | 0 (0.0%) |
| 3 or 4 Children | 0 (0.0%) | 0 (0.0%) |
| 5 or more Children | 0 (0.0%) | 0 (0.0%) |
| Total | 0 (0.0%) | 0 (0.0%) |
Race in Fall River Mills
The most populous races in Fall River Mills are White / Caucasian (413 | 60.9%), Two or more Races (185 | 27.3%), and Hispanic or Latino (172 | 25.4%).
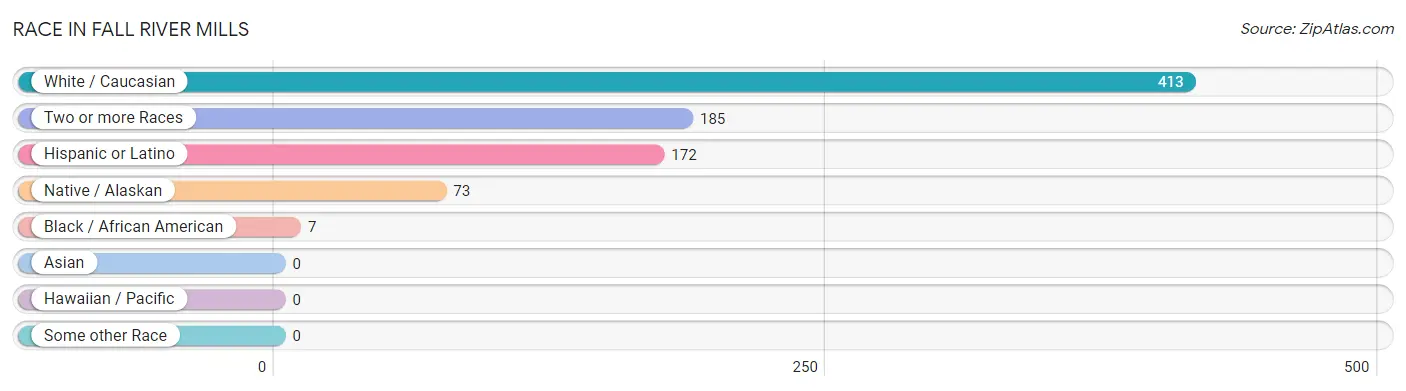
| Race | # Population | % Population |
| Asian | 0 | 0.0% |
| Black / African American | 7 | 1.0% |
| Hawaiian / Pacific | 0 | 0.0% |
| Hispanic or Latino | 172 | 25.4% |
| Native / Alaskan | 73 | 10.8% |
| White / Caucasian | 413 | 60.9% |
| Two or more Races | 185 | 27.3% |
| Some other Race | 0 | 0.0% |
| Total | 678 | 100.0% |
Ancestry in Fall River Mills
The most populous ancestries reported in Fall River Mills are Mexican (172 | 25.4%), German (137 | 20.2%), Irish (103 | 15.2%), Sri Lankan (99 | 14.6%), and Swedish (25 | 3.7%), together accounting for 79.1% of all Fall River Mills residents.
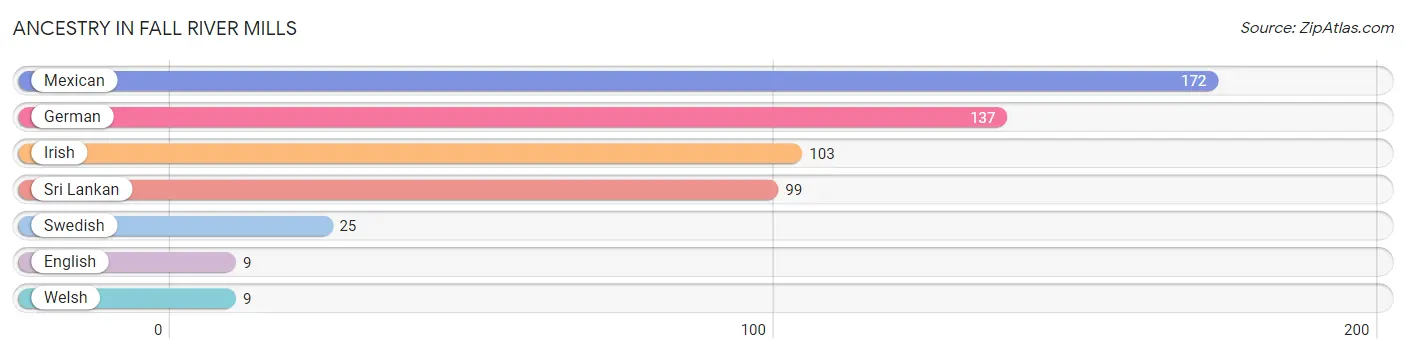
| Ancestry | # Population | % Population |
| English | 9 | 1.3% |
| German | 137 | 20.2% |
| Irish | 103 | 15.2% |
| Mexican | 172 | 25.4% |
| Sri Lankan | 99 | 14.6% |
| Swedish | 25 | 3.7% |
| Welsh | 9 | 1.3% | View All 7 Rows |
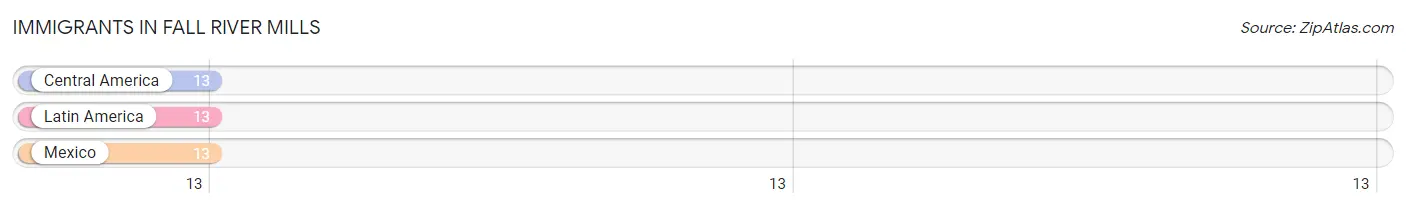
Immigrants in Fall River Mills
The most numerous immigrant groups reported in Fall River Mills came from Central America (13 | 1.9%), Latin America (13 | 1.9%), and Mexico (13 | 1.9%), together accounting for 5.8% of all Fall River Mills residents.
| Immigration Origin | # Population | % Population |
| Central America | 13 | 1.9% |
| Latin America | 13 | 1.9% |
| Mexico | 13 | 1.9% | View All 3 Rows |
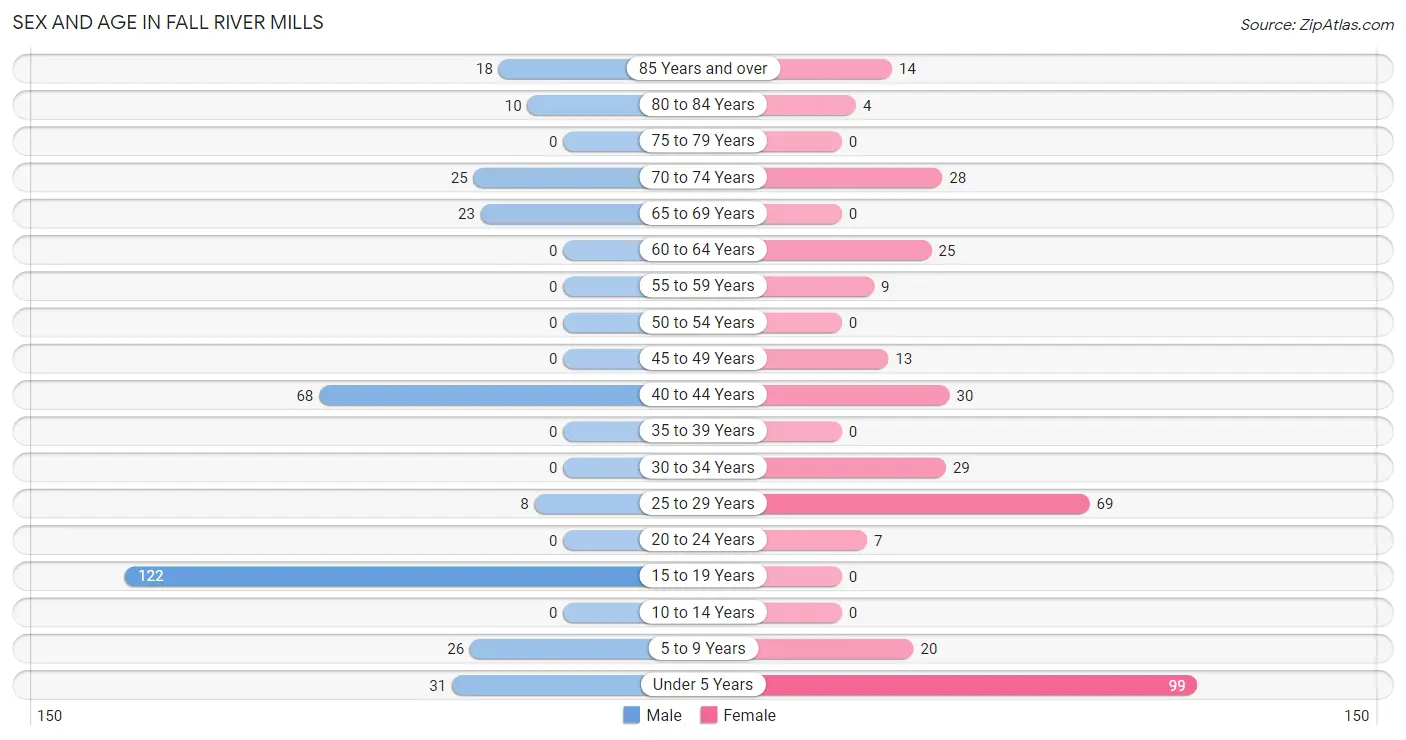
Sex and Age in Fall River Mills
Sex and Age in Fall River Mills
The most populous age groups in Fall River Mills are 15 to 19 Years (122 | 36.9%) for men and Under 5 Years (99 | 28.5%) for women.
| Age Bracket | Male | Female |
| Under 5 Years | 31 (9.4%) | 99 (28.5%) |
| 5 to 9 Years | 26 (7.9%) | 20 (5.8%) |
| 10 to 14 Years | 0 (0.0%) | 0 (0.0%) |
| 15 to 19 Years | 122 (36.9%) | 0 (0.0%) |
| 20 to 24 Years | 0 (0.0%) | 7 (2.0%) |
| 25 to 29 Years | 8 (2.4%) | 69 (19.9%) |
| 30 to 34 Years | 0 (0.0%) | 29 (8.4%) |
| 35 to 39 Years | 0 (0.0%) | 0 (0.0%) |
| 40 to 44 Years | 68 (20.5%) | 30 (8.6%) |
| 45 to 49 Years | 0 (0.0%) | 13 (3.7%) |
| 50 to 54 Years | 0 (0.0%) | 0 (0.0%) |
| 55 to 59 Years | 0 (0.0%) | 9 (2.6%) |
| 60 to 64 Years | 0 (0.0%) | 25 (7.2%) |
| 65 to 69 Years | 23 (7.0%) | 0 (0.0%) |
| 70 to 74 Years | 25 (7.5%) | 28 (8.1%) |
| 75 to 79 Years | 0 (0.0%) | 0 (0.0%) |
| 80 to 84 Years | 10 (3.0%) | 4 (1.1%) |
| 85 Years and over | 18 (5.4%) | 14 (4.0%) |
| Total | 331 (100.0%) | 347 (100.0%) |
Families and Households in Fall River Mills
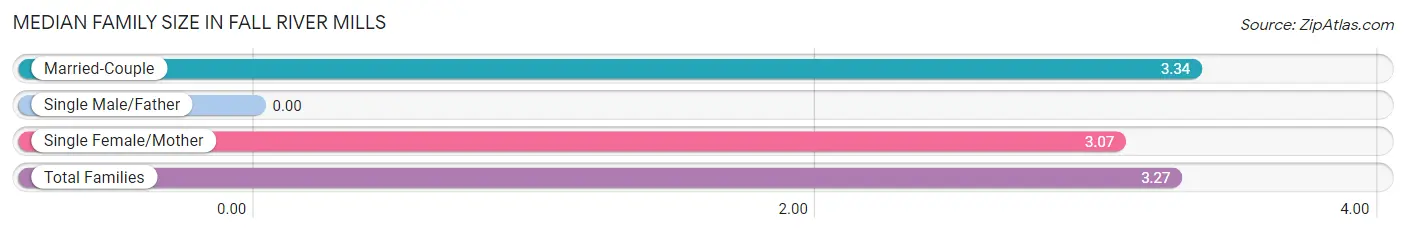
Median Family Size in Fall River Mills
| Family Type | # Families | Family Size |
| Married-Couple | 128 (75.3%) | 3.34 |
| Single Male/Father | 0 (0.0%) | - |
| Single Female/Mother | 42 (24.7%) | 3.07 |
| Total Families | 170 (100.0%) | 3.27 |
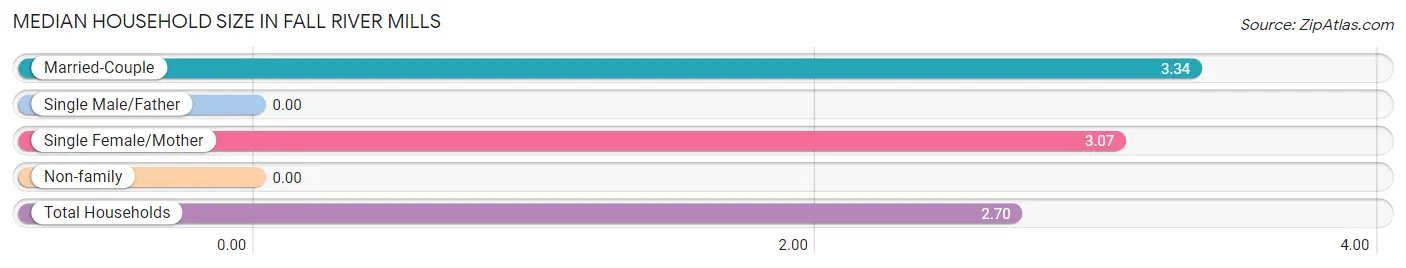
Median Household Size in Fall River Mills
| Household Type | # Households | Household Size |
| Married-Couple | 128 (56.4%) | 3.34 |
| Single Male/Father | 0 (0.0%) | - |
| Single Female/Mother | 42 (18.5%) | 3.07 |
| Non-family | 57 (25.1%) | - |
| Total Households | 227 (100.0%) | 2.70 |
Household Size by Marriage Status in Fall River Mills
Out of a total of 227 households in Fall River Mills, 170 (74.9%) are family households, while 57 (25.1%) are nonfamily households. The most numerous type of family households are 3-person households, comprising 77, and the most common type of nonfamily households are 1-person households, comprising 57.
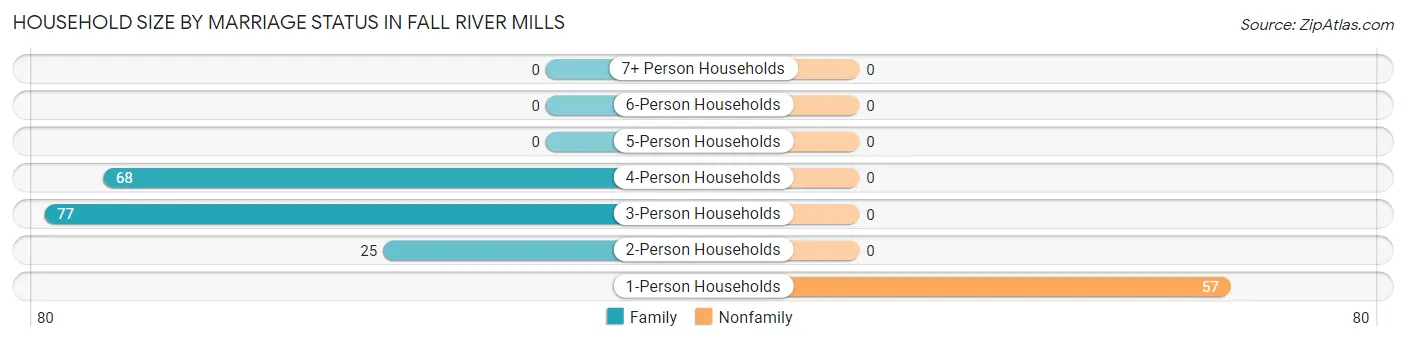
| Household Size | Family Households | Nonfamily Households |
| 1-Person Households | - | 57 (25.1%) |
| 2-Person Households | 25 (11.0%) | 0 (0.0%) |
| 3-Person Households | 77 (33.9%) | 0 (0.0%) |
| 4-Person Households | 68 (30.0%) | 0 (0.0%) |
| 5-Person Households | 0 (0.0%) | 0 (0.0%) |
| 6-Person Households | 0 (0.0%) | 0 (0.0%) |
| 7+ Person Households | 0 (0.0%) | 0 (0.0%) |
| Total | 170 (74.9%) | 57 (25.1%) |
Female Fertility in Fall River Mills
Fertility by Age in Fall River Mills
Average fertility rate in Fall River Mills is 236.0 births per 1,000 women. Women in the age bracket of 20 to 34 years have the highest fertility rate with 333.0 births per 1,000 women. Women in the age bracket of 20 to 34 years acount for 100.0% of all women with births.
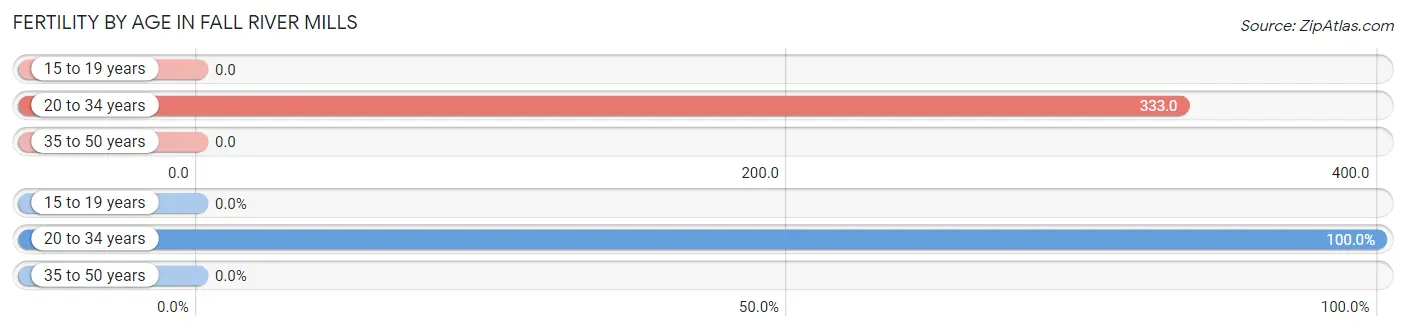
| Age Bracket | Women with Births | Births / 1,000 Women |
| 15 to 19 years | 0 (0.0%) | 0.0 |
| 20 to 34 years | 35 (100.0%) | 333.0 |
| 35 to 50 years | 0 (0.0%) | 0.0 |
| Total | 35 (100.0%) | 236.0 |
Fertility by Age by Marriage Status in Fall River Mills
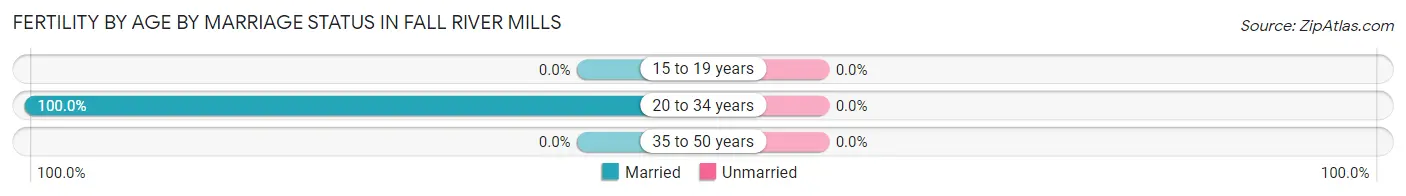
| Age Bracket | Married | Unmarried |
| 15 to 19 years | 0 (0.0%) | 0 (0.0%) |
| 20 to 34 years | 35 (100.0%) | 0 (0.0%) |
| 35 to 50 years | 0 (0.0%) | 0 (0.0%) |
| Total | 35 (100.0%) | 0 (0.0%) |
Fertility by Education in Fall River Mills
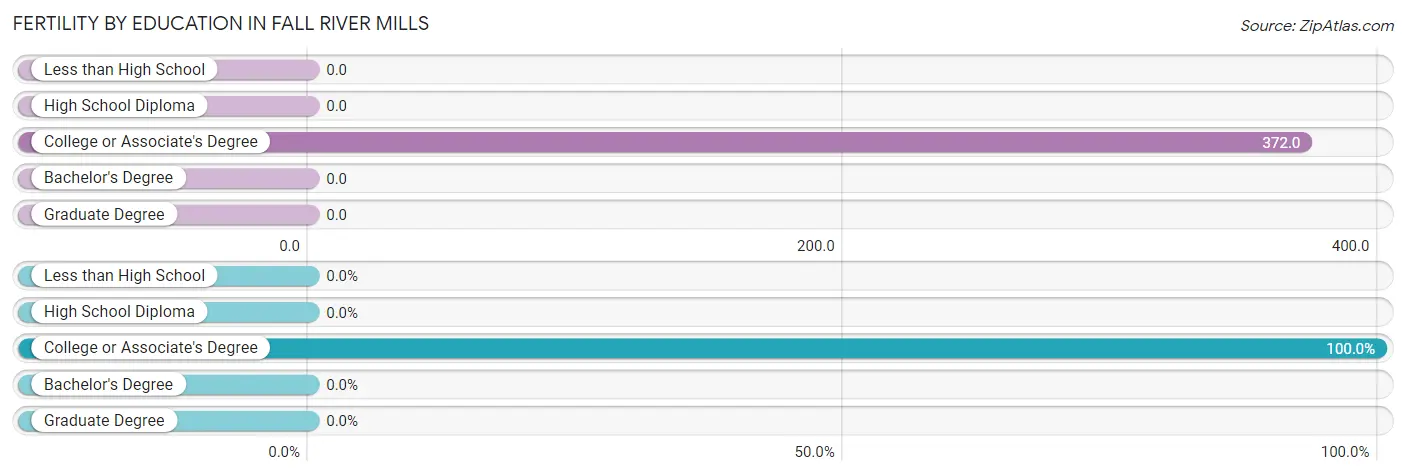
| Educational Attainment | Women with Births | Births / 1,000 Women |
| Less than High School | 0 (0.0%) | 0.0 |
| High School Diploma | 0 (0.0%) | 0.0 |
| College or Associate's Degree | 35 (100.0%) | 372.0 |
| Bachelor's Degree | 0 (0.0%) | 0.0 |
| Graduate Degree | 0 (0.0%) | 0.0 |
| Total | 35 (100.0%) | 236.0 |
Fertility by Education by Marriage Status in Fall River Mills
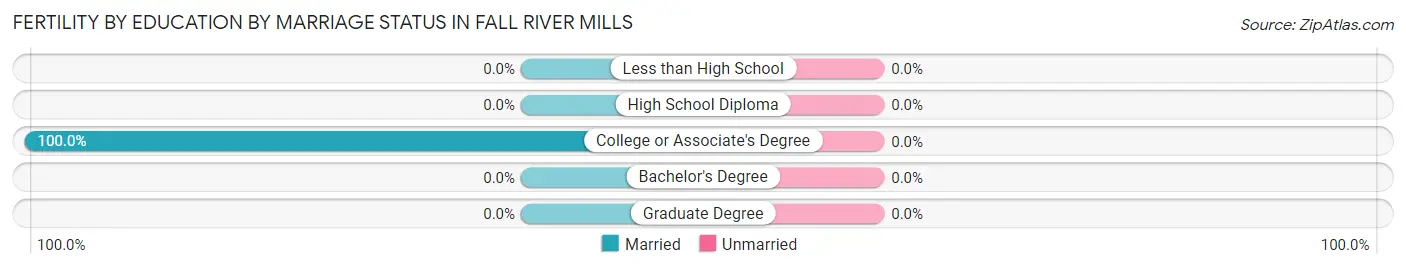
| Educational Attainment | Married | Unmarried |
| Less than High School | 0 (0.0%) | 0 (0.0%) |
| High School Diploma | 0 (0.0%) | 0 (0.0%) |
| College or Associate's Degree | 35 (100.0%) | 0 (0.0%) |
| Bachelor's Degree | 0 (0.0%) | 0 (0.0%) |
| Graduate Degree | 0 (0.0%) | 0 (0.0%) |
| Total | 35 (100.0%) | 0 (0.0%) |
Employment Characteristics in Fall River Mills
Employment by Class of Employer in Fall River Mills
Among the 190 employed individuals in Fall River Mills, federal government employees (103 | 54.2%), private company employees (57 | 30.0%), and state government employees (30 | 15.8%) make up the most common classes of employment.
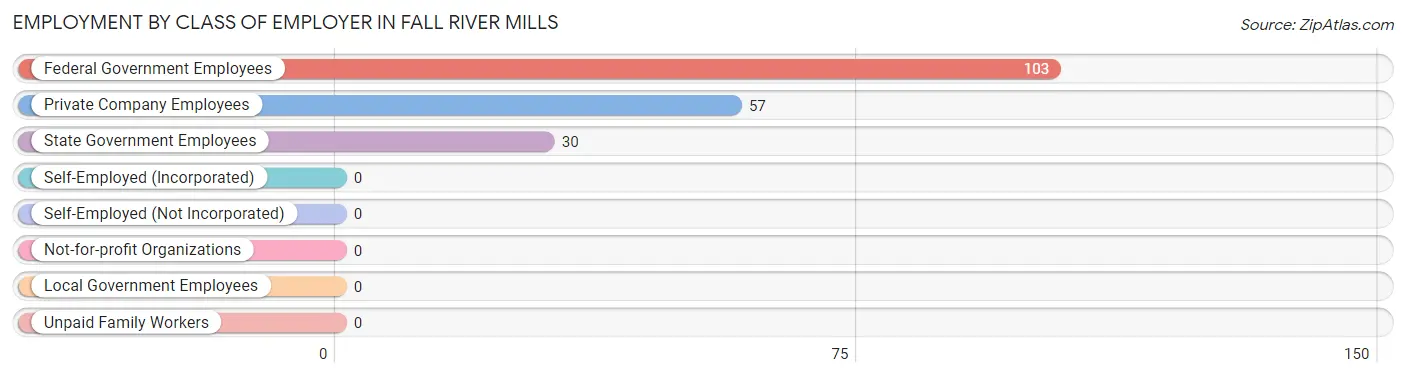
| Employer Class | # Employees | % Employees |
| Private Company Employees | 57 | 30.0% |
| Self-Employed (Incorporated) | 0 | 0.0% |
| Self-Employed (Not Incorporated) | 0 | 0.0% |
| Not-for-profit Organizations | 0 | 0.0% |
| Local Government Employees | 0 | 0.0% |
| State Government Employees | 30 | 15.8% |
| Federal Government Employees | 103 | 54.2% |
| Unpaid Family Workers | 0 | 0.0% |
| Total | 190 | 100.0% |
Employment Status by Age in Fall River Mills
According to the labor force statistics for Fall River Mills, out of the total population over 16 years of age (502), 48.2% or 242 individuals are in the labor force, with 25.1% or 61 of them unemployed. The age group with the highest labor force participation rate is 30 to 34 years, with 100.0% or 29 individuals in the labor force. Within the labor force, the 16 to 19 years age range has the highest percentage of unemployed individuals, with 100.0% or 10 of them being unemployed.
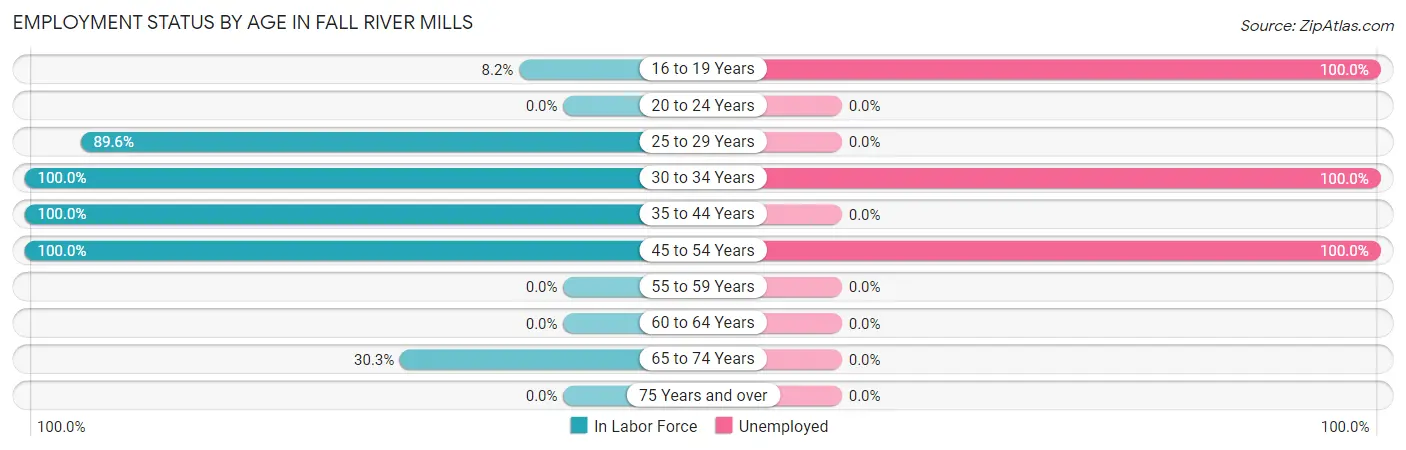
| Age Bracket | In Labor Force | Unemployed |
| 16 to 19 Years | 10 (8.2%) | 10 (100.0%) |
| 20 to 24 Years | 0 (0.0%) | 0 (0.0%) |
| 25 to 29 Years | 69 (89.6%) | 0 (0.0%) |
| 30 to 34 Years | 29 (100.0%) | 29 (100.0%) |
| 35 to 44 Years | 98 (100.0%) | 0 (0.0%) |
| 45 to 54 Years | 13 (100.0%) | 13 (100.0%) |
| 55 to 59 Years | 0 (0.0%) | 0 (0.0%) |
| 60 to 64 Years | 0 (0.0%) | 0 (0.0%) |
| 65 to 74 Years | 23 (30.3%) | 0 (0.0%) |
| 75 Years and over | 0 (0.0%) | 0 (0.0%) |
| Total | 242 (48.2%) | 61 (25.1%) |
Employment Status by Educational Attainment in Fall River Mills
According to labor force statistics for Fall River Mills, 83.3% of individuals (209) out of the total population between 25 and 64 years of age (251) are in the labor force, with 24.1% or 50 of them being unemployed. The group with the highest labor force participation rate are those with the educational attainment of high school diploma, with 100.0% or 47 individuals in the labor force. Within the labor force, individuals with high school diploma education have the highest percentage of unemployment, with 27.7% or 13 of them being unemployed.
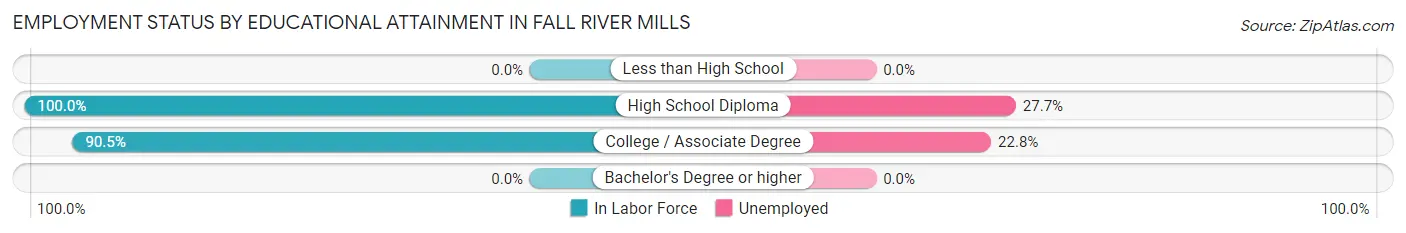
| Educational Attainment | In Labor Force | Unemployed |
| Less than High School | 0 (0.0%) | 0 (0.0%) |
| High School Diploma | 47 (100.0%) | 13 (27.7%) |
| College / Associate Degree | 162 (90.5%) | 41 (22.8%) |
| Bachelor's Degree or higher | 0 (0.0%) | 0 (0.0%) |
| Total | 209 (83.3%) | 60 (24.1%) |
Employment Occupations by Sex in Fall River Mills
Management, Business, Science and Arts Occupations
The most common Management, Business, Science and Arts occupations in Fall River Mills are , and Health Diagnosing & Treating (64 | 41.3%).
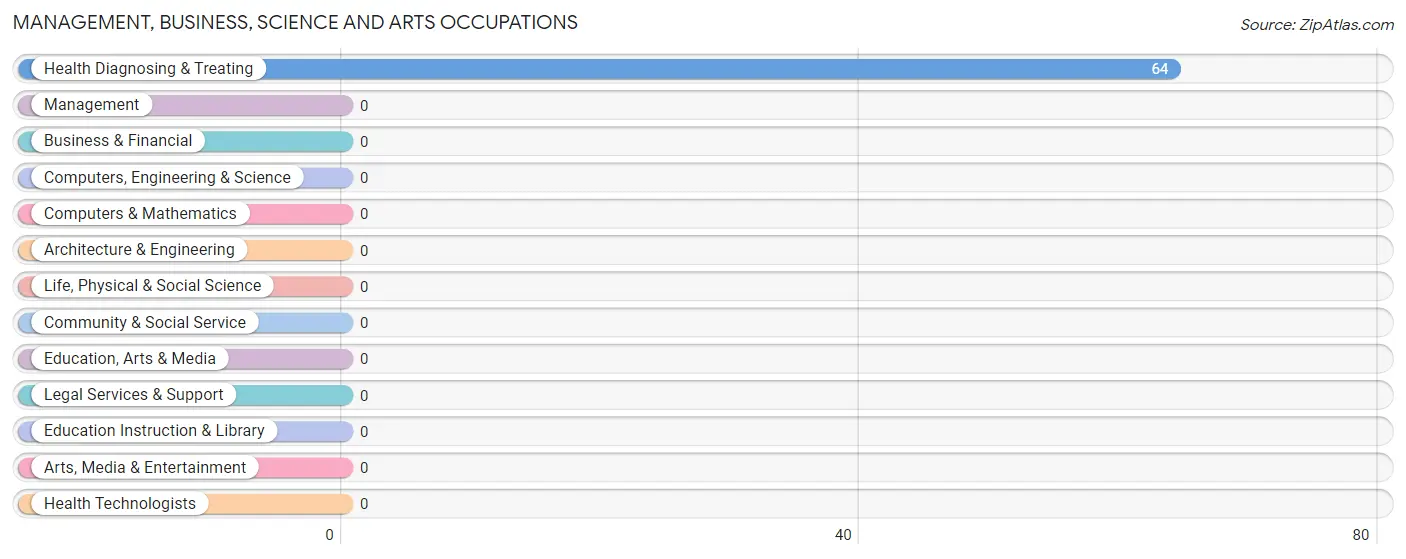
Management, Business, Science and Arts Occupations by Sex
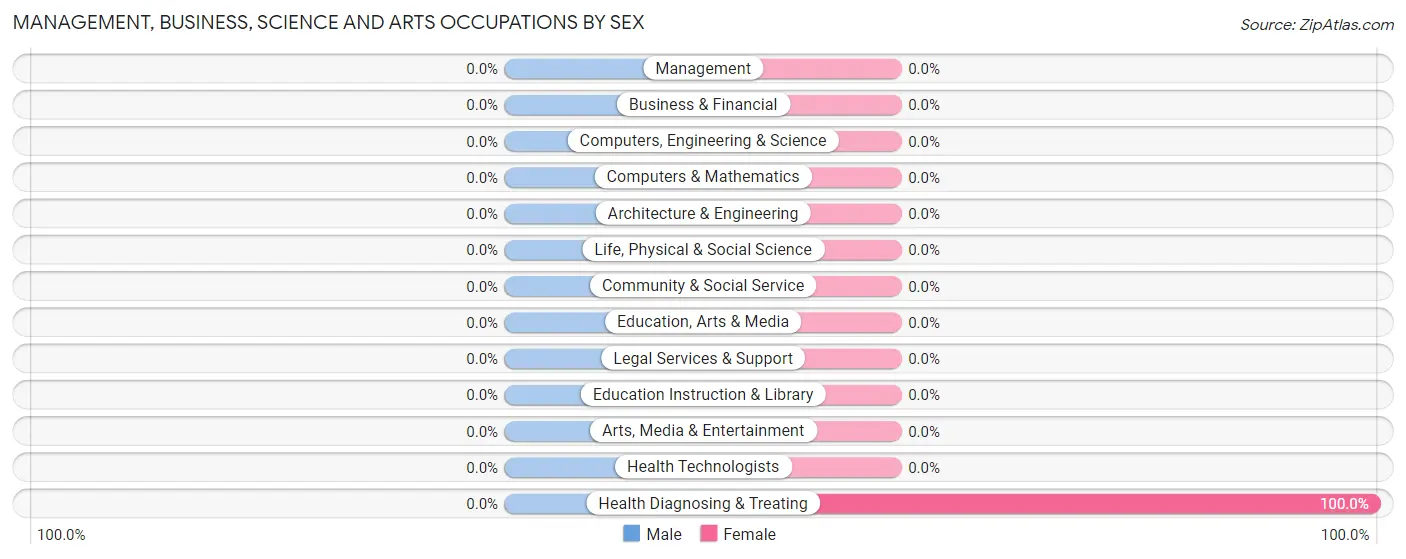
| Occupation | Male | Female |
| Management | 0 (0.0%) | 0 (0.0%) |
| Business & Financial | 0 (0.0%) | 0 (0.0%) |
| Computers, Engineering & Science | 0 (0.0%) | 0 (0.0%) |
| Computers & Mathematics | 0 (0.0%) | 0 (0.0%) |
| Architecture & Engineering | 0 (0.0%) | 0 (0.0%) |
| Life, Physical & Social Science | 0 (0.0%) | 0 (0.0%) |
| Community & Social Service | 0 (0.0%) | 0 (0.0%) |
| Education, Arts & Media | 0 (0.0%) | 0 (0.0%) |
| Legal Services & Support | 0 (0.0%) | 0 (0.0%) |
| Education Instruction & Library | 0 (0.0%) | 0 (0.0%) |
| Arts, Media & Entertainment | 0 (0.0%) | 0 (0.0%) |
| Health Diagnosing & Treating | 0 (0.0%) | 64 (100.0%) |
| Health Technologists | 0 (0.0%) | 0 (0.0%) |
| Total (Category) | 0 (0.0%) | 64 (100.0%) |
| Total (Overall) | 91 (58.7%) | 64 (41.3%) |
Services Occupations
The most common Services occupations in Fall River Mills are Security & Protection (68 | 43.9%), Firefighting & Prevention (68 | 43.9%), and Cleaning & Maintenance (23 | 14.8%).
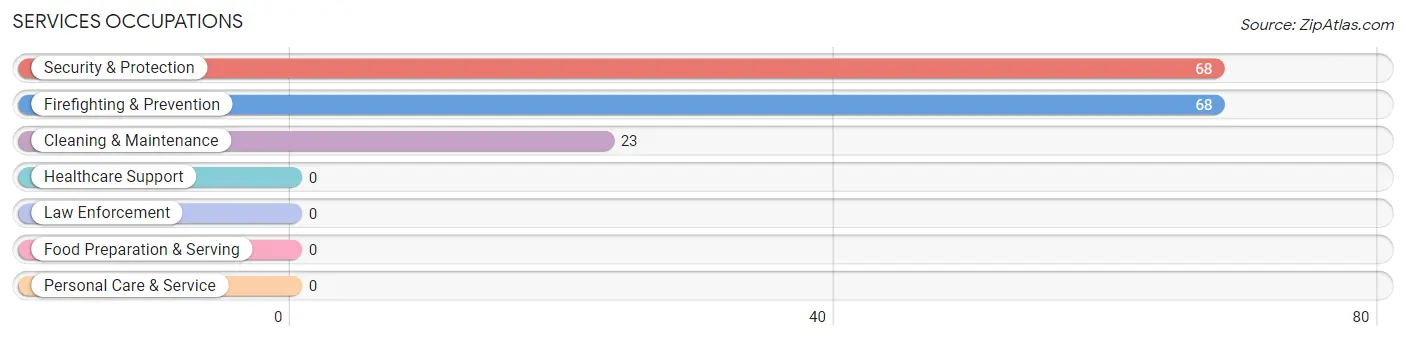
Services Occupations by Sex
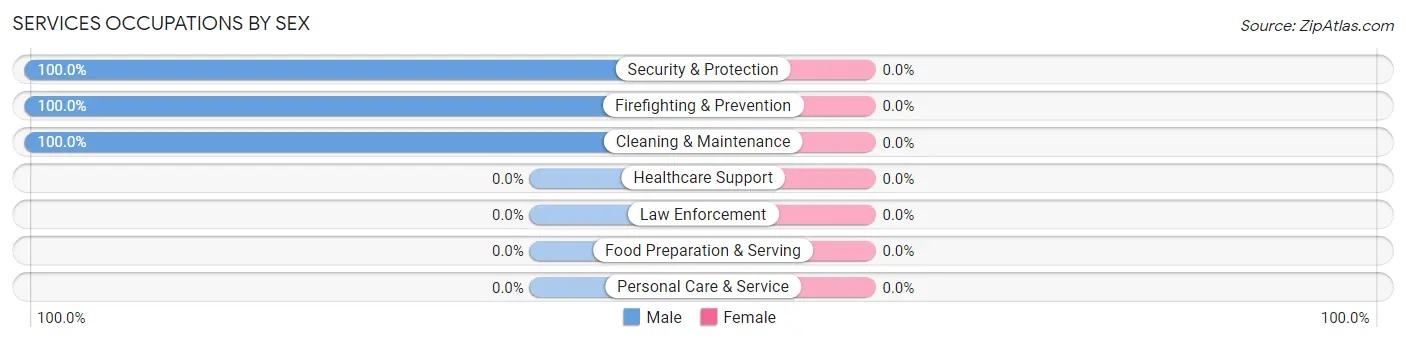
| Occupation | Male | Female |
| Healthcare Support | 0 (0.0%) | 0 (0.0%) |
| Security & Protection | 68 (100.0%) | 0 (0.0%) |
| Firefighting & Prevention | 68 (100.0%) | 0 (0.0%) |
| Law Enforcement | 0 (0.0%) | 0 (0.0%) |
| Food Preparation & Serving | 0 (0.0%) | 0 (0.0%) |
| Cleaning & Maintenance | 23 (100.0%) | 0 (0.0%) |
| Personal Care & Service | 0 (0.0%) | 0 (0.0%) |
| Total (Category) | 91 (100.0%) | 0 (0.0%) |
| Total (Overall) | 91 (58.7%) | 64 (41.3%) |
Sales and Office Occupations
Sales and Office Occupations by Sex
| Occupation | Male | Female |
| Sales & Related | 0 (0.0%) | 0 (0.0%) |
| Office & Administration | 0 (0.0%) | 0 (0.0%) |
| Total (Category) | 0 (0.0%) | 0 (0.0%) |
| Total (Overall) | 91 (58.7%) | 64 (41.3%) |
Natural Resources, Construction and Maintenance Occupations
Natural Resources, Construction and Maintenance Occupations by Sex
| Occupation | Male | Female |
| Farming, Fishing & Forestry | 0 (0.0%) | 0 (0.0%) |
| Construction & Extraction | 0 (0.0%) | 0 (0.0%) |
| Installation, Maintenance & Repair | 0 (0.0%) | 0 (0.0%) |
| Total (Category) | 0 (0.0%) | 0 (0.0%) |
| Total (Overall) | 91 (58.7%) | 64 (41.3%) |
Production, Transportation and Moving Occupations
Production, Transportation and Moving Occupations by Sex
| Occupation | Male | Female |
| Production | 0 (0.0%) | 0 (0.0%) |
| Transportation | 0 (0.0%) | 0 (0.0%) |
| Material Moving | 0 (0.0%) | 0 (0.0%) |
| Total (Category) | 0 (0.0%) | 0 (0.0%) |
| Total (Overall) | 91 (58.7%) | 64 (41.3%) |
Employment Industries by Sex in Fall River Mills
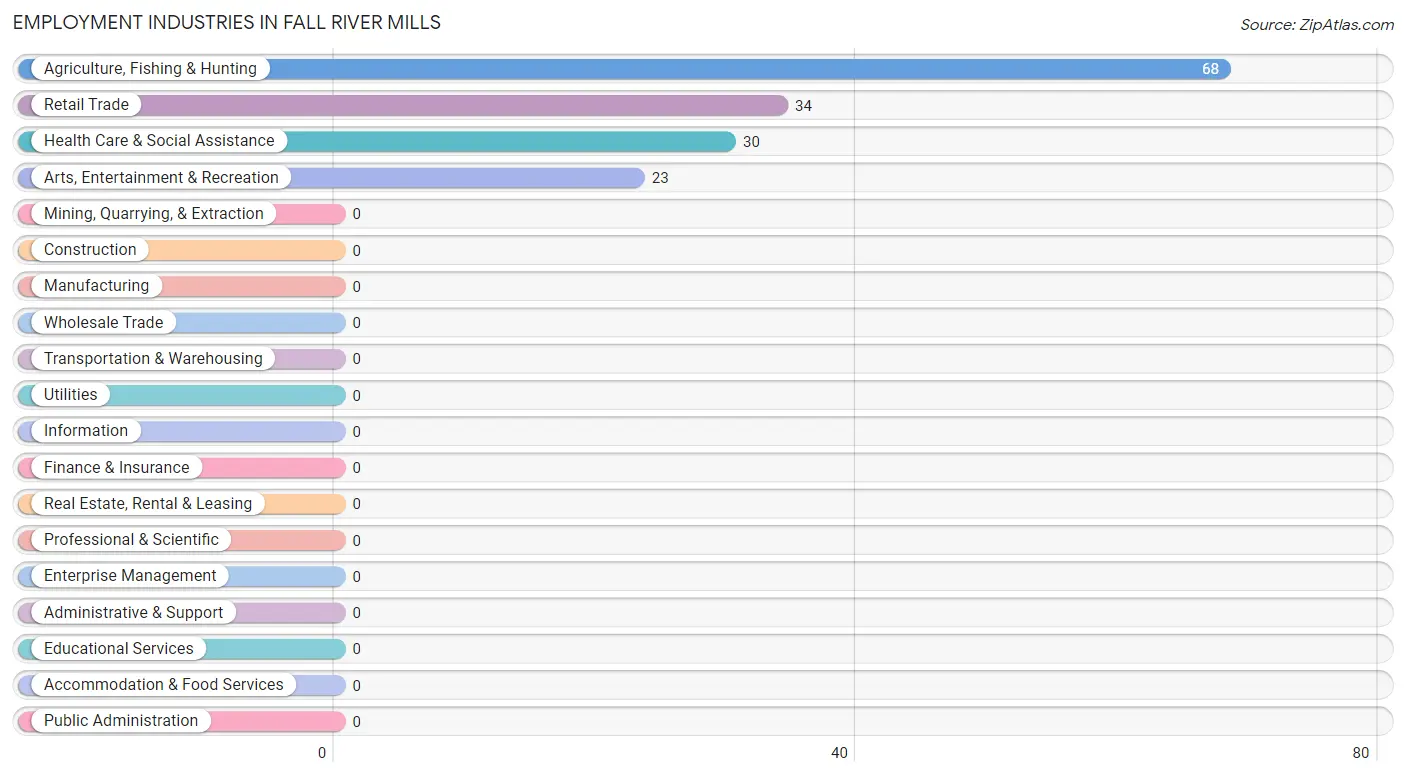
Employment Industries in Fall River Mills
The major employment industries in Fall River Mills include Agriculture, Fishing & Hunting (68 | 43.9%), Retail Trade (34 | 21.9%), Health Care & Social Assistance (30 | 19.4%), and Arts, Entertainment & Recreation (23 | 14.8%).
Employment Industries by Sex in Fall River Mills
The Fall River Mills industries that see more men than women are Agriculture, Fishing & Hunting (100.0%), and Arts, Entertainment & Recreation (100.0%), whereas the industries that tend to have a higher number of women are Retail Trade (100.0%), and Health Care & Social Assistance (100.0%).
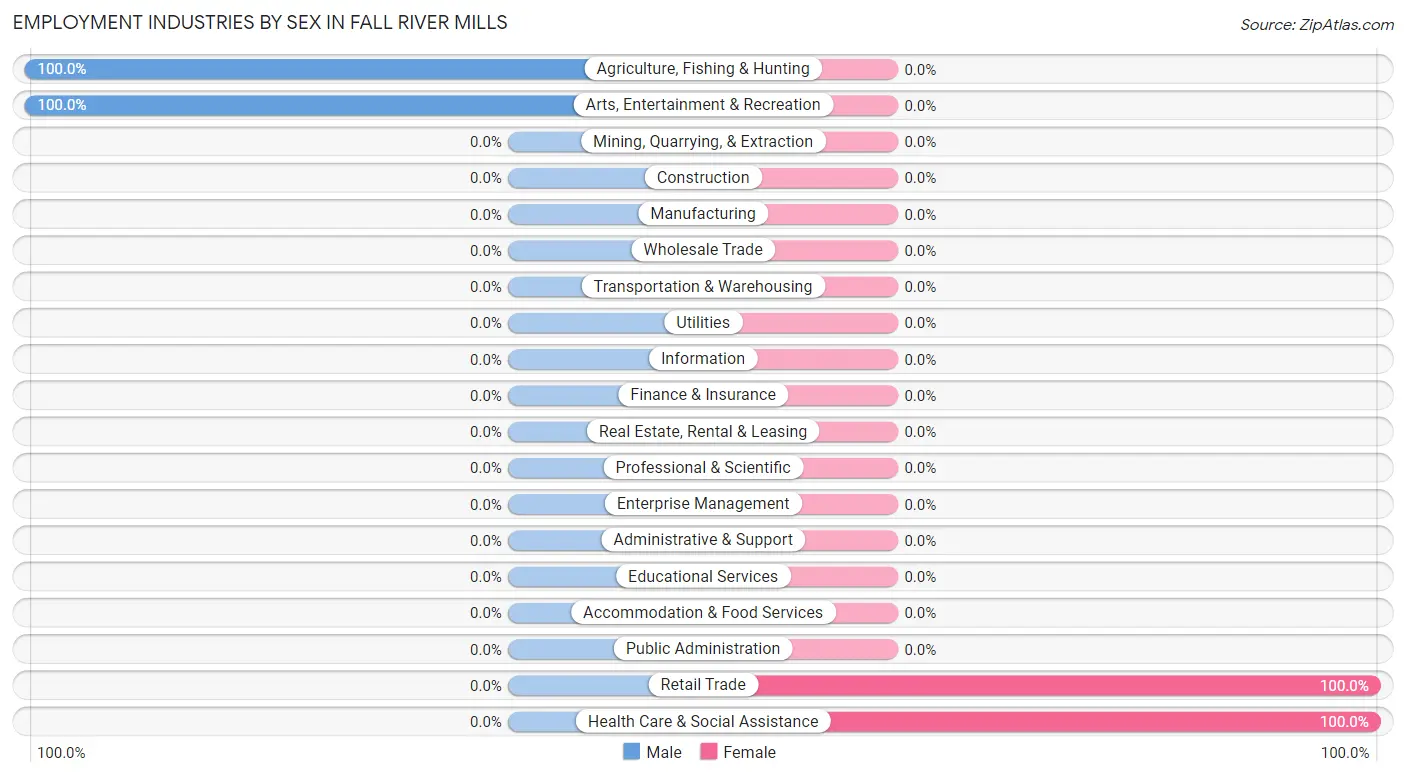
| Industry | Male | Female |
| Agriculture, Fishing & Hunting | 68 (100.0%) | 0 (0.0%) |
| Mining, Quarrying, & Extraction | 0 (0.0%) | 0 (0.0%) |
| Construction | 0 (0.0%) | 0 (0.0%) |
| Manufacturing | 0 (0.0%) | 0 (0.0%) |
| Wholesale Trade | 0 (0.0%) | 0 (0.0%) |
| Retail Trade | 0 (0.0%) | 34 (100.0%) |
| Transportation & Warehousing | 0 (0.0%) | 0 (0.0%) |
| Utilities | 0 (0.0%) | 0 (0.0%) |
| Information | 0 (0.0%) | 0 (0.0%) |
| Finance & Insurance | 0 (0.0%) | 0 (0.0%) |
| Real Estate, Rental & Leasing | 0 (0.0%) | 0 (0.0%) |
| Professional & Scientific | 0 (0.0%) | 0 (0.0%) |
| Enterprise Management | 0 (0.0%) | 0 (0.0%) |
| Administrative & Support | 0 (0.0%) | 0 (0.0%) |
| Educational Services | 0 (0.0%) | 0 (0.0%) |
| Health Care & Social Assistance | 0 (0.0%) | 30 (100.0%) |
| Arts, Entertainment & Recreation | 23 (100.0%) | 0 (0.0%) |
| Accommodation & Food Services | 0 (0.0%) | 0 (0.0%) |
| Public Administration | 0 (0.0%) | 0 (0.0%) |
| Total | 91 (58.7%) | 64 (41.3%) |
Education in Fall River Mills
School Enrollment in Fall River Mills
The most common levels of schooling among the 158 students in Fall River Mills are high school (112 | 70.9%), and elementary school (46 | 29.1%).
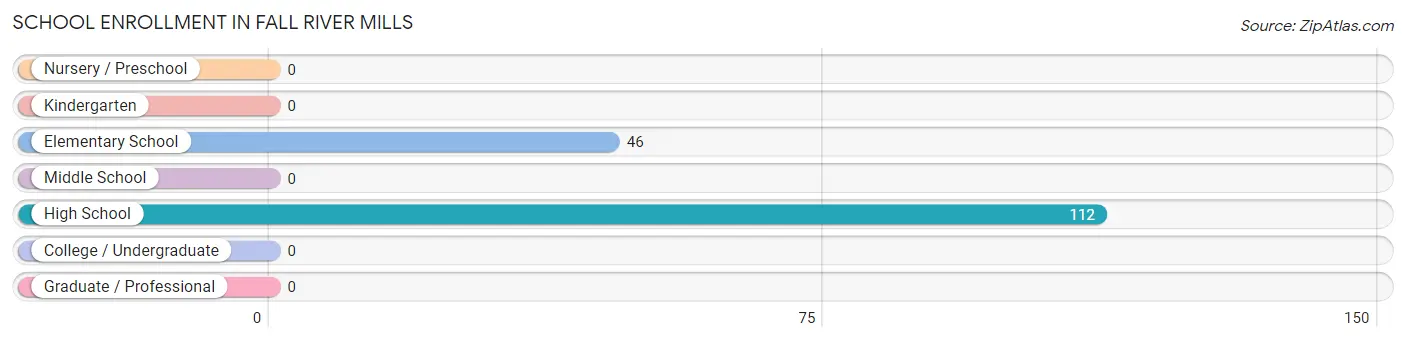
| School Level | # Students | % Students |
| Nursery / Preschool | 0 | 0.0% |
| Kindergarten | 0 | 0.0% |
| Elementary School | 46 | 29.1% |
| Middle School | 0 | 0.0% |
| High School | 112 | 70.9% |
| College / Undergraduate | 0 | 0.0% |
| Graduate / Professional | 0 | 0.0% |
| Total | 158 | 100.0% |
School Enrollment by Age by Funding Source in Fall River Mills
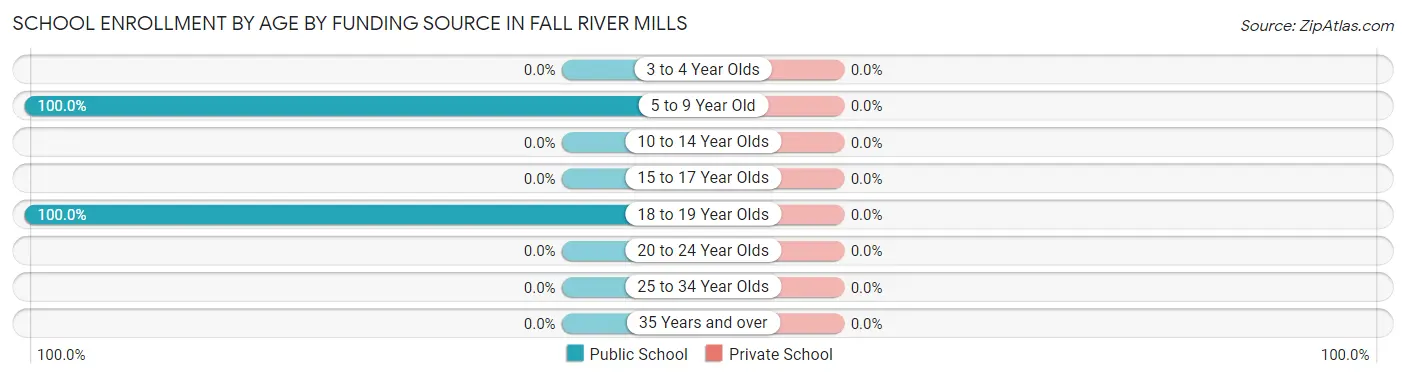
| Age Bracket | Public School | Private School |
| 3 to 4 Year Olds | 0 (0.0%) | 0 (0.0%) |
| 5 to 9 Year Old | 46 (100.0%) | 0 (0.0%) |
| 10 to 14 Year Olds | 0 (0.0%) | 0 (0.0%) |
| 15 to 17 Year Olds | 0 (0.0%) | 0 (0.0%) |
| 18 to 19 Year Olds | 112 (100.0%) | 0 (0.0%) |
| 20 to 24 Year Olds | 0 (0.0%) | 0 (0.0%) |
| 25 to 34 Year Olds | 0 (0.0%) | 0 (0.0%) |
| 35 Years and over | 0 (0.0%) | 0 (0.0%) |
| Total | 158 (100.0%) | 0 (0.0%) |
Educational Attainment by Field of Study in Fall River Mills
Communications (23 | 69.7%), and bio, nature & agricultural (10 | 30.3%) are the most common fields of study among 33 individuals in Fall River Mills who have obtained a bachelor's degree or higher.
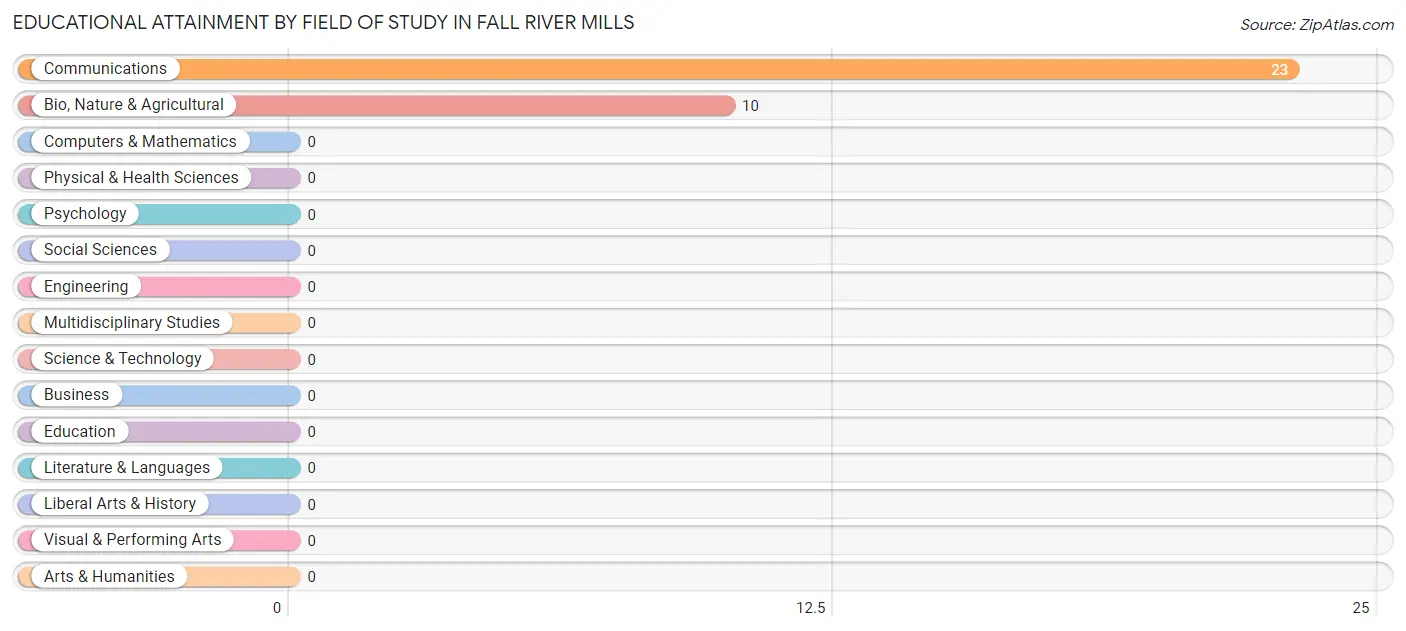
| Field of Study | # Graduates | % Graduates |
| Computers & Mathematics | 0 | 0.0% |
| Bio, Nature & Agricultural | 10 | 30.3% |
| Physical & Health Sciences | 0 | 0.0% |
| Psychology | 0 | 0.0% |
| Social Sciences | 0 | 0.0% |
| Engineering | 0 | 0.0% |
| Multidisciplinary Studies | 0 | 0.0% |
| Science & Technology | 0 | 0.0% |
| Business | 0 | 0.0% |
| Education | 0 | 0.0% |
| Literature & Languages | 0 | 0.0% |
| Liberal Arts & History | 0 | 0.0% |
| Visual & Performing Arts | 0 | 0.0% |
| Communications | 23 | 69.7% |
| Arts & Humanities | 0 | 0.0% |
| Total | 33 | 100.0% |
Transportation & Commute in Fall River Mills
Vehicle Availability by Sex in Fall River Mills
The most prevalent vehicle ownership categories in Fall River Mills are males with 4 vehicles (68, accounting for 74.7%) and females with 4 vehicles (30, making up 68.7%).
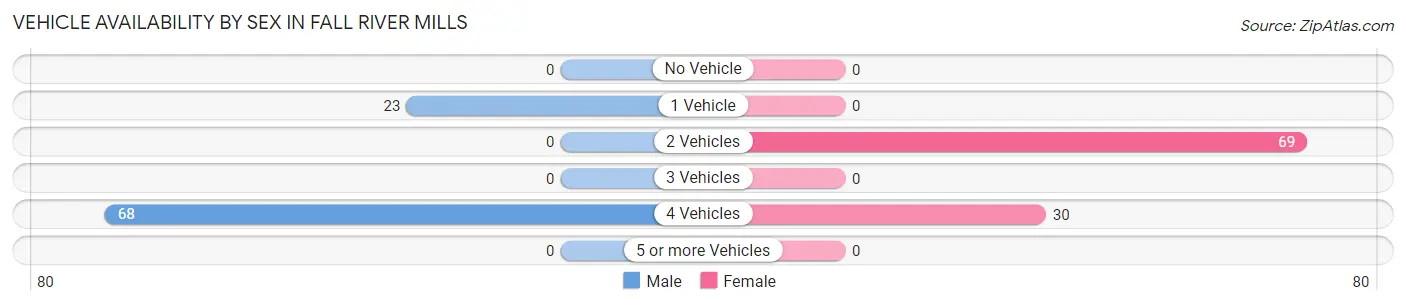
| Vehicles Available | Male | Female |
| No Vehicle | 0 (0.0%) | 0 (0.0%) |
| 1 Vehicle | 23 (25.3%) | 0 (0.0%) |
| 2 Vehicles | 0 (0.0%) | 69 (69.7%) |
| 3 Vehicles | 0 (0.0%) | 0 (0.0%) |
| 4 Vehicles | 68 (74.7%) | 30 (30.3%) |
| 5 or more Vehicles | 0 (0.0%) | 0 (0.0%) |
| Total | 91 (100.0%) | 99 (100.0%) |
Commute Time in Fall River Mills
The most frequently occuring commute durations in Fall River Mills are 30 to 34 minutes (68 commuters, 35.8%), 25 to 29 minutes (35 commuters, 18.4%), and 20 to 24 minutes (34 commuters, 17.9%).
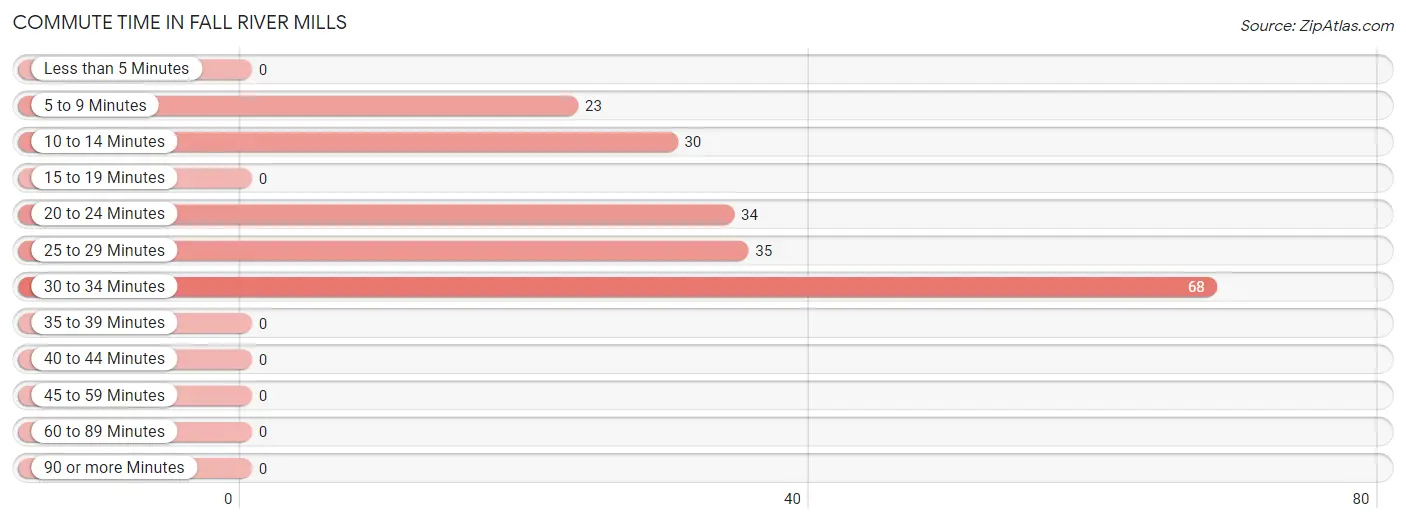
| Commute Time | # Commuters | % Commuters |
| Less than 5 Minutes | 0 | 0.0% |
| 5 to 9 Minutes | 23 | 12.1% |
| 10 to 14 Minutes | 30 | 15.8% |
| 15 to 19 Minutes | 0 | 0.0% |
| 20 to 24 Minutes | 34 | 17.9% |
| 25 to 29 Minutes | 35 | 18.4% |
| 30 to 34 Minutes | 68 | 35.8% |
| 35 to 39 Minutes | 0 | 0.0% |
| 40 to 44 Minutes | 0 | 0.0% |
| 45 to 59 Minutes | 0 | 0.0% |
| 60 to 89 Minutes | 0 | 0.0% |
| 90 or more Minutes | 0 | 0.0% |
Commute Time by Sex in Fall River Mills
The most common commute times in Fall River Mills are 30 to 34 minutes (68 commuters, 74.7%) for males and 25 to 29 minutes (35 commuters, 35.3%) for females.
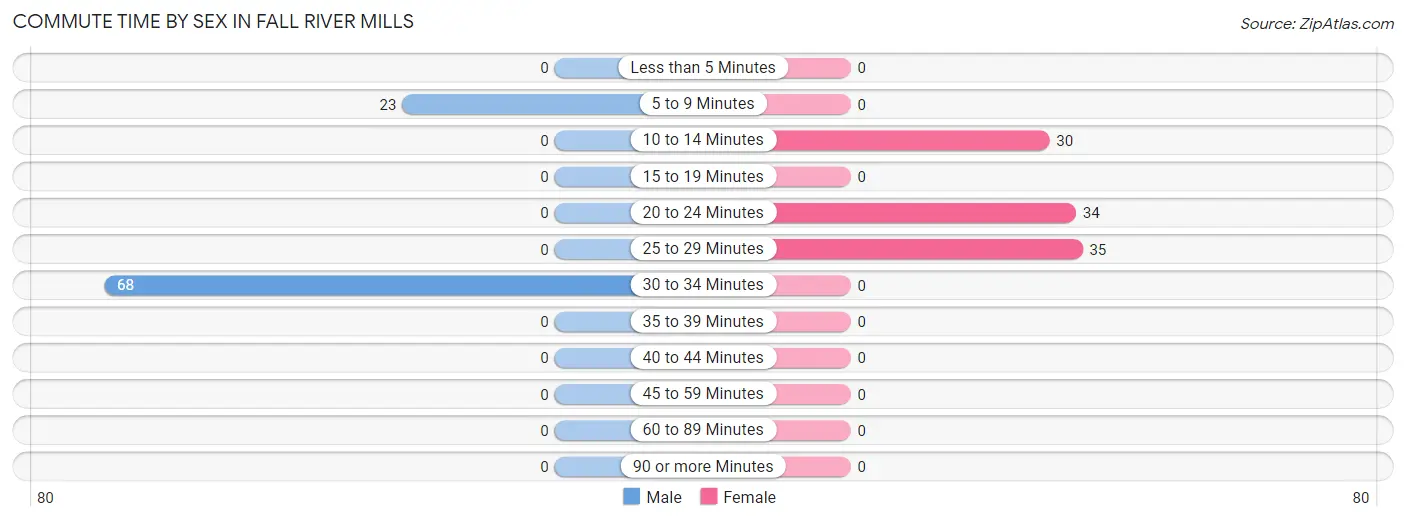
| Commute Time | Male | Female |
| Less than 5 Minutes | 0 (0.0%) | 0 (0.0%) |
| 5 to 9 Minutes | 23 (25.3%) | 0 (0.0%) |
| 10 to 14 Minutes | 0 (0.0%) | 30 (30.3%) |
| 15 to 19 Minutes | 0 (0.0%) | 0 (0.0%) |
| 20 to 24 Minutes | 0 (0.0%) | 34 (34.3%) |
| 25 to 29 Minutes | 0 (0.0%) | 35 (35.3%) |
| 30 to 34 Minutes | 68 (74.7%) | 0 (0.0%) |
| 35 to 39 Minutes | 0 (0.0%) | 0 (0.0%) |
| 40 to 44 Minutes | 0 (0.0%) | 0 (0.0%) |
| 45 to 59 Minutes | 0 (0.0%) | 0 (0.0%) |
| 60 to 89 Minutes | 0 (0.0%) | 0 (0.0%) |
| 90 or more Minutes | 0 (0.0%) | 0 (0.0%) |
Time of Departure to Work by Sex in Fall River Mills
The most frequent times of departure to work in Fall River Mills are 9:00 AM to 9:59 AM (68, 74.7%) for males and 7:30 AM to 7:59 AM (35, 35.3%) for females.
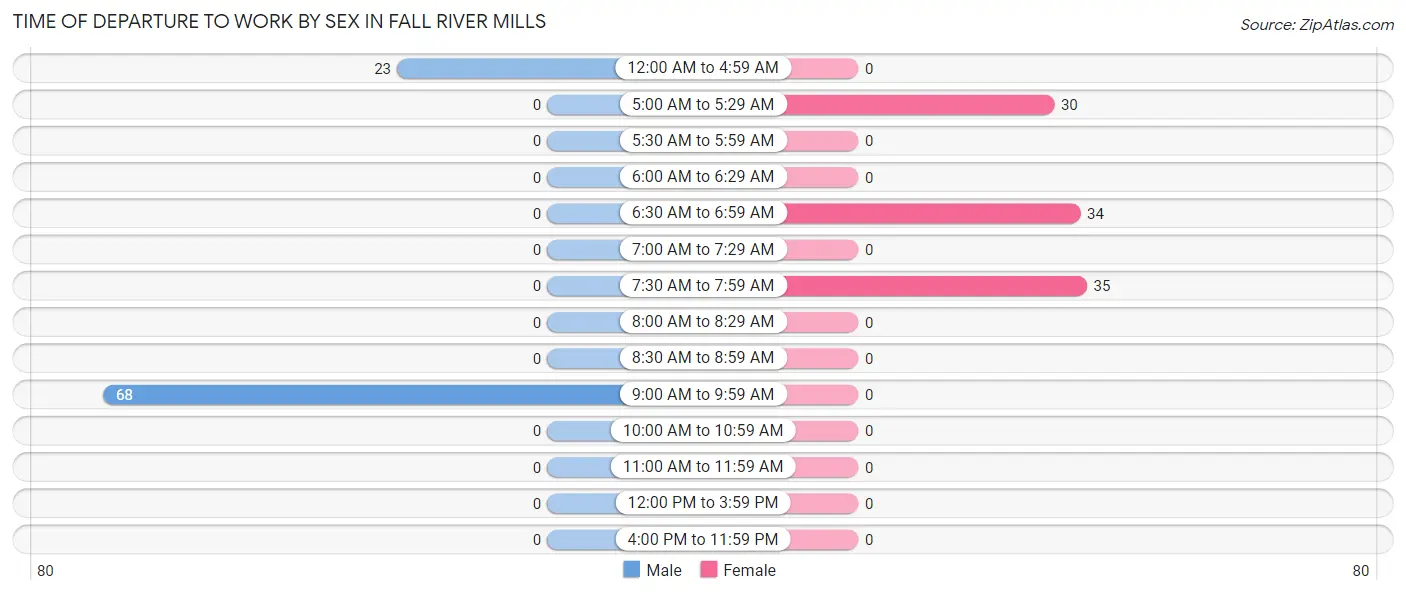
| Time of Departure | Male | Female |
| 12:00 AM to 4:59 AM | 23 (25.3%) | 0 (0.0%) |
| 5:00 AM to 5:29 AM | 0 (0.0%) | 30 (30.3%) |
| 5:30 AM to 5:59 AM | 0 (0.0%) | 0 (0.0%) |
| 6:00 AM to 6:29 AM | 0 (0.0%) | 0 (0.0%) |
| 6:30 AM to 6:59 AM | 0 (0.0%) | 34 (34.3%) |
| 7:00 AM to 7:29 AM | 0 (0.0%) | 0 (0.0%) |
| 7:30 AM to 7:59 AM | 0 (0.0%) | 35 (35.3%) |
| 8:00 AM to 8:29 AM | 0 (0.0%) | 0 (0.0%) |
| 8:30 AM to 8:59 AM | 0 (0.0%) | 0 (0.0%) |
| 9:00 AM to 9:59 AM | 68 (74.7%) | 0 (0.0%) |
| 10:00 AM to 10:59 AM | 0 (0.0%) | 0 (0.0%) |
| 11:00 AM to 11:59 AM | 0 (0.0%) | 0 (0.0%) |
| 12:00 PM to 3:59 PM | 0 (0.0%) | 0 (0.0%) |
| 4:00 PM to 11:59 PM | 0 (0.0%) | 0 (0.0%) |
| Total | 91 (100.0%) | 99 (100.0%) |
Housing Occupancy in Fall River Mills
Occupancy by Ownership in Fall River Mills
Of the total 227 dwellings in Fall River Mills, owner-occupied units account for 116 (51.1%), while renter-occupied units make up 111 (48.9%).
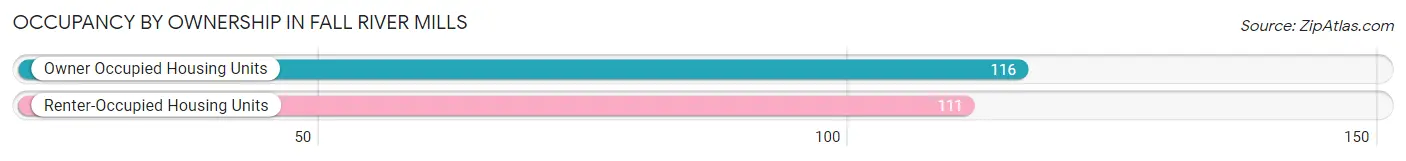
| Occupancy | # Housing Units | % Housing Units |
| Owner Occupied Housing Units | 116 | 51.1% |
| Renter-Occupied Housing Units | 111 | 48.9% |
| Total Occupied Housing Units | 227 | 100.0% |
Occupancy by Household Size in Fall River Mills
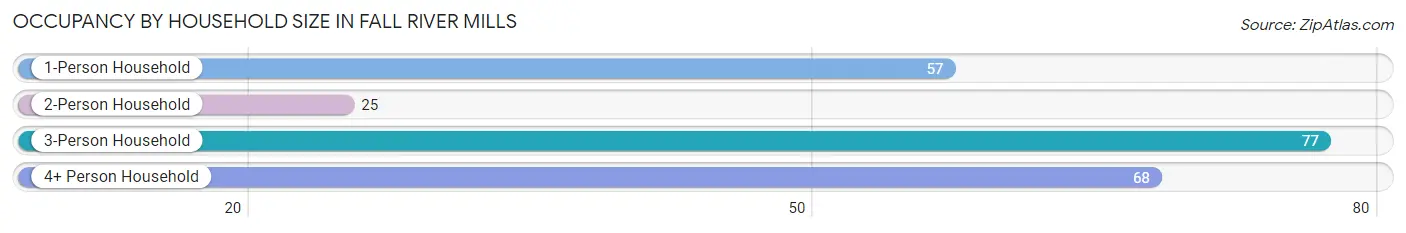
| Household Size | # Housing Units | % Housing Units |
| 1-Person Household | 57 | 25.1% |
| 2-Person Household | 25 | 11.0% |
| 3-Person Household | 77 | 33.9% |
| 4+ Person Household | 68 | 30.0% |
| Total Housing Units | 227 | 100.0% |
Occupancy by Ownership by Household Size in Fall River Mills
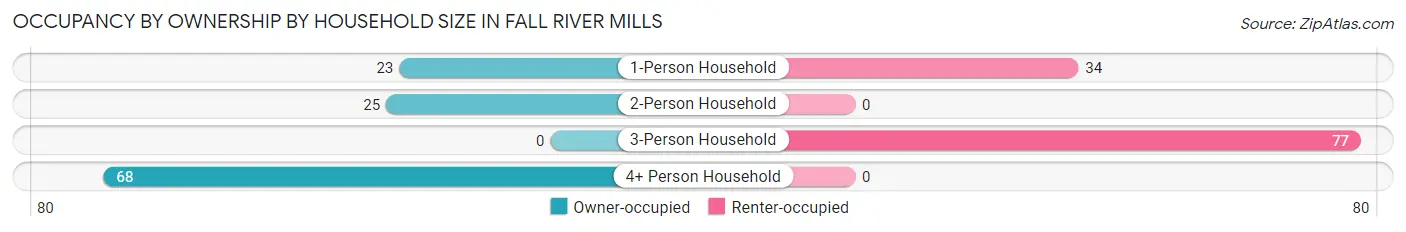
| Household Size | Owner-occupied | Renter-occupied |
| 1-Person Household | 23 (40.4%) | 34 (59.7%) |
| 2-Person Household | 25 (100.0%) | 0 (0.0%) |
| 3-Person Household | 0 (0.0%) | 77 (100.0%) |
| 4+ Person Household | 68 (100.0%) | 0 (0.0%) |
| Total Housing Units | 116 (51.1%) | 111 (48.9%) |
Occupancy by Educational Attainment in Fall River Mills
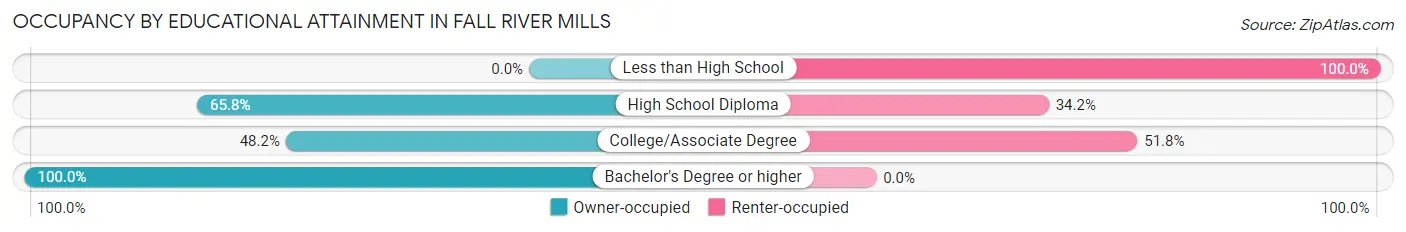
| Household Size | Owner-occupied | Renter-occupied |
| Less than High School | 0 (0.0%) | 25 (100.0%) |
| High School Diploma | 25 (65.8%) | 13 (34.2%) |
| College/Associate Degree | 68 (48.2%) | 73 (51.8%) |
| Bachelor's Degree or higher | 23 (100.0%) | 0 (0.0%) |
Occupancy by Age of Householder in Fall River Mills
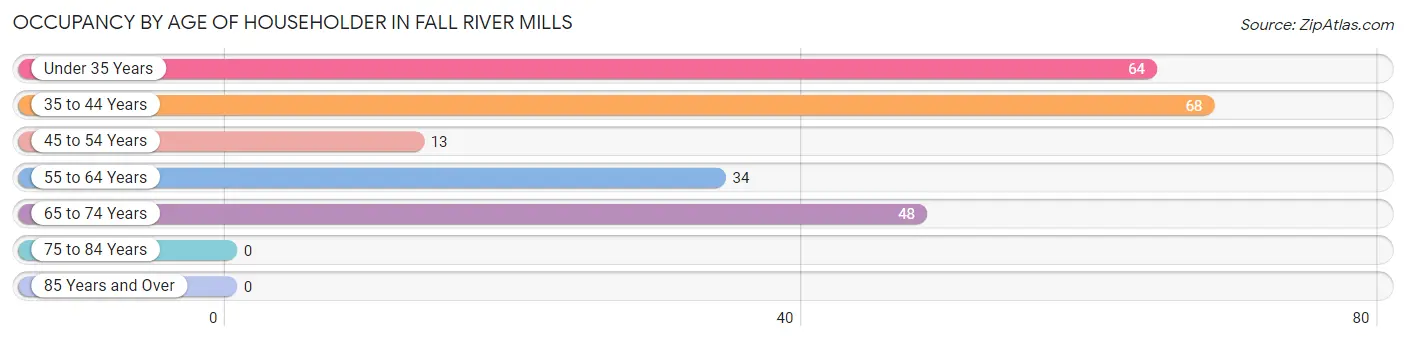
| Age Bracket | # Households | % Households |
| Under 35 Years | 64 | 28.2% |
| 35 to 44 Years | 68 | 30.0% |
| 45 to 54 Years | 13 | 5.7% |
| 55 to 64 Years | 34 | 15.0% |
| 65 to 74 Years | 48 | 21.1% |
| 75 to 84 Years | 0 | 0.0% |
| 85 Years and Over | 0 | 0.0% |
| Total | 227 | 100.0% |
Housing Finances in Fall River Mills
Median Income by Occupancy in Fall River Mills
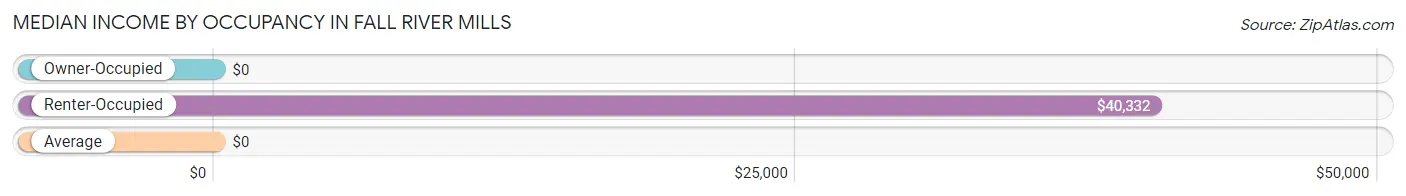
| Occupancy Type | # Households | Median Income |
| Owner-Occupied | 116 (51.1%) | $0 |
| Renter-Occupied | 111 (48.9%) | $40,332 |
| Average | 227 (100.0%) | $0 |
Occupancy by Householder Income Bracket in Fall River Mills
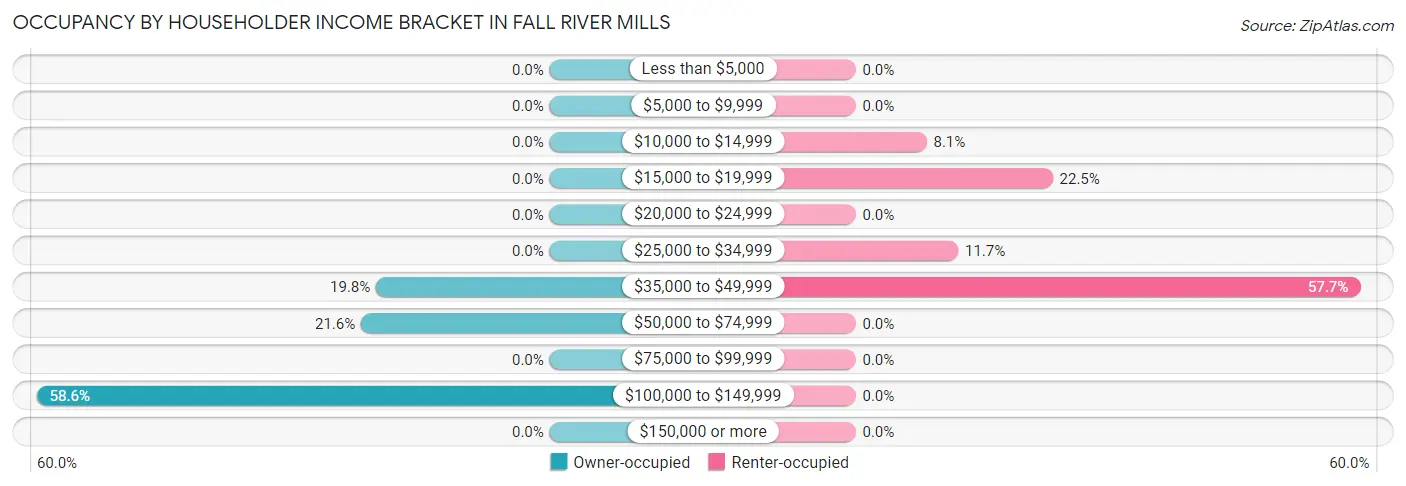
| Income Bracket | Owner-occupied | Renter-occupied |
| Less than $5,000 | 0 (0.0%) | 0 (0.0%) |
| $5,000 to $9,999 | 0 (0.0%) | 0 (0.0%) |
| $10,000 to $14,999 | 0 (0.0%) | 9 (8.1%) |
| $15,000 to $19,999 | 0 (0.0%) | 25 (22.5%) |
| $20,000 to $24,999 | 0 (0.0%) | 0 (0.0%) |
| $25,000 to $34,999 | 0 (0.0%) | 13 (11.7%) |
| $35,000 to $49,999 | 23 (19.8%) | 64 (57.7%) |
| $50,000 to $74,999 | 25 (21.5%) | 0 (0.0%) |
| $75,000 to $99,999 | 0 (0.0%) | 0 (0.0%) |
| $100,000 to $149,999 | 68 (58.6%) | 0 (0.0%) |
| $150,000 or more | 0 (0.0%) | 0 (0.0%) |
| Total | 116 (100.0%) | 111 (100.0%) |
Monthly Housing Cost Tiers in Fall River Mills
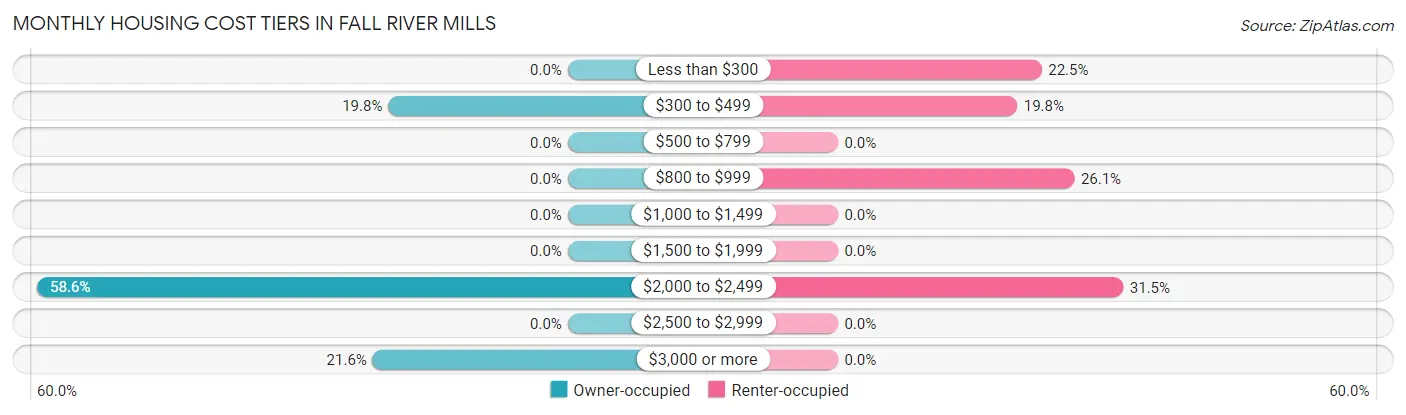
| Monthly Cost | Owner-occupied | Renter-occupied |
| Less than $300 | 0 (0.0%) | 25 (22.5%) |
| $300 to $499 | 23 (19.8%) | 22 (19.8%) |
| $500 to $799 | 0 (0.0%) | 0 (0.0%) |
| $800 to $999 | 0 (0.0%) | 29 (26.1%) |
| $1,000 to $1,499 | 0 (0.0%) | 0 (0.0%) |
| $1,500 to $1,999 | 0 (0.0%) | 0 (0.0%) |
| $2,000 to $2,499 | 68 (58.6%) | 35 (31.5%) |
| $2,500 to $2,999 | 0 (0.0%) | 0 (0.0%) |
| $3,000 or more | 25 (21.5%) | 0 (0.0%) |
| Total | 116 (100.0%) | 111 (100.0%) |
Physical Housing Characteristics in Fall River Mills
Housing Structures in Fall River Mills
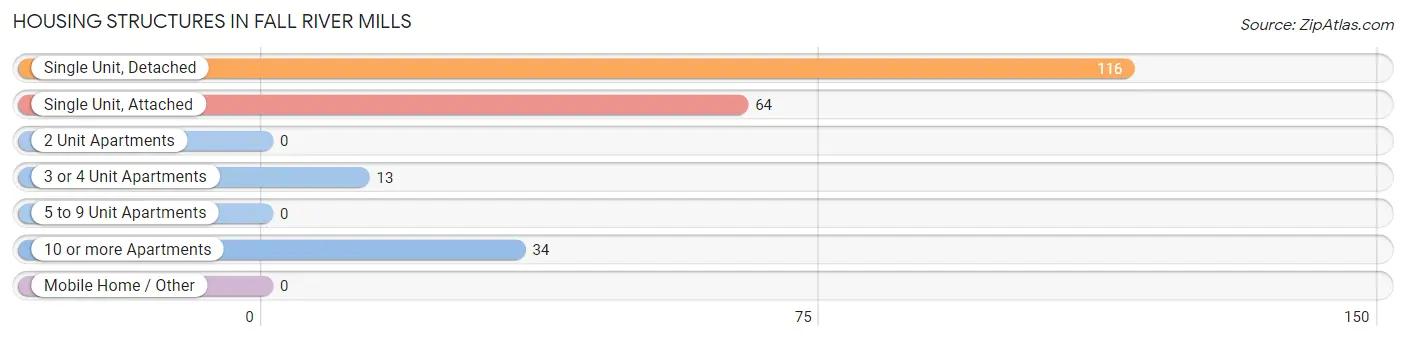
| Structure Type | # Housing Units | % Housing Units |
| Single Unit, Detached | 116 | 51.1% |
| Single Unit, Attached | 64 | 28.2% |
| 2 Unit Apartments | 0 | 0.0% |
| 3 or 4 Unit Apartments | 13 | 5.7% |
| 5 to 9 Unit Apartments | 0 | 0.0% |
| 10 or more Apartments | 34 | 15.0% |
| Mobile Home / Other | 0 | 0.0% |
| Total | 227 | 100.0% |
Housing Structures by Occupancy in Fall River Mills
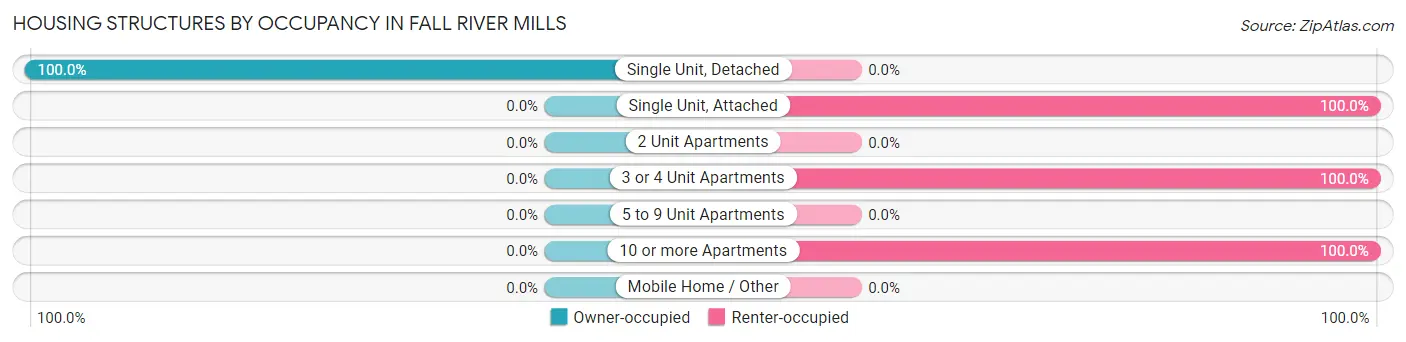
| Structure Type | Owner-occupied | Renter-occupied |
| Single Unit, Detached | 116 (100.0%) | 0 (0.0%) |
| Single Unit, Attached | 0 (0.0%) | 64 (100.0%) |
| 2 Unit Apartments | 0 (0.0%) | 0 (0.0%) |
| 3 or 4 Unit Apartments | 0 (0.0%) | 13 (100.0%) |
| 5 to 9 Unit Apartments | 0 (0.0%) | 0 (0.0%) |
| 10 or more Apartments | 0 (0.0%) | 34 (100.0%) |
| Mobile Home / Other | 0 (0.0%) | 0 (0.0%) |
| Total | 116 (51.1%) | 111 (48.9%) |
Housing Structures by Number of Rooms in Fall River Mills
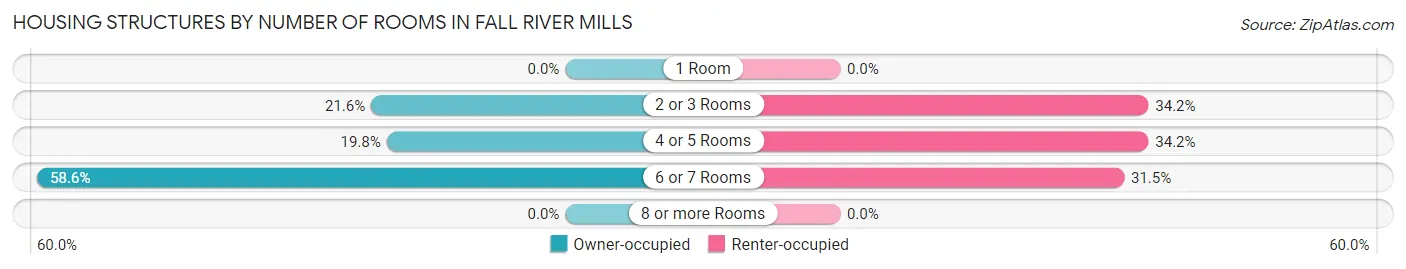
| Number of Rooms | Owner-occupied | Renter-occupied |
| 1 Room | 0 (0.0%) | 0 (0.0%) |
| 2 or 3 Rooms | 25 (21.5%) | 38 (34.2%) |
| 4 or 5 Rooms | 23 (19.8%) | 38 (34.2%) |
| 6 or 7 Rooms | 68 (58.6%) | 35 (31.5%) |
| 8 or more Rooms | 0 (0.0%) | 0 (0.0%) |
| Total | 116 (100.0%) | 111 (100.0%) |
Housing Structure by Heating Type in Fall River Mills
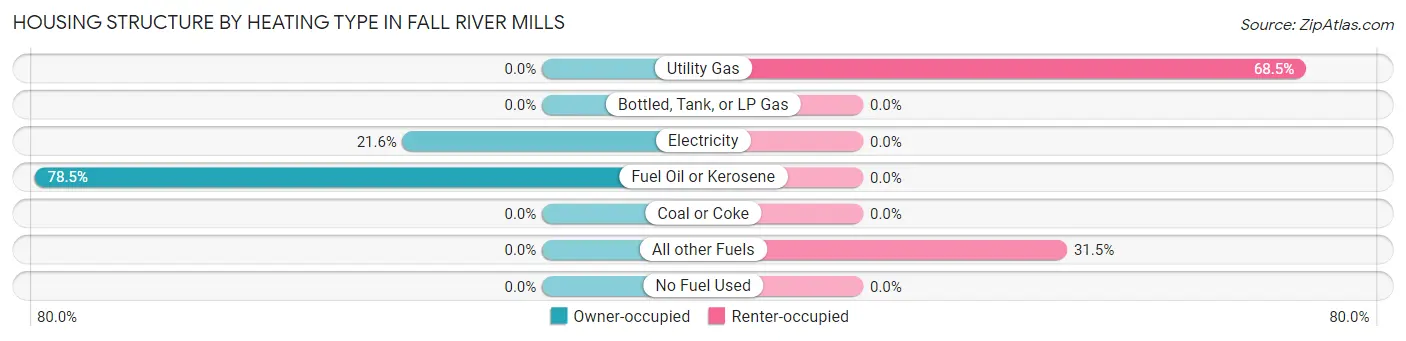
| Heating Type | Owner-occupied | Renter-occupied |
| Utility Gas | 0 (0.0%) | 76 (68.5%) |
| Bottled, Tank, or LP Gas | 0 (0.0%) | 0 (0.0%) |
| Electricity | 25 (21.5%) | 0 (0.0%) |
| Fuel Oil or Kerosene | 91 (78.4%) | 0 (0.0%) |
| Coal or Coke | 0 (0.0%) | 0 (0.0%) |
| All other Fuels | 0 (0.0%) | 35 (31.5%) |
| No Fuel Used | 0 (0.0%) | 0 (0.0%) |
| Total | 116 (100.0%) | 111 (100.0%) |
Household Vehicle Usage in Fall River Mills
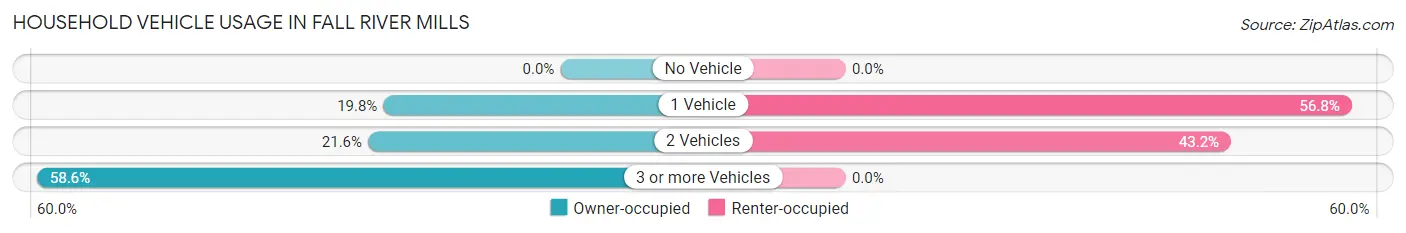
| Vehicles per Household | Owner-occupied | Renter-occupied |
| No Vehicle | 0 (0.0%) | 0 (0.0%) |
| 1 Vehicle | 23 (19.8%) | 63 (56.8%) |
| 2 Vehicles | 25 (21.5%) | 48 (43.2%) |
| 3 or more Vehicles | 68 (58.6%) | 0 (0.0%) |
| Total | 116 (100.0%) | 111 (100.0%) |
Real Estate & Mortgages in Fall River Mills
Real Estate and Mortgage Overview in Fall River Mills
| Characteristic | Without Mortgage | With Mortgage |
| Housing Units | 23 | 93 |
| Median Property Value | - | - |
| Median Household Income | - | - |
| Monthly Housing Costs | - | - |
| Real Estate Taxes | - | - |
Property Value by Mortgage Status in Fall River Mills
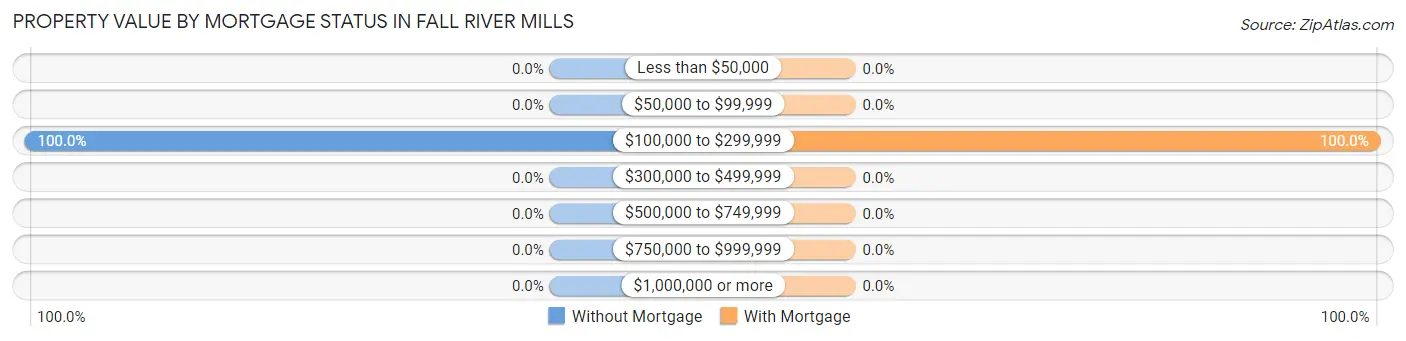
| Property Value | Without Mortgage | With Mortgage |
| Less than $50,000 | 0 (0.0%) | 0 (0.0%) |
| $50,000 to $99,999 | 0 (0.0%) | 0 (0.0%) |
| $100,000 to $299,999 | 23 (100.0%) | 93 (100.0%) |
| $300,000 to $499,999 | 0 (0.0%) | 0 (0.0%) |
| $500,000 to $749,999 | 0 (0.0%) | 0 (0.0%) |
| $750,000 to $999,999 | 0 (0.0%) | 0 (0.0%) |
| $1,000,000 or more | 0 (0.0%) | 0 (0.0%) |
| Total | 23 (100.0%) | 93 (100.0%) |
Household Income by Mortgage Status in Fall River Mills
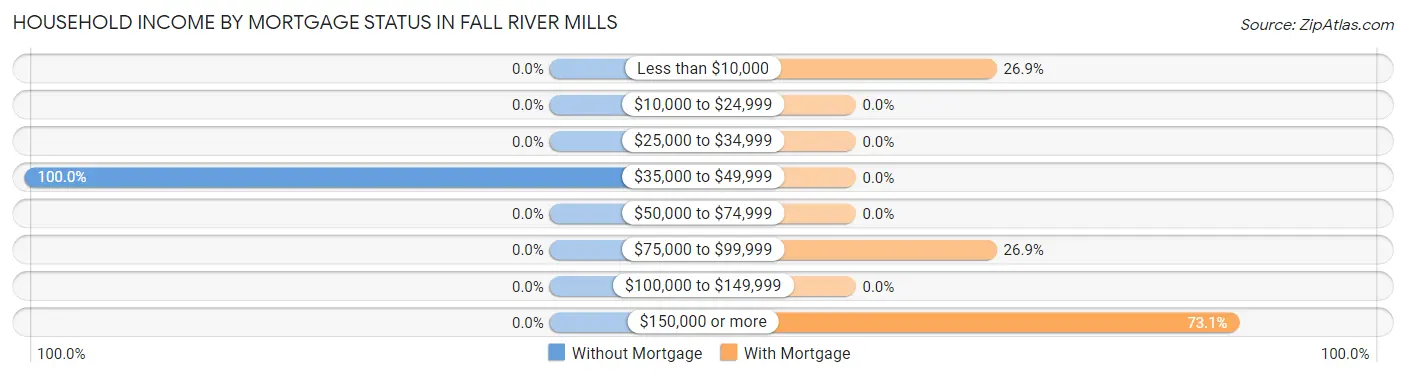
| Household Income | Without Mortgage | With Mortgage |
| Less than $10,000 | 0 (0.0%) | 25 (26.9%) |
| $10,000 to $24,999 | 0 (0.0%) | 0 (0.0%) |
| $25,000 to $34,999 | 0 (0.0%) | 0 (0.0%) |
| $35,000 to $49,999 | 23 (100.0%) | 0 (0.0%) |
| $50,000 to $74,999 | 0 (0.0%) | 0 (0.0%) |
| $75,000 to $99,999 | 0 (0.0%) | 25 (26.9%) |
| $100,000 to $149,999 | 0 (0.0%) | 0 (0.0%) |
| $150,000 or more | 0 (0.0%) | 68 (73.1%) |
| Total | 23 (100.0%) | 93 (100.0%) |
Property Value to Household Income Ratio in Fall River Mills
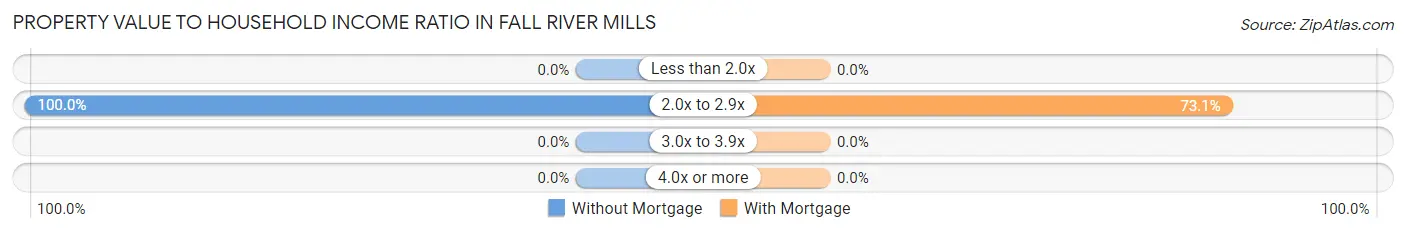
| Value-to-Income Ratio | Without Mortgage | With Mortgage |
| Less than 2.0x | 0 (0.0%) | 0 (0.0%) |
| 2.0x to 2.9x | 23 (100.0%) | 68 (73.1%) |
| 3.0x to 3.9x | 0 (0.0%) | 0 (0.0%) |
| 4.0x or more | 0 (0.0%) | 0 (0.0%) |
| Total | 23 (100.0%) | 93 (100.0%) |
Real Estate Taxes by Mortgage Status in Fall River Mills
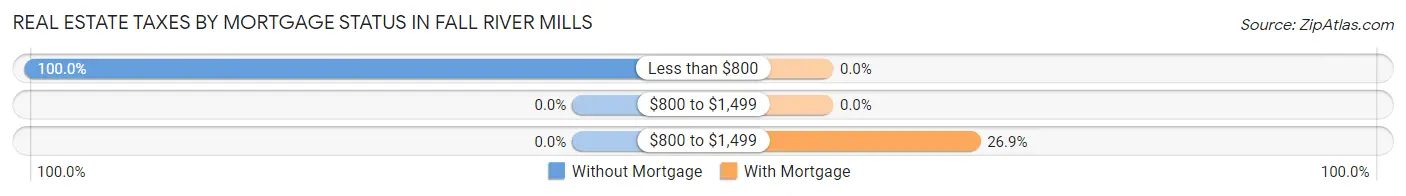
| Property Taxes | Without Mortgage | With Mortgage |
| Less than $800 | 23 (100.0%) | 0 (0.0%) |
| $800 to $1,499 | 0 (0.0%) | 0 (0.0%) |
| $800 to $1,499 | 0 (0.0%) | 25 (26.9%) |
| Total | 23 (100.0%) | 93 (100.0%) |
Health & Disability in Fall River Mills
Health Insurance Coverage by Age in Fall River Mills
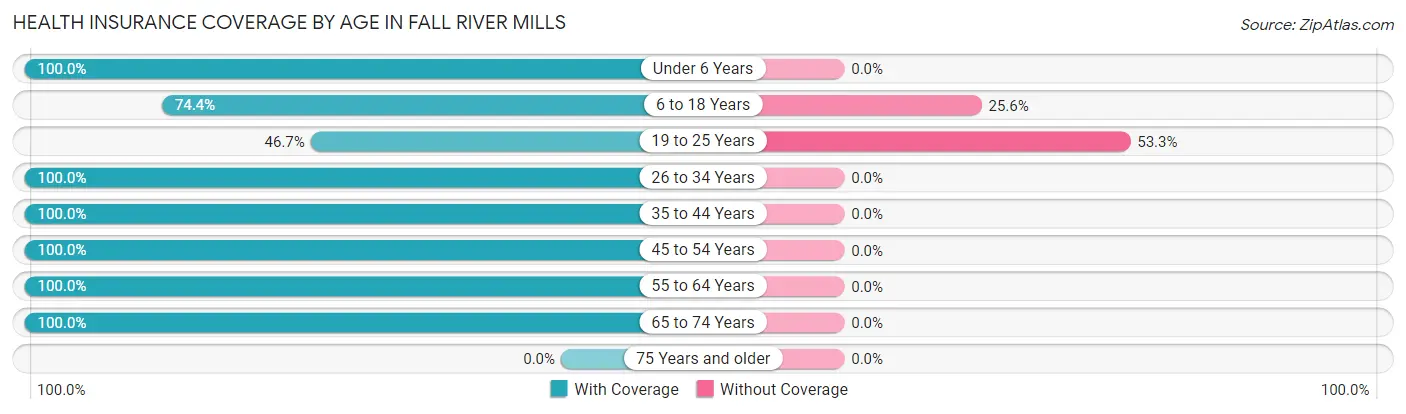
| Age Bracket | With Coverage | Without Coverage |
| Under 6 Years | 130 (100.0%) | 0 (0.0%) |
| 6 to 18 Years | 125 (74.4%) | 43 (25.6%) |
| 19 to 25 Years | 7 (46.7%) | 8 (53.3%) |
| 26 to 34 Years | 63 (100.0%) | 0 (0.0%) |
| 35 to 44 Years | 98 (100.0%) | 0 (0.0%) |
| 45 to 54 Years | 13 (100.0%) | 0 (0.0%) |
| 55 to 64 Years | 34 (100.0%) | 0 (0.0%) |
| 65 to 74 Years | 72 (100.0%) | 0 (0.0%) |
| 75 Years and older | 0 (0.0%) | 0 (0.0%) |
| Total | 542 (91.4%) | 51 (8.6%) |
Health Insurance Coverage by Citizenship Status in Fall River Mills
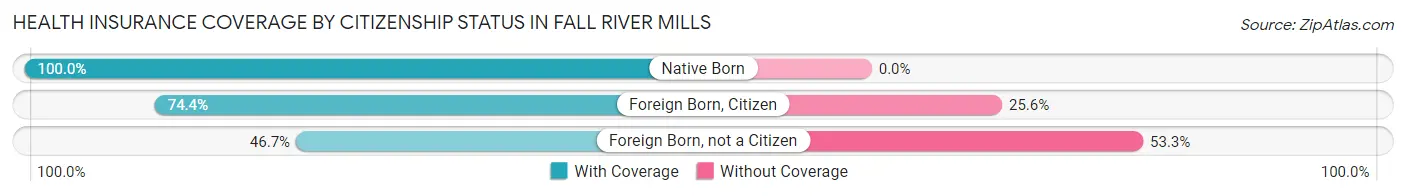
| Citizenship Status | With Coverage | Without Coverage |
| Native Born | 130 (100.0%) | 0 (0.0%) |
| Foreign Born, Citizen | 125 (74.4%) | 43 (25.6%) |
| Foreign Born, not a Citizen | 7 (46.7%) | 8 (53.3%) |
Health Insurance Coverage by Household Income in Fall River Mills
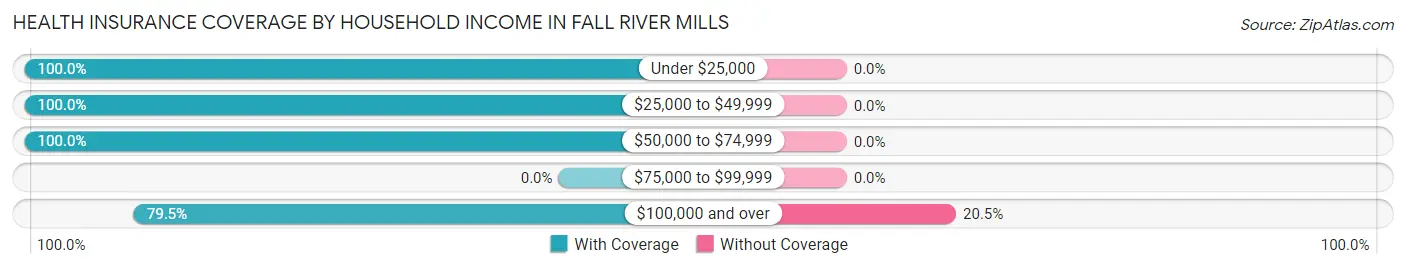
| Household Income | With Coverage | Without Coverage |
| Under $25,000 | 34 (100.0%) | 0 (0.0%) |
| $25,000 to $49,999 | 285 (100.0%) | 0 (0.0%) |
| $50,000 to $74,999 | 49 (100.0%) | 0 (0.0%) |
| $75,000 to $99,999 | 0 (0.0%) | 0 (0.0%) |
| $100,000 and over | 167 (79.5%) | 43 (20.5%) |
Public vs Private Health Insurance Coverage by Age in Fall River Mills
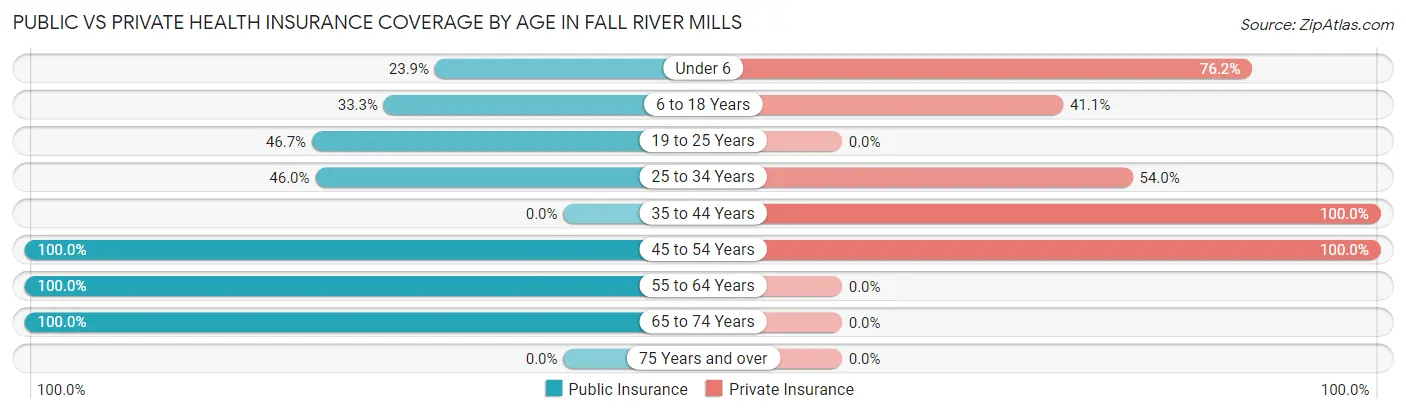
| Age Bracket | Public Insurance | Private Insurance |
| Under 6 | 31 (23.8%) | 99 (76.1%) |
| 6 to 18 Years | 56 (33.3%) | 69 (41.1%) |
| 19 to 25 Years | 7 (46.7%) | 0 (0.0%) |
| 25 to 34 Years | 29 (46.0%) | 34 (54.0%) |
| 35 to 44 Years | 0 (0.0%) | 98 (100.0%) |
| 45 to 54 Years | 13 (100.0%) | 13 (100.0%) |
| 55 to 64 Years | 34 (100.0%) | 0 (0.0%) |
| 65 to 74 Years | 72 (100.0%) | 0 (0.0%) |
| 75 Years and over | 0 (0.0%) | 0 (0.0%) |
| Total | 242 (40.8%) | 313 (52.8%) |
Disability Status by Sex by Age in Fall River Mills
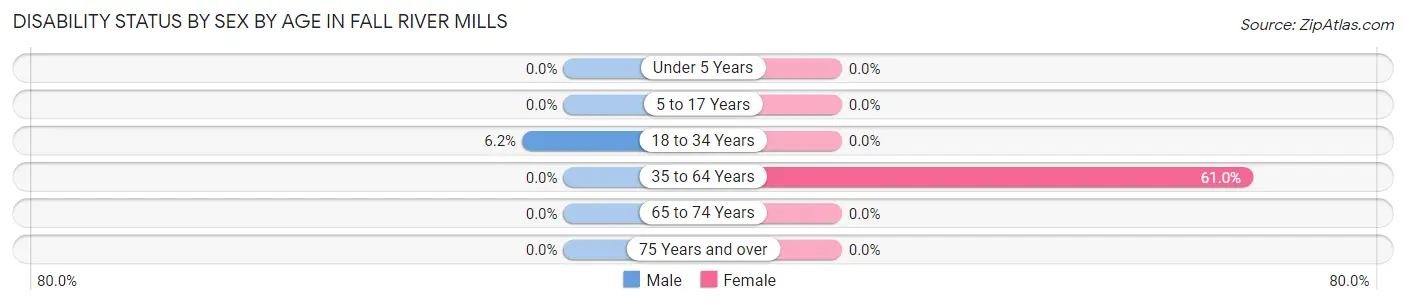
| Age Bracket | Male | Female |
| Under 5 Years | 0 (0.0%) | 0 (0.0%) |
| 5 to 17 Years | 0 (0.0%) | 0 (0.0%) |
| 18 to 34 Years | 8 (6.1%) | 0 (0.0%) |
| 35 to 64 Years | 0 (0.0%) | 47 (61.0%) |
| 65 to 74 Years | 0 (0.0%) | 0 (0.0%) |
| 75 Years and over | 0 (0.0%) | 0 (0.0%) |
Disability Class by Sex by Age in Fall River Mills
Disability Class: Hearing Difficulty
| Age Bracket | Male | Female |
| Under 5 Years | 0 (0.0%) | 0 (0.0%) |
| 5 to 17 Years | 0 (0.0%) | 0 (0.0%) |
| 18 to 34 Years | 0 (0.0%) | 0 (0.0%) |
| 35 to 64 Years | 0 (0.0%) | 0 (0.0%) |
| 65 to 74 Years | 0 (0.0%) | 0 (0.0%) |
| 75 Years and over | 0 (0.0%) | 0 (0.0%) |
Disability Class: Vision Difficulty
| Age Bracket | Male | Female |
| Under 5 Years | 0 (0.0%) | 0 (0.0%) |
| 5 to 17 Years | 0 (0.0%) | 0 (0.0%) |
| 18 to 34 Years | 0 (0.0%) | 0 (0.0%) |
| 35 to 64 Years | 0 (0.0%) | 0 (0.0%) |
| 65 to 74 Years | 0 (0.0%) | 0 (0.0%) |
| 75 Years and over | 0 (0.0%) | 0 (0.0%) |
Disability Class: Cognitive Difficulty
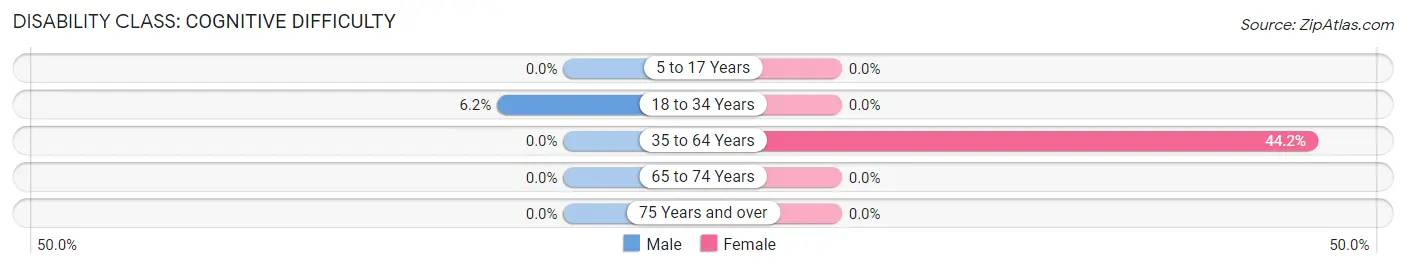
| Age Bracket | Male | Female |
| 5 to 17 Years | 0 (0.0%) | 0 (0.0%) |
| 18 to 34 Years | 8 (6.1%) | 0 (0.0%) |
| 35 to 64 Years | 0 (0.0%) | 34 (44.2%) |
| 65 to 74 Years | 0 (0.0%) | 0 (0.0%) |
| 75 Years and over | 0 (0.0%) | 0 (0.0%) |
Disability Class: Ambulatory Difficulty
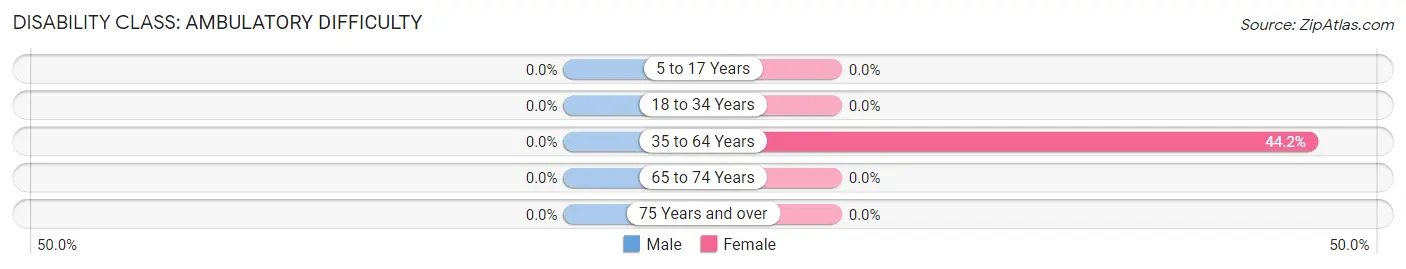
| Age Bracket | Male | Female |
| 5 to 17 Years | 0 (0.0%) | 0 (0.0%) |
| 18 to 34 Years | 0 (0.0%) | 0 (0.0%) |
| 35 to 64 Years | 0 (0.0%) | 34 (44.2%) |
| 65 to 74 Years | 0 (0.0%) | 0 (0.0%) |
| 75 Years and over | 0 (0.0%) | 0 (0.0%) |
Disability Class: Self-Care Difficulty
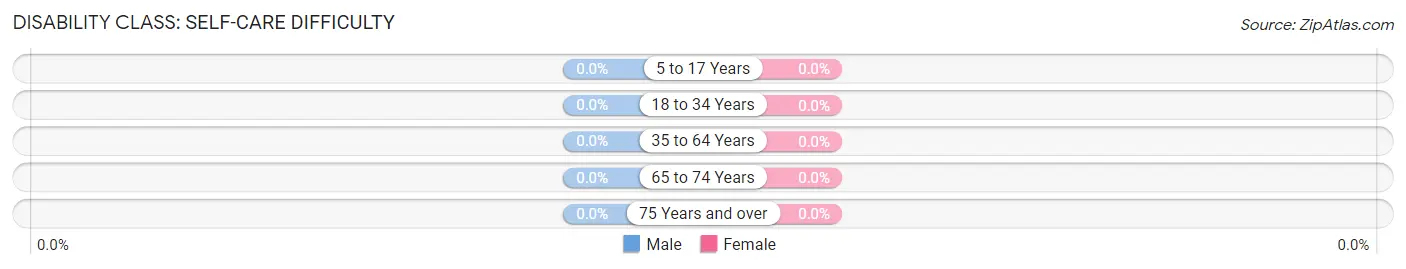
| Age Bracket | Male | Female |
| 5 to 17 Years | 0 (0.0%) | 0 (0.0%) |
| 18 to 34 Years | 0 (0.0%) | 0 (0.0%) |
| 35 to 64 Years | 0 (0.0%) | 0 (0.0%) |
| 65 to 74 Years | 0 (0.0%) | 0 (0.0%) |
| 75 Years and over | 0 (0.0%) | 0 (0.0%) |
Technology Access in Fall River Mills
Computing Device Access in Fall River Mills
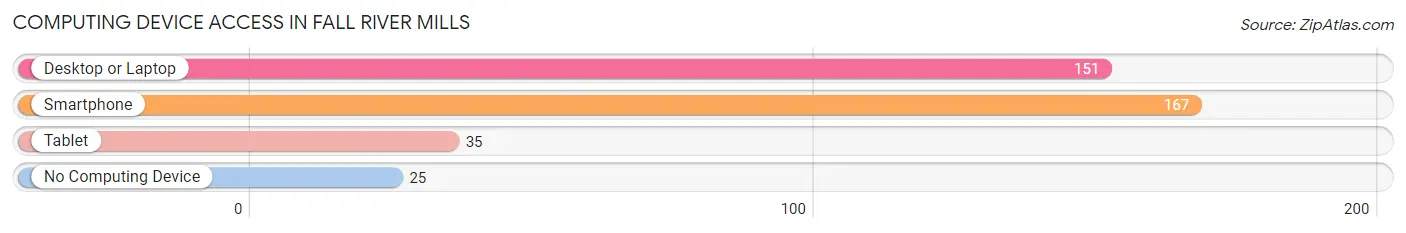
| Device Type | # Households | % Households |
| Desktop or Laptop | 151 | 66.5% |
| Smartphone | 167 | 73.6% |
| Tablet | 35 | 15.4% |
| No Computing Device | 25 | 11.0% |
| Total | 227 | 100.0% |
Internet Access in Fall River Mills
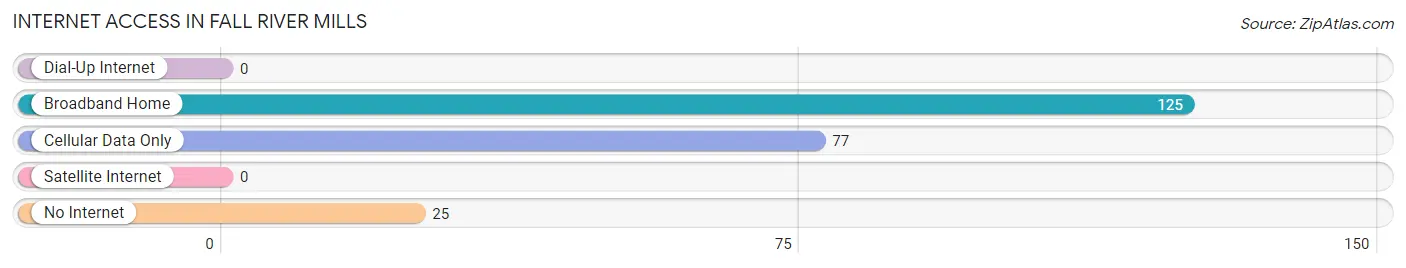
| Internet Type | # Households | % Households |
| Dial-Up Internet | 0 | 0.0% |
| Broadband Home | 125 | 55.1% |
| Cellular Data Only | 77 | 33.9% |
| Satellite Internet | 0 | 0.0% |
| No Internet | 25 | 11.0% |
| Total | 227 | 100.0% |
Fall River Mills Summary
Introduction
Fall River Mills is a small unincorporated community located in Shasta County, California. It is situated in the northeastern corner of the state, near the Oregon border. The town is located along the Fall River, which is a tributary of the Pit River. The population of Fall River Mills was 544 in the 2010 census.
History
The area around Fall River Mills was first inhabited by the Achomawi and Atsugewi Native American tribes. The first non-native settlers arrived in the area in the late 1850s. The town was founded in 1878 by William B. Ide, who named it after the nearby Fall River. Ide was a former California governor and a leader of the California Bear Flag Revolt of 1846.
The town grew quickly, and by the early 1900s it had become a major agricultural center. It was known for its production of wheat, barley, oats, and hay. The town also had a thriving lumber industry, with several sawmills located in the area.
In the 1920s, the town was connected to the outside world by the construction of a railroad line. This allowed for the shipment of goods and people to and from the town. The railroad line was eventually abandoned in the 1950s.
Geography
Fall River Mills is located in the northeastern corner of California, near the Oregon border. It is situated in the Fall River Valley, which is surrounded by the Cascade Range to the east and the Sierra Nevada to the west. The town is located along the Fall River, which is a tributary of the Pit River.
The climate in Fall River Mills is semi-arid, with hot summers and cold winters. The average annual temperature is around 50°F (10°C). The average annual precipitation is around 15 inches (380 mm).
Economy
The economy of Fall River Mills is largely based on agriculture and tourism. The town is known for its production of wheat, barley, oats, and hay. It is also home to several wineries and a craft brewery.
Tourism is an important part of the local economy. The town is a popular destination for fishing, hunting, and camping. It is also home to several popular attractions, such as the Fall River Mills Airport, the Fall River Valley Museum, and the Fall River Wild Horse Sanctuary.
Demographics
As of the 2010 census, the population of Fall River Mills was 544. The racial makeup of the town was 94.2% White, 0.2% African American, 0.9% Native American, 0.4% Asian, 0.2% Pacific Islander, 1.3% from other races, and 2.9% from two or more races. Hispanic or Latino of any race were 4.3% of the population.
The median income for a household in Fall River Mills was $35,417, and the median income for a family was $41,250. The per capita income for the town was $17,845. About 11.2% of families and 14.2% of the population were below the poverty line, including 18.2% of those under age 18 and 8.3% of those age 65 or over.
Conclusion
Fall River Mills is a small unincorporated community located in Shasta County, California. It is situated in the northeastern corner of the state, near the Oregon border. The town is located along the Fall River, which is a tributary of the Pit River. The population of Fall River Mills was 544 in the 2010 census. The economy of Fall River Mills is largely based on agriculture and tourism. The town is known for its production of wheat, barley, oats, and hay. It is also home to several wineries and a craft brewery. Tourism is an important part of the local economy. The racial makeup of the town was 94.2% White, 0.2% African American, 0.9% Native American, 0.4% Asian, 0.2% Pacific Islander, 1.3% from other races, and 2.9% from two or more races. The median income for a household in Fall River Mills was $35,417, and the median income for a family was $41,250.
Common Questions
What is Per Capita Income in Fall River Mills?
Per Capita income in Fall River Mills is $20,668.
What is Inequality or Gini Index in Fall River Mills?
Inequality or Gini Index in Fall River Mills is 0.37.
What is the Total Population of Fall River Mills?
Total Population of Fall River Mills is 678.
What is the Total Male Population of Fall River Mills?
Total Male Population of Fall River Mills is 331.
What is the Total Female Population of Fall River Mills?
Total Female Population of Fall River Mills is 347.
What is the Ratio of Males per 100 Females in Fall River Mills?
There are 95.39 Males per 100 Females in Fall River Mills.
What is the Ratio of Females per 100 Males in Fall River Mills?
There are 104.83 Females per 100 Males in Fall River Mills.
What is the Median Population Age in Fall River Mills?
Median Population Age in Fall River Mills is 27.7 Years.
What is the Average Family Size in Fall River Mills
Average Family Size in Fall River Mills is 3.3 People.
What is the Average Household Size in Fall River Mills
Average Household Size in Fall River Mills is 2.7 People.
How Large is the Labor Force in Fall River Mills?
There are 242 People in the Labor Forcein in Fall River Mills.
What is the Percentage of People in the Labor Force in Fall River Mills?
48.2% of People are in the Labor Force in Fall River Mills.
What is the Unemployment Rate in Fall River Mills?
Unemployment Rate in Fall River Mills is 25.1%.