Phillipstown, IL Map & Demographics
Phillipstown Map
Phillipstown Overview
$28,129
PER CAPITA INCOME
0.45
INEQUALITY / GINI INDEX
48
TOTAL POPULATION
37
MALE POPULATION
11
FEMALE POPULATION
336.36
MALES / 100 FEMALES
29.73
FEMALES / 100 MALES
30.5
MEDIAN AGE
2.6
AVG FAMILY SIZE
2.3
AVG HOUSEHOLD SIZE
22
LABOR FORCE [ PEOPLE ]
50.0%
PERCENT IN LABOR FORCE
Income in Phillipstown
Income Overview in Phillipstown
| Characteristic | Number | Measure |
| Per Capita Income | 48 | $28,129 |
| Median Family Income | 17 | $0 |
| Mean Family Income | 17 | $70,500 |
| Median Household Income | 21 | $0 |
| Mean Household Income | 21 | $68,233 |
| Income Deficit | 17 | $0 |
| Wage / Income Gap (%) | 48 | 0.00% |
| Wage / Income Gap ($) | 48 | 100.00¢ per $1 |
| Gini / Inequality Index | 48 | 0.45 |
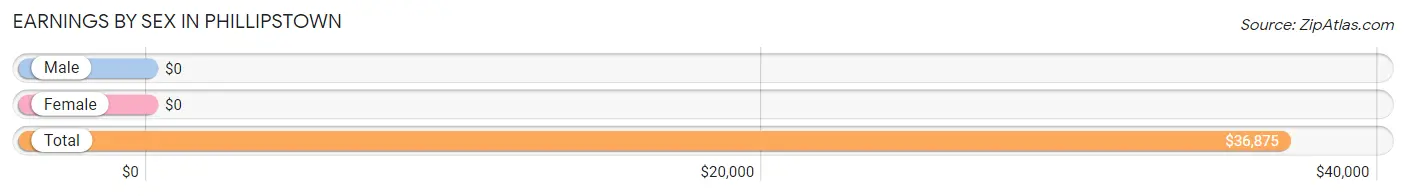
Earnings by Sex in Phillipstown
| Sex | Number | Average Earnings |
| Male | 18 (81.8%) | $0 |
| Female | 4 (18.2%) | $0 |
| Total | 22 (100.0%) | $36,875 |
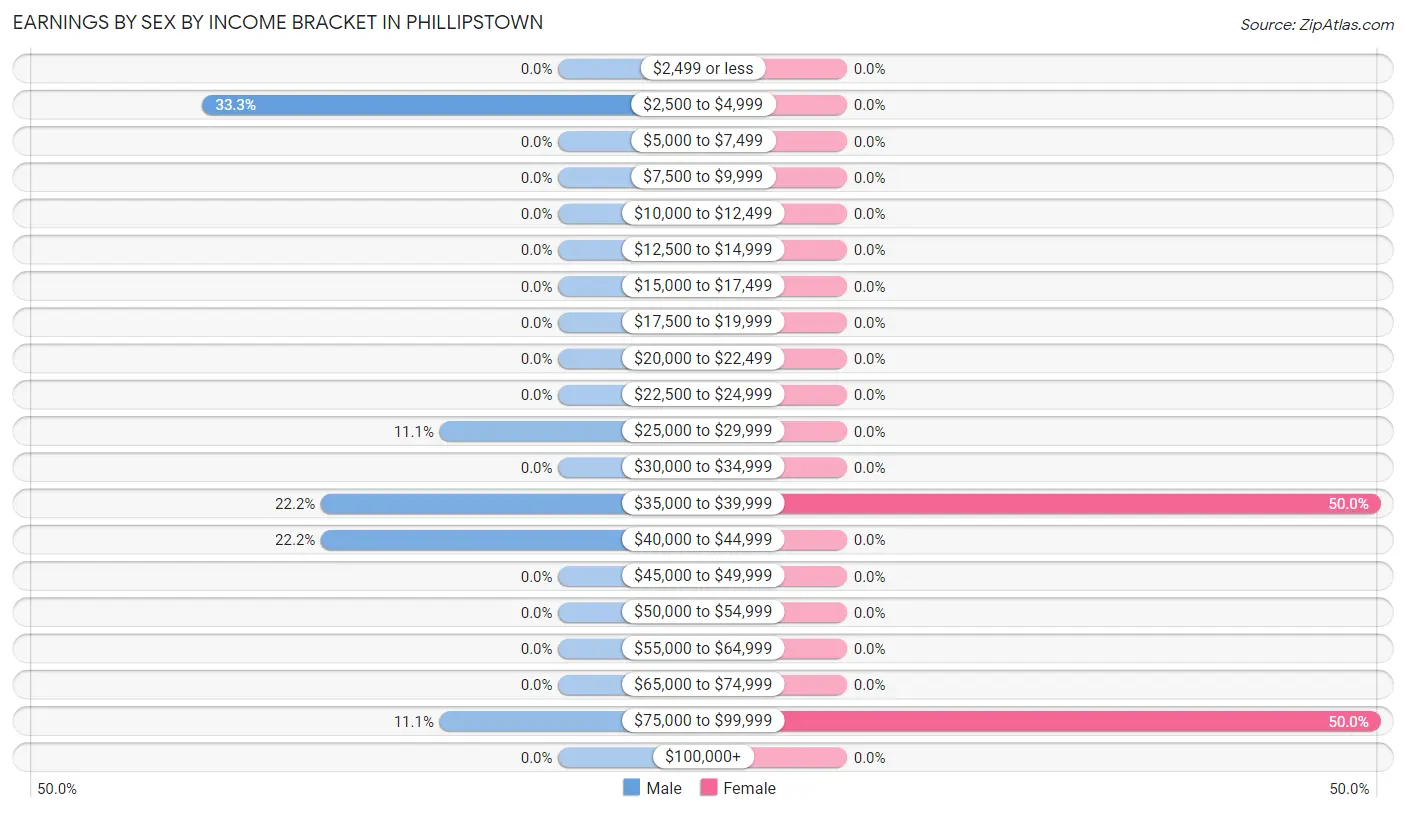
Earnings by Sex by Income Bracket in Phillipstown
The most common earnings brackets in Phillipstown are $2,500 to $4,999 for men (6 | 33.3%) and $35,000 to $39,999 for women (2 | 50.0%).
| Income | Male | Female |
| $2,499 or less | 0 (0.0%) | 0 (0.0%) |
| $2,500 to $4,999 | 6 (33.3%) | 0 (0.0%) |
| $5,000 to $7,499 | 0 (0.0%) | 0 (0.0%) |
| $7,500 to $9,999 | 0 (0.0%) | 0 (0.0%) |
| $10,000 to $12,499 | 0 (0.0%) | 0 (0.0%) |
| $12,500 to $14,999 | 0 (0.0%) | 0 (0.0%) |
| $15,000 to $17,499 | 0 (0.0%) | 0 (0.0%) |
| $17,500 to $19,999 | 0 (0.0%) | 0 (0.0%) |
| $20,000 to $22,499 | 0 (0.0%) | 0 (0.0%) |
| $22,500 to $24,999 | 0 (0.0%) | 0 (0.0%) |
| $25,000 to $29,999 | 2 (11.1%) | 0 (0.0%) |
| $30,000 to $34,999 | 0 (0.0%) | 0 (0.0%) |
| $35,000 to $39,999 | 4 (22.2%) | 2 (50.0%) |
| $40,000 to $44,999 | 4 (22.2%) | 0 (0.0%) |
| $45,000 to $49,999 | 0 (0.0%) | 0 (0.0%) |
| $50,000 to $54,999 | 0 (0.0%) | 0 (0.0%) |
| $55,000 to $64,999 | 0 (0.0%) | 0 (0.0%) |
| $65,000 to $74,999 | 0 (0.0%) | 0 (0.0%) |
| $75,000 to $99,999 | 2 (11.1%) | 2 (50.0%) |
| $100,000+ | 0 (0.0%) | 0 (0.0%) |
| Total | 18 (100.0%) | 4 (100.0%) |
Earnings by Sex by Educational Attainment in Phillipstown
| Educational Attainment | Male Income | Female Income |
| Less than High School | - | - |
| High School Diploma | - | - |
| College or Associate's Degree | - | - |
| Bachelor's Degree | - | - |
| Graduate Degree | - | - |
| Total | - | - |
Family Income in Phillipstown
Family Income Brackets in Phillipstown
According to the Phillipstown family income data, there are 6 families falling into the less than $10,000 income range, which is the most common income bracket and makes up 35.3% of all families.
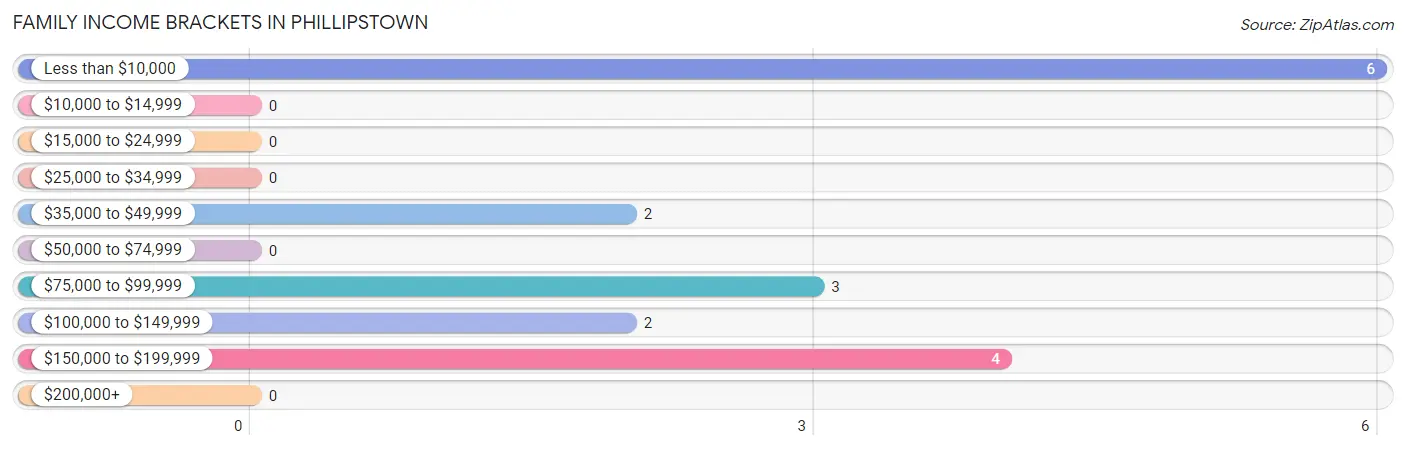
| Income Bracket | # Families | % Families |
| Less than $10,000 | 6 | 35.3% |
| $10,000 to $14,999 | 0 | 0.0% |
| $15,000 to $24,999 | 0 | 0.0% |
| $25,000 to $34,999 | 0 | 0.0% |
| $35,000 to $49,999 | 2 | 11.8% |
| $50,000 to $74,999 | 0 | 0.0% |
| $75,000 to $99,999 | 3 | 17.6% |
| $100,000 to $149,999 | 2 | 11.8% |
| $150,000 to $199,999 | 4 | 23.5% |
| $200,000+ | 0 | 0.0% |
Family Income by Famaliy Size in Phillipstown
| Income Bracket | # Families | Median Income |
| 2-Person Families | 13 (76.5%) | $0 |
| 3-Person Families | 2 (11.8%) | $0 |
| 4-Person Families | 2 (11.8%) | $0 |
| 5-Person Families | 0 (0.0%) | $0 |
| 6-Person Families | 0 (0.0%) | $0 |
| 7+ Person Families | 0 (0.0%) | $0 |
| Total | 17 (100.0%) | $0 |
Family Income by Number of Earners in Phillipstown
| Number of Earners | # Families | Median Income |
| No Earners | 0 (0.0%) | $0 |
| 1 Earner | 15 (88.2%) | $0 |
| 2 Earners | 2 (11.8%) | $0 |
| 3+ Earners | 0 (0.0%) | $0 |
| Total | 17 (100.0%) | $0 |
Household Income in Phillipstown
Household Income Brackets in Phillipstown
With 6 households falling in the category, the less than $10,000 income range is the most frequent in Phillipstown, accounting for 28.6% of all households.
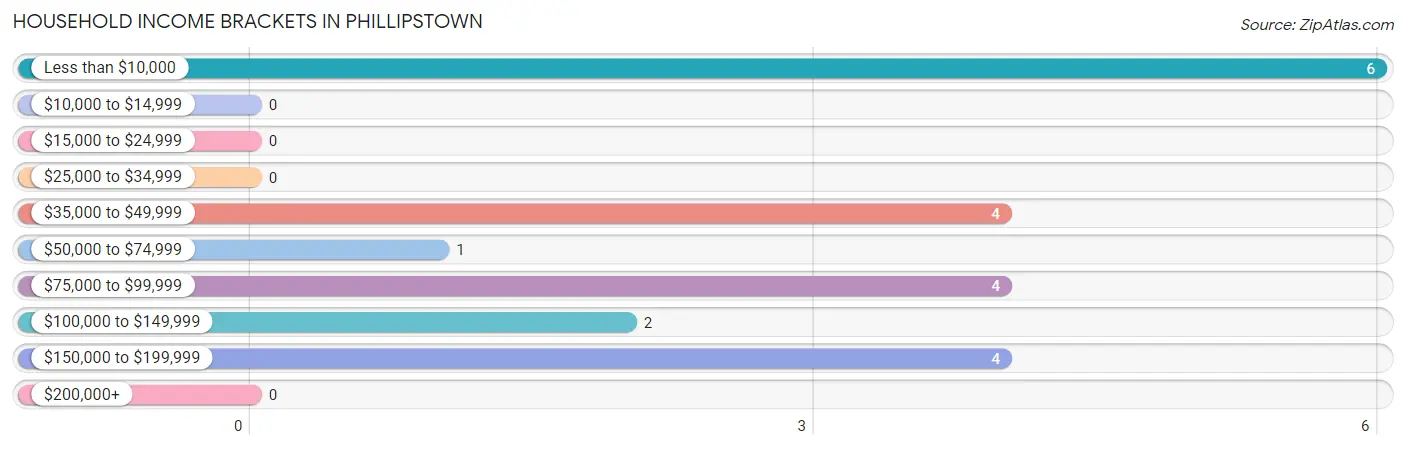
| Income Bracket | # Households | % Households |
| Less than $10,000 | 6 | 28.6% |
| $10,000 to $14,999 | 0 | 0.0% |
| $15,000 to $24,999 | 0 | 0.0% |
| $25,000 to $34,999 | 0 | 0.0% |
| $35,000 to $49,999 | 4 | 19.0% |
| $50,000 to $74,999 | 1 | 4.8% |
| $75,000 to $99,999 | 4 | 19.0% |
| $100,000 to $149,999 | 2 | 9.5% |
| $150,000 to $199,999 | 4 | 19.0% |
| $200,000+ | 0 | 0.0% |
Household Income by Householder Age in Phillipstown
The median household income in Phillipstown is $0, with the highest median household income of $125,000 found in the 65+ years age bracket for the primary householder. A total of 4 households (19.1%) fall into this category. Meanwhile, the 15 to 24 years age bracket for the primary householder has the lowest median household income of $0, with 2 households (9.5%) in this group.
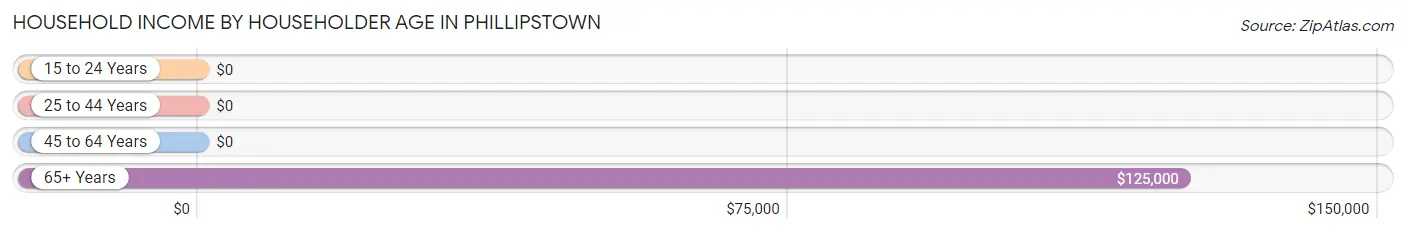
| Income Bracket | # Households | Median Income |
| 15 to 24 Years | 2 (9.5%) | $0 |
| 25 to 44 Years | 2 (9.5%) | $0 |
| 45 to 64 Years | 13 (61.9%) | $0 |
| 65+ Years | 4 (19.1%) | $125,000 |
| Total | 21 (100.0%) | $0 |
Poverty in Phillipstown
Income Below Poverty by Sex and Age in Phillipstown
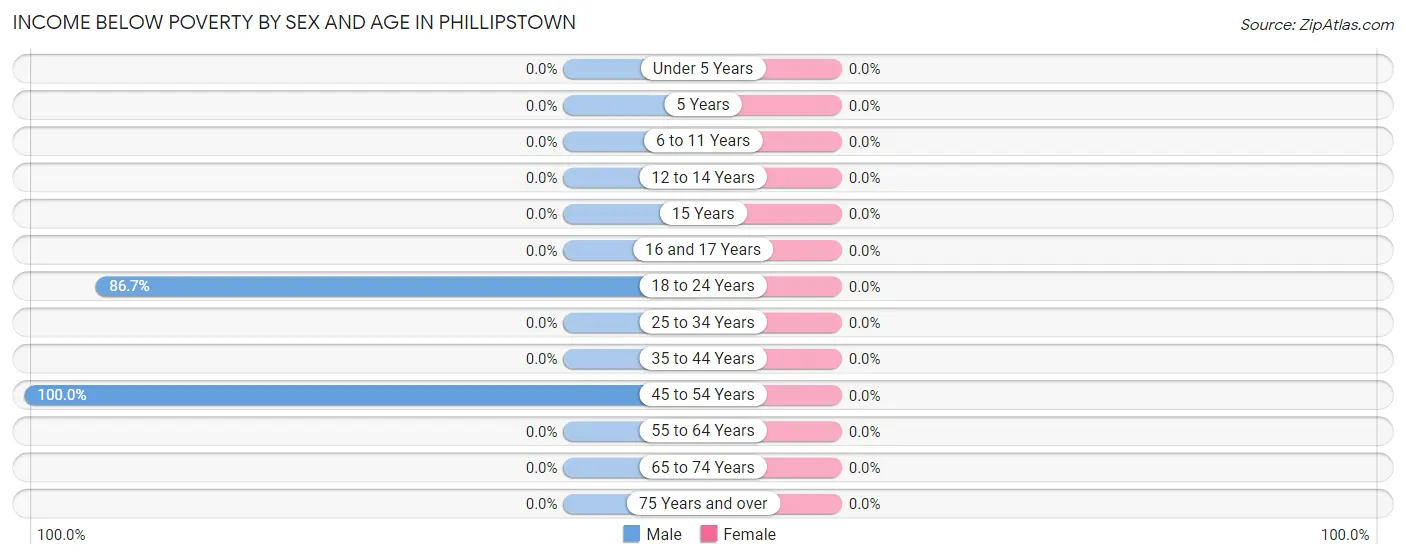
| Age Bracket | Male | Female |
| Under 5 Years | 0 (0.0%) | 0 (0.0%) |
| 5 Years | 0 (0.0%) | 0 (0.0%) |
| 6 to 11 Years | 0 (0.0%) | 0 (0.0%) |
| 12 to 14 Years | 0 (0.0%) | 0 (0.0%) |
| 15 Years | 0 (0.0%) | 0 (0.0%) |
| 16 and 17 Years | 0 (0.0%) | 0 (0.0%) |
| 18 to 24 Years | 13 (86.7%) | 0 (0.0%) |
| 25 to 34 Years | 0 (0.0%) | 0 (0.0%) |
| 35 to 44 Years | 0 (0.0%) | 0 (0.0%) |
| 45 to 54 Years | 6 (100.0%) | 0 (0.0%) |
| 55 to 64 Years | 0 (0.0%) | 0 (0.0%) |
| 65 to 74 Years | 0 (0.0%) | 0 (0.0%) |
| 75 Years and over | 0 (0.0%) | 0 (0.0%) |
| Total | 19 (51.3%) | 0 (0.0%) |
Income Above Poverty by Sex and Age in Phillipstown
According to the poverty statistics in Phillipstown, males aged 6 to 11 years and females aged 6 to 11 years are the age groups that are most secure financially, with 100.0% of males and 100.0% of females in these age groups living above the poverty line.
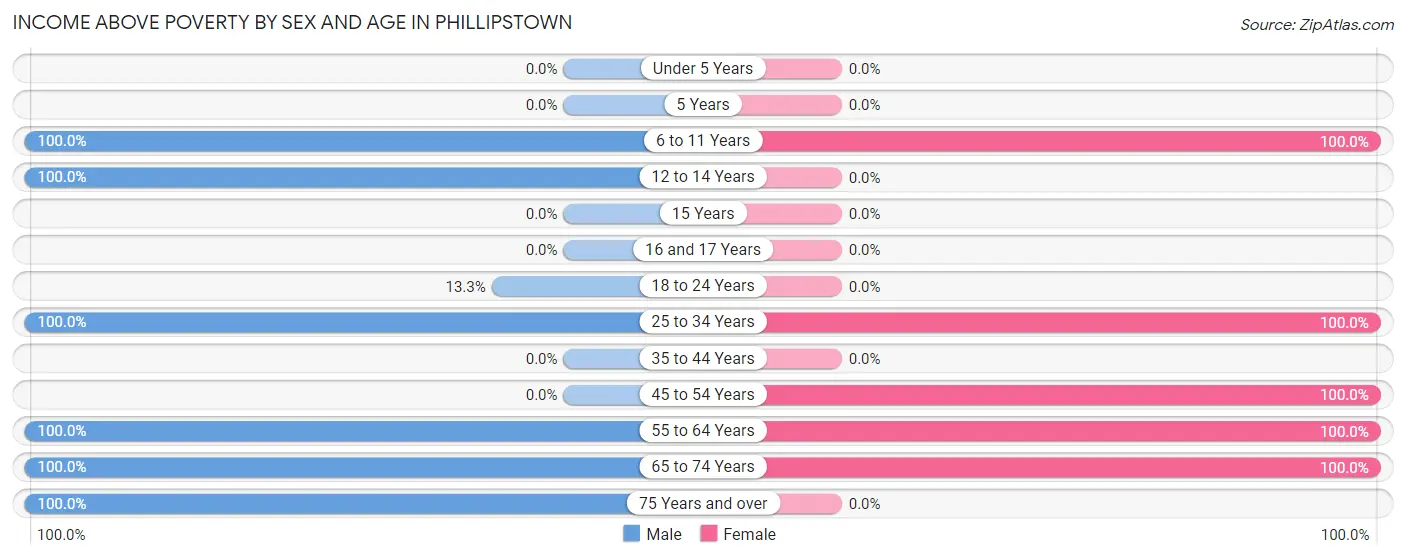
| Age Bracket | Male | Female |
| Under 5 Years | 0 (0.0%) | 0 (0.0%) |
| 5 Years | 0 (0.0%) | 0 (0.0%) |
| 6 to 11 Years | 2 (100.0%) | 1 (100.0%) |
| 12 to 14 Years | 1 (100.0%) | 0 (0.0%) |
| 15 Years | 0 (0.0%) | 0 (0.0%) |
| 16 and 17 Years | 0 (0.0%) | 0 (0.0%) |
| 18 to 24 Years | 2 (13.3%) | 0 (0.0%) |
| 25 to 34 Years | 6 (100.0%) | 1 (100.0%) |
| 35 to 44 Years | 0 (0.0%) | 0 (0.0%) |
| 45 to 54 Years | 0 (0.0%) | 3 (100.0%) |
| 55 to 64 Years | 4 (100.0%) | 4 (100.0%) |
| 65 to 74 Years | 2 (100.0%) | 2 (100.0%) |
| 75 Years and over | 1 (100.0%) | 0 (0.0%) |
| Total | 18 (48.6%) | 11 (100.0%) |
Income Below Poverty Among Married-Couple Families in Phillipstown
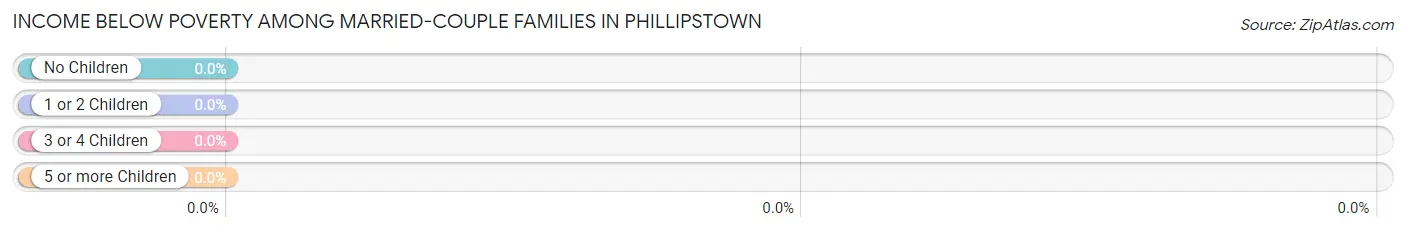
| Children | Above Poverty | Below Poverty |
| No Children | 4 (100.0%) | 0 (0.0%) |
| 1 or 2 Children | 4 (100.0%) | 0 (0.0%) |
| 3 or 4 Children | 0 (0.0%) | 0 (0.0%) |
| 5 or more Children | 0 (0.0%) | 0 (0.0%) |
| Total | 8 (100.0%) | 0 (0.0%) |
Income Below Poverty Among Single-Parent Households in Phillipstown
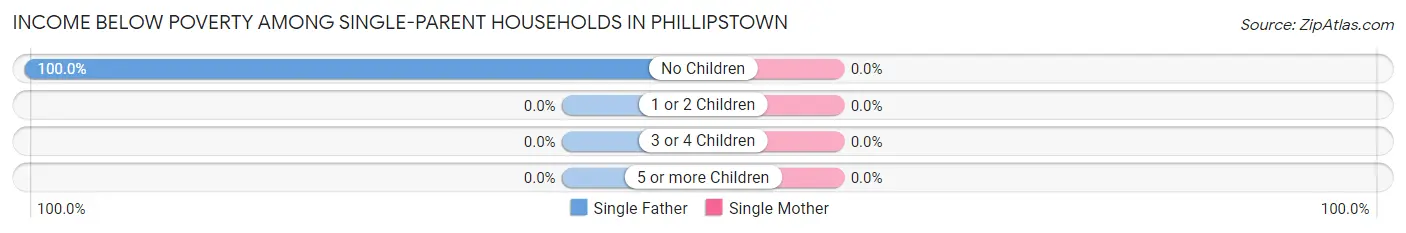
| Children | Single Father | Single Mother |
| No Children | 6 (100.0%) | 0 (0.0%) |
| 1 or 2 Children | 0 (0.0%) | 0 (0.0%) |
| 3 or 4 Children | 0 (0.0%) | 0 (0.0%) |
| 5 or more Children | 0 (0.0%) | 0 (0.0%) |
| Total | 6 (100.0%) | 0 (0.0%) |
Income Below Poverty Among Married-Couple vs Single-Parent Households in Phillipstown
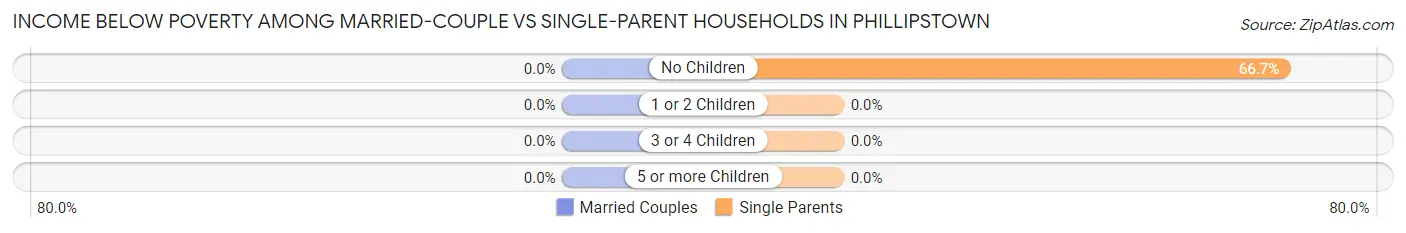
| Children | Married-Couple Families | Single-Parent Households |
| No Children | 0 (0.0%) | 6 (66.7%) |
| 1 or 2 Children | 0 (0.0%) | 0 (0.0%) |
| 3 or 4 Children | 0 (0.0%) | 0 (0.0%) |
| 5 or more Children | 0 (0.0%) | 0 (0.0%) |
| Total | 0 (0.0%) | 6 (66.7%) |
Race in Phillipstown
The most populous races in Phillipstown are White / Caucasian (41 | 85.4%), and Black / African American (7 | 14.6%).
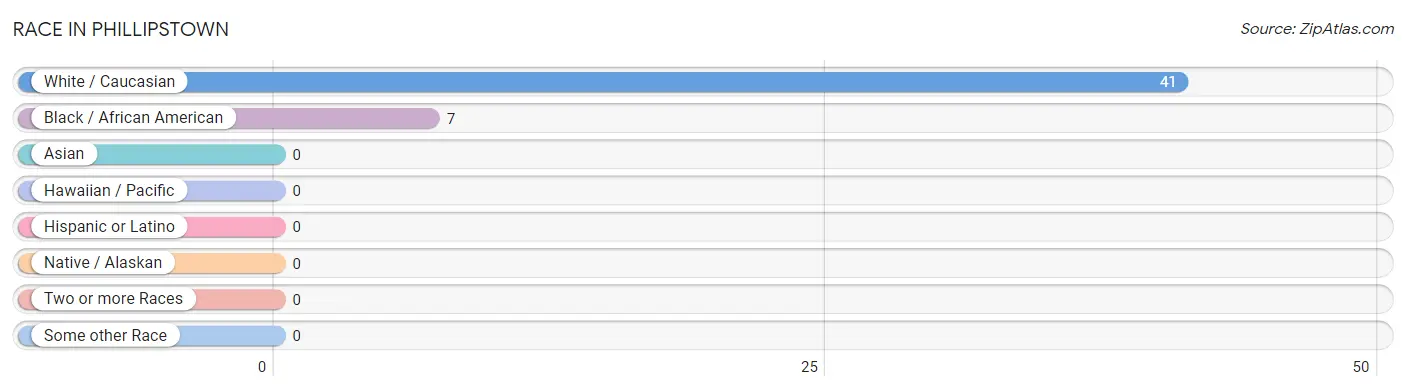
| Race | # Population | % Population |
| Asian | 0 | 0.0% |
| Black / African American | 7 | 14.6% |
| Hawaiian / Pacific | 0 | 0.0% |
| Hispanic or Latino | 0 | 0.0% |
| Native / Alaskan | 0 | 0.0% |
| White / Caucasian | 41 | 85.4% |
| Two or more Races | 0 | 0.0% |
| Some other Race | 0 | 0.0% |
| Total | 48 | 100.0% |
Ancestry in Phillipstown
The most populous ancestries reported in Phillipstown are German (6 | 12.5%), Irish (6 | 12.5%), English (2 | 4.2%), French (2 | 4.2%), and American (1 | 2.1%), together accounting for 35.4% of all Phillipstown residents.
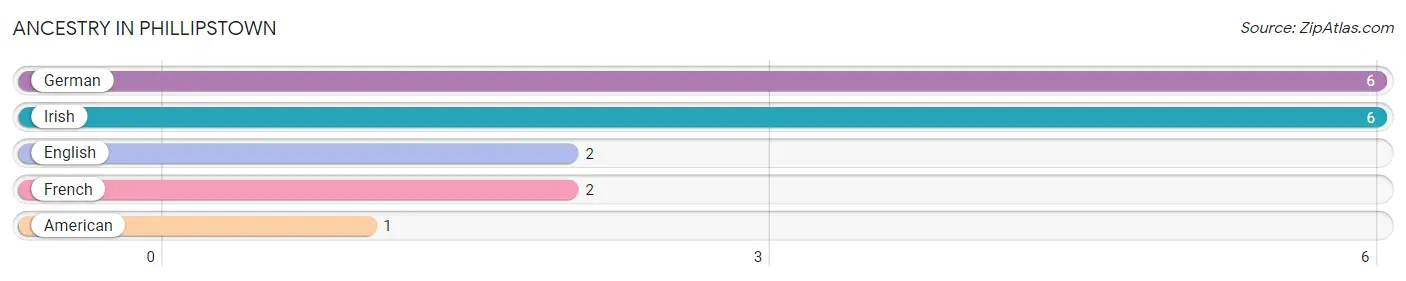
| Ancestry | # Population | % Population |
| American | 1 | 2.1% |
| English | 2 | 4.2% |
| French | 2 | 4.2% |
| German | 6 | 12.5% |
| Irish | 6 | 12.5% | View All 5 Rows |
Immigrants in Phillipstown

| Immigration Origin | # Population | % Population | View All 0 Rows |
Sex and Age in Phillipstown
Sex and Age in Phillipstown
The most populous age groups in Phillipstown are 20 to 24 Years (15 | 40.5%) for men and 55 to 59 Years (4 | 36.4%) for women.
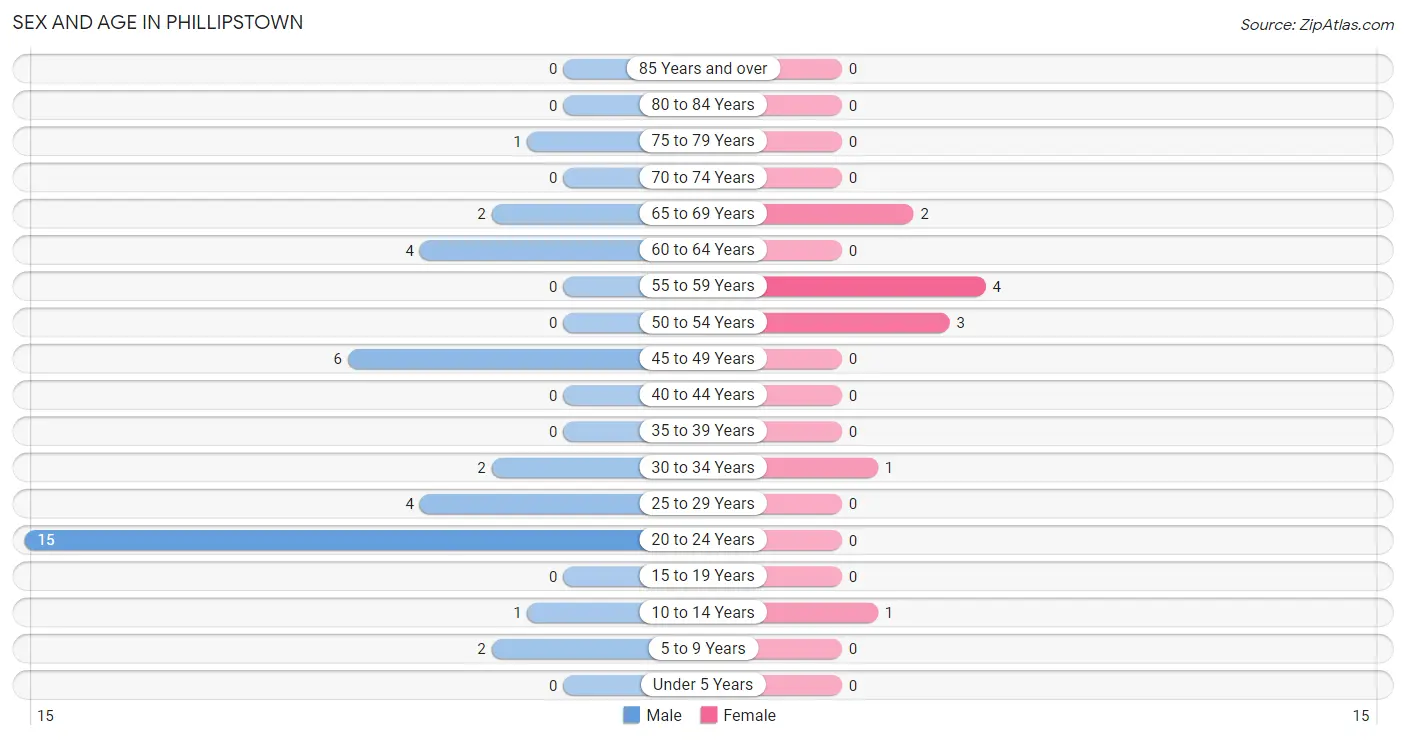
| Age Bracket | Male | Female |
| Under 5 Years | 0 (0.0%) | 0 (0.0%) |
| 5 to 9 Years | 2 (5.4%) | 0 (0.0%) |
| 10 to 14 Years | 1 (2.7%) | 1 (9.1%) |
| 15 to 19 Years | 0 (0.0%) | 0 (0.0%) |
| 20 to 24 Years | 15 (40.5%) | 0 (0.0%) |
| 25 to 29 Years | 4 (10.8%) | 0 (0.0%) |
| 30 to 34 Years | 2 (5.4%) | 1 (9.1%) |
| 35 to 39 Years | 0 (0.0%) | 0 (0.0%) |
| 40 to 44 Years | 0 (0.0%) | 0 (0.0%) |
| 45 to 49 Years | 6 (16.2%) | 0 (0.0%) |
| 50 to 54 Years | 0 (0.0%) | 3 (27.3%) |
| 55 to 59 Years | 0 (0.0%) | 4 (36.4%) |
| 60 to 64 Years | 4 (10.8%) | 0 (0.0%) |
| 65 to 69 Years | 2 (5.4%) | 2 (18.2%) |
| 70 to 74 Years | 0 (0.0%) | 0 (0.0%) |
| 75 to 79 Years | 1 (2.7%) | 0 (0.0%) |
| 80 to 84 Years | 0 (0.0%) | 0 (0.0%) |
| 85 Years and over | 0 (0.0%) | 0 (0.0%) |
| Total | 37 (100.0%) | 11 (100.0%) |
Families and Households in Phillipstown
Median Family Size in Phillipstown
The median family size in Phillipstown is 2.59 persons per family, with single male/father families (6 | 35.3%) accounting for the largest median family size of 3.17 persons per family. On the other hand, married-couple families (8 | 47.1%) represent the smallest median family size with 2.25 persons per family.
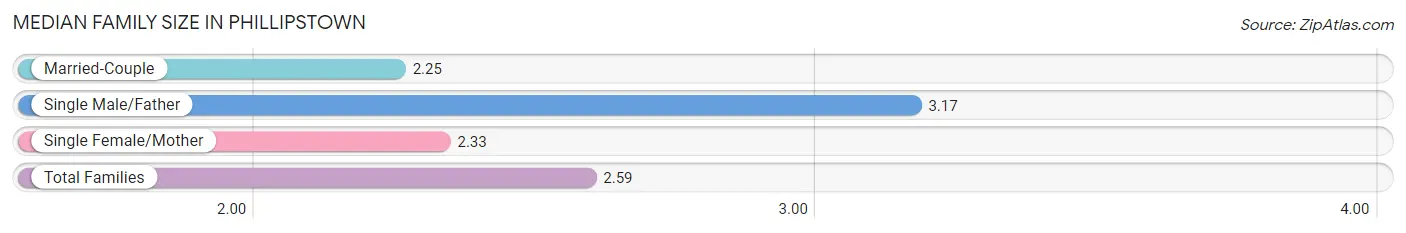
| Family Type | # Families | Family Size |
| Married-Couple | 8 (47.1%) | 2.25 |
| Single Male/Father | 6 (35.3%) | 3.17 |
| Single Female/Mother | 3 (17.6%) | 2.33 |
| Total Families | 17 (100.0%) | 2.59 |
Median Household Size in Phillipstown
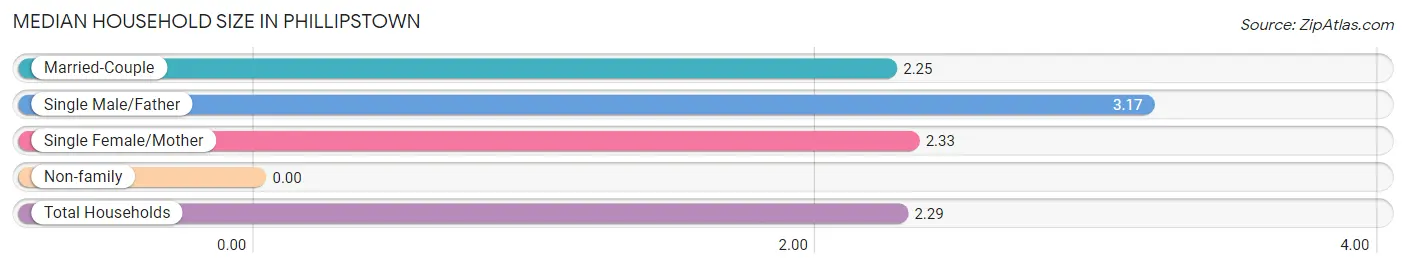
| Household Type | # Households | Household Size |
| Married-Couple | 8 (38.1%) | 2.25 |
| Single Male/Father | 6 (28.6%) | 3.17 |
| Single Female/Mother | 3 (14.3%) | 2.33 |
| Non-family | 4 (19.1%) | - |
| Total Households | 21 (100.0%) | 2.29 |
Household Size by Marriage Status in Phillipstown
Out of a total of 21 households in Phillipstown, 17 (80.9%) are family households, while 4 (19.1%) are nonfamily households. The most numerous type of family households are 2-person households, comprising 13, and the most common type of nonfamily households are 1-person households, comprising 4.
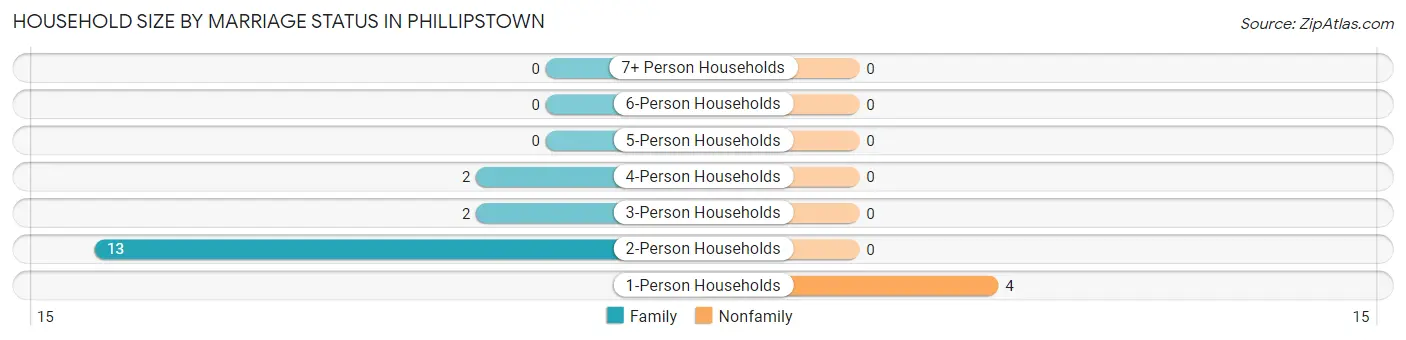
| Household Size | Family Households | Nonfamily Households |
| 1-Person Households | - | 4 (19.1%) |
| 2-Person Households | 13 (61.9%) | 0 (0.0%) |
| 3-Person Households | 2 (9.5%) | 0 (0.0%) |
| 4-Person Households | 2 (9.5%) | 0 (0.0%) |
| 5-Person Households | 0 (0.0%) | 0 (0.0%) |
| 6-Person Households | 0 (0.0%) | 0 (0.0%) |
| 7+ Person Households | 0 (0.0%) | 0 (0.0%) |
| Total | 17 (80.9%) | 4 (19.1%) |
Female Fertility in Phillipstown
Fertility by Age in Phillipstown
| Age Bracket | Women with Births | Births / 1,000 Women |
| 15 to 19 years | 0 (0.0%) | 0.0 |
| 20 to 34 years | 0 (0.0%) | 0.0 |
| 35 to 50 years | 0 (0.0%) | 0.0 |
| Total | 0 (0.0%) | 0.0 |
Fertility by Age by Marriage Status in Phillipstown
| Age Bracket | Married | Unmarried |
| 15 to 19 years | 0 (0.0%) | 0 (0.0%) |
| 20 to 34 years | 0 (0.0%) | 0 (0.0%) |
| 35 to 50 years | 0 (0.0%) | 0 (0.0%) |
| Total | 0 (0.0%) | 0 (0.0%) |
Fertility by Education in Phillipstown
| Educational Attainment | Women with Births | Births / 1,000 Women |
| Less than High School | 0 (0.0%) | 0.0 |
| High School Diploma | 0 (0.0%) | 0.0 |
| College or Associate's Degree | 0 (0.0%) | 0.0 |
| Bachelor's Degree | 0 (0.0%) | 0.0 |
| Graduate Degree | 0 (0.0%) | 0.0 |
| Total | 0 (0.0%) | 0.0 |
Fertility by Education by Marriage Status in Phillipstown
| Educational Attainment | Married | Unmarried |
| Less than High School | 0 (0.0%) | 0 (0.0%) |
| High School Diploma | 0 (0.0%) | 0 (0.0%) |
| College or Associate's Degree | 0 (0.0%) | 0 (0.0%) |
| Bachelor's Degree | 0 (0.0%) | 0 (0.0%) |
| Graduate Degree | 0 (0.0%) | 0 (0.0%) |
| Total | 0 (0.0%) | 0 (0.0%) |
Employment Characteristics in Phillipstown
Employment by Class of Employer in Phillipstown
Among the 18 employed individuals in Phillipstown, private company employees (16 | 88.9%), and local government employees (2 | 11.1%) make up the most common classes of employment.
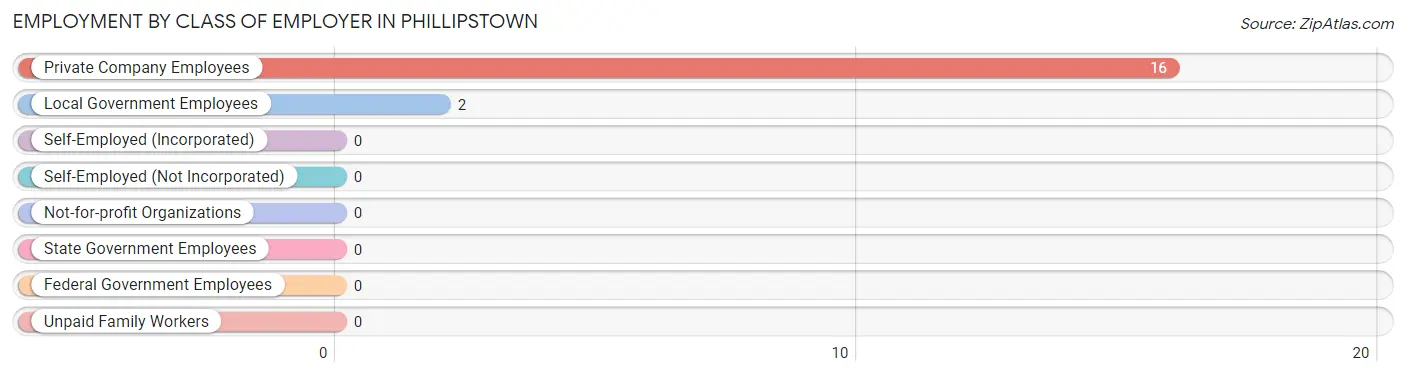
| Employer Class | # Employees | % Employees |
| Private Company Employees | 16 | 88.9% |
| Self-Employed (Incorporated) | 0 | 0.0% |
| Self-Employed (Not Incorporated) | 0 | 0.0% |
| Not-for-profit Organizations | 0 | 0.0% |
| Local Government Employees | 2 | 11.1% |
| State Government Employees | 0 | 0.0% |
| Federal Government Employees | 0 | 0.0% |
| Unpaid Family Workers | 0 | 0.0% |
| Total | 18 | 100.0% |
Employment Status by Age in Phillipstown
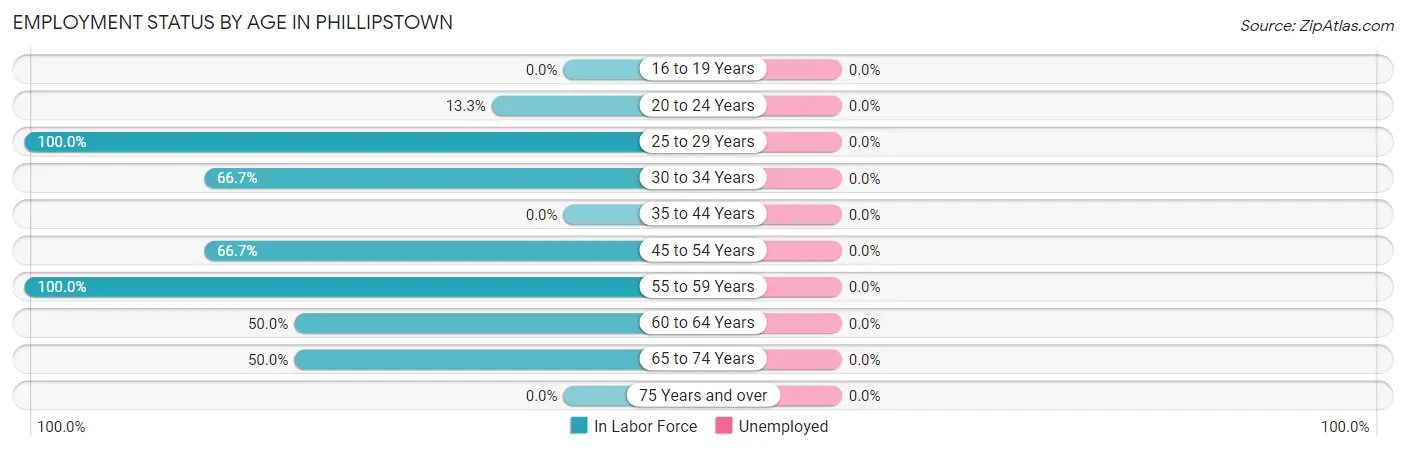
| Age Bracket | In Labor Force | Unemployed |
| 16 to 19 Years | 0 (0.0%) | 0 (0.0%) |
| 20 to 24 Years | 2 (13.3%) | 0 (0.0%) |
| 25 to 29 Years | 4 (100.0%) | 0 (0.0%) |
| 30 to 34 Years | 2 (66.7%) | 0 (0.0%) |
| 35 to 44 Years | 0 (0.0%) | 0 (0.0%) |
| 45 to 54 Years | 6 (66.7%) | 0 (0.0%) |
| 55 to 59 Years | 4 (100.0%) | 0 (0.0%) |
| 60 to 64 Years | 2 (50.0%) | 0 (0.0%) |
| 65 to 74 Years | 2 (50.0%) | 0 (0.0%) |
| 75 Years and over | 0 (0.0%) | 0 (0.0%) |
| Total | 22 (50.0%) | 0 (0.0%) |
Employment Status by Educational Attainment in Phillipstown
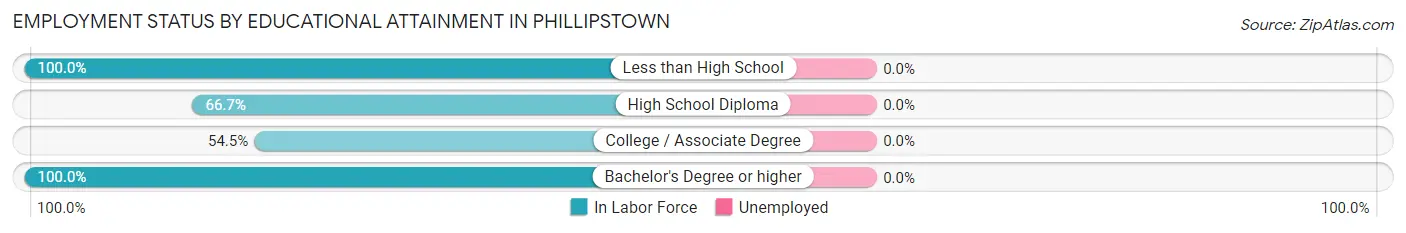
| Educational Attainment | In Labor Force | Unemployed |
| Less than High School | 6 (100.0%) | 0 (0.0%) |
| High School Diploma | 2 (66.7%) | 0 (0.0%) |
| College / Associate Degree | 6 (54.5%) | 0 (0.0%) |
| Bachelor's Degree or higher | 4 (100.0%) | 0 (0.0%) |
| Total | 18 (75.0%) | 0 (0.0%) |
Employment Occupations by Sex in Phillipstown
Management, Business, Science and Arts Occupations
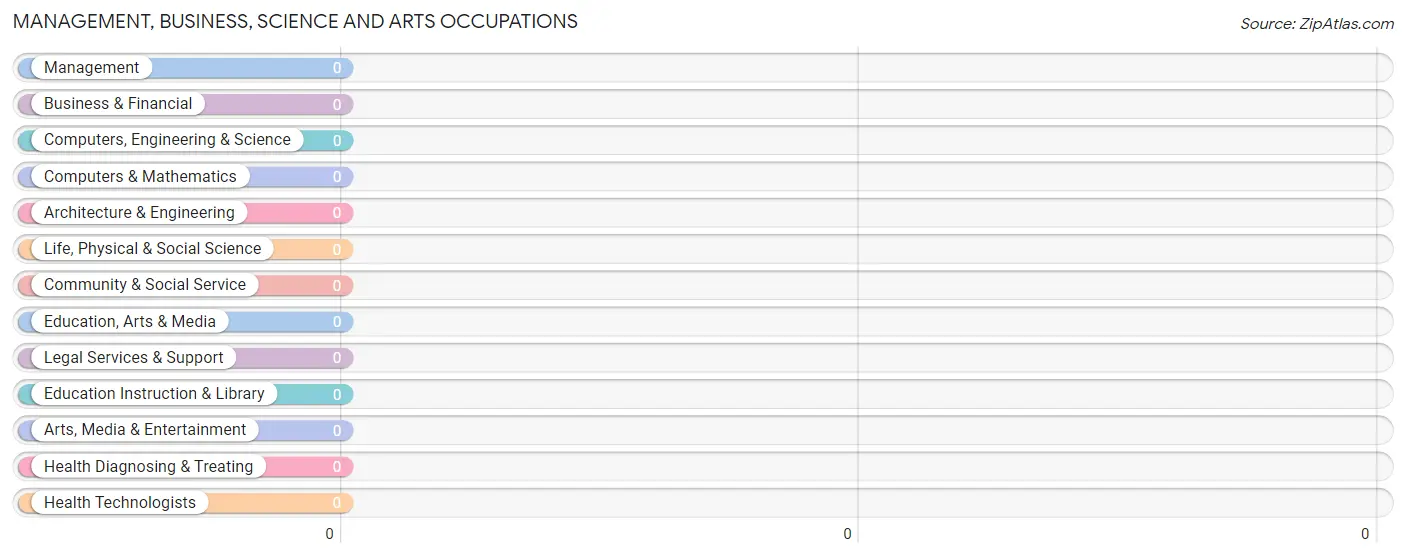
Management, Business, Science and Arts Occupations by Sex
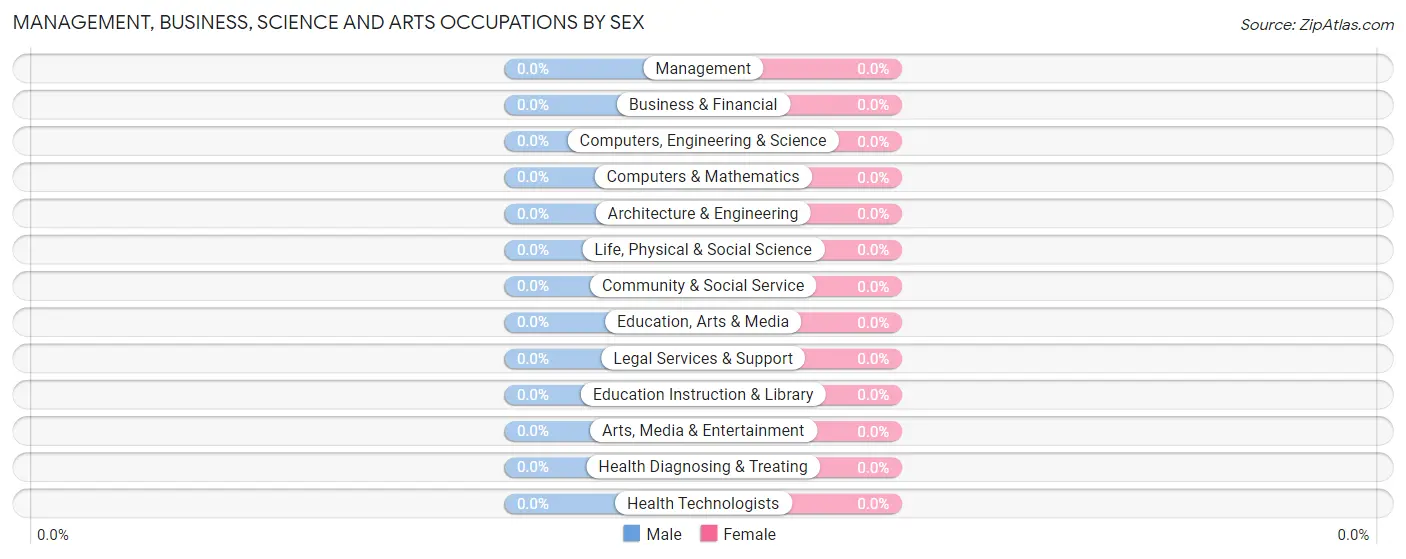
| Occupation | Male | Female |
| Management | 0 (0.0%) | 0 (0.0%) |
| Business & Financial | 0 (0.0%) | 0 (0.0%) |
| Computers, Engineering & Science | 0 (0.0%) | 0 (0.0%) |
| Computers & Mathematics | 0 (0.0%) | 0 (0.0%) |
| Architecture & Engineering | 0 (0.0%) | 0 (0.0%) |
| Life, Physical & Social Science | 0 (0.0%) | 0 (0.0%) |
| Community & Social Service | 0 (0.0%) | 0 (0.0%) |
| Education, Arts & Media | 0 (0.0%) | 0 (0.0%) |
| Legal Services & Support | 0 (0.0%) | 0 (0.0%) |
| Education Instruction & Library | 0 (0.0%) | 0 (0.0%) |
| Arts, Media & Entertainment | 0 (0.0%) | 0 (0.0%) |
| Health Diagnosing & Treating | 0 (0.0%) | 0 (0.0%) |
| Health Technologists | 0 (0.0%) | 0 (0.0%) |
| Total (Category) | 0 (0.0%) | 0 (0.0%) |
| Total (Overall) | 18 (81.8%) | 4 (18.2%) |
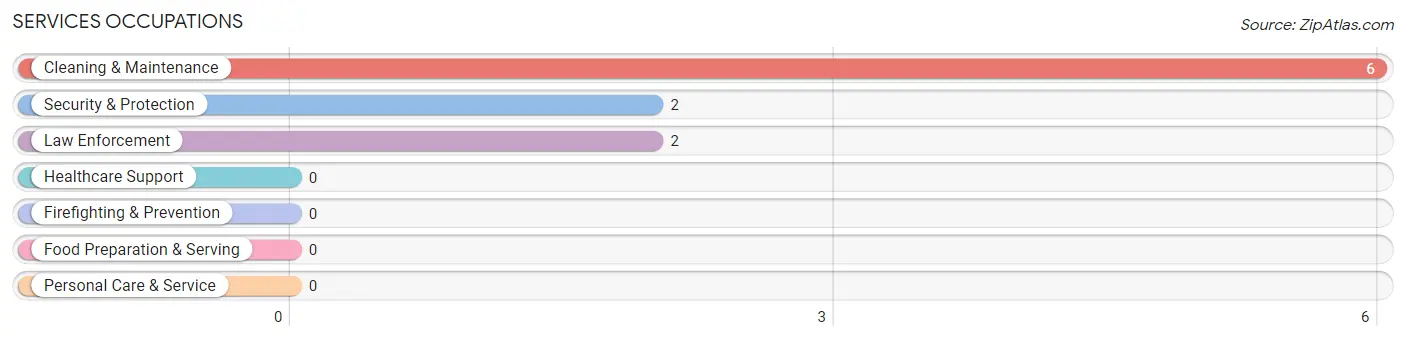
Services Occupations
The most common Services occupations in Phillipstown are Cleaning & Maintenance (6 | 27.3%), Security & Protection (2 | 9.1%), and Law Enforcement (2 | 9.1%).
Services Occupations by Sex
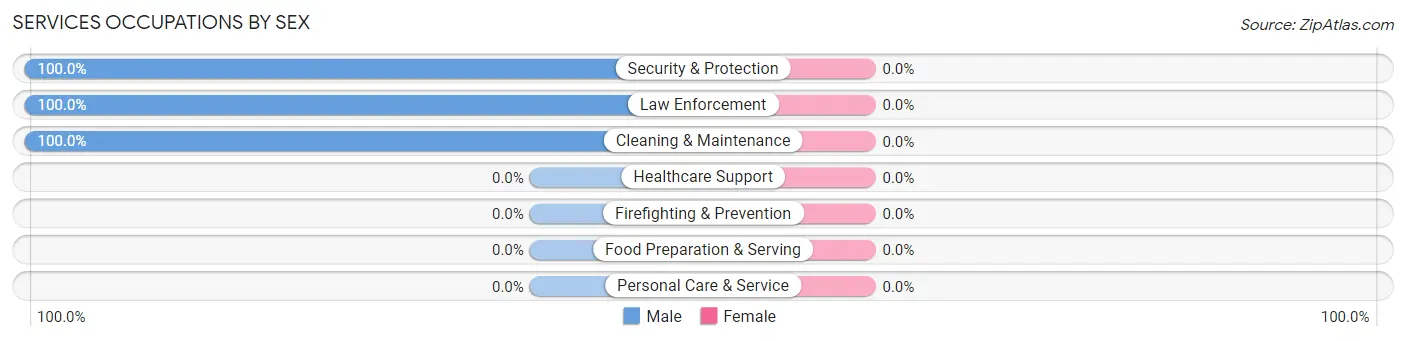
| Occupation | Male | Female |
| Healthcare Support | 0 (0.0%) | 0 (0.0%) |
| Security & Protection | 2 (100.0%) | 0 (0.0%) |
| Firefighting & Prevention | 0 (0.0%) | 0 (0.0%) |
| Law Enforcement | 2 (100.0%) | 0 (0.0%) |
| Food Preparation & Serving | 0 (0.0%) | 0 (0.0%) |
| Cleaning & Maintenance | 6 (100.0%) | 0 (0.0%) |
| Personal Care & Service | 0 (0.0%) | 0 (0.0%) |
| Total (Category) | 8 (100.0%) | 0 (0.0%) |
| Total (Overall) | 18 (81.8%) | 4 (18.2%) |
Sales and Office Occupations
The most common Sales and Office occupations in Phillipstown are Sales & Related (2 | 9.1%), and Office & Administration (2 | 9.1%).
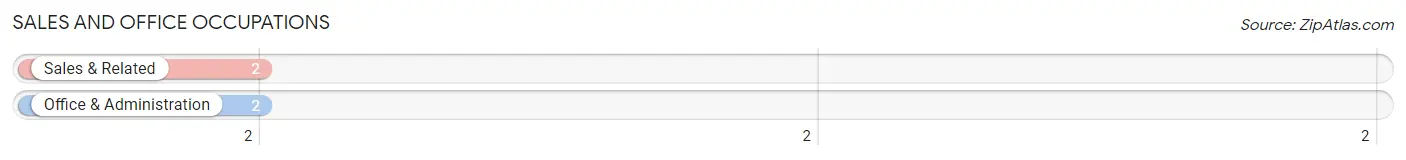
Sales and Office Occupations by Sex
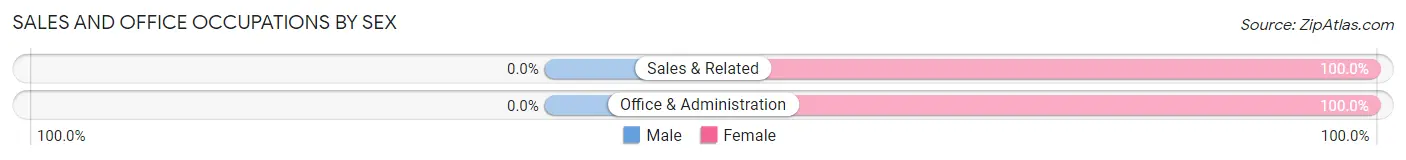
| Occupation | Male | Female |
| Sales & Related | 0 (0.0%) | 2 (100.0%) |
| Office & Administration | 0 (0.0%) | 2 (100.0%) |
| Total (Category) | 0 (0.0%) | 4 (100.0%) |
| Total (Overall) | 18 (81.8%) | 4 (18.2%) |
Natural Resources, Construction and Maintenance Occupations
The most common Natural Resources, Construction and Maintenance occupations in Phillipstown are , and Construction & Extraction (6 | 27.3%).
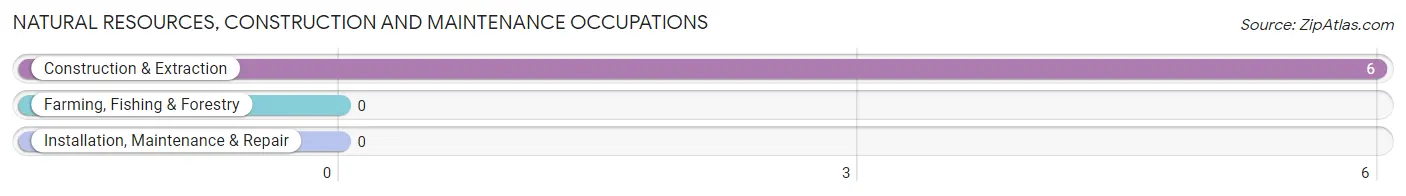
Natural Resources, Construction and Maintenance Occupations by Sex
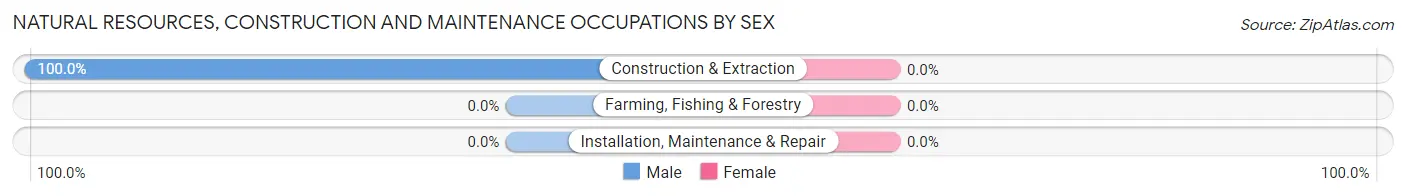
| Occupation | Male | Female |
| Farming, Fishing & Forestry | 0 (0.0%) | 0 (0.0%) |
| Construction & Extraction | 6 (100.0%) | 0 (0.0%) |
| Installation, Maintenance & Repair | 0 (0.0%) | 0 (0.0%) |
| Total (Category) | 6 (100.0%) | 0 (0.0%) |
| Total (Overall) | 18 (81.8%) | 4 (18.2%) |
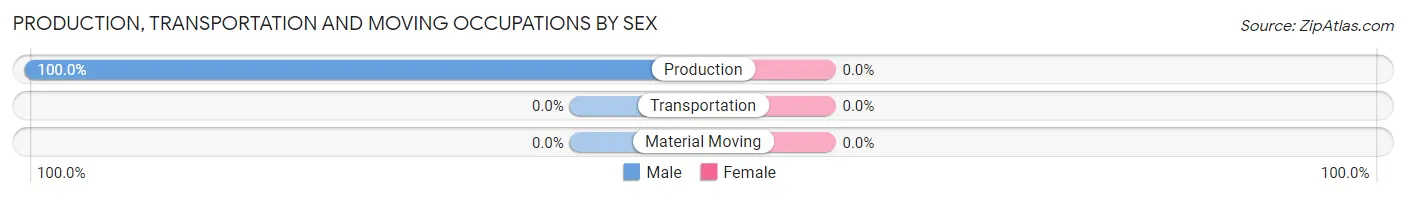
Production, Transportation and Moving Occupations
The most common Production, Transportation and Moving occupations in Phillipstown are , and Production (4 | 18.2%).
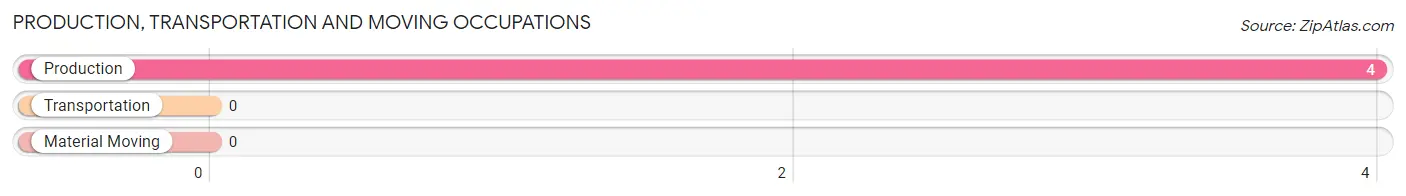
Production, Transportation and Moving Occupations by Sex
| Occupation | Male | Female |
| Production | 4 (100.0%) | 0 (0.0%) |
| Transportation | 0 (0.0%) | 0 (0.0%) |
| Material Moving | 0 (0.0%) | 0 (0.0%) |
| Total (Category) | 4 (100.0%) | 0 (0.0%) |
| Total (Overall) | 18 (81.8%) | 4 (18.2%) |
Employment Industries by Sex in Phillipstown
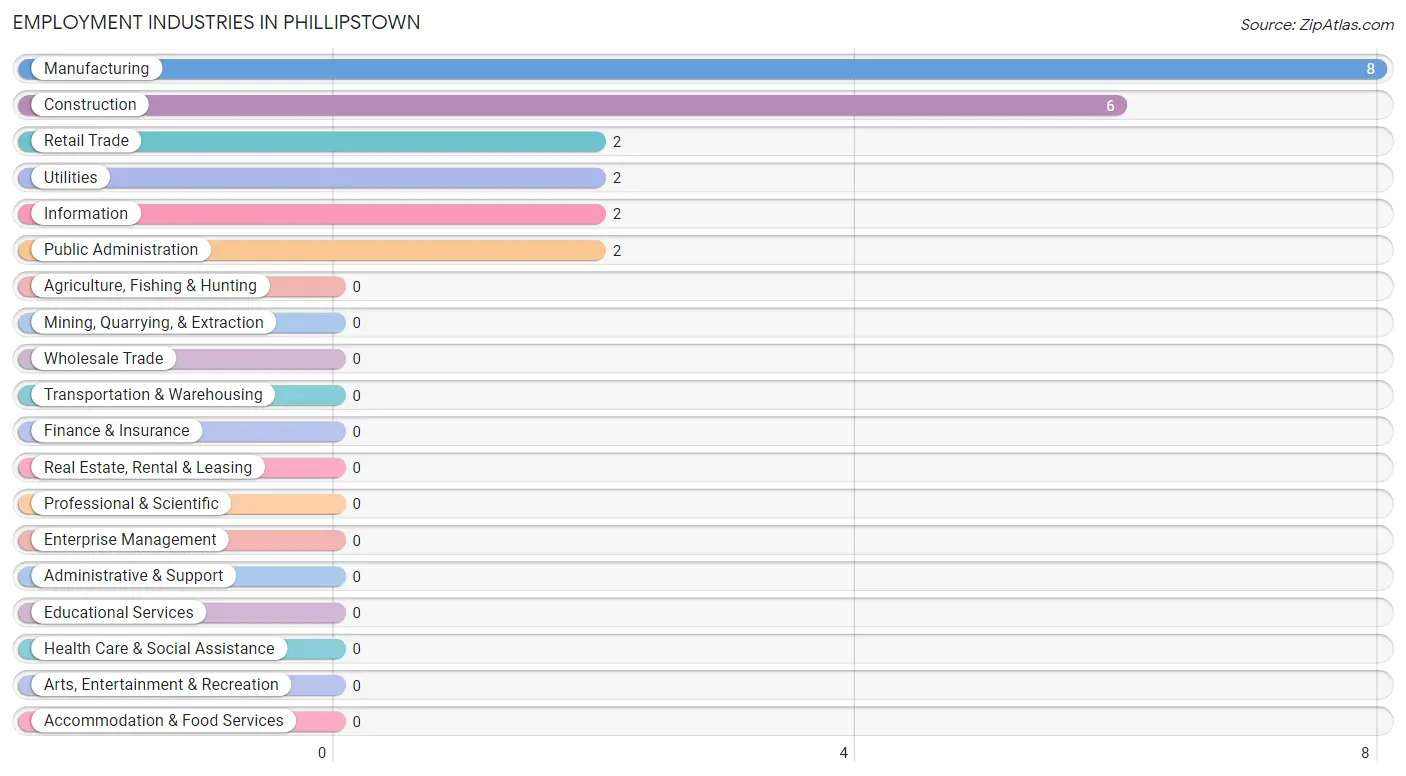
Employment Industries in Phillipstown
The major employment industries in Phillipstown include Manufacturing (8 | 36.4%), Construction (6 | 27.3%), Retail Trade (2 | 9.1%), Utilities (2 | 9.1%), and Information (2 | 9.1%).
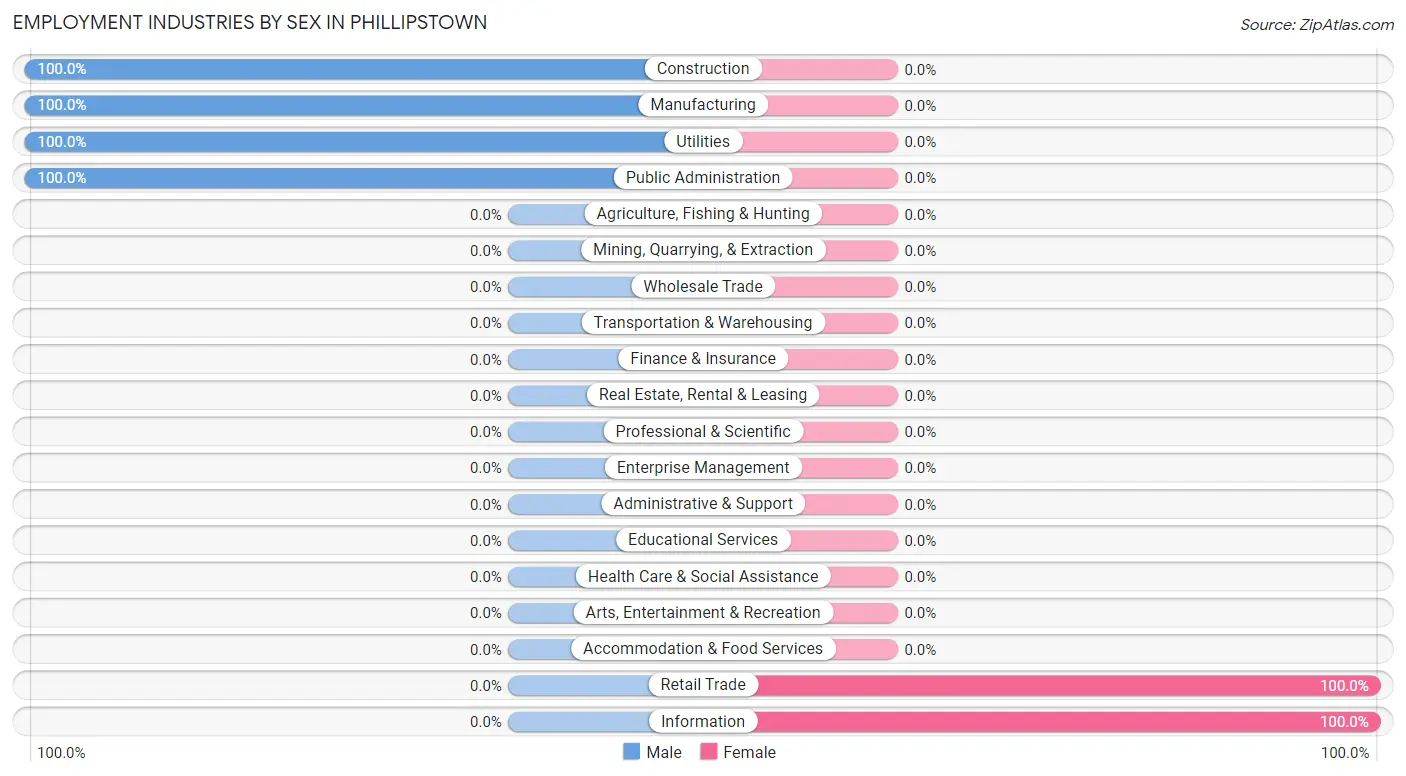
Employment Industries by Sex in Phillipstown
The Phillipstown industries that see more men than women are Construction (100.0%), Manufacturing (100.0%), and Utilities (100.0%), whereas the industries that tend to have a higher number of women are Retail Trade (100.0%), and Information (100.0%).
| Industry | Male | Female |
| Agriculture, Fishing & Hunting | 0 (0.0%) | 0 (0.0%) |
| Mining, Quarrying, & Extraction | 0 (0.0%) | 0 (0.0%) |
| Construction | 6 (100.0%) | 0 (0.0%) |
| Manufacturing | 8 (100.0%) | 0 (0.0%) |
| Wholesale Trade | 0 (0.0%) | 0 (0.0%) |
| Retail Trade | 0 (0.0%) | 2 (100.0%) |
| Transportation & Warehousing | 0 (0.0%) | 0 (0.0%) |
| Utilities | 2 (100.0%) | 0 (0.0%) |
| Information | 0 (0.0%) | 2 (100.0%) |
| Finance & Insurance | 0 (0.0%) | 0 (0.0%) |
| Real Estate, Rental & Leasing | 0 (0.0%) | 0 (0.0%) |
| Professional & Scientific | 0 (0.0%) | 0 (0.0%) |
| Enterprise Management | 0 (0.0%) | 0 (0.0%) |
| Administrative & Support | 0 (0.0%) | 0 (0.0%) |
| Educational Services | 0 (0.0%) | 0 (0.0%) |
| Health Care & Social Assistance | 0 (0.0%) | 0 (0.0%) |
| Arts, Entertainment & Recreation | 0 (0.0%) | 0 (0.0%) |
| Accommodation & Food Services | 0 (0.0%) | 0 (0.0%) |
| Public Administration | 2 (100.0%) | 0 (0.0%) |
| Total | 18 (81.8%) | 4 (18.2%) |
Education in Phillipstown
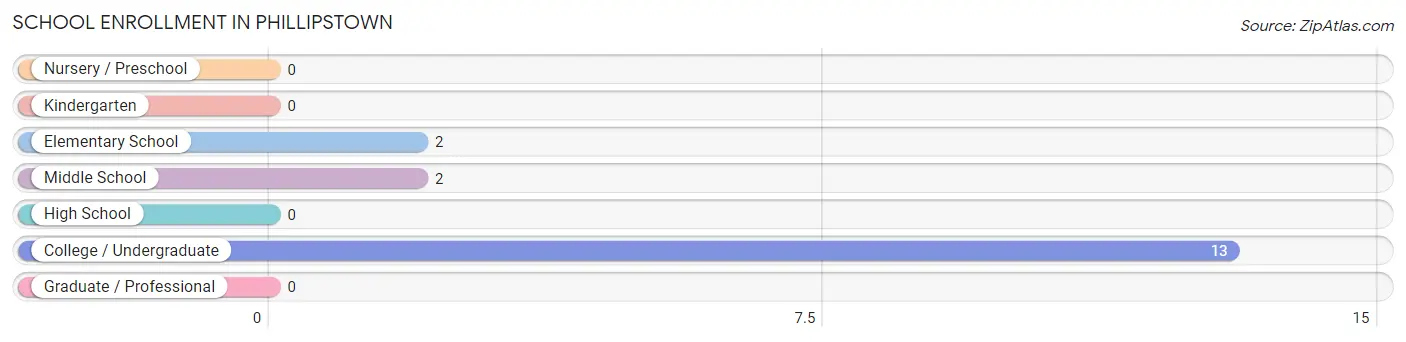
School Enrollment in Phillipstown
The most common levels of schooling among the 17 students in Phillipstown are college / undergraduate (13 | 76.5%), elementary school (2 | 11.8%), and middle school (2 | 11.8%).
| School Level | # Students | % Students |
| Nursery / Preschool | 0 | 0.0% |
| Kindergarten | 0 | 0.0% |
| Elementary School | 2 | 11.8% |
| Middle School | 2 | 11.8% |
| High School | 0 | 0.0% |
| College / Undergraduate | 13 | 76.5% |
| Graduate / Professional | 0 | 0.0% |
| Total | 17 | 100.0% |
School Enrollment by Age by Funding Source in Phillipstown
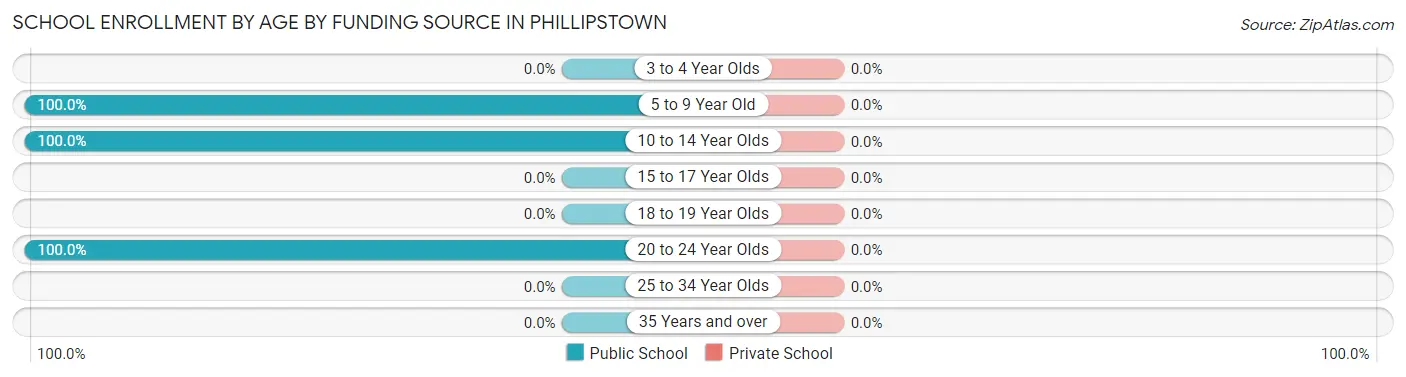
| Age Bracket | Public School | Private School |
| 3 to 4 Year Olds | 0 (0.0%) | 0 (0.0%) |
| 5 to 9 Year Old | 2 (100.0%) | 0 (0.0%) |
| 10 to 14 Year Olds | 2 (100.0%) | 0 (0.0%) |
| 15 to 17 Year Olds | 0 (0.0%) | 0 (0.0%) |
| 18 to 19 Year Olds | 0 (0.0%) | 0 (0.0%) |
| 20 to 24 Year Olds | 13 (100.0%) | 0 (0.0%) |
| 25 to 34 Year Olds | 0 (0.0%) | 0 (0.0%) |
| 35 Years and over | 0 (0.0%) | 0 (0.0%) |
| Total | 17 (100.0%) | 0 (0.0%) |
Educational Attainment by Field of Study in Phillipstown
Communications (2 | 50.0%), and arts & humanities (2 | 50.0%) are the most common fields of study among 4 individuals in Phillipstown who have obtained a bachelor's degree or higher.
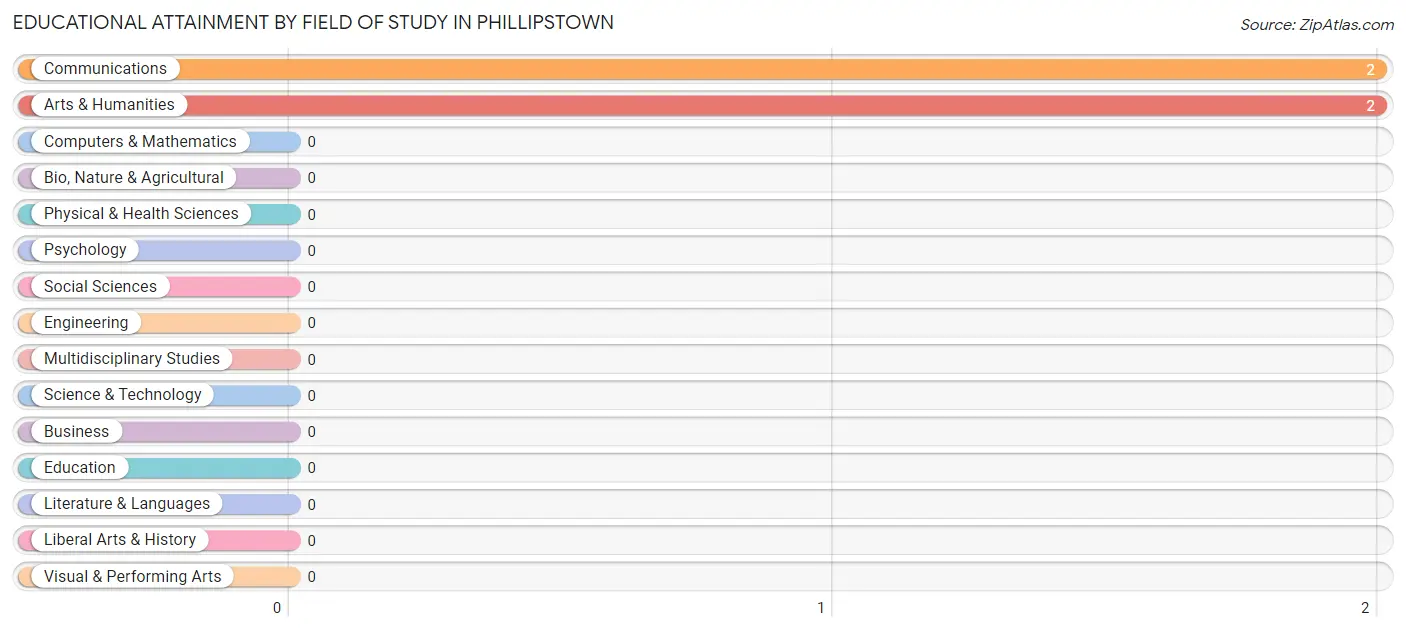
| Field of Study | # Graduates | % Graduates |
| Computers & Mathematics | 0 | 0.0% |
| Bio, Nature & Agricultural | 0 | 0.0% |
| Physical & Health Sciences | 0 | 0.0% |
| Psychology | 0 | 0.0% |
| Social Sciences | 0 | 0.0% |
| Engineering | 0 | 0.0% |
| Multidisciplinary Studies | 0 | 0.0% |
| Science & Technology | 0 | 0.0% |
| Business | 0 | 0.0% |
| Education | 0 | 0.0% |
| Literature & Languages | 0 | 0.0% |
| Liberal Arts & History | 0 | 0.0% |
| Visual & Performing Arts | 0 | 0.0% |
| Communications | 2 | 50.0% |
| Arts & Humanities | 2 | 50.0% |
| Total | 4 | 100.0% |
Transportation & Commute in Phillipstown
Vehicle Availability by Sex in Phillipstown
The most prevalent vehicle ownership categories in Phillipstown are males with 2 vehicles (8, accounting for 50.0%) and females with 2 vehicles (2, making up 400.0%).
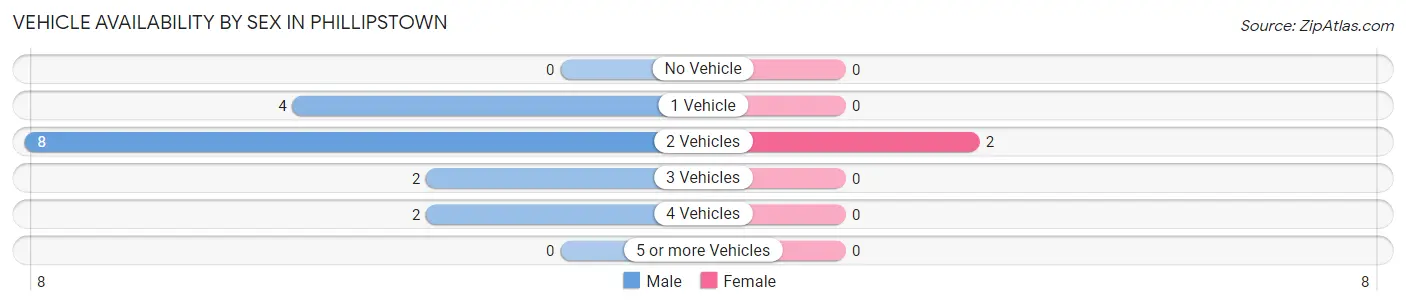
| Vehicles Available | Male | Female |
| No Vehicle | 0 (0.0%) | 0 (0.0%) |
| 1 Vehicle | 4 (25.0%) | 0 (0.0%) |
| 2 Vehicles | 8 (50.0%) | 2 (100.0%) |
| 3 Vehicles | 2 (12.5%) | 0 (0.0%) |
| 4 Vehicles | 2 (12.5%) | 0 (0.0%) |
| 5 or more Vehicles | 0 (0.0%) | 0 (0.0%) |
| Total | 16 (100.0%) | 2 (100.0%) |
Commute Time in Phillipstown
The most frequently occuring commute durations in Phillipstown are 30 to 34 minutes (6 commuters, 37.5%), 60 to 89 minutes (4 commuters, 25.0%), and 5 to 9 minutes (2 commuters, 12.5%).
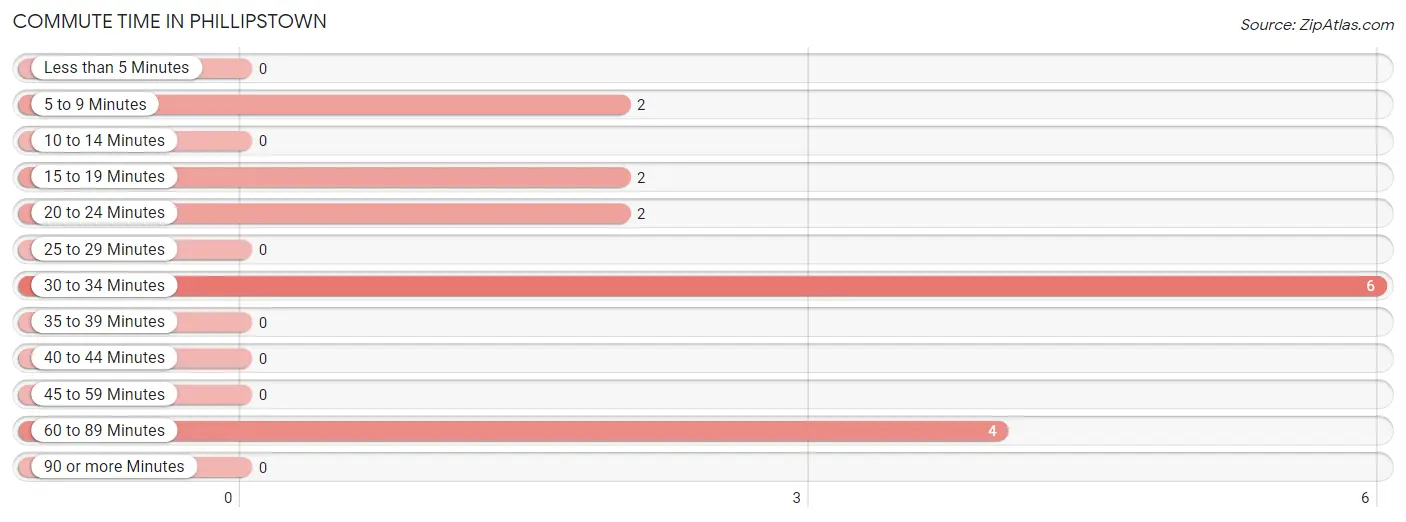
| Commute Time | # Commuters | % Commuters |
| Less than 5 Minutes | 0 | 0.0% |
| 5 to 9 Minutes | 2 | 12.5% |
| 10 to 14 Minutes | 0 | 0.0% |
| 15 to 19 Minutes | 2 | 12.5% |
| 20 to 24 Minutes | 2 | 12.5% |
| 25 to 29 Minutes | 0 | 0.0% |
| 30 to 34 Minutes | 6 | 37.5% |
| 35 to 39 Minutes | 0 | 0.0% |
| 40 to 44 Minutes | 0 | 0.0% |
| 45 to 59 Minutes | 0 | 0.0% |
| 60 to 89 Minutes | 4 | 25.0% |
| 90 or more Minutes | 0 | 0.0% |
Commute Time by Sex in Phillipstown
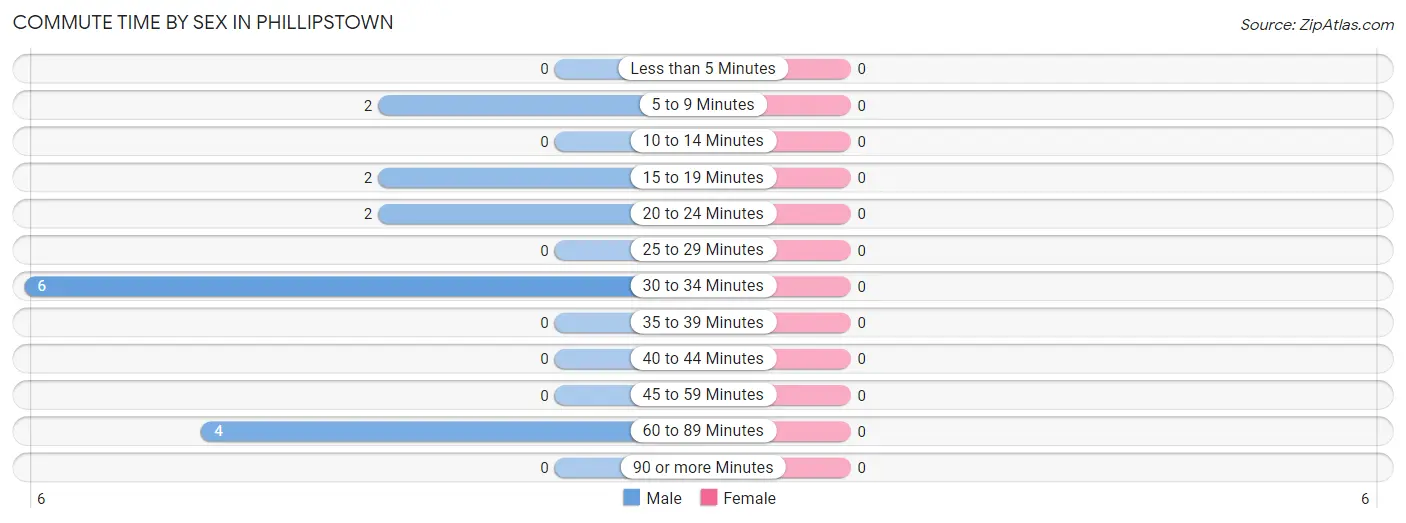
| Commute Time | Male | Female |
| Less than 5 Minutes | 0 (0.0%) | 0 (0.0%) |
| 5 to 9 Minutes | 2 (12.5%) | 0 (0.0%) |
| 10 to 14 Minutes | 0 (0.0%) | 0 (0.0%) |
| 15 to 19 Minutes | 2 (12.5%) | 0 (0.0%) |
| 20 to 24 Minutes | 2 (12.5%) | 0 (0.0%) |
| 25 to 29 Minutes | 0 (0.0%) | 0 (0.0%) |
| 30 to 34 Minutes | 6 (37.5%) | 0 (0.0%) |
| 35 to 39 Minutes | 0 (0.0%) | 0 (0.0%) |
| 40 to 44 Minutes | 0 (0.0%) | 0 (0.0%) |
| 45 to 59 Minutes | 0 (0.0%) | 0 (0.0%) |
| 60 to 89 Minutes | 4 (25.0%) | 0 (0.0%) |
| 90 or more Minutes | 0 (0.0%) | 0 (0.0%) |
Time of Departure to Work by Sex in Phillipstown
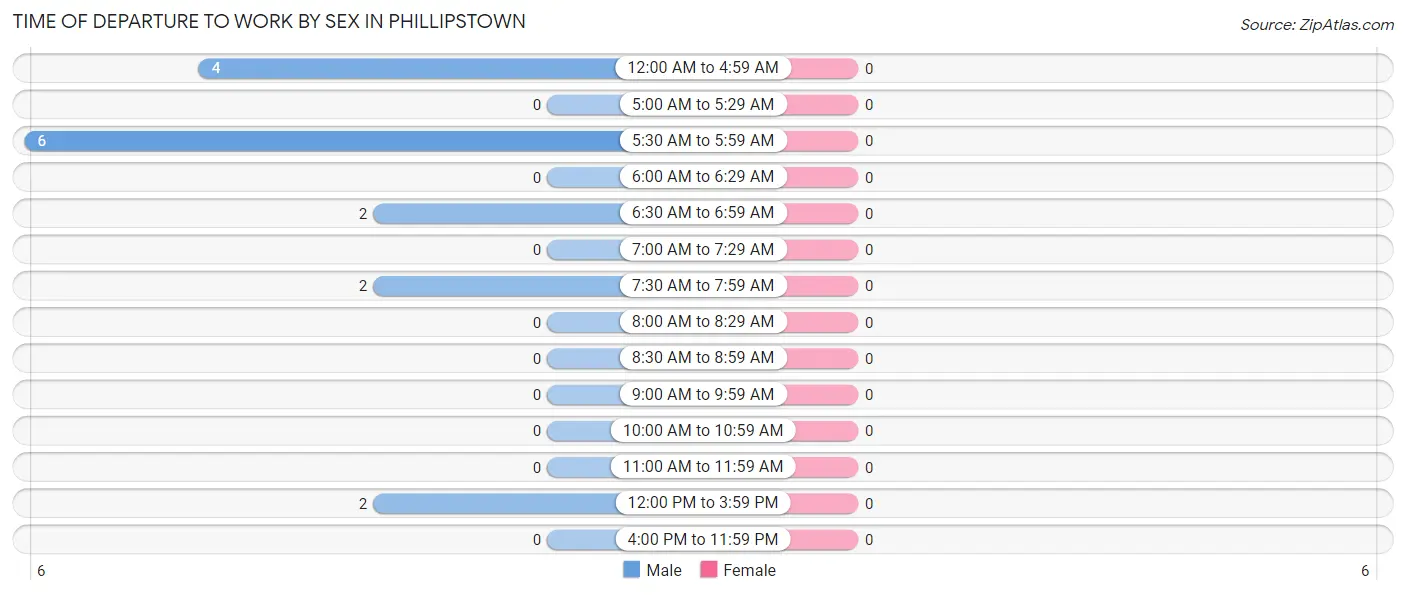
| Time of Departure | Male | Female |
| 12:00 AM to 4:59 AM | 4 (25.0%) | 0 (0.0%) |
| 5:00 AM to 5:29 AM | 0 (0.0%) | 0 (0.0%) |
| 5:30 AM to 5:59 AM | 6 (37.5%) | 0 (0.0%) |
| 6:00 AM to 6:29 AM | 0 (0.0%) | 0 (0.0%) |
| 6:30 AM to 6:59 AM | 2 (12.5%) | 0 (0.0%) |
| 7:00 AM to 7:29 AM | 0 (0.0%) | 0 (0.0%) |
| 7:30 AM to 7:59 AM | 2 (12.5%) | 0 (0.0%) |
| 8:00 AM to 8:29 AM | 0 (0.0%) | 0 (0.0%) |
| 8:30 AM to 8:59 AM | 0 (0.0%) | 0 (0.0%) |
| 9:00 AM to 9:59 AM | 0 (0.0%) | 0 (0.0%) |
| 10:00 AM to 10:59 AM | 0 (0.0%) | 0 (0.0%) |
| 11:00 AM to 11:59 AM | 0 (0.0%) | 0 (0.0%) |
| 12:00 PM to 3:59 PM | 2 (12.5%) | 0 (0.0%) |
| 4:00 PM to 11:59 PM | 0 (0.0%) | 0 (0.0%) |
| Total | 16 (100.0%) | 0 (0.0%) |
Housing Occupancy in Phillipstown
Occupancy by Ownership in Phillipstown
Of the total 21 dwellings in Phillipstown, owner-occupied units account for 17 (80.9%), while renter-occupied units make up 4 (19.1%).
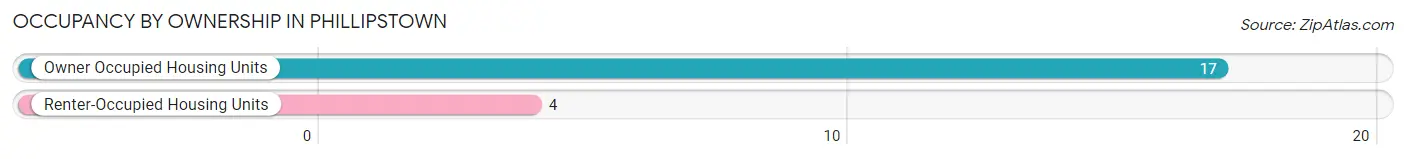
| Occupancy | # Housing Units | % Housing Units |
| Owner Occupied Housing Units | 17 | 80.9% |
| Renter-Occupied Housing Units | 4 | 19.1% |
| Total Occupied Housing Units | 21 | 100.0% |
Occupancy by Household Size in Phillipstown
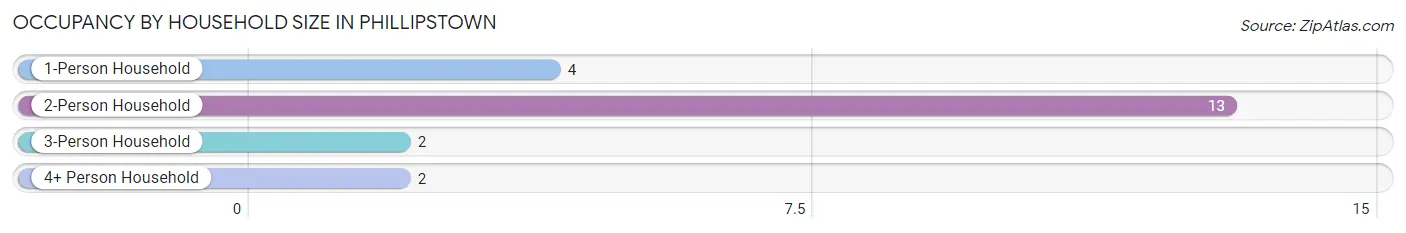
| Household Size | # Housing Units | % Housing Units |
| 1-Person Household | 4 | 19.1% |
| 2-Person Household | 13 | 61.9% |
| 3-Person Household | 2 | 9.5% |
| 4+ Person Household | 2 | 9.5% |
| Total Housing Units | 21 | 100.0% |
Occupancy by Ownership by Household Size in Phillipstown
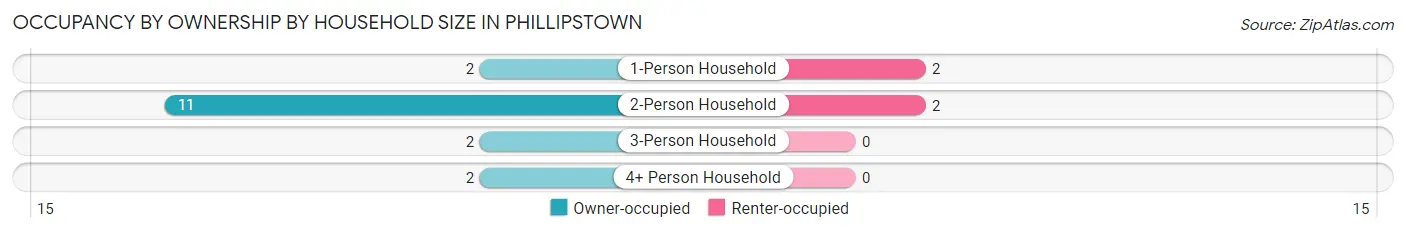
| Household Size | Owner-occupied | Renter-occupied |
| 1-Person Household | 2 (50.0%) | 2 (50.0%) |
| 2-Person Household | 11 (84.6%) | 2 (15.4%) |
| 3-Person Household | 2 (100.0%) | 0 (0.0%) |
| 4+ Person Household | 2 (100.0%) | 0 (0.0%) |
| Total Housing Units | 17 (80.9%) | 4 (19.1%) |
Occupancy by Educational Attainment in Phillipstown
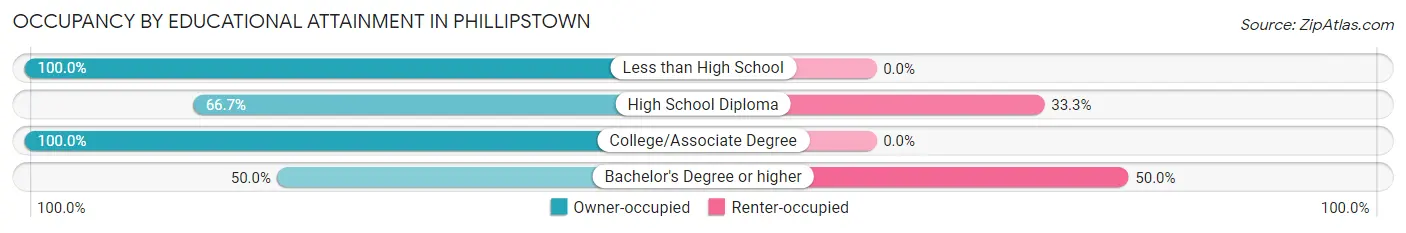
| Household Size | Owner-occupied | Renter-occupied |
| Less than High School | 6 (100.0%) | 0 (0.0%) |
| High School Diploma | 4 (66.7%) | 2 (33.3%) |
| College/Associate Degree | 5 (100.0%) | 0 (0.0%) |
| Bachelor's Degree or higher | 2 (50.0%) | 2 (50.0%) |
Occupancy by Age of Householder in Phillipstown
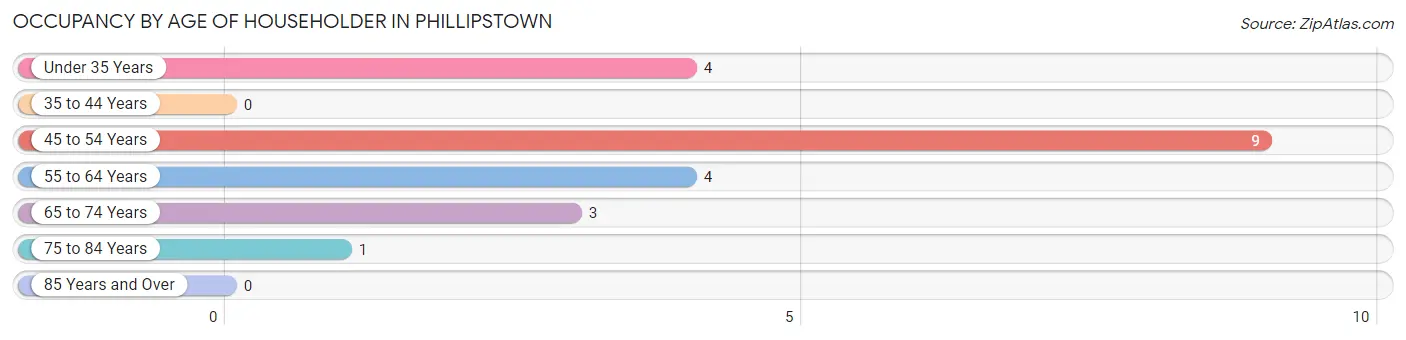
| Age Bracket | # Households | % Households |
| Under 35 Years | 4 | 19.1% |
| 35 to 44 Years | 0 | 0.0% |
| 45 to 54 Years | 9 | 42.9% |
| 55 to 64 Years | 4 | 19.1% |
| 65 to 74 Years | 3 | 14.3% |
| 75 to 84 Years | 1 | 4.8% |
| 85 Years and Over | 0 | 0.0% |
| Total | 21 | 100.0% |
Housing Finances in Phillipstown
Median Income by Occupancy in Phillipstown
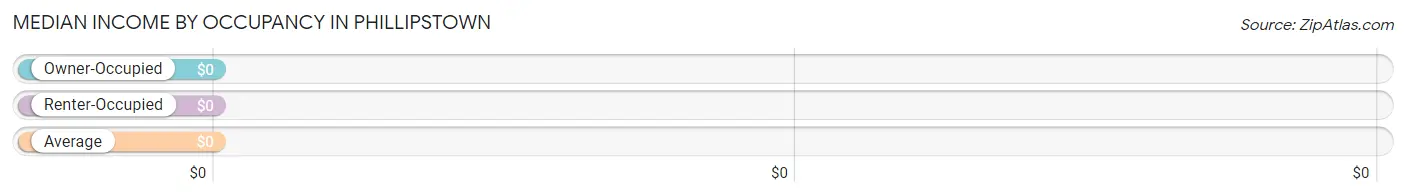
| Occupancy Type | # Households | Median Income |
| Owner-Occupied | 17 (80.9%) | $0 |
| Renter-Occupied | 4 (19.1%) | $0 |
| Average | 21 (100.0%) | $0 |
Occupancy by Householder Income Bracket in Phillipstown
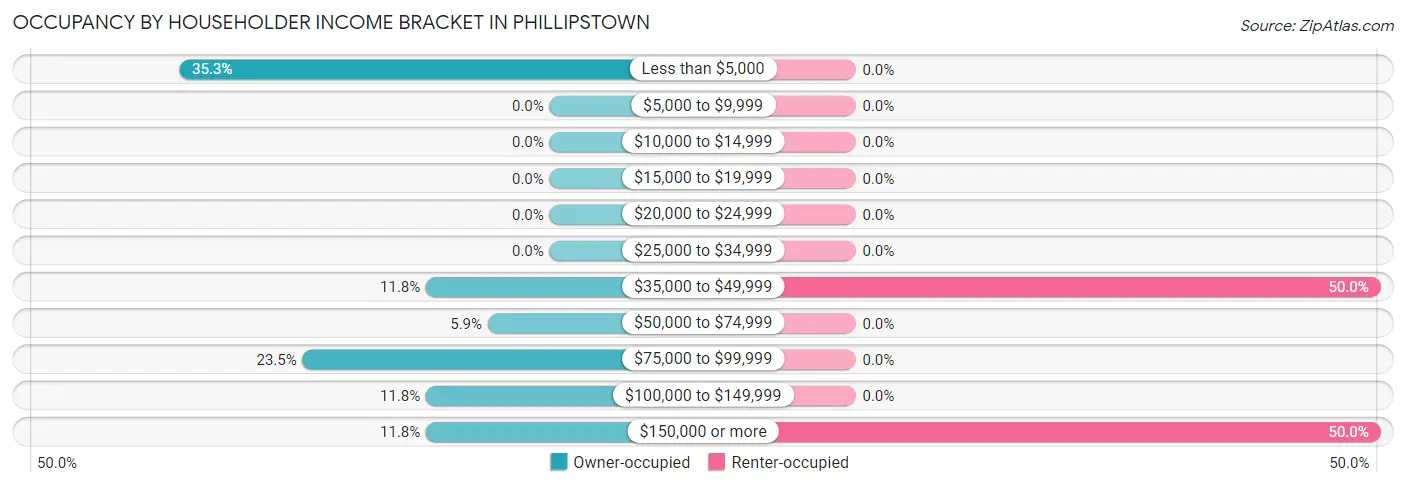
| Income Bracket | Owner-occupied | Renter-occupied |
| Less than $5,000 | 6 (35.3%) | 0 (0.0%) |
| $5,000 to $9,999 | 0 (0.0%) | 0 (0.0%) |
| $10,000 to $14,999 | 0 (0.0%) | 0 (0.0%) |
| $15,000 to $19,999 | 0 (0.0%) | 0 (0.0%) |
| $20,000 to $24,999 | 0 (0.0%) | 0 (0.0%) |
| $25,000 to $34,999 | 0 (0.0%) | 0 (0.0%) |
| $35,000 to $49,999 | 2 (11.8%) | 2 (50.0%) |
| $50,000 to $74,999 | 1 (5.9%) | 0 (0.0%) |
| $75,000 to $99,999 | 4 (23.5%) | 0 (0.0%) |
| $100,000 to $149,999 | 2 (11.8%) | 0 (0.0%) |
| $150,000 or more | 2 (11.8%) | 2 (50.0%) |
| Total | 17 (100.0%) | 4 (100.0%) |
Monthly Housing Cost Tiers in Phillipstown
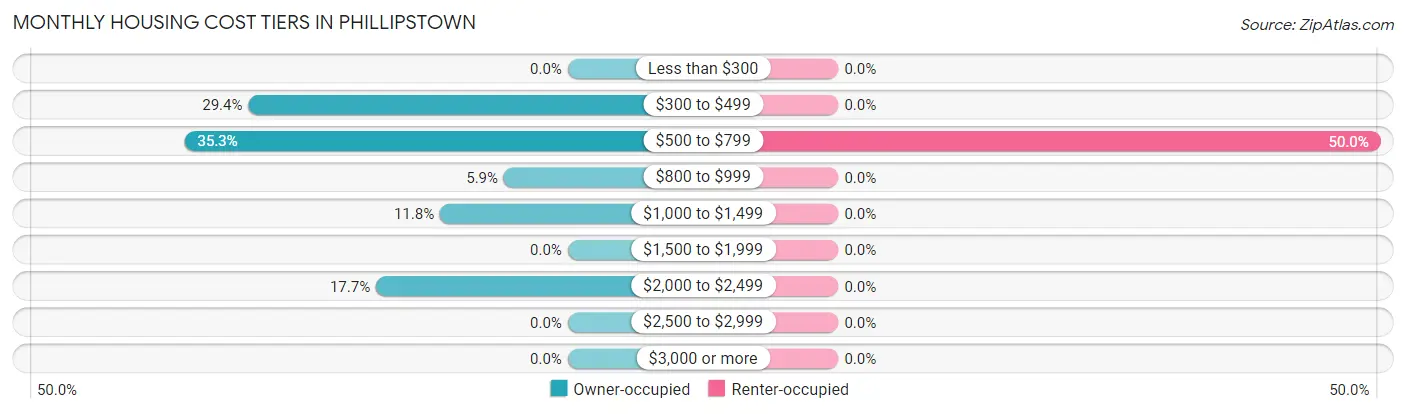
| Monthly Cost | Owner-occupied | Renter-occupied |
| Less than $300 | 0 (0.0%) | 0 (0.0%) |
| $300 to $499 | 5 (29.4%) | 0 (0.0%) |
| $500 to $799 | 6 (35.3%) | 2 (50.0%) |
| $800 to $999 | 1 (5.9%) | 0 (0.0%) |
| $1,000 to $1,499 | 2 (11.8%) | 0 (0.0%) |
| $1,500 to $1,999 | 0 (0.0%) | 0 (0.0%) |
| $2,000 to $2,499 | 3 (17.6%) | 0 (0.0%) |
| $2,500 to $2,999 | 0 (0.0%) | 0 (0.0%) |
| $3,000 or more | 0 (0.0%) | 0 (0.0%) |
| Total | 17 (100.0%) | 4 (100.0%) |
Physical Housing Characteristics in Phillipstown
Housing Structures in Phillipstown
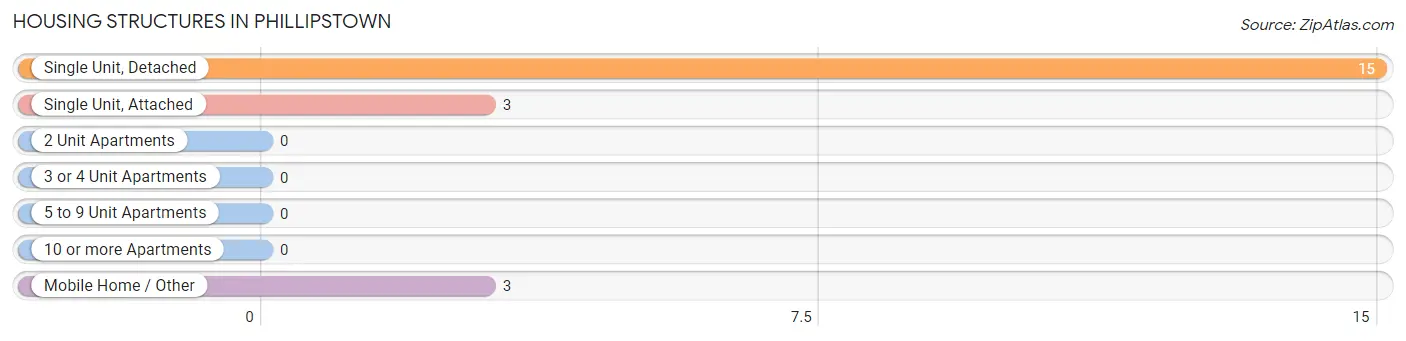
| Structure Type | # Housing Units | % Housing Units |
| Single Unit, Detached | 15 | 71.4% |
| Single Unit, Attached | 3 | 14.3% |
| 2 Unit Apartments | 0 | 0.0% |
| 3 or 4 Unit Apartments | 0 | 0.0% |
| 5 to 9 Unit Apartments | 0 | 0.0% |
| 10 or more Apartments | 0 | 0.0% |
| Mobile Home / Other | 3 | 14.3% |
| Total | 21 | 100.0% |
Housing Structures by Occupancy in Phillipstown
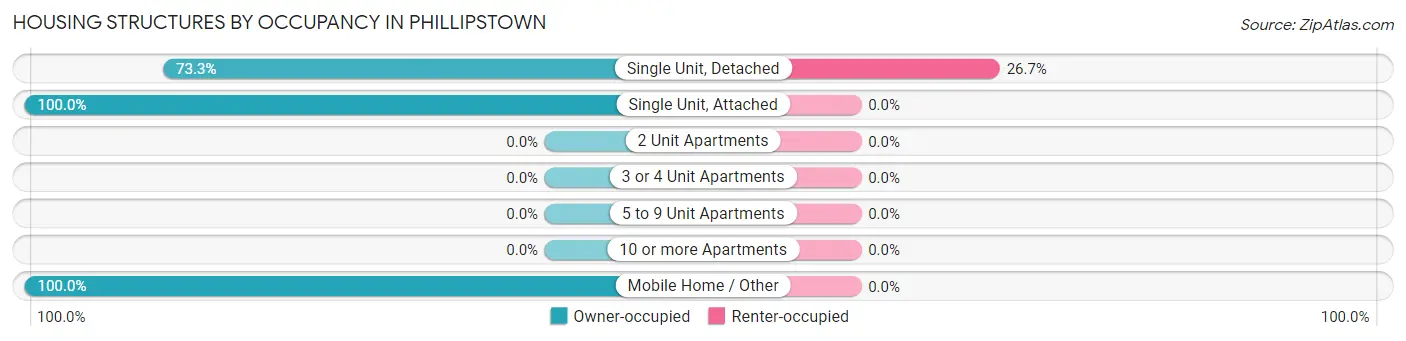
| Structure Type | Owner-occupied | Renter-occupied |
| Single Unit, Detached | 11 (73.3%) | 4 (26.7%) |
| Single Unit, Attached | 3 (100.0%) | 0 (0.0%) |
| 2 Unit Apartments | 0 (0.0%) | 0 (0.0%) |
| 3 or 4 Unit Apartments | 0 (0.0%) | 0 (0.0%) |
| 5 to 9 Unit Apartments | 0 (0.0%) | 0 (0.0%) |
| 10 or more Apartments | 0 (0.0%) | 0 (0.0%) |
| Mobile Home / Other | 3 (100.0%) | 0 (0.0%) |
| Total | 17 (80.9%) | 4 (19.1%) |
Housing Structures by Number of Rooms in Phillipstown
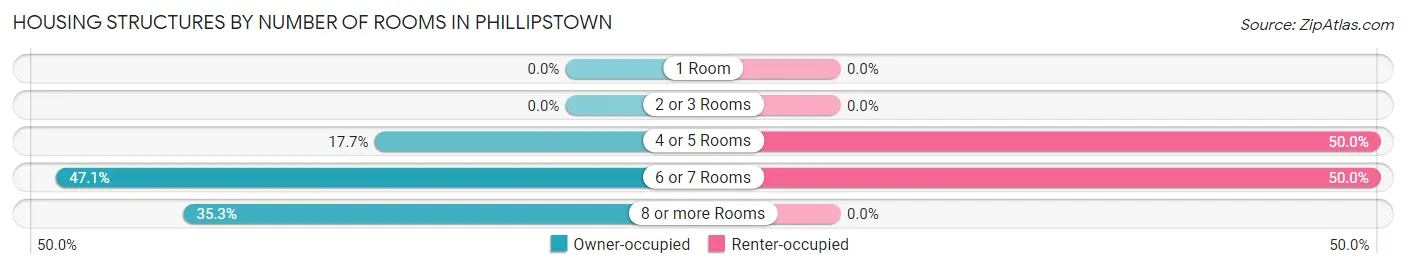
| Number of Rooms | Owner-occupied | Renter-occupied |
| 1 Room | 0 (0.0%) | 0 (0.0%) |
| 2 or 3 Rooms | 0 (0.0%) | 0 (0.0%) |
| 4 or 5 Rooms | 3 (17.6%) | 2 (50.0%) |
| 6 or 7 Rooms | 8 (47.1%) | 2 (50.0%) |
| 8 or more Rooms | 6 (35.3%) | 0 (0.0%) |
| Total | 17 (100.0%) | 4 (100.0%) |
Housing Structure by Heating Type in Phillipstown
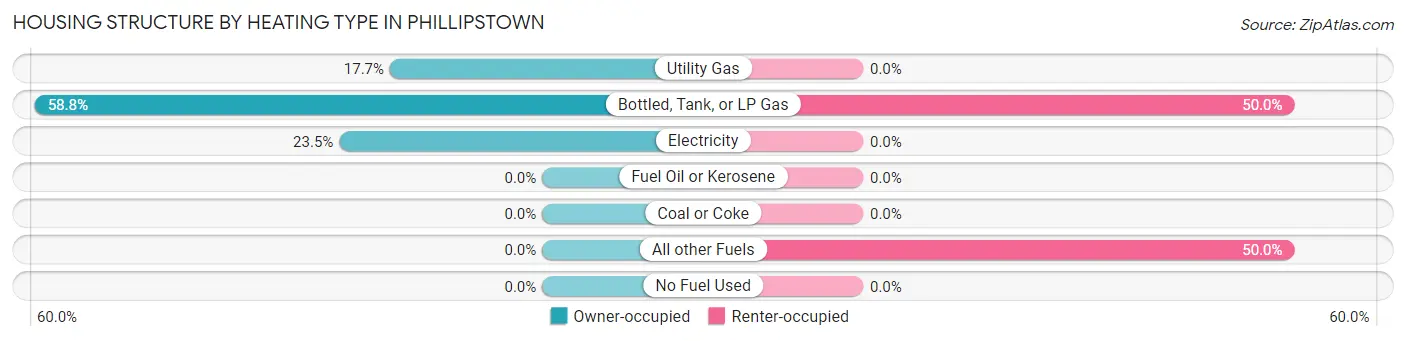
| Heating Type | Owner-occupied | Renter-occupied |
| Utility Gas | 3 (17.6%) | 0 (0.0%) |
| Bottled, Tank, or LP Gas | 10 (58.8%) | 2 (50.0%) |
| Electricity | 4 (23.5%) | 0 (0.0%) |
| Fuel Oil or Kerosene | 0 (0.0%) | 0 (0.0%) |
| Coal or Coke | 0 (0.0%) | 0 (0.0%) |
| All other Fuels | 0 (0.0%) | 2 (50.0%) |
| No Fuel Used | 0 (0.0%) | 0 (0.0%) |
| Total | 17 (100.0%) | 4 (100.0%) |
Household Vehicle Usage in Phillipstown
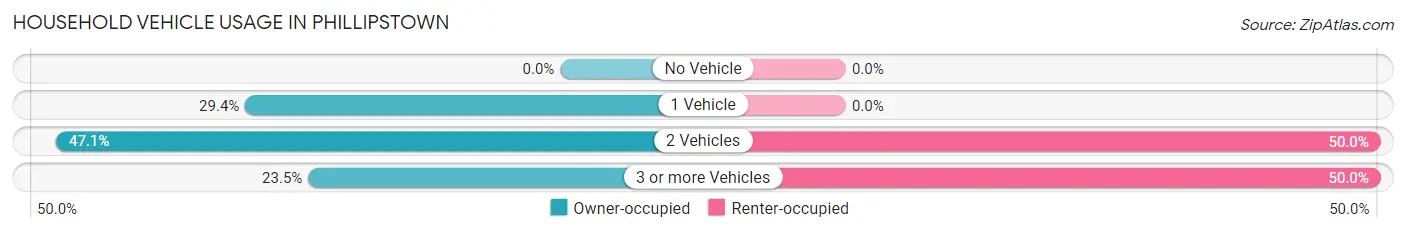
| Vehicles per Household | Owner-occupied | Renter-occupied |
| No Vehicle | 0 (0.0%) | 0 (0.0%) |
| 1 Vehicle | 5 (29.4%) | 0 (0.0%) |
| 2 Vehicles | 8 (47.1%) | 2 (50.0%) |
| 3 or more Vehicles | 4 (23.5%) | 2 (50.0%) |
| Total | 17 (100.0%) | 4 (100.0%) |
Real Estate & Mortgages in Phillipstown
Real Estate and Mortgage Overview in Phillipstown
| Characteristic | Without Mortgage | With Mortgage |
| Housing Units | 2 | 15 |
| Median Property Value | - | - |
| Median Household Income | - | - |
| Monthly Housing Costs | - | - |
| Real Estate Taxes | - | - |
Property Value by Mortgage Status in Phillipstown
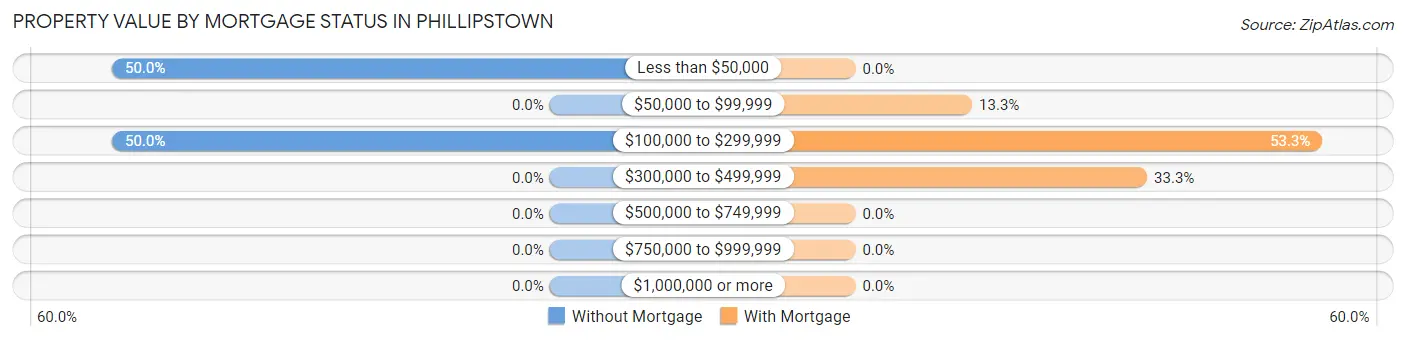
| Property Value | Without Mortgage | With Mortgage |
| Less than $50,000 | 1 (50.0%) | 0 (0.0%) |
| $50,000 to $99,999 | 0 (0.0%) | 2 (13.3%) |
| $100,000 to $299,999 | 1 (50.0%) | 8 (53.3%) |
| $300,000 to $499,999 | 0 (0.0%) | 5 (33.3%) |
| $500,000 to $749,999 | 0 (0.0%) | 0 (0.0%) |
| $750,000 to $999,999 | 0 (0.0%) | 0 (0.0%) |
| $1,000,000 or more | 0 (0.0%) | 0 (0.0%) |
| Total | 2 (100.0%) | 15 (100.0%) |
Household Income by Mortgage Status in Phillipstown
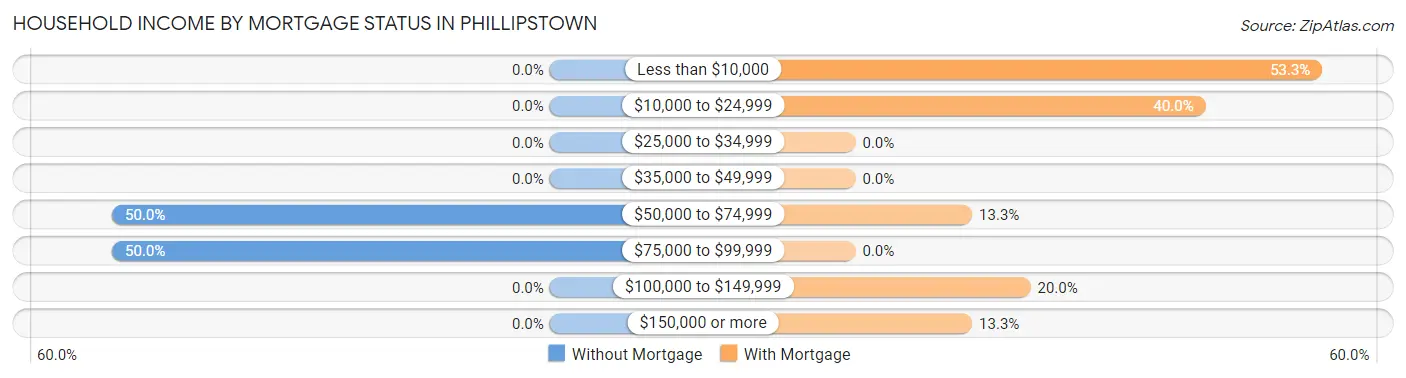
| Household Income | Without Mortgage | With Mortgage |
| Less than $10,000 | 0 (0.0%) | 8 (53.3%) |
| $10,000 to $24,999 | 0 (0.0%) | 6 (40.0%) |
| $25,000 to $34,999 | 0 (0.0%) | 0 (0.0%) |
| $35,000 to $49,999 | 0 (0.0%) | 0 (0.0%) |
| $50,000 to $74,999 | 1 (50.0%) | 2 (13.3%) |
| $75,000 to $99,999 | 1 (50.0%) | 0 (0.0%) |
| $100,000 to $149,999 | 0 (0.0%) | 3 (20.0%) |
| $150,000 or more | 0 (0.0%) | 2 (13.3%) |
| Total | 2 (100.0%) | 15 (100.0%) |
Property Value to Household Income Ratio in Phillipstown
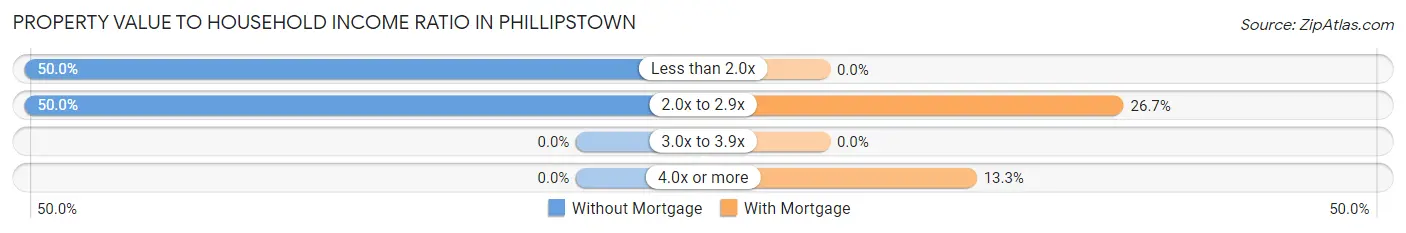
| Value-to-Income Ratio | Without Mortgage | With Mortgage |
| Less than 2.0x | 1 (50.0%) | 0 (0.0%) |
| 2.0x to 2.9x | 1 (50.0%) | 4 (26.7%) |
| 3.0x to 3.9x | 0 (0.0%) | 0 (0.0%) |
| 4.0x or more | 0 (0.0%) | 2 (13.3%) |
| Total | 2 (100.0%) | 15 (100.0%) |
Real Estate Taxes by Mortgage Status in Phillipstown
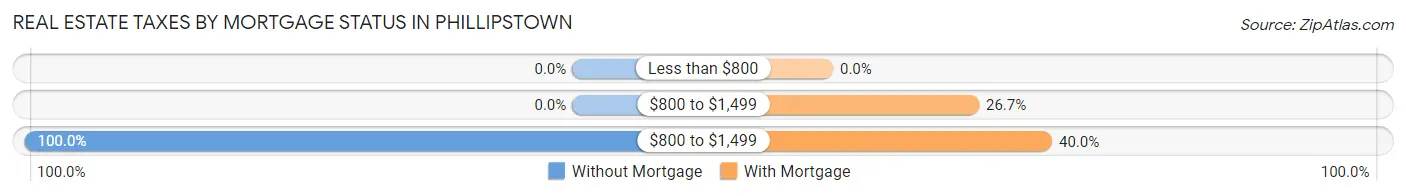
| Property Taxes | Without Mortgage | With Mortgage |
| Less than $800 | 0 (0.0%) | 0 (0.0%) |
| $800 to $1,499 | 0 (0.0%) | 4 (26.7%) |
| $800 to $1,499 | 2 (100.0%) | 6 (40.0%) |
| Total | 2 (100.0%) | 15 (100.0%) |
Health & Disability in Phillipstown
Health Insurance Coverage by Age in Phillipstown
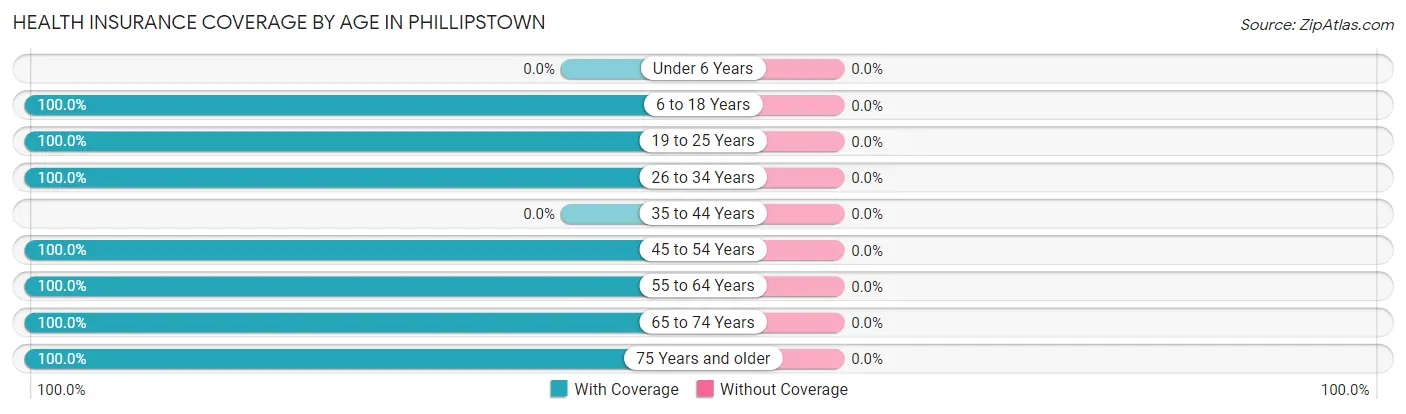
| Age Bracket | With Coverage | Without Coverage |
| Under 6 Years | 0 (0.0%) | 0 (0.0%) |
| 6 to 18 Years | 4 (100.0%) | 0 (0.0%) |
| 19 to 25 Years | 19 (100.0%) | 0 (0.0%) |
| 26 to 34 Years | 3 (100.0%) | 0 (0.0%) |
| 35 to 44 Years | 0 (0.0%) | 0 (0.0%) |
| 45 to 54 Years | 9 (100.0%) | 0 (0.0%) |
| 55 to 64 Years | 8 (100.0%) | 0 (0.0%) |
| 65 to 74 Years | 4 (100.0%) | 0 (0.0%) |
| 75 Years and older | 1 (100.0%) | 0 (0.0%) |
| Total | 48 (100.0%) | 0 (0.0%) |
Health Insurance Coverage by Citizenship Status in Phillipstown
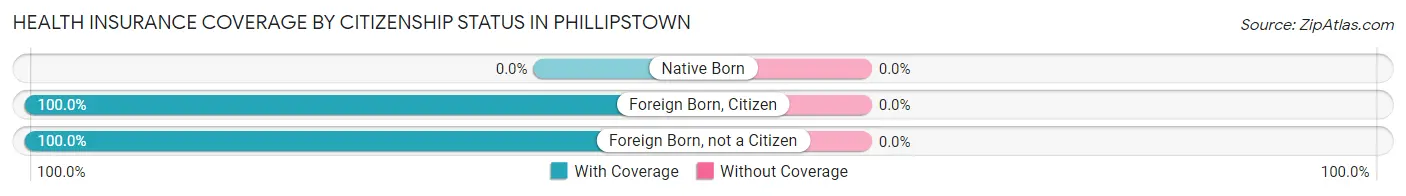
| Citizenship Status | With Coverage | Without Coverage |
| Native Born | 0 (0.0%) | 0 (0.0%) |
| Foreign Born, Citizen | 4 (100.0%) | 0 (0.0%) |
| Foreign Born, not a Citizen | 19 (100.0%) | 0 (0.0%) |
Health Insurance Coverage by Household Income in Phillipstown
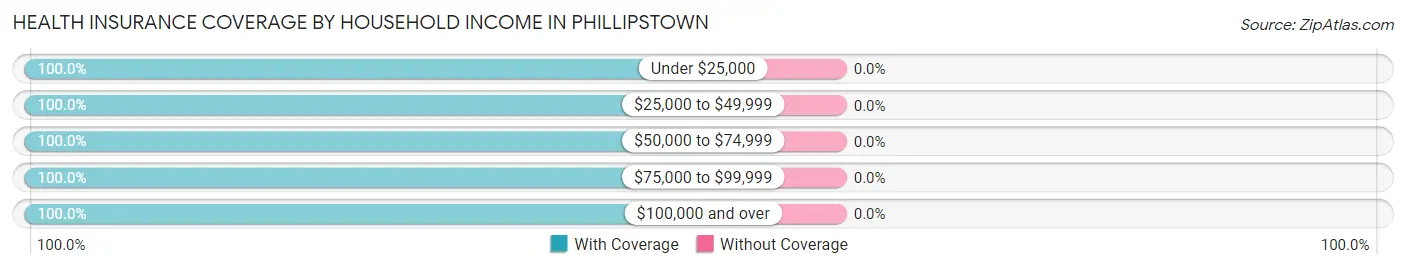
| Household Income | With Coverage | Without Coverage |
| Under $25,000 | 19 (100.0%) | 0 (0.0%) |
| $25,000 to $49,999 | 8 (100.0%) | 0 (0.0%) |
| $50,000 to $74,999 | 1 (100.0%) | 0 (0.0%) |
| $75,000 to $99,999 | 8 (100.0%) | 0 (0.0%) |
| $100,000 and over | 12 (100.0%) | 0 (0.0%) |
Public vs Private Health Insurance Coverage by Age in Phillipstown
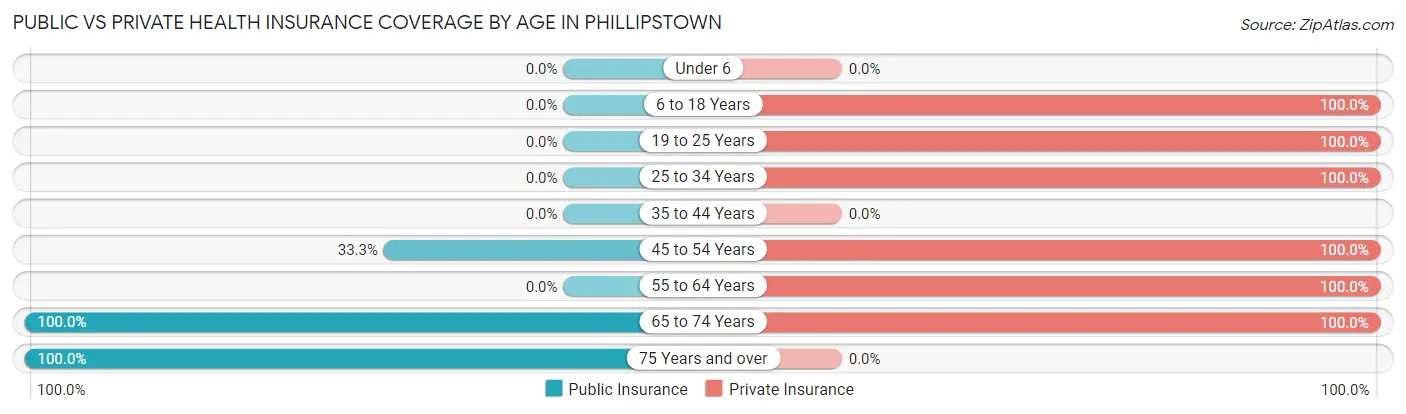
| Age Bracket | Public Insurance | Private Insurance |
| Under 6 | 0 (0.0%) | 0 (0.0%) |
| 6 to 18 Years | 0 (0.0%) | 4 (100.0%) |
| 19 to 25 Years | 0 (0.0%) | 19 (100.0%) |
| 25 to 34 Years | 0 (0.0%) | 3 (100.0%) |
| 35 to 44 Years | 0 (0.0%) | 0 (0.0%) |
| 45 to 54 Years | 3 (33.3%) | 9 (100.0%) |
| 55 to 64 Years | 0 (0.0%) | 8 (100.0%) |
| 65 to 74 Years | 4 (100.0%) | 4 (100.0%) |
| 75 Years and over | 1 (100.0%) | 0 (0.0%) |
| Total | 8 (16.7%) | 47 (97.9%) |
Disability Status by Sex by Age in Phillipstown
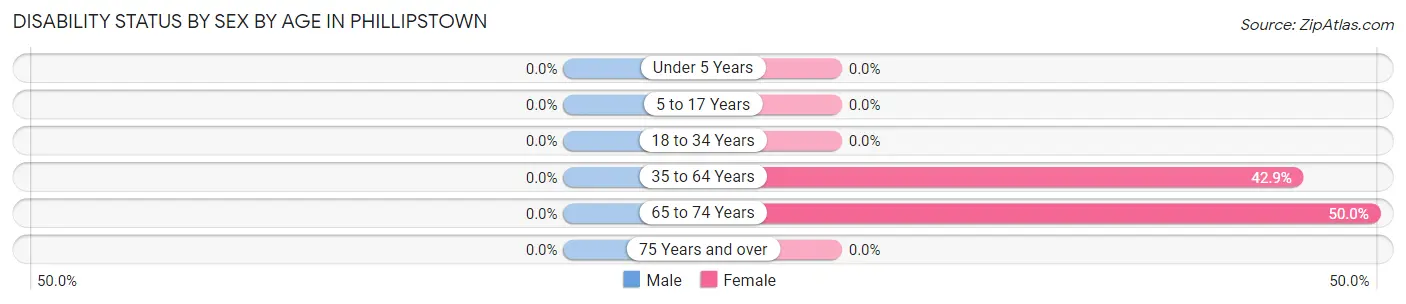
| Age Bracket | Male | Female |
| Under 5 Years | 0 (0.0%) | 0 (0.0%) |
| 5 to 17 Years | 0 (0.0%) | 0 (0.0%) |
| 18 to 34 Years | 0 (0.0%) | 0 (0.0%) |
| 35 to 64 Years | 0 (0.0%) | 3 (42.9%) |
| 65 to 74 Years | 0 (0.0%) | 1 (50.0%) |
| 75 Years and over | 0 (0.0%) | 0 (0.0%) |
Disability Class by Sex by Age in Phillipstown
Disability Class: Hearing Difficulty
| Age Bracket | Male | Female |
| Under 5 Years | 0 (0.0%) | 0 (0.0%) |
| 5 to 17 Years | 0 (0.0%) | 0 (0.0%) |
| 18 to 34 Years | 0 (0.0%) | 0 (0.0%) |
| 35 to 64 Years | 0 (0.0%) | 0 (0.0%) |
| 65 to 74 Years | 0 (0.0%) | 0 (0.0%) |
| 75 Years and over | 0 (0.0%) | 0 (0.0%) |
Disability Class: Vision Difficulty
| Age Bracket | Male | Female |
| Under 5 Years | 0 (0.0%) | 0 (0.0%) |
| 5 to 17 Years | 0 (0.0%) | 0 (0.0%) |
| 18 to 34 Years | 0 (0.0%) | 0 (0.0%) |
| 35 to 64 Years | 0 (0.0%) | 0 (0.0%) |
| 65 to 74 Years | 0 (0.0%) | 0 (0.0%) |
| 75 Years and over | 0 (0.0%) | 0 (0.0%) |
Disability Class: Cognitive Difficulty
| Age Bracket | Male | Female |
| 5 to 17 Years | 0 (0.0%) | 0 (0.0%) |
| 18 to 34 Years | 0 (0.0%) | 0 (0.0%) |
| 35 to 64 Years | 0 (0.0%) | 0 (0.0%) |
| 65 to 74 Years | 0 (0.0%) | 0 (0.0%) |
| 75 Years and over | 0 (0.0%) | 0 (0.0%) |
Disability Class: Ambulatory Difficulty
| Age Bracket | Male | Female |
| 5 to 17 Years | 0 (0.0%) | 0 (0.0%) |
| 18 to 34 Years | 0 (0.0%) | 0 (0.0%) |
| 35 to 64 Years | 0 (0.0%) | 3 (42.9%) |
| 65 to 74 Years | 0 (0.0%) | 1 (50.0%) |
| 75 Years and over | 0 (0.0%) | 0 (0.0%) |
Disability Class: Self-Care Difficulty
| Age Bracket | Male | Female |
| 5 to 17 Years | 0 (0.0%) | 0 (0.0%) |
| 18 to 34 Years | 0 (0.0%) | 0 (0.0%) |
| 35 to 64 Years | 0 (0.0%) | 0 (0.0%) |
| 65 to 74 Years | 0 (0.0%) | 0 (0.0%) |
| 75 Years and over | 0 (0.0%) | 0 (0.0%) |
Technology Access in Phillipstown
Computing Device Access in Phillipstown
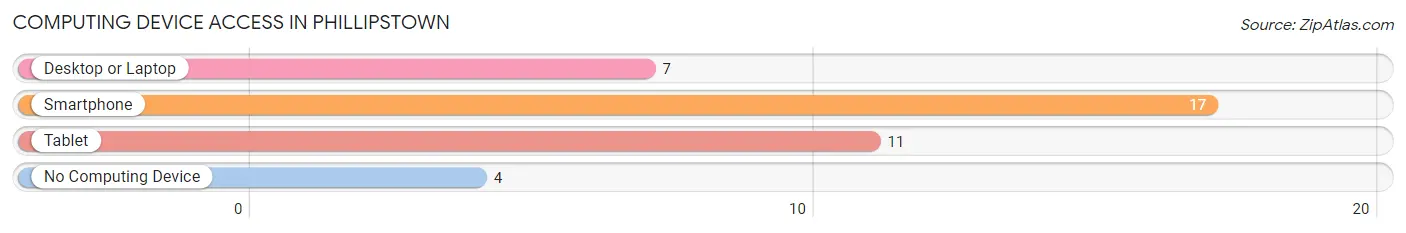
| Device Type | # Households | % Households |
| Desktop or Laptop | 7 | 33.3% |
| Smartphone | 17 | 80.9% |
| Tablet | 11 | 52.4% |
| No Computing Device | 4 | 19.1% |
| Total | 21 | 100.0% |
Internet Access in Phillipstown
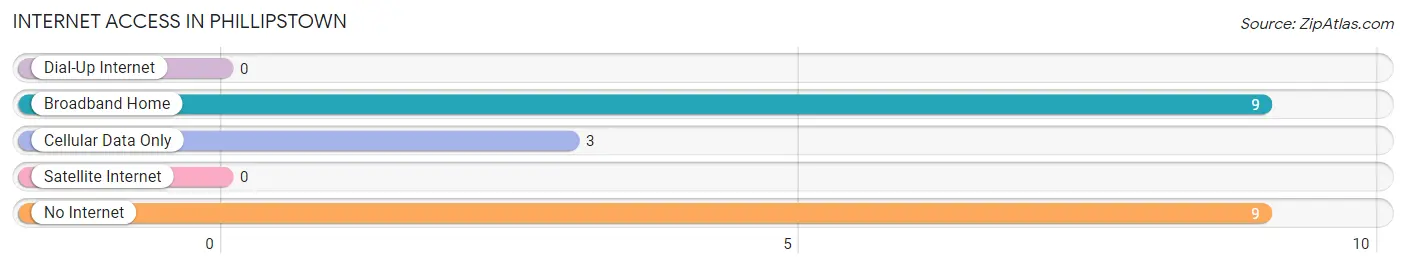
| Internet Type | # Households | % Households |
| Dial-Up Internet | 0 | 0.0% |
| Broadband Home | 9 | 42.9% |
| Cellular Data Only | 3 | 14.3% |
| Satellite Internet | 0 | 0.0% |
| No Internet | 9 | 42.9% |
| Total | 21 | 100.0% |
Phillipstown Summary
Phillipstown is a small village located in White County, Illinois, United States. The population was 545 at the 2010 census. It is part of the Mount Carmel, Illinois Micropolitan Statistical Area.
History
Phillipstown was founded in 1837 by Phillip and Mary Ann (nee) Smith. The Smiths were originally from Kentucky and had moved to Illinois in 1835. They purchased a tract of land in White County and began to build a small village. The village was named after Phillip Smith and was originally known as Smithtown. In 1845, the name was changed to Phillipstown in honor of the Smiths.
The village grew slowly but steadily over the years. By the late 19th century, it had become a thriving community with a population of around 500. The village had a post office, a general store, a blacksmith shop, a school, and several churches.
Geography
Phillipstown is located at 38°17'25" North, 88°25'45" West (38.290278, -88.429167). According to the 2010 census, the village has a total area of 0.6 square miles (1.6 km2), all land.
Economy
Phillipstown is a small, rural community with a limited economy. The village is home to a few small businesses, including a general store, a gas station, and a few restaurants. The village also has a post office and a bank.
The village is also home to a few small farms, which produce corn, soybeans, and other crops. The village also has a few small manufacturing businesses, which produce a variety of products, including furniture, clothing, and other items.
Demographics
As of the 2010 census, there were 545 people, 212 households, and 149 families residing in the village. The population density was 890.0 people per square mile (344.3/km2). There were 229 housing units at an average density of 376.7 per square mile (145.3/km2). The racial makeup of the village was 98.2% White, 0.2% African American, 0.2% Native American, 0.2% Asian, 0.2% from other races, and 0.9% from two or more races. Hispanic or Latino of any race were 0.7% of the population.
There were 212 households, out of which 33.0% had children under the age of 18 living with them, 54.2% were married couples living together, 10.8% had a female householder with no husband present, and 30.2% were non-families. 25.5% of all households were made up of individuals, and 11.3% had someone living alone who was 65 years of age or older. The average household size was 2.58 and the average family size was 3.09.
In the village, the population was spread out, with 27.2% under the age of 18, 8.2% from 18 to 24, 28.2% from 25 to 44, 22.7% from 45 to 64, and 13.7% who were 65 years of age or older. The median age was 36 years. For every 100 females, there were 97.3 males. For every 100 females age 18 and over, there were 94.2 males.
The median income for a household in the village was $37,500, and the median income for a family was $41,250. Males had a median income of $30,000 versus $20,833 for females. The per capita income for the village was $15,945. About 8.3% of families and 10.2% of the population were below the poverty line, including 11.3% of those under age 18 and 8.3% of those age 65 or over.
Common Questions
What is Per Capita Income in Phillipstown?
Per Capita income in Phillipstown is $28,129.
What is Inequality or Gini Index in Phillipstown?
Inequality or Gini Index in Phillipstown is 0.45.
What is the Total Population of Phillipstown?
Total Population of Phillipstown is 48.
What is the Total Male Population of Phillipstown?
Total Male Population of Phillipstown is 37.
What is the Total Female Population of Phillipstown?
Total Female Population of Phillipstown is 11.
What is the Ratio of Males per 100 Females in Phillipstown?
There are 336.36 Males per 100 Females in Phillipstown.
What is the Ratio of Females per 100 Males in Phillipstown?
There are 29.73 Females per 100 Males in Phillipstown.
What is the Median Population Age in Phillipstown?
Median Population Age in Phillipstown is 30.5 Years.
What is the Average Family Size in Phillipstown
Average Family Size in Phillipstown is 2.6 People.
What is the Average Household Size in Phillipstown
Average Household Size in Phillipstown is 2.3 People.
How Large is the Labor Force in Phillipstown?
There are 22 People in the Labor Forcein in Phillipstown.
What is the Percentage of People in the Labor Force in Phillipstown?
50.0% of People are in the Labor Force in Phillipstown.