Wylandville, PA Map & Demographics
Wylandville Map
Wylandville Overview
$46,398
PER CAPITA INCOME
$175,988
AVG FAMILY INCOME
51.2%
WAGE / INCOME GAP [ % ]
48.8¢/ $1
WAGE / INCOME GAP [ $ ]
0.52
INEQUALITY / GINI INDEX
529
TOTAL POPULATION
254
MALE POPULATION
275
FEMALE POPULATION
92.36
MALES / 100 FEMALES
108.27
FEMALES / 100 MALES
37.3
MEDIAN AGE
3.2
AVG FAMILY SIZE
2.3
AVG HOUSEHOLD SIZE
291
LABOR FORCE [ PEOPLE ]
70.6%
PERCENT IN LABOR FORCE
Income in Wylandville
Income Overview in Wylandville
| Characteristic | Number | Measure |
| Per Capita Income | 529 | $46,398 |
| Median Family Income | 130 | $175,988 |
| Mean Family Income | 130 | $168,651 |
| Median Household Income | 233 | $0 |
| Mean Household Income | 233 | $107,098 |
| Income Deficit | 130 | $0 |
| Wage / Income Gap (%) | 529 | 51.22% |
| Wage / Income Gap ($) | 529 | 48.78¢ per $1 |
| Gini / Inequality Index | 529 | 0.52 |
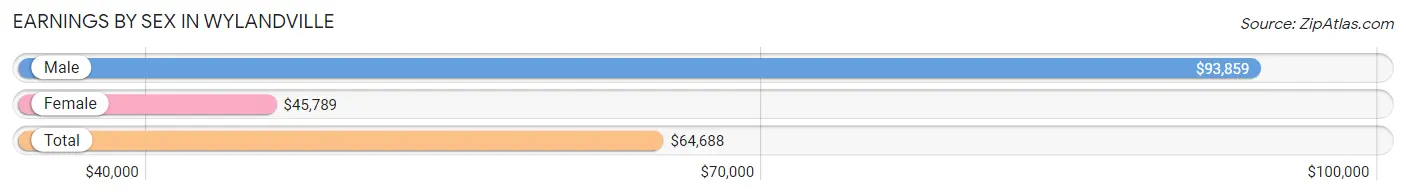
Earnings by Sex in Wylandville
Average Earnings in Wylandville are $64,688, $93,859 for men and $45,789 for women, a difference of 51.2%.
| Sex | Number | Average Earnings |
| Male | 163 (56.0%) | $93,859 |
| Female | 128 (44.0%) | $45,789 |
| Total | 291 (100.0%) | $64,688 |
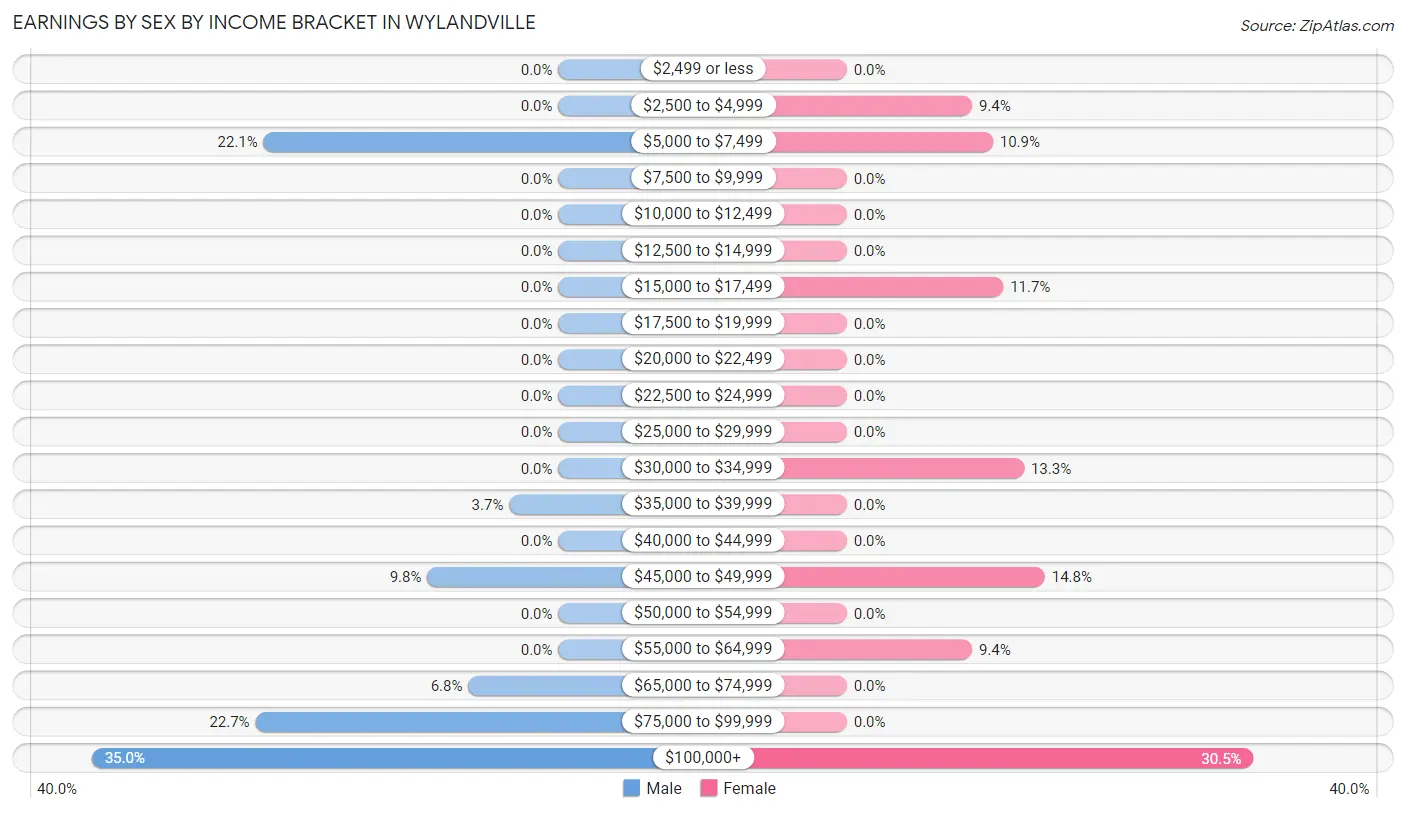
Earnings by Sex by Income Bracket in Wylandville
The most common earnings brackets in Wylandville are $100,000+ for men (57 | 35.0%) and $100,000+ for women (39 | 30.5%).
| Income | Male | Female |
| $2,499 or less | 0 (0.0%) | 0 (0.0%) |
| $2,500 to $4,999 | 0 (0.0%) | 12 (9.4%) |
| $5,000 to $7,499 | 36 (22.1%) | 14 (10.9%) |
| $7,500 to $9,999 | 0 (0.0%) | 0 (0.0%) |
| $10,000 to $12,499 | 0 (0.0%) | 0 (0.0%) |
| $12,500 to $14,999 | 0 (0.0%) | 0 (0.0%) |
| $15,000 to $17,499 | 0 (0.0%) | 15 (11.7%) |
| $17,500 to $19,999 | 0 (0.0%) | 0 (0.0%) |
| $20,000 to $22,499 | 0 (0.0%) | 0 (0.0%) |
| $22,500 to $24,999 | 0 (0.0%) | 0 (0.0%) |
| $25,000 to $29,999 | 0 (0.0%) | 0 (0.0%) |
| $30,000 to $34,999 | 0 (0.0%) | 17 (13.3%) |
| $35,000 to $39,999 | 6 (3.7%) | 0 (0.0%) |
| $40,000 to $44,999 | 0 (0.0%) | 0 (0.0%) |
| $45,000 to $49,999 | 16 (9.8%) | 19 (14.8%) |
| $50,000 to $54,999 | 0 (0.0%) | 0 (0.0%) |
| $55,000 to $64,999 | 0 (0.0%) | 12 (9.4%) |
| $65,000 to $74,999 | 11 (6.8%) | 0 (0.0%) |
| $75,000 to $99,999 | 37 (22.7%) | 0 (0.0%) |
| $100,000+ | 57 (35.0%) | 39 (30.5%) |
| Total | 163 (100.0%) | 128 (100.0%) |
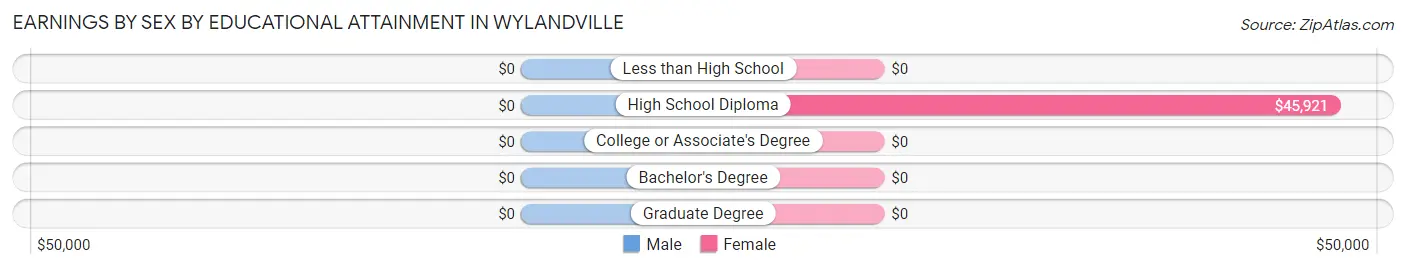
Earnings by Sex by Educational Attainment in Wylandville
| Educational Attainment | Male Income | Female Income |
| Less than High School | - | - |
| High School Diploma | - | - |
| College or Associate's Degree | - | - |
| Bachelor's Degree | - | - |
| Graduate Degree | - | - |
| Total | $98,839 | $46,579 |
Family Income in Wylandville
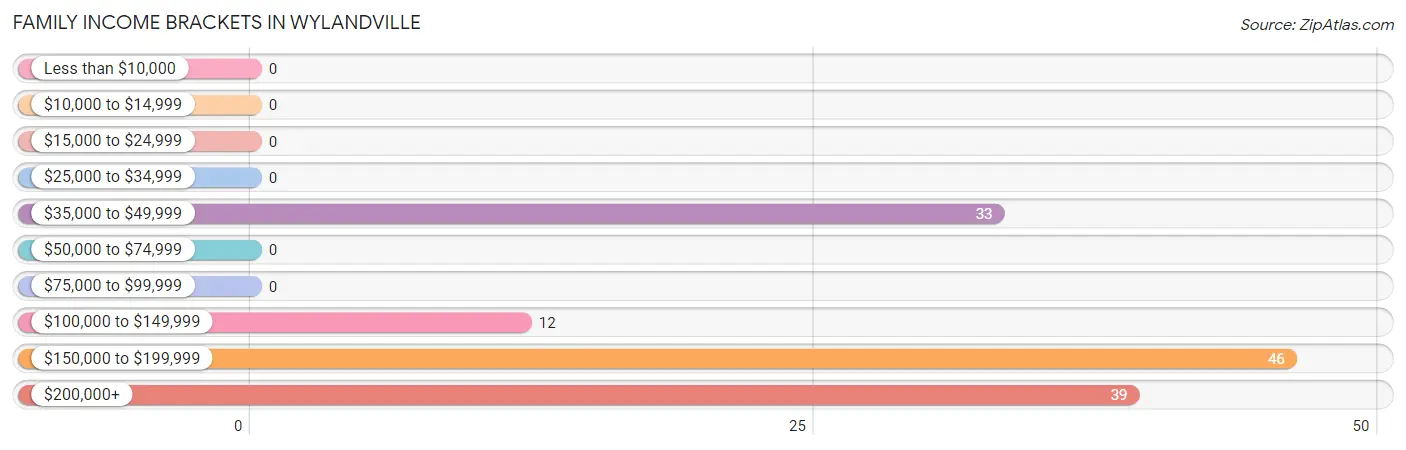
Family Income Brackets in Wylandville
According to the Wylandville family income data, there are 46 families falling into the $150,000 to $199,999 income range, which is the most common income bracket and makes up 35.4% of all families.
| Income Bracket | # Families | % Families |
| Less than $10,000 | 0 | 0.0% |
| $10,000 to $14,999 | 0 | 0.0% |
| $15,000 to $24,999 | 0 | 0.0% |
| $25,000 to $34,999 | 0 | 0.0% |
| $35,000 to $49,999 | 33 | 25.4% |
| $50,000 to $74,999 | 0 | 0.0% |
| $75,000 to $99,999 | 0 | 0.0% |
| $100,000 to $149,999 | 12 | 9.2% |
| $150,000 to $199,999 | 46 | 35.4% |
| $200,000+ | 39 | 30.0% |
Family Income by Famaliy Size in Wylandville
| Income Bracket | # Families | Median Income |
| 2-Person Families | 70 (53.8%) | $0 |
| 3-Person Families | 3 (2.3%) | $0 |
| 4-Person Families | 43 (33.1%) | $0 |
| 5-Person Families | 0 (0.0%) | $0 |
| 6-Person Families | 14 (10.8%) | $0 |
| 7+ Person Families | 0 (0.0%) | $0 |
| Total | 130 (100.0%) | $175,988 |
Family Income by Number of Earners in Wylandville
| Number of Earners | # Families | Median Income |
| No Earners | 0 (0.0%) | $0 |
| 1 Earner | 88 (67.7%) | $0 |
| 2 Earners | 28 (21.5%) | $0 |
| 3+ Earners | 14 (10.8%) | $0 |
| Total | 130 (100.0%) | $175,988 |
Household Income in Wylandville
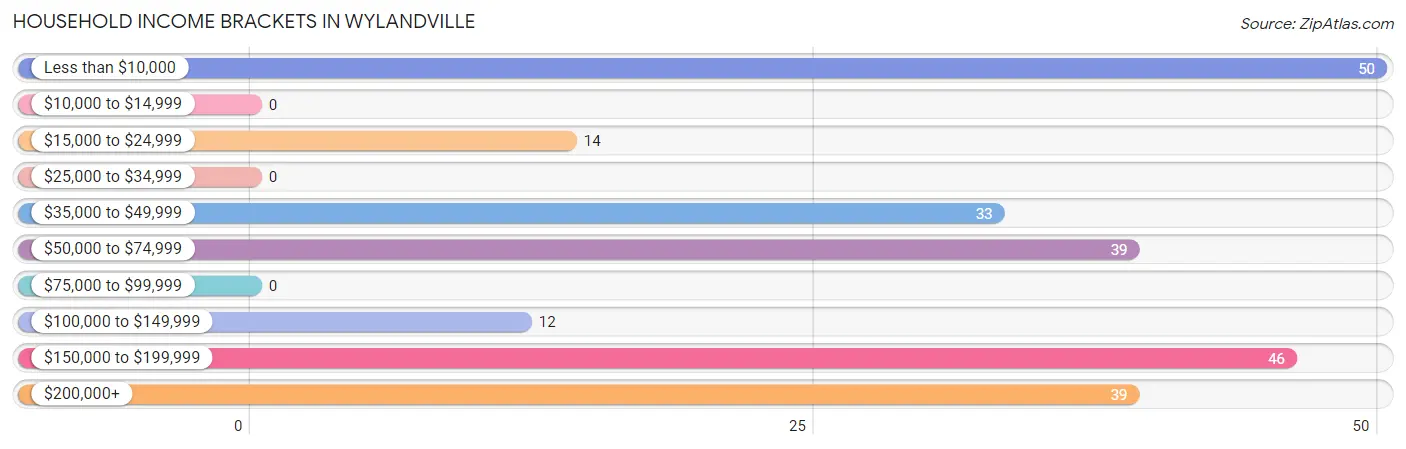
Household Income Brackets in Wylandville
With 50 households falling in the category, the less than $10,000 income range is the most frequent in Wylandville, accounting for 21.5% of all households.
| Income Bracket | # Households | % Households |
| Less than $10,000 | 50 | 21.5% |
| $10,000 to $14,999 | 0 | 0.0% |
| $15,000 to $24,999 | 14 | 6.0% |
| $25,000 to $34,999 | 0 | 0.0% |
| $35,000 to $49,999 | 33 | 14.2% |
| $50,000 to $74,999 | 39 | 16.7% |
| $75,000 to $99,999 | 0 | 0.0% |
| $100,000 to $149,999 | 12 | 5.2% |
| $150,000 to $199,999 | 46 | 19.7% |
| $200,000+ | 39 | 16.7% |
Household Income by Householder Age in Wylandville
The median household income in Wylandville is $0, with the highest median household income of $47,188 found in the 65+ years age bracket for the primary householder. A total of 56 households (24.0%) fall into this category. Meanwhile, the 15 to 24 years age bracket for the primary householder has the lowest median household income of $0, with 48 households (20.6%) in this group.
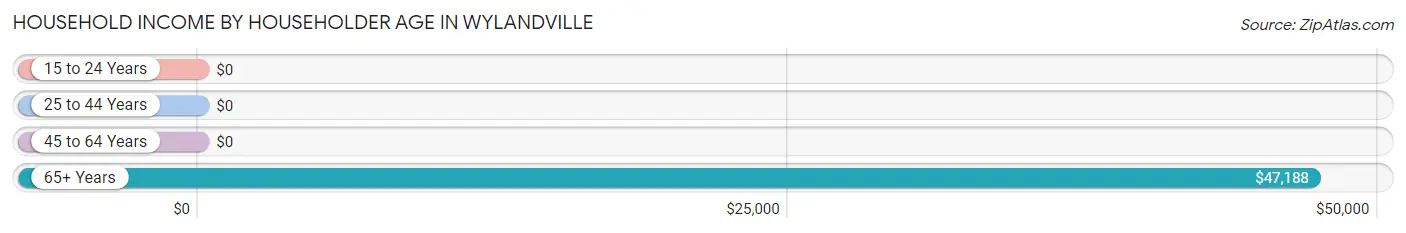
| Income Bracket | # Households | Median Income |
| 15 to 24 Years | 48 (20.6%) | $0 |
| 25 to 44 Years | 43 (18.4%) | $0 |
| 45 to 64 Years | 86 (36.9%) | $0 |
| 65+ Years | 56 (24.0%) | $47,188 |
| Total | 233 (100.0%) | $0 |
Poverty in Wylandville
Income Below Poverty by Sex and Age in Wylandville
With 14.2% poverty level for males and 9.5% for females among the residents of Wylandville, 18 to 24 year old males and 18 to 24 year old females are the most vulnerable to poverty, with 36 males (100.0%) and 12 females (100.0%) in their respective age groups living below the poverty level.
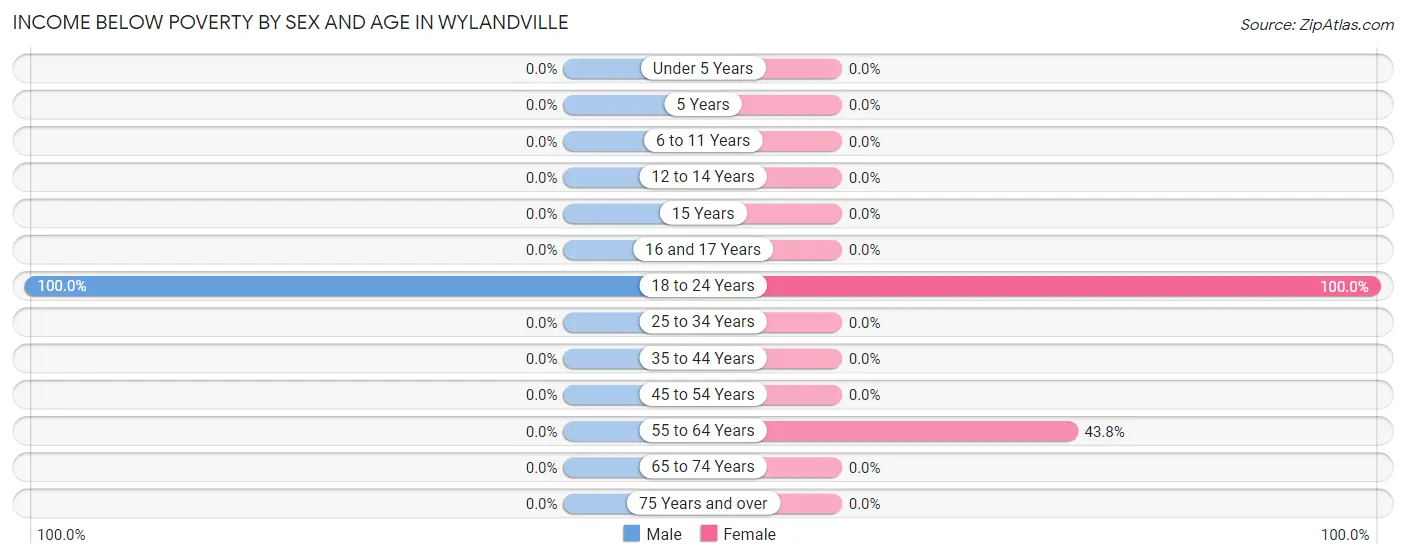
| Age Bracket | Male | Female |
| Under 5 Years | 0 (0.0%) | 0 (0.0%) |
| 5 Years | 0 (0.0%) | 0 (0.0%) |
| 6 to 11 Years | 0 (0.0%) | 0 (0.0%) |
| 12 to 14 Years | 0 (0.0%) | 0 (0.0%) |
| 15 Years | 0 (0.0%) | 0 (0.0%) |
| 16 and 17 Years | 0 (0.0%) | 0 (0.0%) |
| 18 to 24 Years | 36 (100.0%) | 12 (100.0%) |
| 25 to 34 Years | 0 (0.0%) | 0 (0.0%) |
| 35 to 44 Years | 0 (0.0%) | 0 (0.0%) |
| 45 to 54 Years | 0 (0.0%) | 0 (0.0%) |
| 55 to 64 Years | 0 (0.0%) | 14 (43.8%) |
| 65 to 74 Years | 0 (0.0%) | 0 (0.0%) |
| 75 Years and over | 0 (0.0%) | 0 (0.0%) |
| Total | 36 (14.2%) | 26 (9.5%) |
Income Above Poverty by Sex and Age in Wylandville
According to the poverty statistics in Wylandville, males aged 6 to 11 years and females aged under 5 years are the age groups that are most secure financially, with 100.0% of males and 100.0% of females in these age groups living above the poverty line.
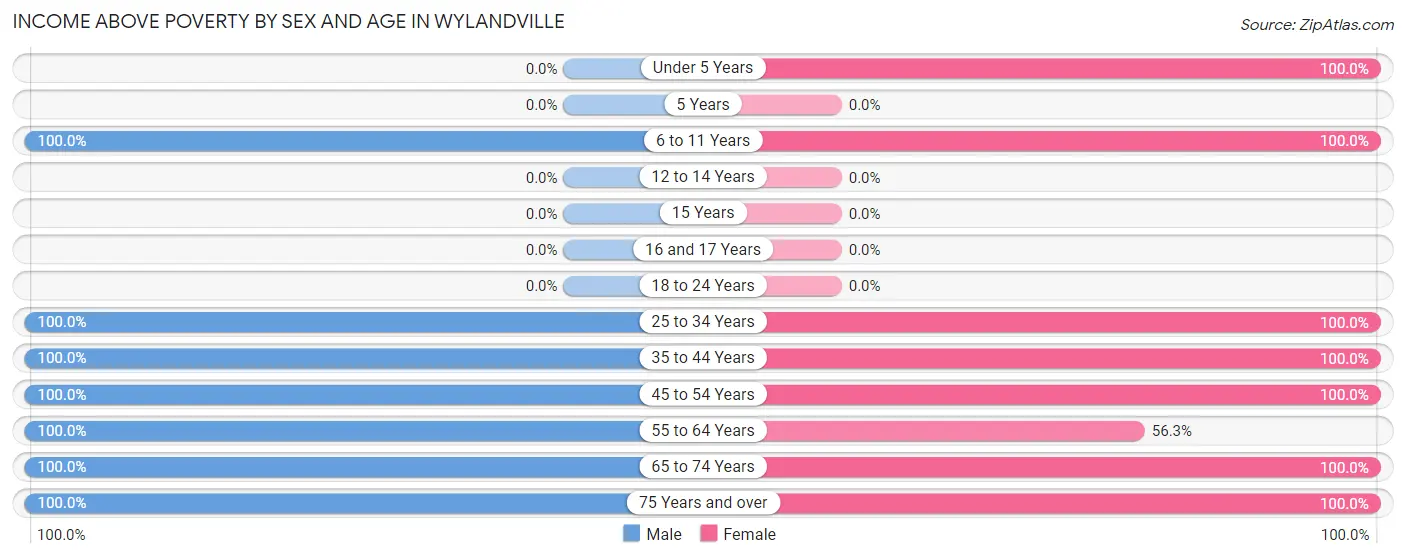
| Age Bracket | Male | Female |
| Under 5 Years | 0 (0.0%) | 15 (100.0%) |
| 5 Years | 0 (0.0%) | 0 (0.0%) |
| 6 to 11 Years | 48 (100.0%) | 54 (100.0%) |
| 12 to 14 Years | 0 (0.0%) | 0 (0.0%) |
| 15 Years | 0 (0.0%) | 0 (0.0%) |
| 16 and 17 Years | 0 (0.0%) | 0 (0.0%) |
| 18 to 24 Years | 0 (0.0%) | 0 (0.0%) |
| 25 to 34 Years | 25 (100.0%) | 15 (100.0%) |
| 35 to 44 Years | 43 (100.0%) | 48 (100.0%) |
| 45 to 54 Years | 20 (100.0%) | 57 (100.0%) |
| 55 to 64 Years | 56 (100.0%) | 18 (56.2%) |
| 65 to 74 Years | 12 (100.0%) | 39 (100.0%) |
| 75 Years and over | 14 (100.0%) | 3 (100.0%) |
| Total | 218 (85.8%) | 249 (90.5%) |
Income Below Poverty Among Married-Couple Families in Wylandville
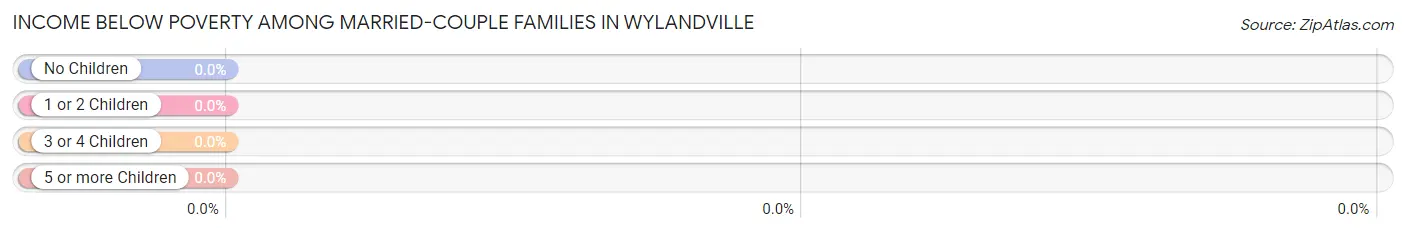
| Children | Above Poverty | Below Poverty |
| No Children | 54 (100.0%) | 0 (0.0%) |
| 1 or 2 Children | 57 (100.0%) | 0 (0.0%) |
| 3 or 4 Children | 0 (0.0%) | 0 (0.0%) |
| 5 or more Children | 0 (0.0%) | 0 (0.0%) |
| Total | 111 (100.0%) | 0 (0.0%) |
Income Below Poverty Among Single-Parent Households in Wylandville
| Children | Single Father | Single Mother |
| No Children | 0 (0.0%) | 0 (0.0%) |
| 1 or 2 Children | 0 (0.0%) | 0 (0.0%) |
| 3 or 4 Children | 0 (0.0%) | 0 (0.0%) |
| 5 or more Children | 0 (0.0%) | 0 (0.0%) |
| Total | 0 (0.0%) | 0 (0.0%) |
Income Below Poverty Among Married-Couple vs Single-Parent Households in Wylandville
| Children | Married-Couple Families | Single-Parent Households |
| No Children | 0 (0.0%) | 0 (0.0%) |
| 1 or 2 Children | 0 (0.0%) | 0 (0.0%) |
| 3 or 4 Children | 0 (0.0%) | 0 (0.0%) |
| 5 or more Children | 0 (0.0%) | 0 (0.0%) |
| Total | 0 (0.0%) | 0 (0.0%) |
Race in Wylandville
The most populous races in Wylandville are White / Caucasian (528 | 99.8%), and Hawaiian / Pacific (1 | 0.2%).
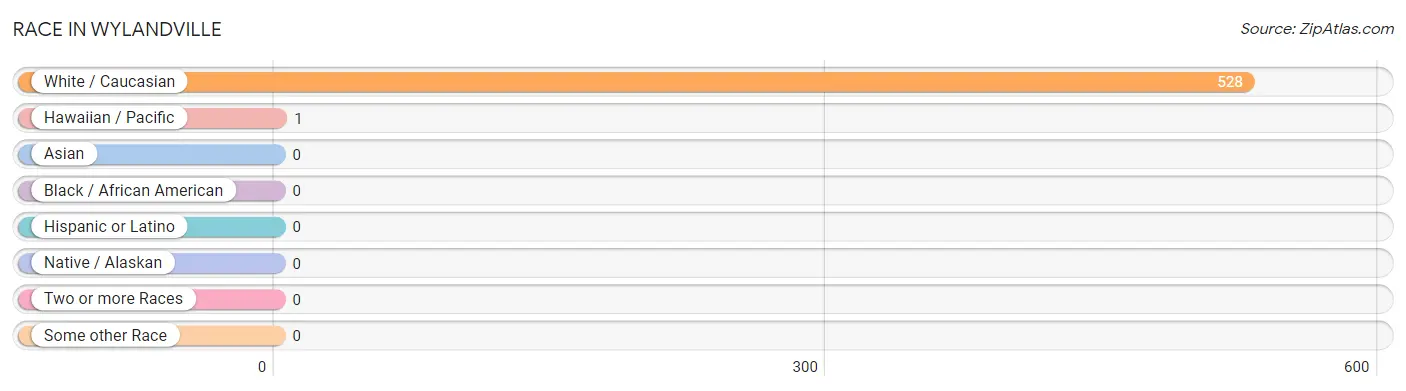
| Race | # Population | % Population |
| Asian | 0 | 0.0% |
| Black / African American | 0 | 0.0% |
| Hawaiian / Pacific | 1 | 0.2% |
| Hispanic or Latino | 0 | 0.0% |
| Native / Alaskan | 0 | 0.0% |
| White / Caucasian | 528 | 99.8% |
| Two or more Races | 0 | 0.0% |
| Some other Race | 0 | 0.0% |
| Total | 529 | 100.0% |
Ancestry in Wylandville
The most populous ancestries reported in Wylandville are German (73 | 13.8%), Italian (71 | 13.4%), Irish (67 | 12.7%), Polish (43 | 8.1%), and Swedish (25 | 4.7%), together accounting for 52.7% of all Wylandville residents.
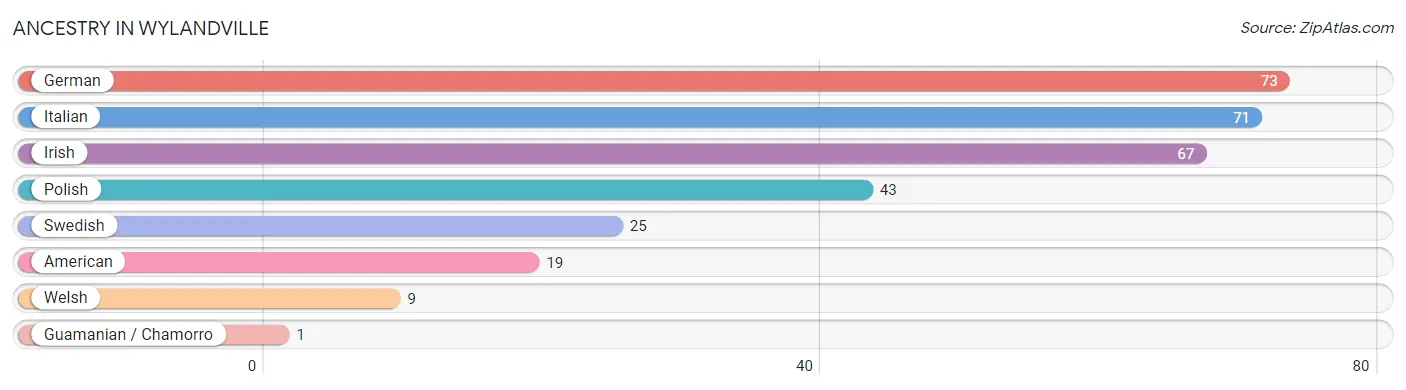
| Ancestry | # Population | % Population |
| American | 19 | 3.6% |
| German | 73 | 13.8% |
| Guamanian / Chamorro | 1 | 0.2% |
| Irish | 67 | 12.7% |
| Italian | 71 | 13.4% |
| Polish | 43 | 8.1% |
| Swedish | 25 | 4.7% |
| Welsh | 9 | 1.7% | View All 8 Rows |
Immigrants in Wylandville

| Immigration Origin | # Population | % Population | View All 0 Rows |
Sex and Age in Wylandville
Sex and Age in Wylandville
The most populous age groups in Wylandville are 5 to 9 Years (48 | 18.9%) for men and 5 to 9 Years (54 | 19.6%) for women.
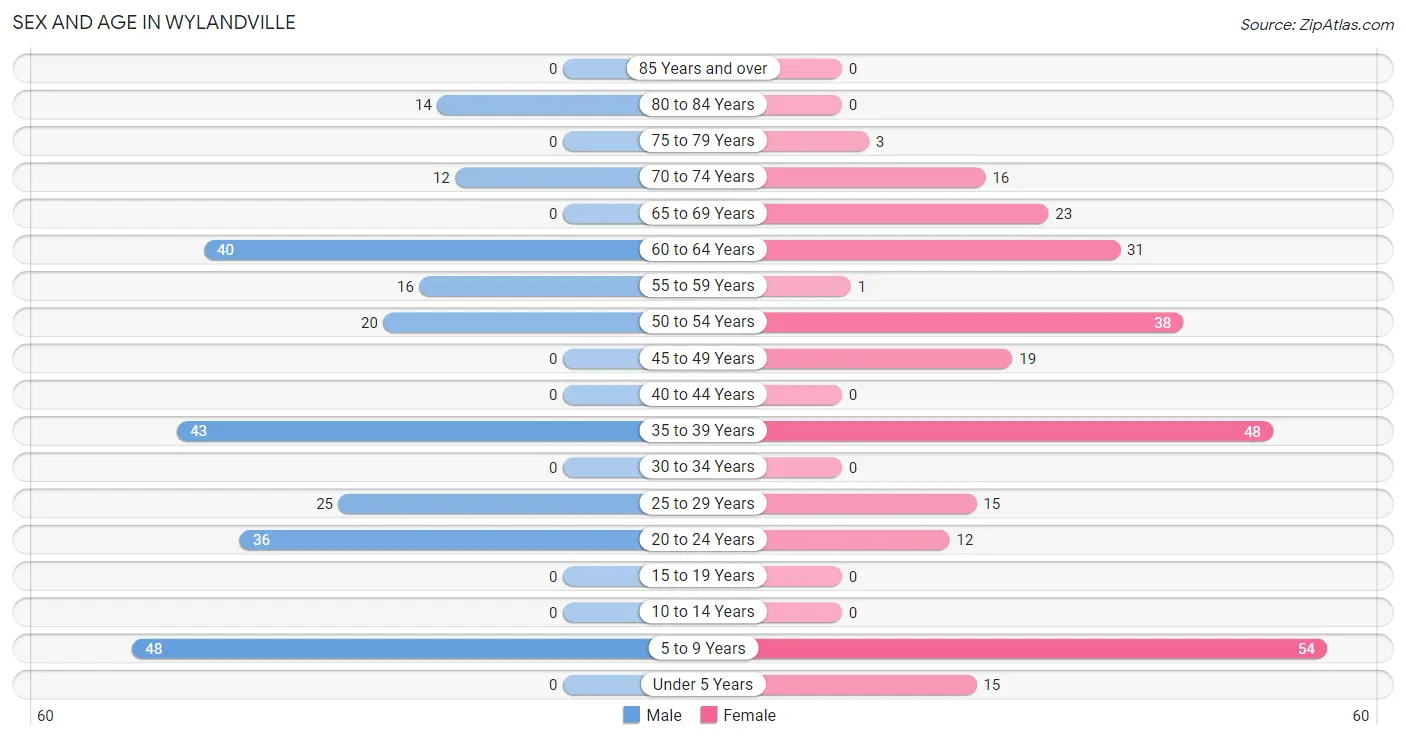
| Age Bracket | Male | Female |
| Under 5 Years | 0 (0.0%) | 15 (5.4%) |
| 5 to 9 Years | 48 (18.9%) | 54 (19.6%) |
| 10 to 14 Years | 0 (0.0%) | 0 (0.0%) |
| 15 to 19 Years | 0 (0.0%) | 0 (0.0%) |
| 20 to 24 Years | 36 (14.2%) | 12 (4.4%) |
| 25 to 29 Years | 25 (9.8%) | 15 (5.4%) |
| 30 to 34 Years | 0 (0.0%) | 0 (0.0%) |
| 35 to 39 Years | 43 (16.9%) | 48 (17.4%) |
| 40 to 44 Years | 0 (0.0%) | 0 (0.0%) |
| 45 to 49 Years | 0 (0.0%) | 19 (6.9%) |
| 50 to 54 Years | 20 (7.9%) | 38 (13.8%) |
| 55 to 59 Years | 16 (6.3%) | 1 (0.4%) |
| 60 to 64 Years | 40 (15.8%) | 31 (11.3%) |
| 65 to 69 Years | 0 (0.0%) | 23 (8.4%) |
| 70 to 74 Years | 12 (4.7%) | 16 (5.8%) |
| 75 to 79 Years | 0 (0.0%) | 3 (1.1%) |
| 80 to 84 Years | 14 (5.5%) | 0 (0.0%) |
| 85 Years and over | 0 (0.0%) | 0 (0.0%) |
| Total | 254 (100.0%) | 275 (100.0%) |
Families and Households in Wylandville
Median Family Size in Wylandville
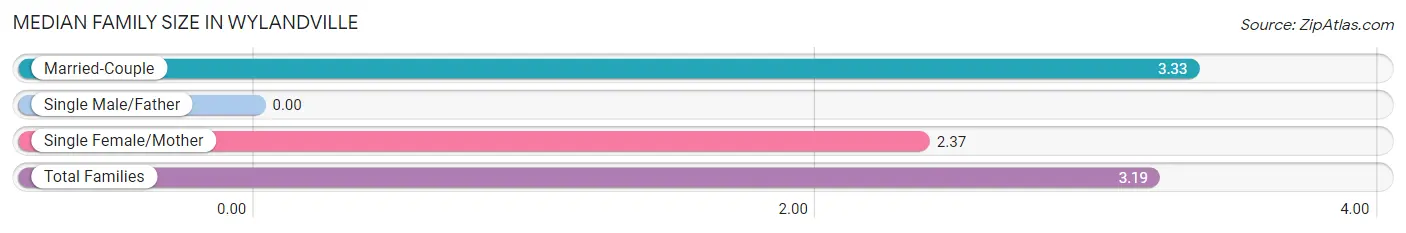
| Family Type | # Families | Family Size |
| Married-Couple | 111 (85.4%) | 3.33 |
| Single Male/Father | 0 (0.0%) | - |
| Single Female/Mother | 19 (14.6%) | 2.37 |
| Total Families | 130 (100.0%) | 3.19 |
Median Household Size in Wylandville
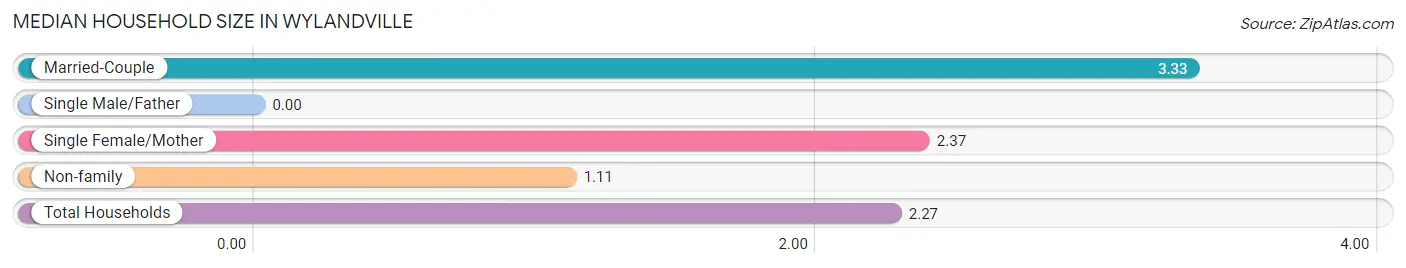
| Household Type | # Households | Household Size |
| Married-Couple | 111 (47.6%) | 3.33 |
| Single Male/Father | 0 (0.0%) | - |
| Single Female/Mother | 19 (8.2%) | 2.37 |
| Non-family | 103 (44.2%) | 1.11 |
| Total Households | 233 (100.0%) | 2.27 |
Household Size by Marriage Status in Wylandville
Out of a total of 233 households in Wylandville, 130 (55.8%) are family households, while 103 (44.2%) are nonfamily households. The most numerous type of family households are 2-person households, comprising 70, and the most common type of nonfamily households are 1-person households, comprising 91.
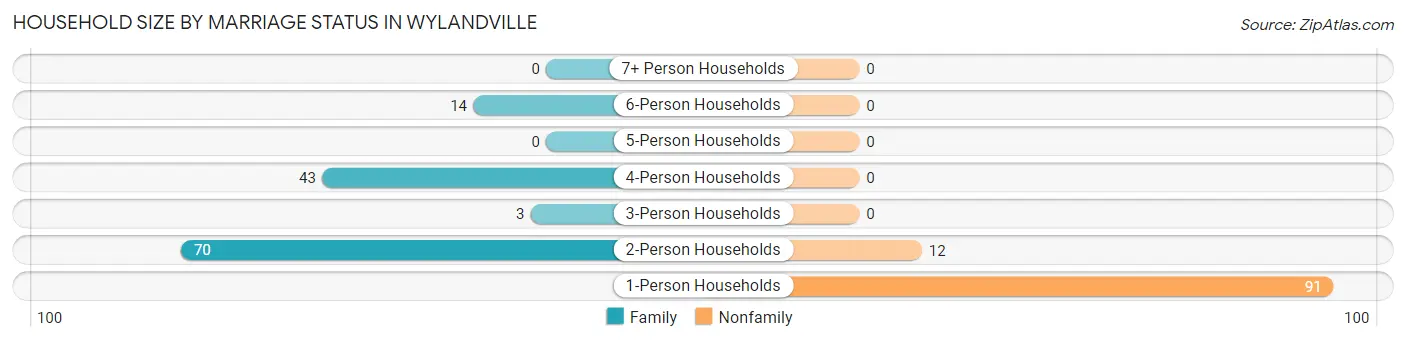
| Household Size | Family Households | Nonfamily Households |
| 1-Person Households | - | 91 (39.1%) |
| 2-Person Households | 70 (30.0%) | 12 (5.1%) |
| 3-Person Households | 3 (1.3%) | 0 (0.0%) |
| 4-Person Households | 43 (18.4%) | 0 (0.0%) |
| 5-Person Households | 0 (0.0%) | 0 (0.0%) |
| 6-Person Households | 14 (6.0%) | 0 (0.0%) |
| 7+ Person Households | 0 (0.0%) | 0 (0.0%) |
| Total | 130 (55.8%) | 103 (44.2%) |
Female Fertility in Wylandville
Fertility by Age in Wylandville
| Age Bracket | Women with Births | Births / 1,000 Women |
| 15 to 19 years | 0 (0.0%) | 0.0 |
| 20 to 34 years | 0 (0.0%) | 0.0 |
| 35 to 50 years | 0 (0.0%) | 0.0 |
| Total | 0 (0.0%) | 0.0 |
Fertility by Age by Marriage Status in Wylandville
| Age Bracket | Married | Unmarried |
| 15 to 19 years | 0 (0.0%) | 0 (0.0%) |
| 20 to 34 years | 0 (0.0%) | 0 (0.0%) |
| 35 to 50 years | 0 (0.0%) | 0 (0.0%) |
| Total | 0 (0.0%) | 0 (0.0%) |
Fertility by Education in Wylandville
| Educational Attainment | Women with Births | Births / 1,000 Women |
| Less than High School | 0 (0.0%) | 0.0 |
| High School Diploma | 0 (0.0%) | 0.0 |
| College or Associate's Degree | 0 (0.0%) | 0.0 |
| Bachelor's Degree | 0 (0.0%) | 0.0 |
| Graduate Degree | 0 (0.0%) | 0.0 |
| Total | 0 (0.0%) | 0.0 |
Fertility by Education by Marriage Status in Wylandville
| Educational Attainment | Married | Unmarried |
| Less than High School | 0 (0.0%) | 0 (0.0%) |
| High School Diploma | 0 (0.0%) | 0 (0.0%) |
| College or Associate's Degree | 0 (0.0%) | 0 (0.0%) |
| Bachelor's Degree | 0 (0.0%) | 0 (0.0%) |
| Graduate Degree | 0 (0.0%) | 0 (0.0%) |
| Total | 0 (0.0%) | 0 (0.0%) |
Employment Characteristics in Wylandville
Employment by Class of Employer in Wylandville
Among the 291 employed individuals in Wylandville, private company employees (237 | 81.4%), federal government employees (23 | 7.9%), and not-for-profit organizations (17 | 5.8%) make up the most common classes of employment.
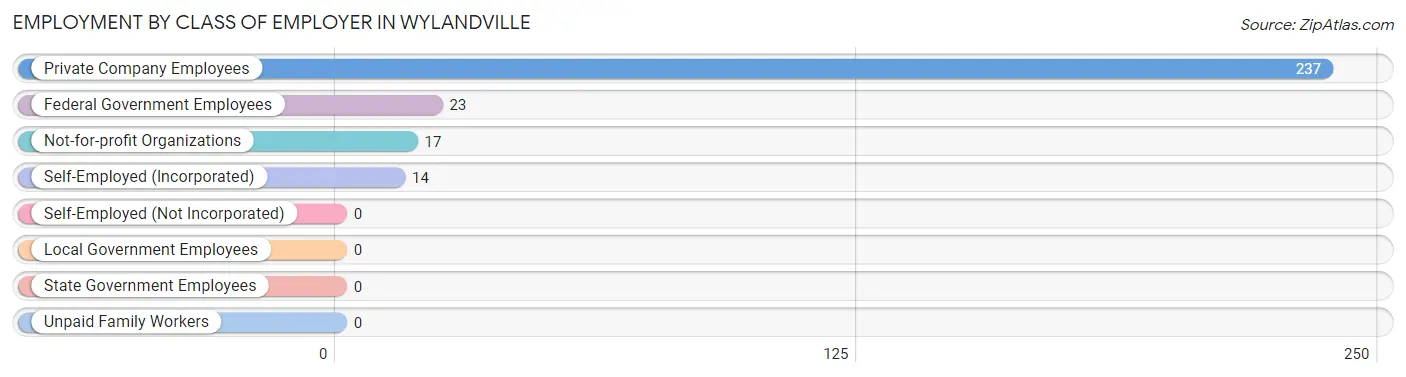
| Employer Class | # Employees | % Employees |
| Private Company Employees | 237 | 81.4% |
| Self-Employed (Incorporated) | 14 | 4.8% |
| Self-Employed (Not Incorporated) | 0 | 0.0% |
| Not-for-profit Organizations | 17 | 5.8% |
| Local Government Employees | 0 | 0.0% |
| State Government Employees | 0 | 0.0% |
| Federal Government Employees | 23 | 7.9% |
| Unpaid Family Workers | 0 | 0.0% |
| Total | 291 | 100.0% |
Employment Status by Age in Wylandville
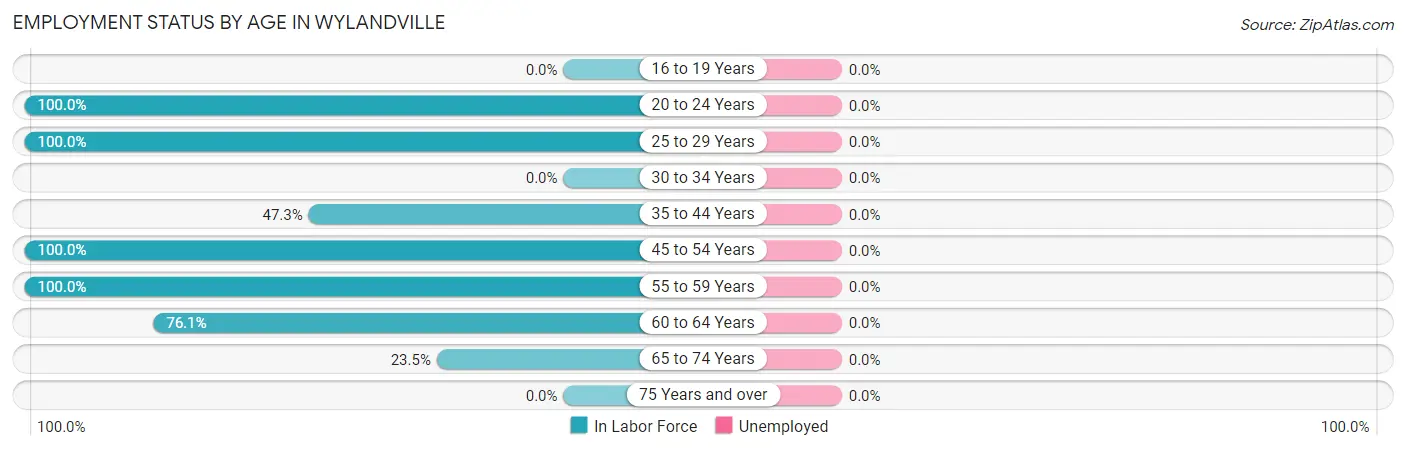
| Age Bracket | In Labor Force | Unemployed |
| 16 to 19 Years | 0 (0.0%) | 0 (0.0%) |
| 20 to 24 Years | 48 (100.0%) | 0 (0.0%) |
| 25 to 29 Years | 40 (100.0%) | 0 (0.0%) |
| 30 to 34 Years | 0 (0.0%) | 0 (0.0%) |
| 35 to 44 Years | 43 (47.3%) | 0 (0.0%) |
| 45 to 54 Years | 77 (100.0%) | 0 (0.0%) |
| 55 to 59 Years | 17 (100.0%) | 0 (0.0%) |
| 60 to 64 Years | 54 (76.1%) | 0 (0.0%) |
| 65 to 74 Years | 12 (23.5%) | 0 (0.0%) |
| 75 Years and over | 0 (0.0%) | 0 (0.0%) |
| Total | 291 (70.6%) | 0 (0.0%) |
Employment Status by Educational Attainment in Wylandville

| Educational Attainment | In Labor Force | Unemployed |
| Less than High School | 30 (100.0%) | 0 (0.0%) |
| High School Diploma | 70 (80.5%) | 0 (0.0%) |
| College / Associate Degree | 69 (100.0%) | 0 (0.0%) |
| Bachelor's Degree or higher | 62 (56.4%) | 0 (0.0%) |
| Total | 231 (78.0%) | 0 (0.0%) |
Employment Occupations by Sex in Wylandville
Management, Business, Science and Arts Occupations
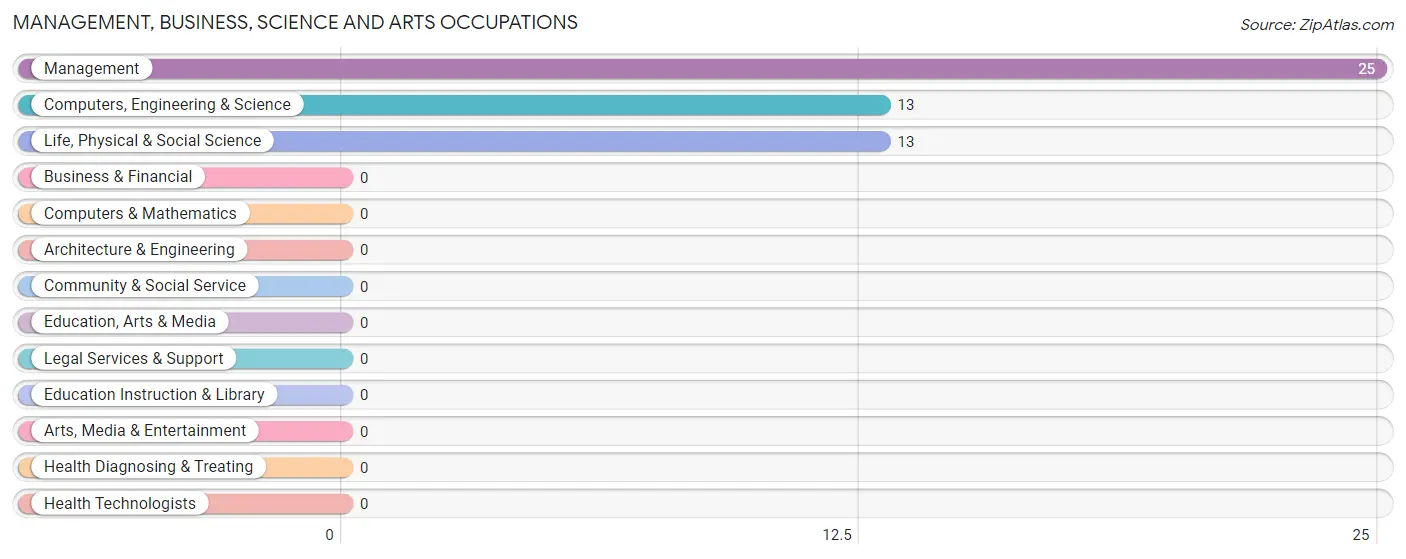
The most common Management, Business, Science and Arts occupations in Wylandville are Management (25 | 8.6%), Computers, Engineering & Science (13 | 4.5%), and Life, Physical & Social Science (13 | 4.5%).
Management, Business, Science and Arts Occupations by Sex
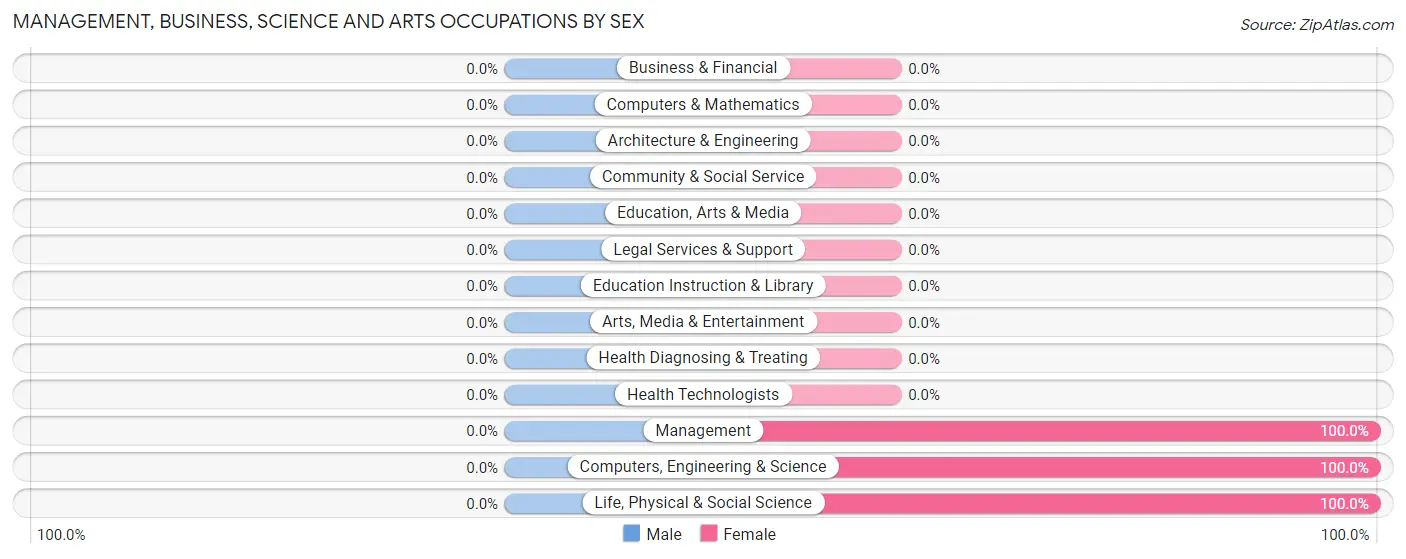
| Occupation | Male | Female |
| Management | 0 (0.0%) | 25 (100.0%) |
| Business & Financial | 0 (0.0%) | 0 (0.0%) |
| Computers, Engineering & Science | 0 (0.0%) | 13 (100.0%) |
| Computers & Mathematics | 0 (0.0%) | 0 (0.0%) |
| Architecture & Engineering | 0 (0.0%) | 0 (0.0%) |
| Life, Physical & Social Science | 0 (0.0%) | 13 (100.0%) |
| Community & Social Service | 0 (0.0%) | 0 (0.0%) |
| Education, Arts & Media | 0 (0.0%) | 0 (0.0%) |
| Legal Services & Support | 0 (0.0%) | 0 (0.0%) |
| Education Instruction & Library | 0 (0.0%) | 0 (0.0%) |
| Arts, Media & Entertainment | 0 (0.0%) | 0 (0.0%) |
| Health Diagnosing & Treating | 0 (0.0%) | 0 (0.0%) |
| Health Technologists | 0 (0.0%) | 0 (0.0%) |
| Total (Category) | 0 (0.0%) | 38 (100.0%) |
| Total (Overall) | 163 (56.0%) | 128 (44.0%) |
Services Occupations
The most common Services occupations in Wylandville are Food Preparation & Serving (35 | 12.0%), Security & Protection (16 | 5.5%), and Firefighting & Prevention (16 | 5.5%).
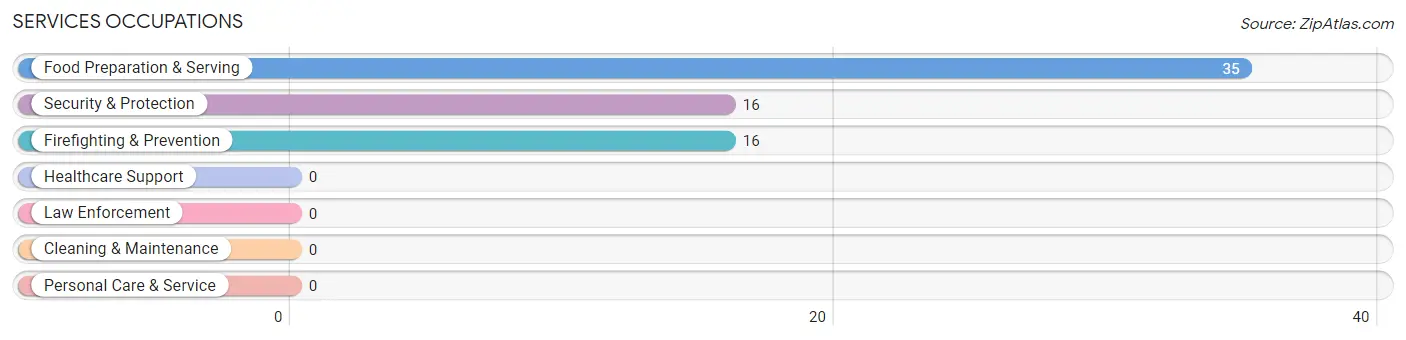
Services Occupations by Sex
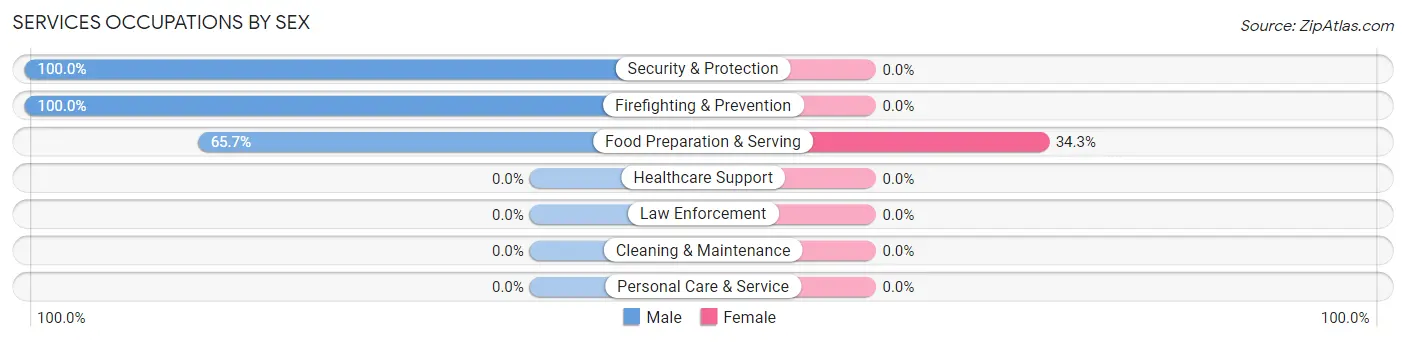
| Occupation | Male | Female |
| Healthcare Support | 0 (0.0%) | 0 (0.0%) |
| Security & Protection | 16 (100.0%) | 0 (0.0%) |
| Firefighting & Prevention | 16 (100.0%) | 0 (0.0%) |
| Law Enforcement | 0 (0.0%) | 0 (0.0%) |
| Food Preparation & Serving | 23 (65.7%) | 12 (34.3%) |
| Cleaning & Maintenance | 0 (0.0%) | 0 (0.0%) |
| Personal Care & Service | 0 (0.0%) | 0 (0.0%) |
| Total (Category) | 39 (76.5%) | 12 (23.5%) |
| Total (Overall) | 163 (56.0%) | 128 (44.0%) |
Sales and Office Occupations
The most common Sales and Office occupations in Wylandville are Sales & Related (89 | 30.6%), and Office & Administration (17 | 5.8%).

Sales and Office Occupations by Sex

| Occupation | Male | Female |
| Sales & Related | 63 (70.8%) | 26 (29.2%) |
| Office & Administration | 0 (0.0%) | 17 (100.0%) |
| Total (Category) | 63 (59.4%) | 43 (40.6%) |
| Total (Overall) | 163 (56.0%) | 128 (44.0%) |
Natural Resources, Construction and Maintenance Occupations
The most common Natural Resources, Construction and Maintenance occupations in Wylandville are Construction & Extraction (14 | 4.8%), and Installation, Maintenance & Repair (11 | 3.8%).

Natural Resources, Construction and Maintenance Occupations by Sex

| Occupation | Male | Female |
| Farming, Fishing & Forestry | 0 (0.0%) | 0 (0.0%) |
| Construction & Extraction | 14 (100.0%) | 0 (0.0%) |
| Installation, Maintenance & Repair | 11 (100.0%) | 0 (0.0%) |
| Total (Category) | 25 (100.0%) | 0 (0.0%) |
| Total (Overall) | 163 (56.0%) | 128 (44.0%) |
Production, Transportation and Moving Occupations
The most common Production, Transportation and Moving occupations in Wylandville are Material Moving (51 | 17.5%), and Production (20 | 6.9%).
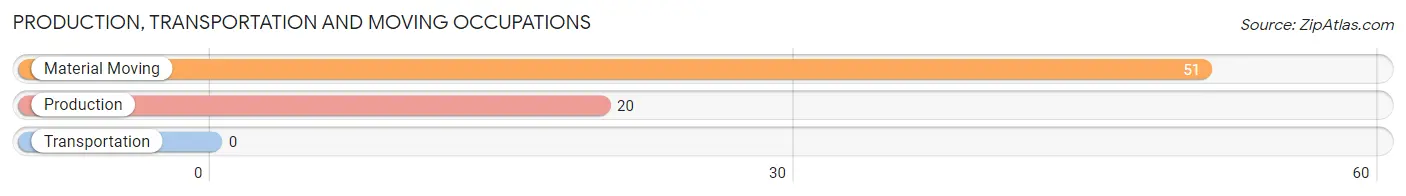
Production, Transportation and Moving Occupations by Sex

| Occupation | Male | Female |
| Production | 0 (0.0%) | 20 (100.0%) |
| Transportation | 0 (0.0%) | 0 (0.0%) |
| Material Moving | 36 (70.6%) | 15 (29.4%) |
| Total (Category) | 36 (50.7%) | 35 (49.3%) |
| Total (Overall) | 163 (56.0%) | 128 (44.0%) |
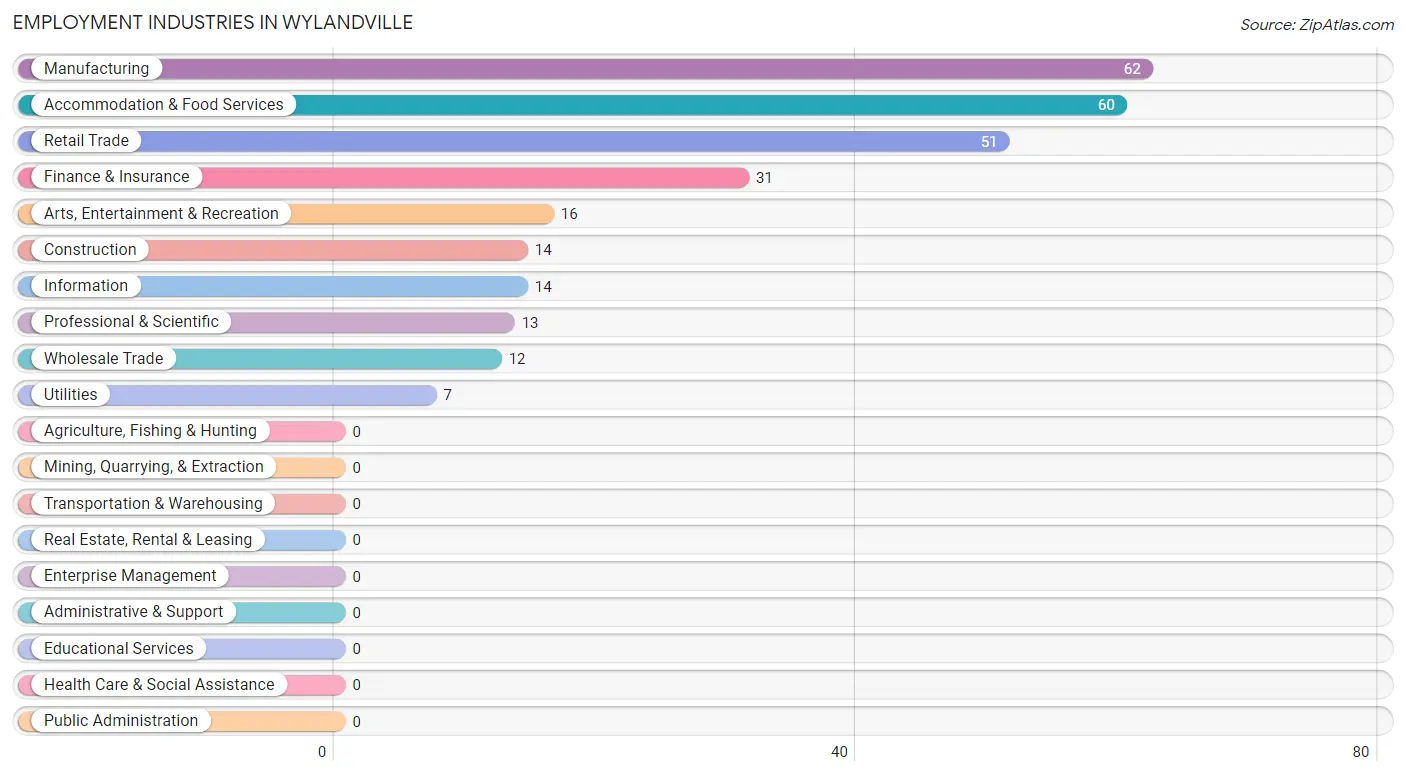
Employment Industries by Sex in Wylandville
Employment Industries in Wylandville
The major employment industries in Wylandville include Manufacturing (62 | 21.3%), Accommodation & Food Services (60 | 20.6%), Retail Trade (51 | 17.5%), Finance & Insurance (31 | 10.6%), and Arts, Entertainment & Recreation (16 | 5.5%).
Employment Industries by Sex in Wylandville
The Wylandville industries that see more men than women are Construction (100.0%), Information (100.0%), and Arts, Entertainment & Recreation (100.0%), whereas the industries that tend to have a higher number of women are Wholesale Trade (100.0%), Finance & Insurance (100.0%), and Professional & Scientific (100.0%).
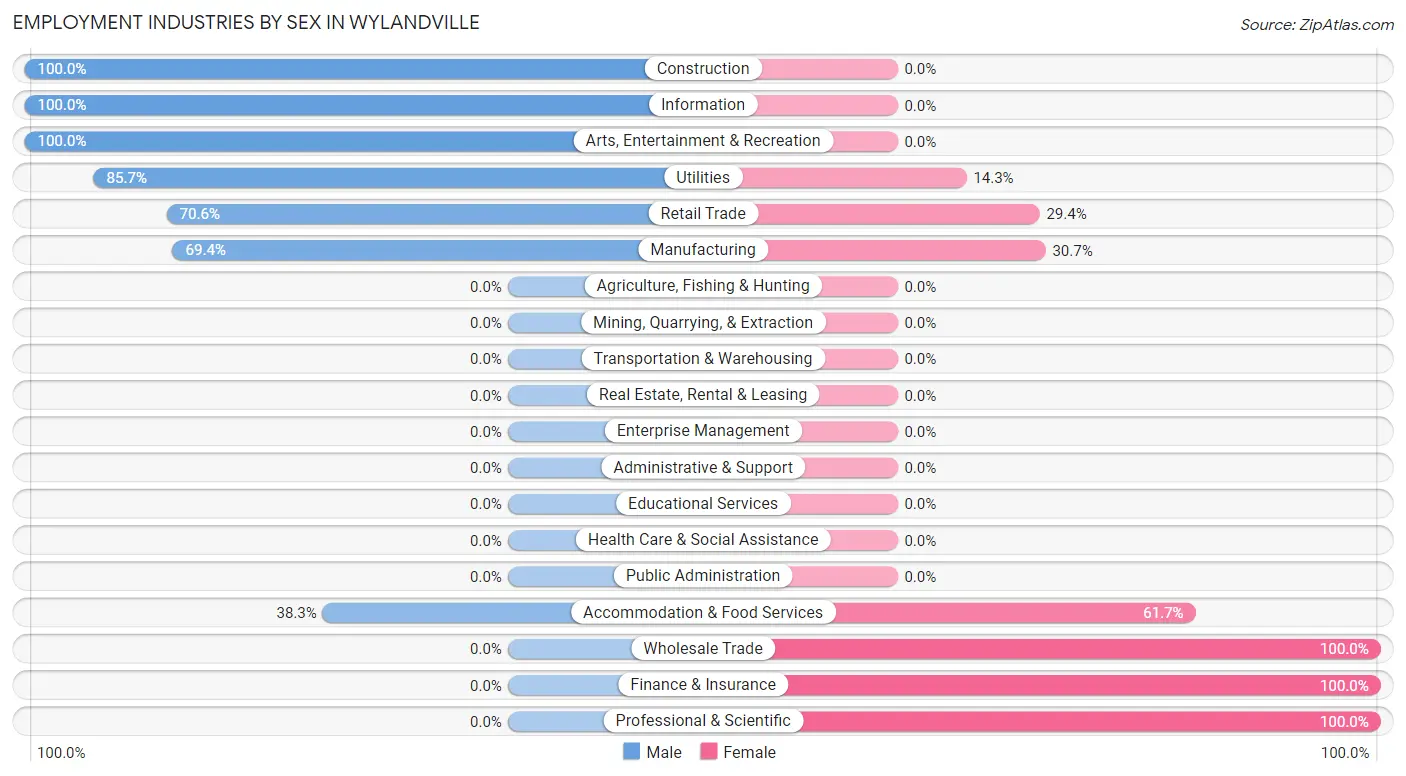
| Industry | Male | Female |
| Agriculture, Fishing & Hunting | 0 (0.0%) | 0 (0.0%) |
| Mining, Quarrying, & Extraction | 0 (0.0%) | 0 (0.0%) |
| Construction | 14 (100.0%) | 0 (0.0%) |
| Manufacturing | 43 (69.4%) | 19 (30.6%) |
| Wholesale Trade | 0 (0.0%) | 12 (100.0%) |
| Retail Trade | 36 (70.6%) | 15 (29.4%) |
| Transportation & Warehousing | 0 (0.0%) | 0 (0.0%) |
| Utilities | 6 (85.7%) | 1 (14.3%) |
| Information | 14 (100.0%) | 0 (0.0%) |
| Finance & Insurance | 0 (0.0%) | 31 (100.0%) |
| Real Estate, Rental & Leasing | 0 (0.0%) | 0 (0.0%) |
| Professional & Scientific | 0 (0.0%) | 13 (100.0%) |
| Enterprise Management | 0 (0.0%) | 0 (0.0%) |
| Administrative & Support | 0 (0.0%) | 0 (0.0%) |
| Educational Services | 0 (0.0%) | 0 (0.0%) |
| Health Care & Social Assistance | 0 (0.0%) | 0 (0.0%) |
| Arts, Entertainment & Recreation | 16 (100.0%) | 0 (0.0%) |
| Accommodation & Food Services | 23 (38.3%) | 37 (61.7%) |
| Public Administration | 0 (0.0%) | 0 (0.0%) |
| Total | 163 (56.0%) | 128 (44.0%) |
Education in Wylandville
School Enrollment in Wylandville
The most common levels of schooling among the 128 students in Wylandville are kindergarten (54 | 42.2%), elementary school (48 | 37.5%), and college / undergraduate (26 | 20.3%).
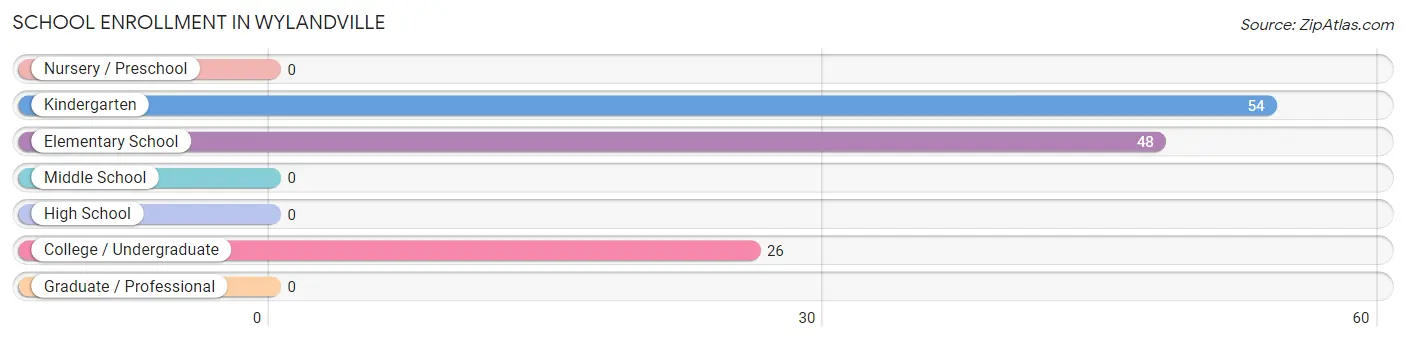
| School Level | # Students | % Students |
| Nursery / Preschool | 0 | 0.0% |
| Kindergarten | 54 | 42.2% |
| Elementary School | 48 | 37.5% |
| Middle School | 0 | 0.0% |
| High School | 0 | 0.0% |
| College / Undergraduate | 26 | 20.3% |
| Graduate / Professional | 0 | 0.0% |
| Total | 128 | 100.0% |
School Enrollment by Age by Funding Source in Wylandville
Out of a total of 128 students who are enrolled in schools in Wylandville, 14 (10.9%) attend a private institution, while the remaining 114 (89.1%) are enrolled in public schools. The age group of 35 years and over has the highest likelihood of being enrolled in private schools, with 14 (100.0% in the age bracket) enrolled. Conversely, the age group of 5 to 9 year old has the lowest likelihood of being enrolled in a private school, with 102 (100.0% in the age bracket) attending a public institution.
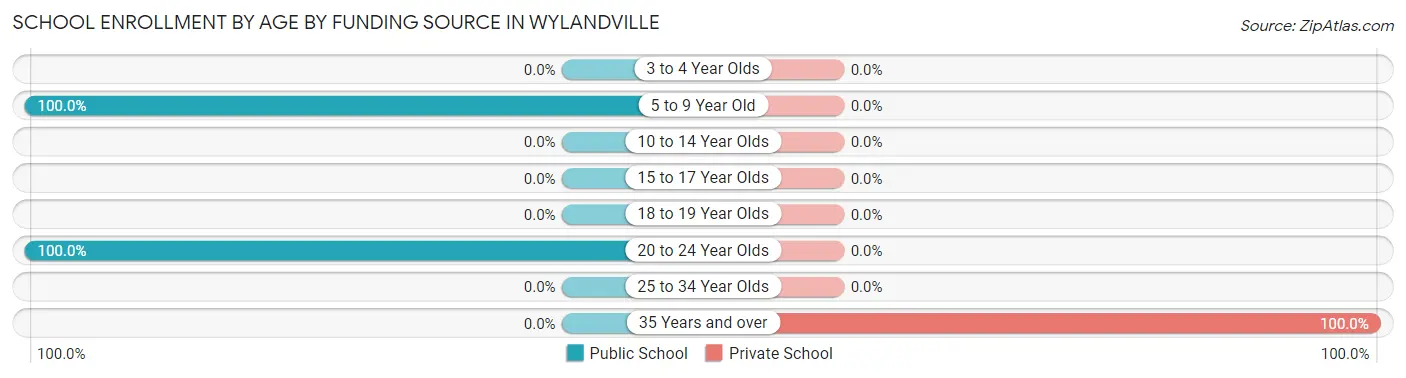
| Age Bracket | Public School | Private School |
| 3 to 4 Year Olds | 0 (0.0%) | 0 (0.0%) |
| 5 to 9 Year Old | 102 (100.0%) | 0 (0.0%) |
| 10 to 14 Year Olds | 0 (0.0%) | 0 (0.0%) |
| 15 to 17 Year Olds | 0 (0.0%) | 0 (0.0%) |
| 18 to 19 Year Olds | 0 (0.0%) | 0 (0.0%) |
| 20 to 24 Year Olds | 12 (100.0%) | 0 (0.0%) |
| 25 to 34 Year Olds | 0 (0.0%) | 0 (0.0%) |
| 35 Years and over | 0 (0.0%) | 14 (100.0%) |
| Total | 114 (89.1%) | 14 (10.9%) |
Educational Attainment by Field of Study in Wylandville
Communications (91 | 55.5%), business (62 | 37.8%), and science & technology (11 | 6.7%) are the most common fields of study among 164 individuals in Wylandville who have obtained a bachelor's degree or higher.
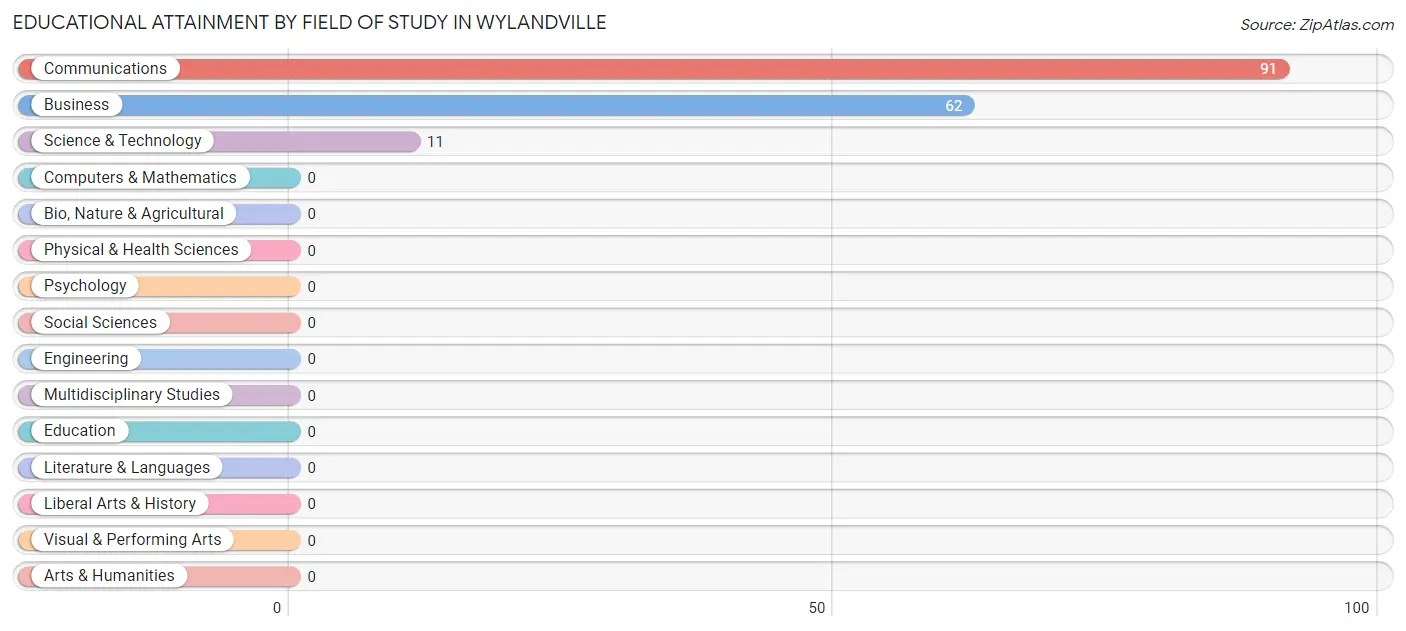
| Field of Study | # Graduates | % Graduates |
| Computers & Mathematics | 0 | 0.0% |
| Bio, Nature & Agricultural | 0 | 0.0% |
| Physical & Health Sciences | 0 | 0.0% |
| Psychology | 0 | 0.0% |
| Social Sciences | 0 | 0.0% |
| Engineering | 0 | 0.0% |
| Multidisciplinary Studies | 0 | 0.0% |
| Science & Technology | 11 | 6.7% |
| Business | 62 | 37.8% |
| Education | 0 | 0.0% |
| Literature & Languages | 0 | 0.0% |
| Liberal Arts & History | 0 | 0.0% |
| Visual & Performing Arts | 0 | 0.0% |
| Communications | 91 | 55.5% |
| Arts & Humanities | 0 | 0.0% |
| Total | 164 | 100.0% |
Transportation & Commute in Wylandville
Vehicle Availability by Sex in Wylandville
The most prevalent vehicle ownership categories in Wylandville are males with 2 vehicles (82, accounting for 50.3%) and females with 2 vehicles (25, making up 64.1%).
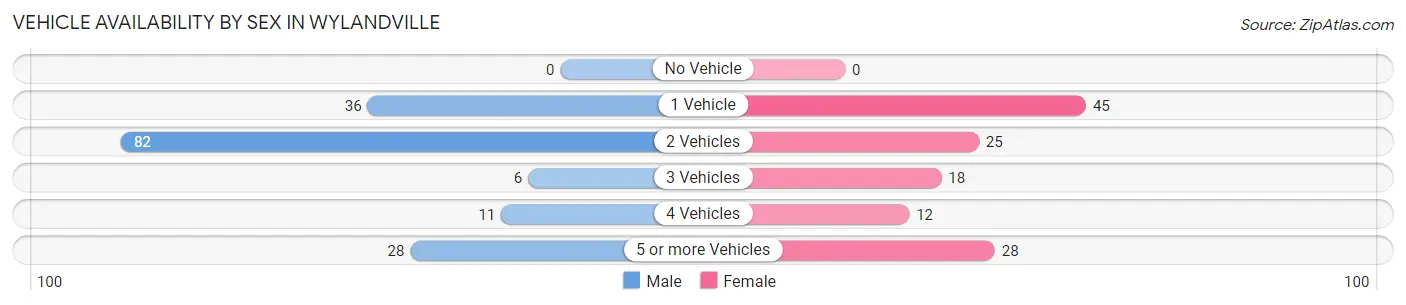
| Vehicles Available | Male | Female |
| No Vehicle | 0 (0.0%) | 0 (0.0%) |
| 1 Vehicle | 36 (22.1%) | 45 (35.2%) |
| 2 Vehicles | 82 (50.3%) | 25 (19.5%) |
| 3 Vehicles | 6 (3.7%) | 18 (14.1%) |
| 4 Vehicles | 11 (6.8%) | 12 (9.4%) |
| 5 or more Vehicles | 28 (17.2%) | 28 (21.9%) |
| Total | 163 (100.0%) | 128 (100.0%) |
Commute Time in Wylandville
The most frequently occuring commute durations in Wylandville are 15 to 19 minutes (74 commuters, 25.4%), 45 to 59 minutes (53 commuters, 18.2%), and 20 to 24 minutes (47 commuters, 16.2%).
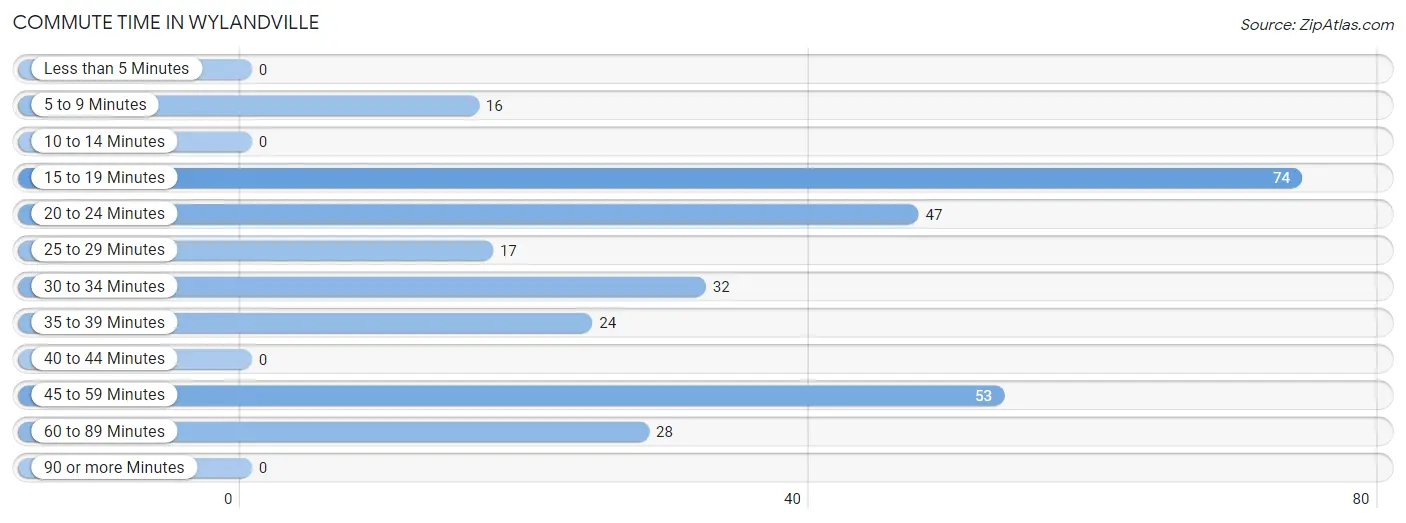
| Commute Time | # Commuters | % Commuters |
| Less than 5 Minutes | 0 | 0.0% |
| 5 to 9 Minutes | 16 | 5.5% |
| 10 to 14 Minutes | 0 | 0.0% |
| 15 to 19 Minutes | 74 | 25.4% |
| 20 to 24 Minutes | 47 | 16.2% |
| 25 to 29 Minutes | 17 | 5.8% |
| 30 to 34 Minutes | 32 | 11.0% |
| 35 to 39 Minutes | 24 | 8.3% |
| 40 to 44 Minutes | 0 | 0.0% |
| 45 to 59 Minutes | 53 | 18.2% |
| 60 to 89 Minutes | 28 | 9.6% |
| 90 or more Minutes | 0 | 0.0% |
Commute Time by Sex in Wylandville
The most common commute times in Wylandville are 20 to 24 minutes (47 commuters, 28.8%) for males and 15 to 19 minutes (31 commuters, 24.2%) for females.
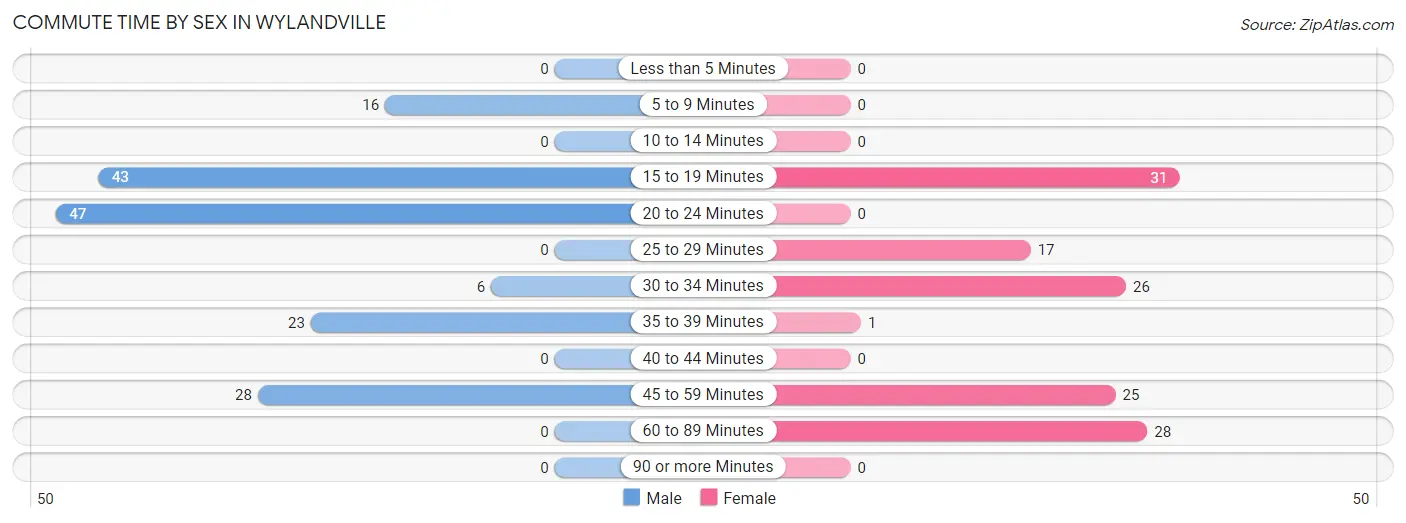
| Commute Time | Male | Female |
| Less than 5 Minutes | 0 (0.0%) | 0 (0.0%) |
| 5 to 9 Minutes | 16 (9.8%) | 0 (0.0%) |
| 10 to 14 Minutes | 0 (0.0%) | 0 (0.0%) |
| 15 to 19 Minutes | 43 (26.4%) | 31 (24.2%) |
| 20 to 24 Minutes | 47 (28.8%) | 0 (0.0%) |
| 25 to 29 Minutes | 0 (0.0%) | 17 (13.3%) |
| 30 to 34 Minutes | 6 (3.7%) | 26 (20.3%) |
| 35 to 39 Minutes | 23 (14.1%) | 1 (0.8%) |
| 40 to 44 Minutes | 0 (0.0%) | 0 (0.0%) |
| 45 to 59 Minutes | 28 (17.2%) | 25 (19.5%) |
| 60 to 89 Minutes | 0 (0.0%) | 28 (21.9%) |
| 90 or more Minutes | 0 (0.0%) | 0 (0.0%) |
Time of Departure to Work by Sex in Wylandville
The most frequent times of departure to work in Wylandville are 7:30 AM to 7:59 AM (71, 43.6%) for males and 8:00 AM to 8:29 AM (51, 39.8%) for females.
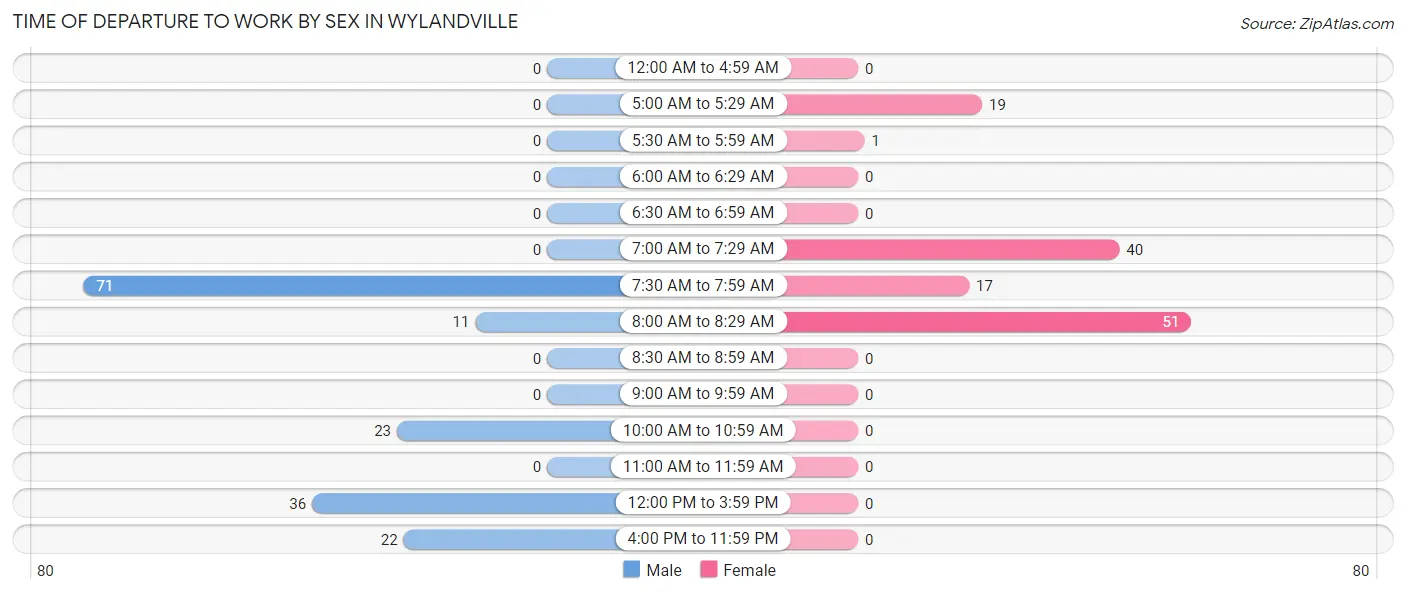
| Time of Departure | Male | Female |
| 12:00 AM to 4:59 AM | 0 (0.0%) | 0 (0.0%) |
| 5:00 AM to 5:29 AM | 0 (0.0%) | 19 (14.8%) |
| 5:30 AM to 5:59 AM | 0 (0.0%) | 1 (0.8%) |
| 6:00 AM to 6:29 AM | 0 (0.0%) | 0 (0.0%) |
| 6:30 AM to 6:59 AM | 0 (0.0%) | 0 (0.0%) |
| 7:00 AM to 7:29 AM | 0 (0.0%) | 40 (31.2%) |
| 7:30 AM to 7:59 AM | 71 (43.6%) | 17 (13.3%) |
| 8:00 AM to 8:29 AM | 11 (6.8%) | 51 (39.8%) |
| 8:30 AM to 8:59 AM | 0 (0.0%) | 0 (0.0%) |
| 9:00 AM to 9:59 AM | 0 (0.0%) | 0 (0.0%) |
| 10:00 AM to 10:59 AM | 23 (14.1%) | 0 (0.0%) |
| 11:00 AM to 11:59 AM | 0 (0.0%) | 0 (0.0%) |
| 12:00 PM to 3:59 PM | 36 (22.1%) | 0 (0.0%) |
| 4:00 PM to 11:59 PM | 22 (13.5%) | 0 (0.0%) |
| Total | 163 (100.0%) | 128 (100.0%) |
Housing Occupancy in Wylandville
Occupancy by Ownership in Wylandville
Of the total 233 dwellings in Wylandville, owner-occupied units account for 233 (100.0%), while renter-occupied units make up 0 (0.0%).
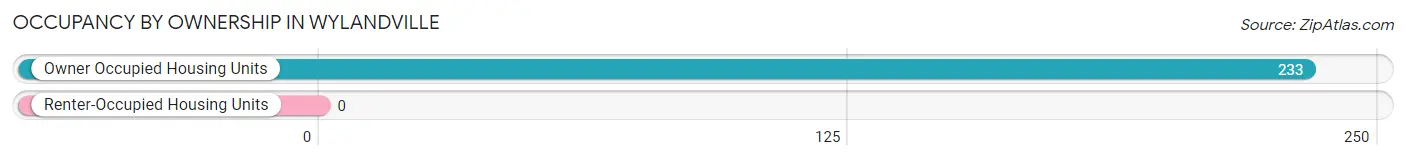
| Occupancy | # Housing Units | % Housing Units |
| Owner Occupied Housing Units | 233 | 100.0% |
| Renter-Occupied Housing Units | 0 | 0.0% |
| Total Occupied Housing Units | 233 | 100.0% |
Occupancy by Household Size in Wylandville
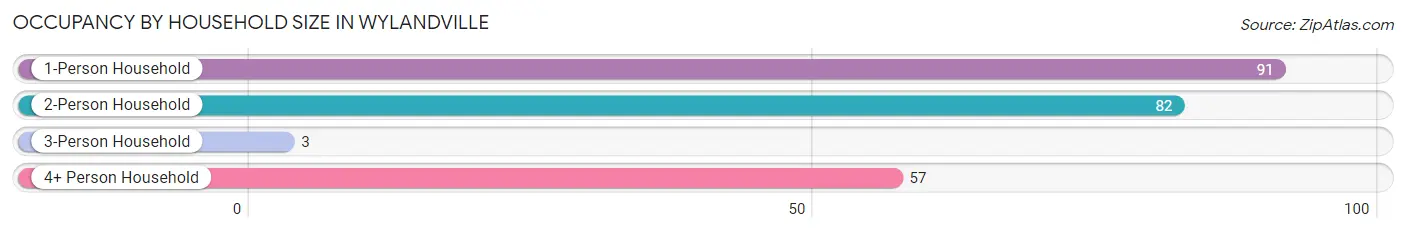
| Household Size | # Housing Units | % Housing Units |
| 1-Person Household | 91 | 39.1% |
| 2-Person Household | 82 | 35.2% |
| 3-Person Household | 3 | 1.3% |
| 4+ Person Household | 57 | 24.5% |
| Total Housing Units | 233 | 100.0% |
Occupancy by Ownership by Household Size in Wylandville
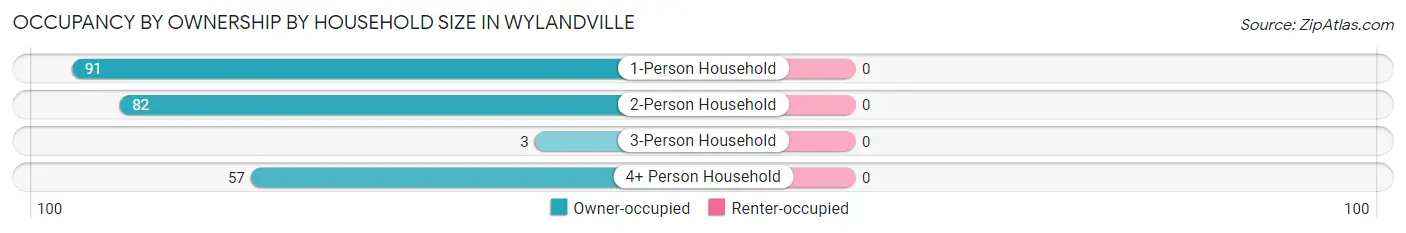
| Household Size | Owner-occupied | Renter-occupied |
| 1-Person Household | 91 (100.0%) | 0 (0.0%) |
| 2-Person Household | 82 (100.0%) | 0 (0.0%) |
| 3-Person Household | 3 (100.0%) | 0 (0.0%) |
| 4+ Person Household | 57 (100.0%) | 0 (0.0%) |
| Total Housing Units | 233 (100.0%) | 0 (0.0%) |
Occupancy by Educational Attainment in Wylandville

| Household Size | Owner-occupied | Renter-occupied |
| Less than High School | 0 (0.0%) | 0 (0.0%) |
| High School Diploma | 82 (100.0%) | 0 (0.0%) |
| College/Associate Degree | 97 (100.0%) | 0 (0.0%) |
| Bachelor's Degree or higher | 54 (100.0%) | 0 (0.0%) |
Occupancy by Age of Householder in Wylandville
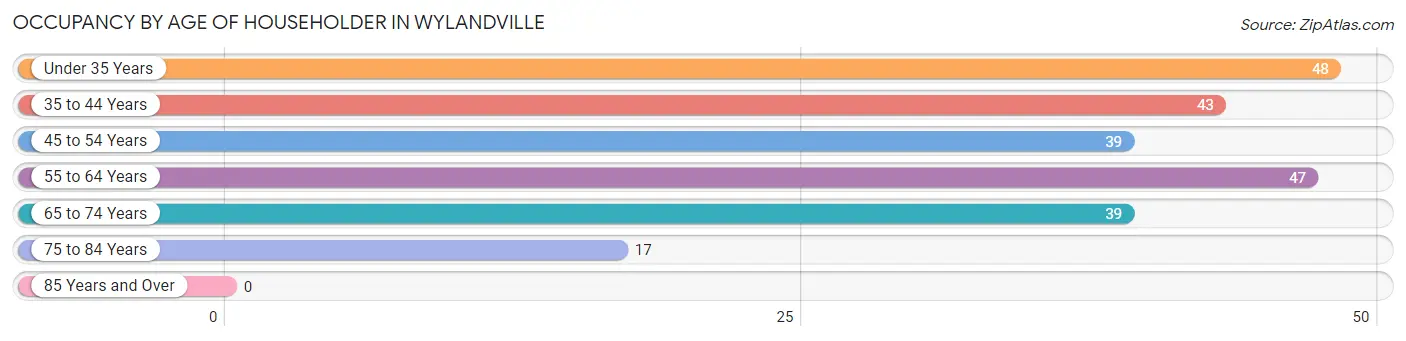
| Age Bracket | # Households | % Households |
| Under 35 Years | 48 | 20.6% |
| 35 to 44 Years | 43 | 18.4% |
| 45 to 54 Years | 39 | 16.7% |
| 55 to 64 Years | 47 | 20.2% |
| 65 to 74 Years | 39 | 16.7% |
| 75 to 84 Years | 17 | 7.3% |
| 85 Years and Over | 0 | 0.0% |
| Total | 233 | 100.0% |
Housing Finances in Wylandville
Median Income by Occupancy in Wylandville
| Occupancy Type | # Households | Median Income |
| Owner-Occupied | 233 (100.0%) | $0 |
| Renter-Occupied | 0 (0.0%) | $0 |
| Average | 233 (100.0%) | $0 |
Occupancy by Householder Income Bracket in Wylandville
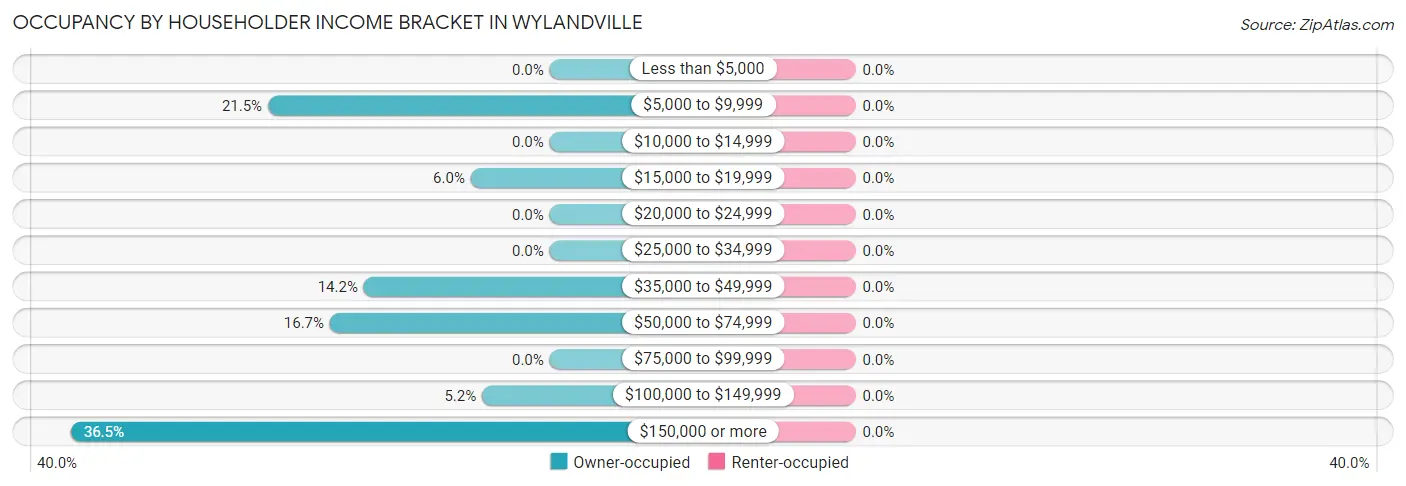
| Income Bracket | Owner-occupied | Renter-occupied |
| Less than $5,000 | 0 (0.0%) | 0 (0.0%) |
| $5,000 to $9,999 | 50 (21.5%) | 0 (0.0%) |
| $10,000 to $14,999 | 0 (0.0%) | 0 (0.0%) |
| $15,000 to $19,999 | 14 (6.0%) | 0 (0.0%) |
| $20,000 to $24,999 | 0 (0.0%) | 0 (0.0%) |
| $25,000 to $34,999 | 0 (0.0%) | 0 (0.0%) |
| $35,000 to $49,999 | 33 (14.2%) | 0 (0.0%) |
| $50,000 to $74,999 | 39 (16.7%) | 0 (0.0%) |
| $75,000 to $99,999 | 0 (0.0%) | 0 (0.0%) |
| $100,000 to $149,999 | 12 (5.1%) | 0 (0.0%) |
| $150,000 or more | 85 (36.5%) | 0 (0.0%) |
| Total | 233 (100.0%) | 0 (0.0%) |
Monthly Housing Cost Tiers in Wylandville
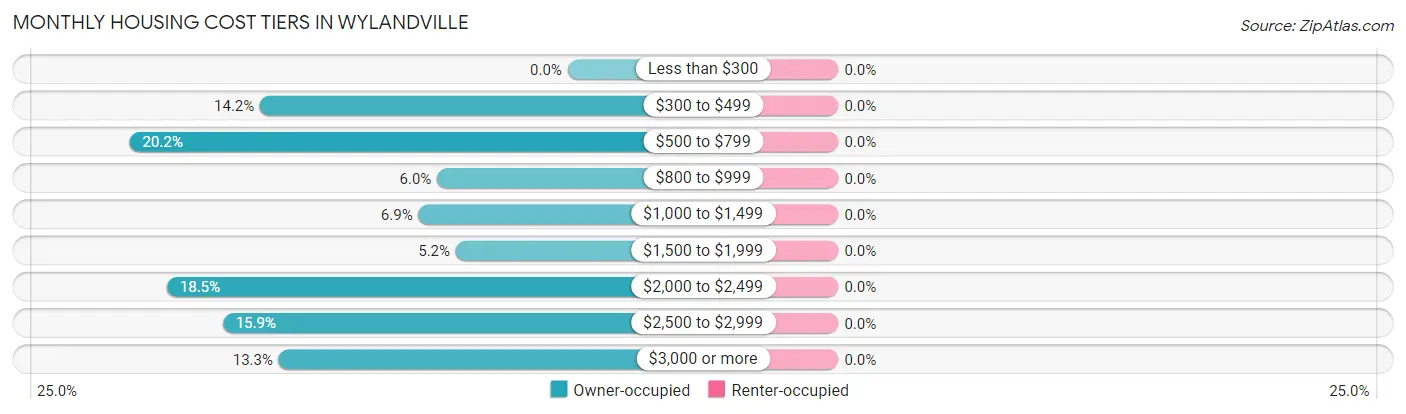
| Monthly Cost | Owner-occupied | Renter-occupied |
| Less than $300 | 0 (0.0%) | 0 (0.0%) |
| $300 to $499 | 33 (14.2%) | 0 (0.0%) |
| $500 to $799 | 47 (20.2%) | 0 (0.0%) |
| $800 to $999 | 14 (6.0%) | 0 (0.0%) |
| $1,000 to $1,499 | 16 (6.9%) | 0 (0.0%) |
| $1,500 to $1,999 | 12 (5.1%) | 0 (0.0%) |
| $2,000 to $2,499 | 43 (18.4%) | 0 (0.0%) |
| $2,500 to $2,999 | 37 (15.9%) | 0 (0.0%) |
| $3,000 or more | 31 (13.3%) | 0 (0.0%) |
| Total | 233 (100.0%) | 0 (0.0%) |
Physical Housing Characteristics in Wylandville
Housing Structures in Wylandville
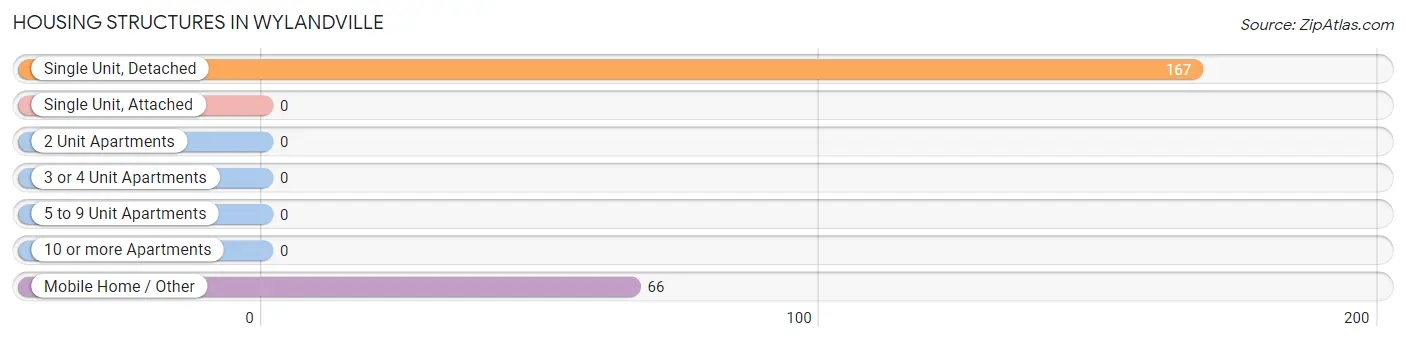
| Structure Type | # Housing Units | % Housing Units |
| Single Unit, Detached | 167 | 71.7% |
| Single Unit, Attached | 0 | 0.0% |
| 2 Unit Apartments | 0 | 0.0% |
| 3 or 4 Unit Apartments | 0 | 0.0% |
| 5 to 9 Unit Apartments | 0 | 0.0% |
| 10 or more Apartments | 0 | 0.0% |
| Mobile Home / Other | 66 | 28.3% |
| Total | 233 | 100.0% |
Housing Structures by Occupancy in Wylandville
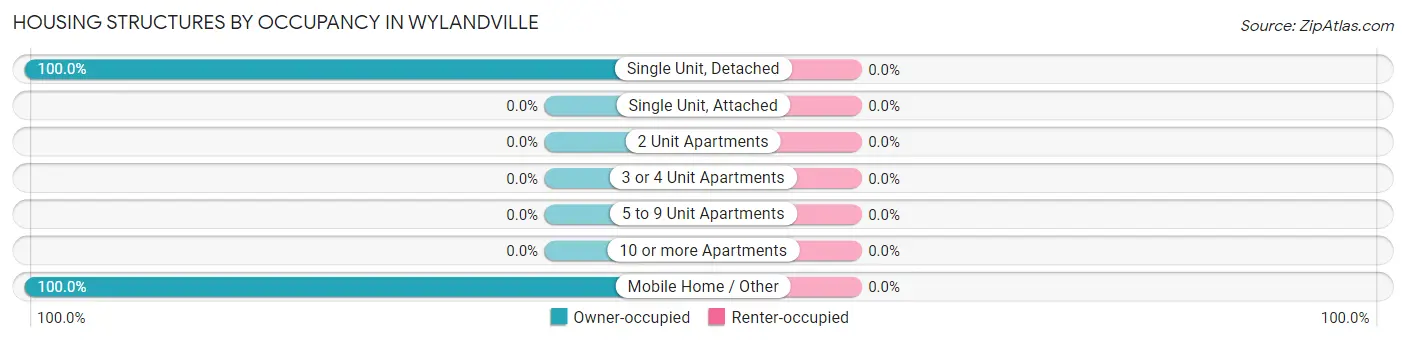
| Structure Type | Owner-occupied | Renter-occupied |
| Single Unit, Detached | 167 (100.0%) | 0 (0.0%) |
| Single Unit, Attached | 0 (0.0%) | 0 (0.0%) |
| 2 Unit Apartments | 0 (0.0%) | 0 (0.0%) |
| 3 or 4 Unit Apartments | 0 (0.0%) | 0 (0.0%) |
| 5 to 9 Unit Apartments | 0 (0.0%) | 0 (0.0%) |
| 10 or more Apartments | 0 (0.0%) | 0 (0.0%) |
| Mobile Home / Other | 66 (100.0%) | 0 (0.0%) |
| Total | 233 (100.0%) | 0 (0.0%) |
Housing Structures by Number of Rooms in Wylandville
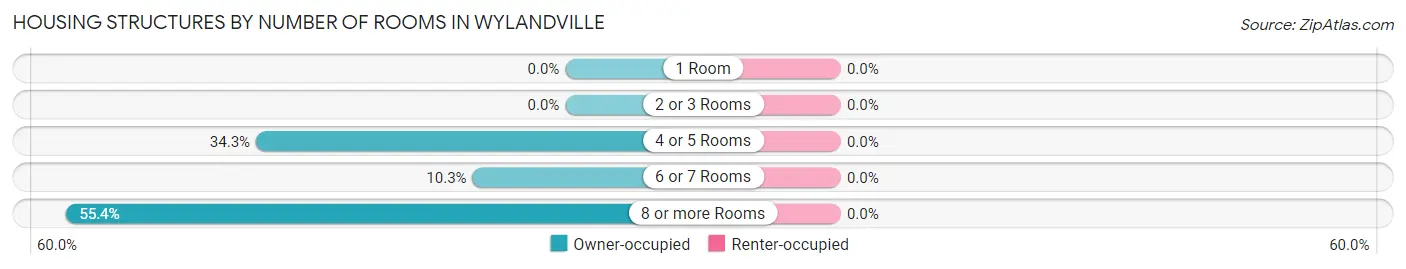
| Number of Rooms | Owner-occupied | Renter-occupied |
| 1 Room | 0 (0.0%) | 0 (0.0%) |
| 2 or 3 Rooms | 0 (0.0%) | 0 (0.0%) |
| 4 or 5 Rooms | 80 (34.3%) | 0 (0.0%) |
| 6 or 7 Rooms | 24 (10.3%) | 0 (0.0%) |
| 8 or more Rooms | 129 (55.4%) | 0 (0.0%) |
| Total | 233 (100.0%) | 0 (0.0%) |
Housing Structure by Heating Type in Wylandville
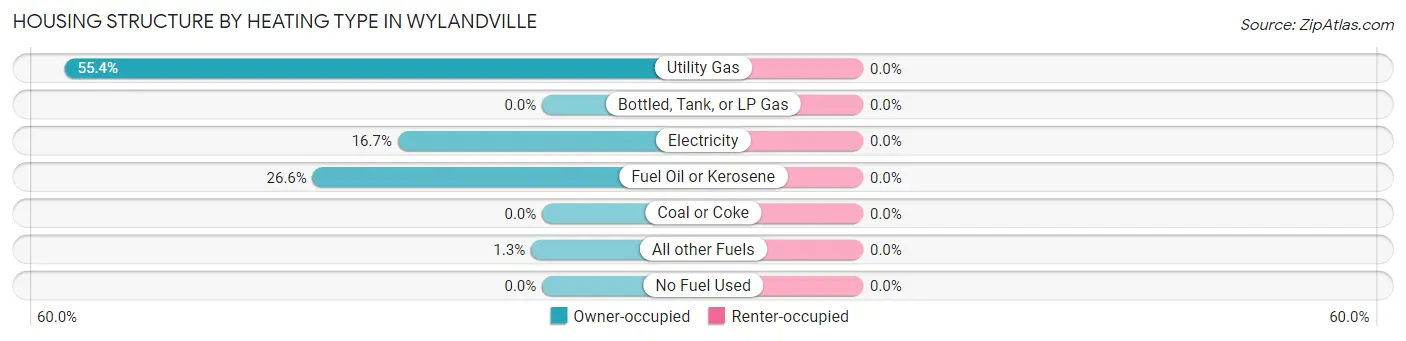
| Heating Type | Owner-occupied | Renter-occupied |
| Utility Gas | 129 (55.4%) | 0 (0.0%) |
| Bottled, Tank, or LP Gas | 0 (0.0%) | 0 (0.0%) |
| Electricity | 39 (16.7%) | 0 (0.0%) |
| Fuel Oil or Kerosene | 62 (26.6%) | 0 (0.0%) |
| Coal or Coke | 0 (0.0%) | 0 (0.0%) |
| All other Fuels | 3 (1.3%) | 0 (0.0%) |
| No Fuel Used | 0 (0.0%) | 0 (0.0%) |
| Total | 233 (100.0%) | 0 (0.0%) |
Household Vehicle Usage in Wylandville

| Vehicles per Household | Owner-occupied | Renter-occupied |
| No Vehicle | 0 (0.0%) | 0 (0.0%) |
| 1 Vehicle | 103 (44.2%) | 0 (0.0%) |
| 2 Vehicles | 84 (36.0%) | 0 (0.0%) |
| 3 or more Vehicles | 46 (19.7%) | 0 (0.0%) |
| Total | 233 (100.0%) | 0 (0.0%) |
Real Estate & Mortgages in Wylandville
Real Estate and Mortgage Overview in Wylandville
| Characteristic | Without Mortgage | With Mortgage |
| Housing Units | 94 | 139 |
| Median Property Value | - | - |
| Median Household Income | - | - |
| Monthly Housing Costs | $608 | $31 |
| Real Estate Taxes | $199 | $0 |
Property Value by Mortgage Status in Wylandville
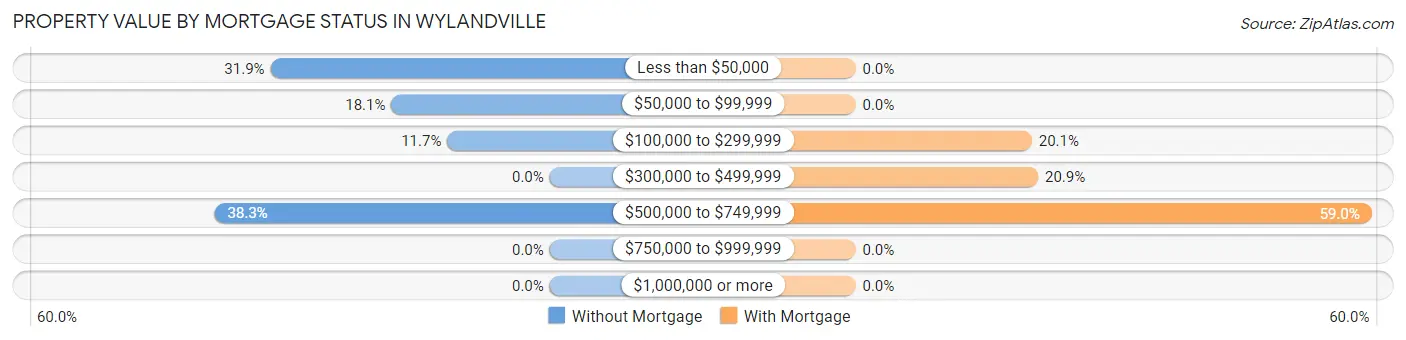
| Property Value | Without Mortgage | With Mortgage |
| Less than $50,000 | 30 (31.9%) | 0 (0.0%) |
| $50,000 to $99,999 | 17 (18.1%) | 0 (0.0%) |
| $100,000 to $299,999 | 11 (11.7%) | 28 (20.1%) |
| $300,000 to $499,999 | 0 (0.0%) | 29 (20.9%) |
| $500,000 to $749,999 | 36 (38.3%) | 82 (59.0%) |
| $750,000 to $999,999 | 0 (0.0%) | 0 (0.0%) |
| $1,000,000 or more | 0 (0.0%) | 0 (0.0%) |
| Total | 94 (100.0%) | 139 (100.0%) |
Household Income by Mortgage Status in Wylandville
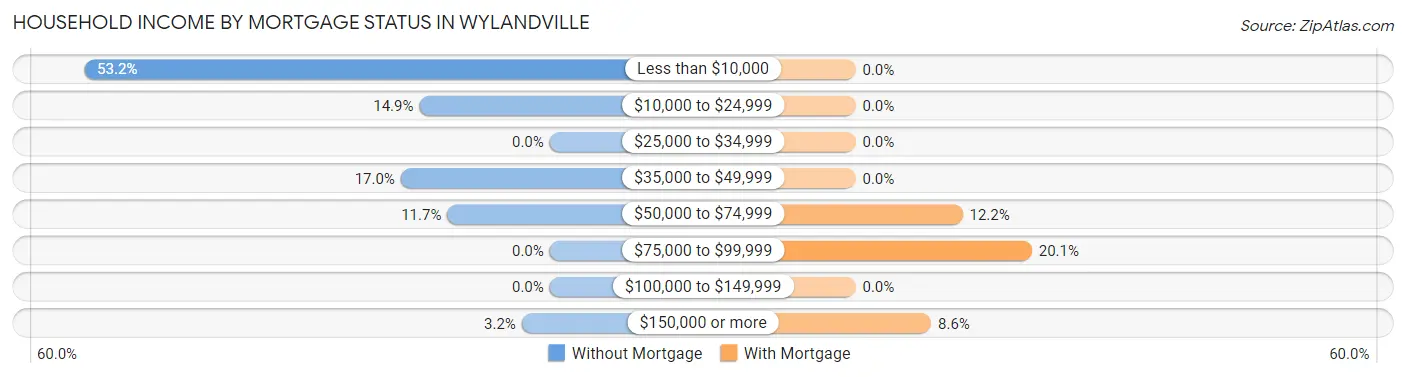
| Household Income | Without Mortgage | With Mortgage |
| Less than $10,000 | 50 (53.2%) | 0 (0.0%) |
| $10,000 to $24,999 | 14 (14.9%) | 0 (0.0%) |
| $25,000 to $34,999 | 0 (0.0%) | 0 (0.0%) |
| $35,000 to $49,999 | 16 (17.0%) | 0 (0.0%) |
| $50,000 to $74,999 | 11 (11.7%) | 17 (12.2%) |
| $75,000 to $99,999 | 0 (0.0%) | 28 (20.1%) |
| $100,000 to $149,999 | 0 (0.0%) | 0 (0.0%) |
| $150,000 or more | 3 (3.2%) | 12 (8.6%) |
| Total | 94 (100.0%) | 139 (100.0%) |
Property Value to Household Income Ratio in Wylandville
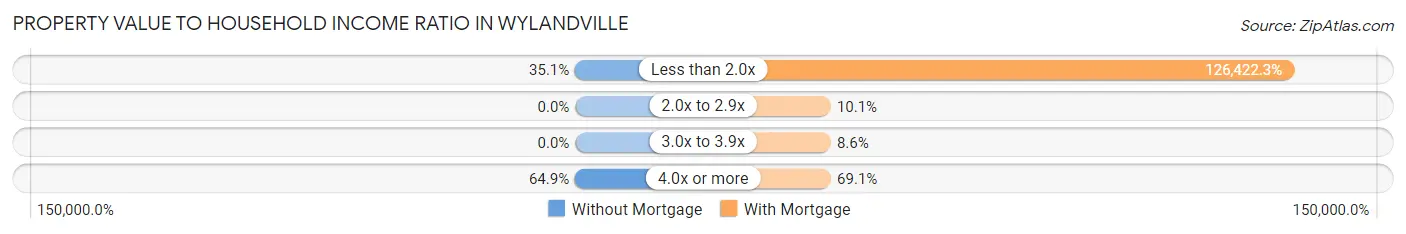
| Value-to-Income Ratio | Without Mortgage | With Mortgage |
| Less than 2.0x | 33 (35.1%) | 175,727 (126,422.3%) |
| 2.0x to 2.9x | 0 (0.0%) | 14 (10.1%) |
| 3.0x to 3.9x | 0 (0.0%) | 12 (8.6%) |
| 4.0x or more | 61 (64.9%) | 96 (69.1%) |
| Total | 94 (100.0%) | 139 (100.0%) |
Real Estate Taxes by Mortgage Status in Wylandville

| Property Taxes | Without Mortgage | With Mortgage |
| Less than $800 | 80 (85.1%) | 0 (0.0%) |
| $800 to $1,499 | 3 (3.2%) | 0 (0.0%) |
| $800 to $1,499 | 11 (11.7%) | 0 (0.0%) |
| Total | 94 (100.0%) | 139 (100.0%) |
Health & Disability in Wylandville
Health Insurance Coverage by Age in Wylandville

| Age Bracket | With Coverage | Without Coverage |
| Under 6 Years | 15 (100.0%) | 0 (0.0%) |
| 6 to 18 Years | 102 (100.0%) | 0 (0.0%) |
| 19 to 25 Years | 48 (100.0%) | 0 (0.0%) |
| 26 to 34 Years | 40 (100.0%) | 0 (0.0%) |
| 35 to 44 Years | 91 (100.0%) | 0 (0.0%) |
| 45 to 54 Years | 77 (100.0%) | 0 (0.0%) |
| 55 to 64 Years | 88 (100.0%) | 0 (0.0%) |
| 65 to 74 Years | 51 (100.0%) | 0 (0.0%) |
| 75 Years and older | 17 (100.0%) | 0 (0.0%) |
| Total | 529 (100.0%) | 0 (0.0%) |
Health Insurance Coverage by Citizenship Status in Wylandville

| Citizenship Status | With Coverage | Without Coverage |
| Native Born | 15 (100.0%) | 0 (0.0%) |
| Foreign Born, Citizen | 102 (100.0%) | 0 (0.0%) |
| Foreign Born, not a Citizen | 48 (100.0%) | 0 (0.0%) |
Health Insurance Coverage by Household Income in Wylandville

| Household Income | With Coverage | Without Coverage |
| Under $25,000 | 64 (100.0%) | 0 (0.0%) |
| $25,000 to $49,999 | 69 (100.0%) | 0 (0.0%) |
| $50,000 to $74,999 | 50 (100.0%) | 0 (0.0%) |
| $75,000 to $99,999 | 0 (0.0%) | 0 (0.0%) |
| $100,000 and over | 346 (100.0%) | 0 (0.0%) |
Public vs Private Health Insurance Coverage by Age in Wylandville
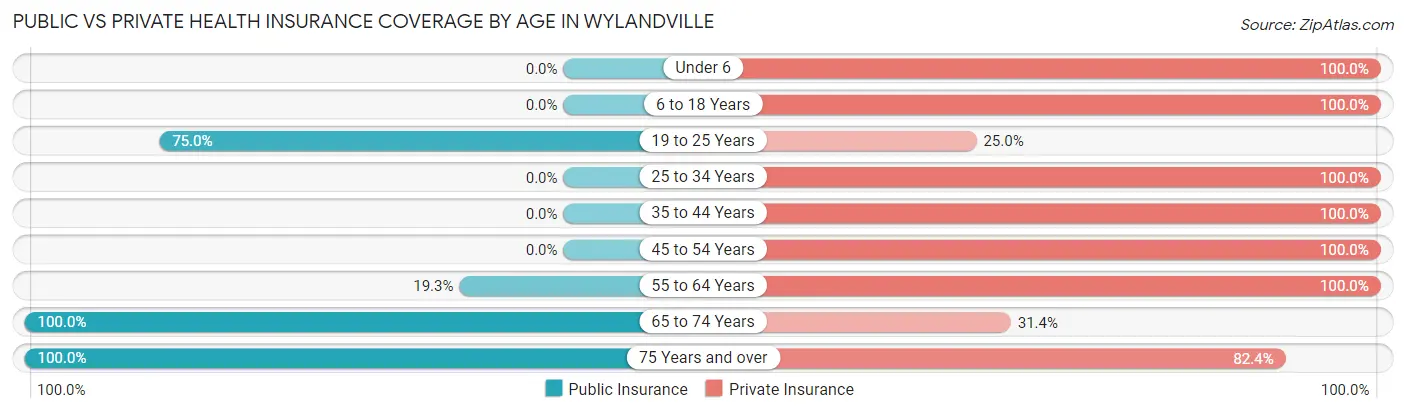
| Age Bracket | Public Insurance | Private Insurance |
| Under 6 | 0 (0.0%) | 15 (100.0%) |
| 6 to 18 Years | 0 (0.0%) | 102 (100.0%) |
| 19 to 25 Years | 36 (75.0%) | 12 (25.0%) |
| 25 to 34 Years | 0 (0.0%) | 40 (100.0%) |
| 35 to 44 Years | 0 (0.0%) | 91 (100.0%) |
| 45 to 54 Years | 0 (0.0%) | 77 (100.0%) |
| 55 to 64 Years | 17 (19.3%) | 88 (100.0%) |
| 65 to 74 Years | 51 (100.0%) | 16 (31.4%) |
| 75 Years and over | 17 (100.0%) | 14 (82.4%) |
| Total | 121 (22.9%) | 455 (86.0%) |
Disability Status by Sex by Age in Wylandville
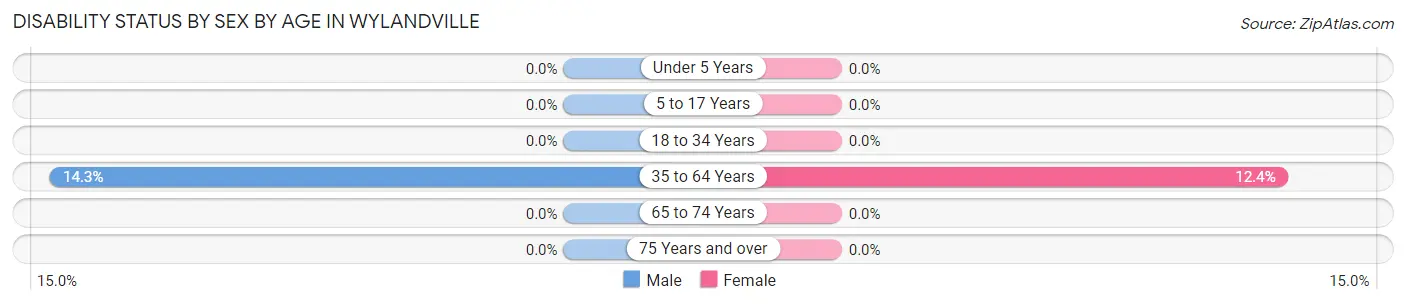
| Age Bracket | Male | Female |
| Under 5 Years | 0 (0.0%) | 0 (0.0%) |
| 5 to 17 Years | 0 (0.0%) | 0 (0.0%) |
| 18 to 34 Years | 0 (0.0%) | 0 (0.0%) |
| 35 to 64 Years | 17 (14.3%) | 17 (12.4%) |
| 65 to 74 Years | 0 (0.0%) | 0 (0.0%) |
| 75 Years and over | 0 (0.0%) | 0 (0.0%) |
Disability Class by Sex by Age in Wylandville
Disability Class: Hearing Difficulty
| Age Bracket | Male | Female |
| Under 5 Years | 0 (0.0%) | 0 (0.0%) |
| 5 to 17 Years | 0 (0.0%) | 0 (0.0%) |
| 18 to 34 Years | 0 (0.0%) | 0 (0.0%) |
| 35 to 64 Years | 0 (0.0%) | 0 (0.0%) |
| 65 to 74 Years | 0 (0.0%) | 0 (0.0%) |
| 75 Years and over | 0 (0.0%) | 0 (0.0%) |
Disability Class: Vision Difficulty
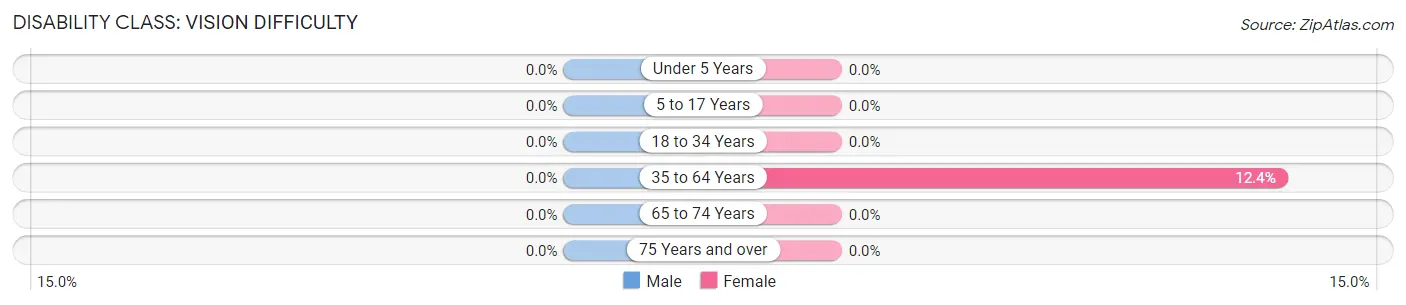
| Age Bracket | Male | Female |
| Under 5 Years | 0 (0.0%) | 0 (0.0%) |
| 5 to 17 Years | 0 (0.0%) | 0 (0.0%) |
| 18 to 34 Years | 0 (0.0%) | 0 (0.0%) |
| 35 to 64 Years | 0 (0.0%) | 17 (12.4%) |
| 65 to 74 Years | 0 (0.0%) | 0 (0.0%) |
| 75 Years and over | 0 (0.0%) | 0 (0.0%) |
Disability Class: Cognitive Difficulty

| Age Bracket | Male | Female |
| 5 to 17 Years | 0 (0.0%) | 0 (0.0%) |
| 18 to 34 Years | 0 (0.0%) | 0 (0.0%) |
| 35 to 64 Years | 0 (0.0%) | 0 (0.0%) |
| 65 to 74 Years | 0 (0.0%) | 0 (0.0%) |
| 75 Years and over | 0 (0.0%) | 0 (0.0%) |
Disability Class: Ambulatory Difficulty

| Age Bracket | Male | Female |
| 5 to 17 Years | 0 (0.0%) | 0 (0.0%) |
| 18 to 34 Years | 0 (0.0%) | 0 (0.0%) |
| 35 to 64 Years | 17 (14.3%) | 0 (0.0%) |
| 65 to 74 Years | 0 (0.0%) | 0 (0.0%) |
| 75 Years and over | 0 (0.0%) | 0 (0.0%) |
Disability Class: Self-Care Difficulty

| Age Bracket | Male | Female |
| 5 to 17 Years | 0 (0.0%) | 0 (0.0%) |
| 18 to 34 Years | 0 (0.0%) | 0 (0.0%) |
| 35 to 64 Years | 0 (0.0%) | 0 (0.0%) |
| 65 to 74 Years | 0 (0.0%) | 0 (0.0%) |
| 75 Years and over | 0 (0.0%) | 0 (0.0%) |
Technology Access in Wylandville
Computing Device Access in Wylandville
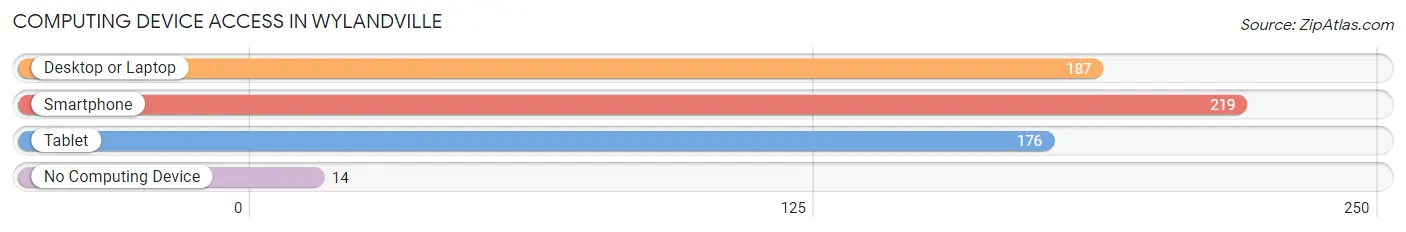
| Device Type | # Households | % Households |
| Desktop or Laptop | 187 | 80.3% |
| Smartphone | 219 | 94.0% |
| Tablet | 176 | 75.5% |
| No Computing Device | 14 | 6.0% |
| Total | 233 | 100.0% |
Internet Access in Wylandville
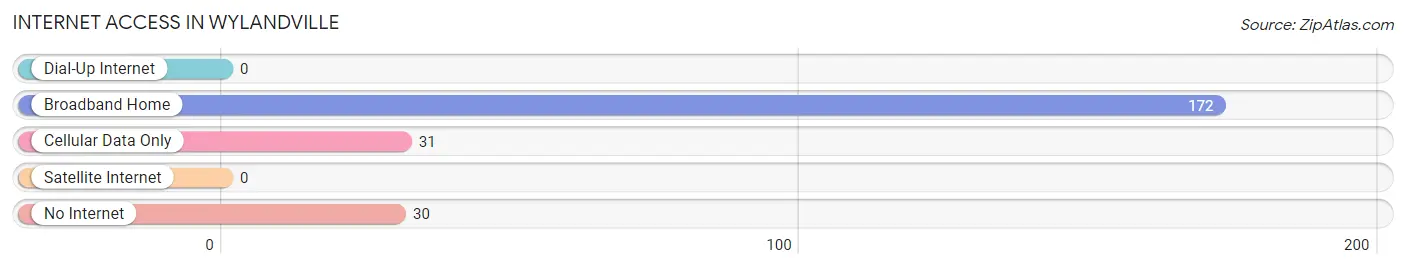
| Internet Type | # Households | % Households |
| Dial-Up Internet | 0 | 0.0% |
| Broadband Home | 172 | 73.8% |
| Cellular Data Only | 31 | 13.3% |
| Satellite Internet | 0 | 0.0% |
| No Internet | 30 | 12.9% |
| Total | 233 | 100.0% |
Wylandville Summary
Wylandville is a small borough located in Washington County, Pennsylvania. It is situated in the southwestern corner of the state, approximately 25 miles south of Pittsburgh. The population of Wylandville was 1,845 as of the 2010 census.
History
Wylandville was founded in 1845 by John Wyland, a local farmer. The town was originally known as Wylandville Station, as it was a stop on the Pittsburgh and Washington Railroad. The town was incorporated in 1891.
Geography
Wylandville is located at 40°14'N 80°14'W. It is situated in the southwestern corner of Washington County, approximately 25 miles south of Pittsburgh. The borough is bordered by the townships of North Strabane to the north, East Finley to the east, West Bethlehem to the south, and West Pike Run to the west.
The terrain of Wylandville is mostly flat, with some rolling hills. The borough is located in the Appalachian Plateau region of Pennsylvania. The climate is humid continental, with cold winters and hot, humid summers.
Economy
The economy of Wylandville is largely based on agriculture and manufacturing. The borough is home to several small businesses, including a grocery store, a hardware store, and a few restaurants. The town also has a small industrial park, which houses several manufacturing companies.
Demographics
As of the 2010 census, the population of Wylandville was 1,845. The racial makeup of the borough was 97.3% White, 0.9% African American, 0.3% Native American, 0.3% Asian, and 0.9% from other races. Hispanic or Latino of any race were 1.2% of the population.
The median household income in Wylandville was $41,250, and the median family income was $50,000. The per capita income was $20,945. About 8.3% of families and 10.2% of the population were below the poverty line, including 14.3% of those under age 18 and 8.2% of those age 65 or over.
The population of Wylandville is largely Christian, with the majority of residents belonging to the Roman Catholic Church. There is also a small Jewish community in the borough.
Common Questions
What is Per Capita Income in Wylandville?
Per Capita income in Wylandville is $46,398.
What is the Median Family Income in Wylandville?
Median Family Income in Wylandville is $175,988.
What is Income or Wage Gap in Wylandville?
Income or Wage Gap in Wylandville is 51.2%.
Women in Wylandville earn 48.8 cents for every dollar earned by a man.
What is Inequality or Gini Index in Wylandville?
Inequality or Gini Index in Wylandville is 0.52.
What is the Total Population of Wylandville?
Total Population of Wylandville is 529.
What is the Total Male Population of Wylandville?
Total Male Population of Wylandville is 254.
What is the Total Female Population of Wylandville?
Total Female Population of Wylandville is 275.
What is the Ratio of Males per 100 Females in Wylandville?
There are 92.36 Males per 100 Females in Wylandville.
What is the Ratio of Females per 100 Males in Wylandville?
There are 108.27 Females per 100 Males in Wylandville.
What is the Median Population Age in Wylandville?
Median Population Age in Wylandville is 37.3 Years.
What is the Average Family Size in Wylandville
Average Family Size in Wylandville is 3.2 People.
What is the Average Household Size in Wylandville
Average Household Size in Wylandville is 2.3 People.
How Large is the Labor Force in Wylandville?
There are 291 People in the Labor Forcein in Wylandville.
What is the Percentage of People in the Labor Force in Wylandville?
70.6% of People are in the Labor Force in Wylandville.