Brilliant, OH Map & Demographics
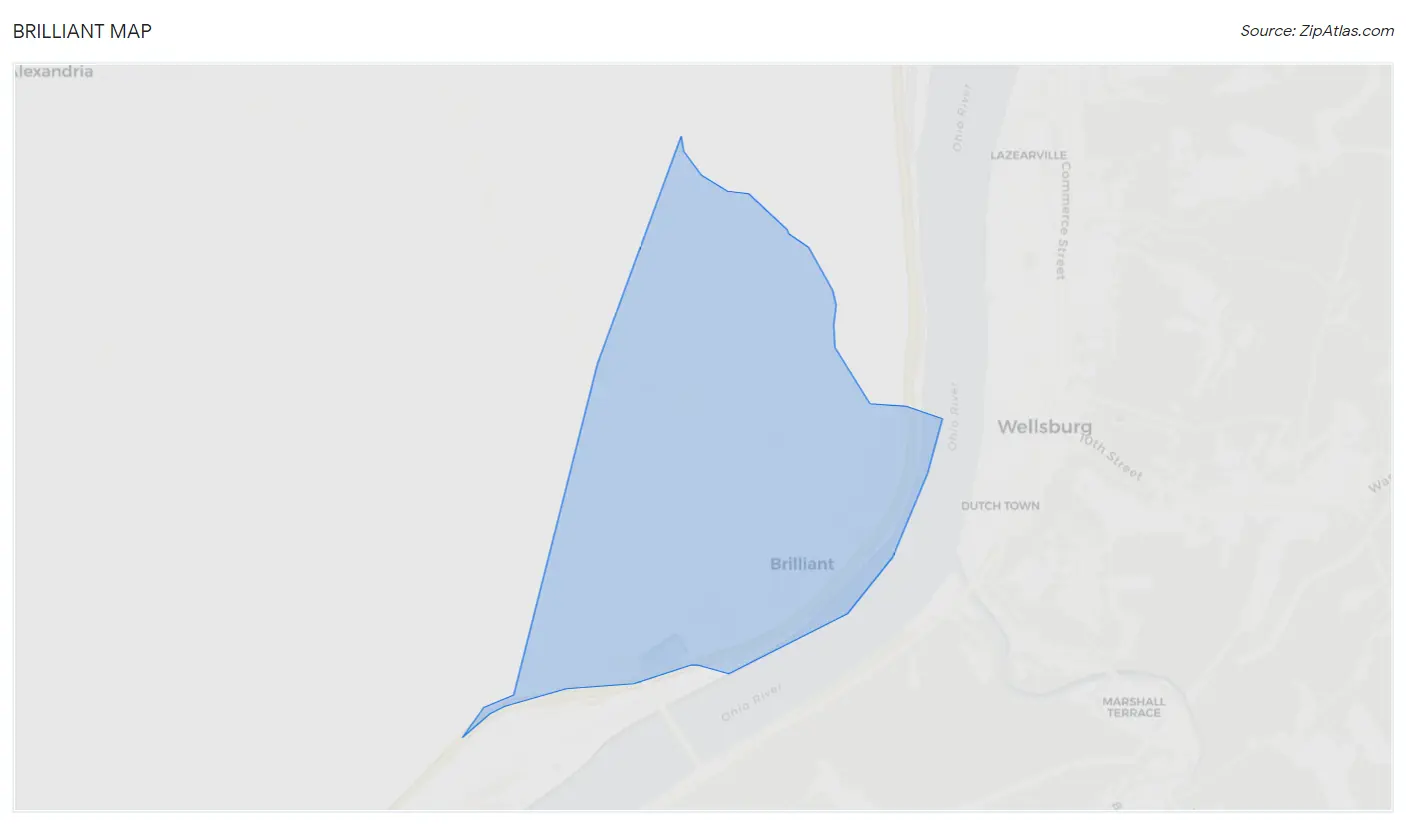
Brilliant Map
Brilliant Overview
$23,759
PER CAPITA INCOME
$56,346
AVG FAMILY INCOME
$47,727
AVG HOUSEHOLD INCOME
48.4%
WAGE / INCOME GAP [ % ]
51.6¢/ $1
WAGE / INCOME GAP [ $ ]
0.31
INEQUALITY / GINI INDEX
1,068
TOTAL POPULATION
591
MALE POPULATION
477
FEMALE POPULATION
123.90
MALES / 100 FEMALES
80.71
FEMALES / 100 MALES
45.8
MEDIAN AGE
2.6
AVG FAMILY SIZE
2.4
AVG HOUSEHOLD SIZE
531
LABOR FORCE [ PEOPLE ]
59.6%
PERCENT IN LABOR FORCE
4.0%
UNEMPLOYMENT RATE
Brilliant Zip Codes
Brilliant Area Codes
Income in Brilliant
Income Overview in Brilliant
Per Capita Income in Brilliant is $23,759, while median incomes of families and households are $56,346 and $47,727 respectively.
| Characteristic | Number | Measure |
| Per Capita Income | 1,068 | $23,759 |
| Median Family Income | 278 | $56,346 |
| Mean Family Income | 278 | $54,172 |
| Median Household Income | 450 | $47,727 |
| Mean Household Income | 450 | $53,802 |
| Income Deficit | 278 | $0 |
| Wage / Income Gap (%) | 1,068 | 48.44% |
| Wage / Income Gap ($) | 1,068 | 51.56¢ per $1 |
| Gini / Inequality Index | 1,068 | 0.31 |
Earnings by Sex in Brilliant
Average Earnings in Brilliant are $31,174, $41,781 for men and $21,541 for women, a difference of 48.4%.
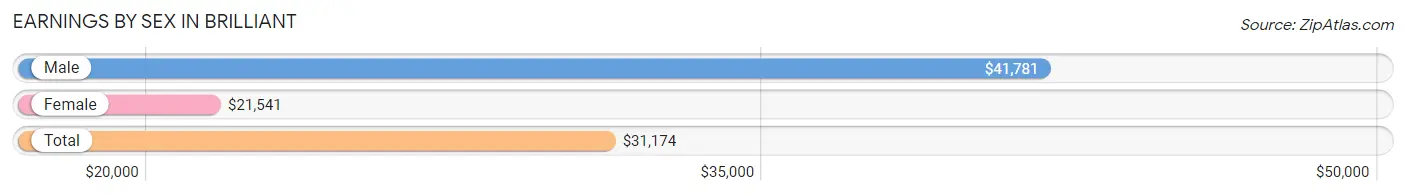
| Sex | Number | Average Earnings |
| Male | 319 (56.9%) | $41,781 |
| Female | 242 (43.1%) | $21,541 |
| Total | 561 (100.0%) | $31,174 |
Earnings by Sex by Income Bracket in Brilliant
The most common earnings brackets in Brilliant are $55,000 to $64,999 for men (64 | 20.1%) and $20,000 to $22,499 for women (73 | 30.2%).
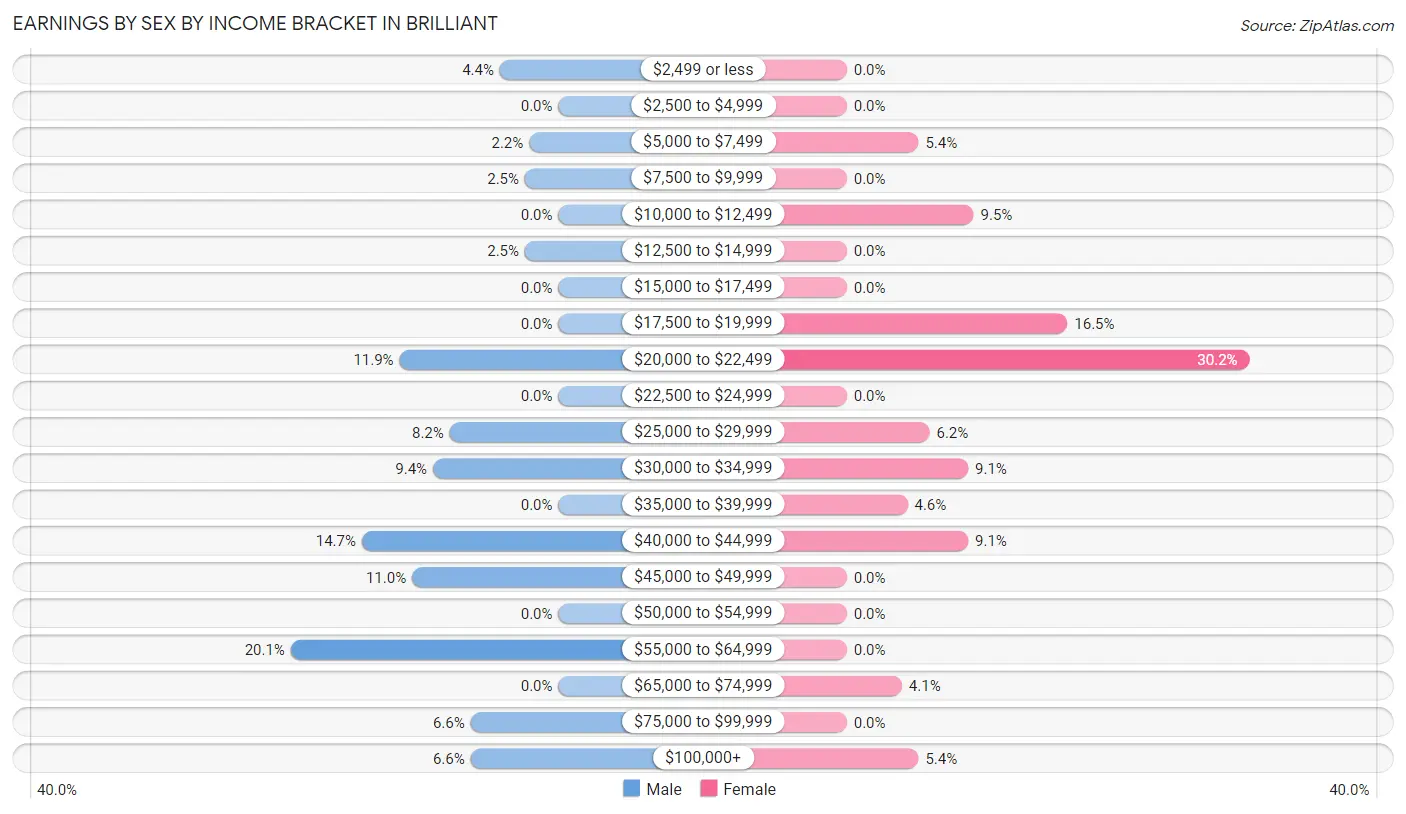
| Income | Male | Female |
| $2,499 or less | 14 (4.4%) | 0 (0.0%) |
| $2,500 to $4,999 | 0 (0.0%) | 0 (0.0%) |
| $5,000 to $7,499 | 7 (2.2%) | 13 (5.4%) |
| $7,500 to $9,999 | 8 (2.5%) | 0 (0.0%) |
| $10,000 to $12,499 | 0 (0.0%) | 23 (9.5%) |
| $12,500 to $14,999 | 8 (2.5%) | 0 (0.0%) |
| $15,000 to $17,499 | 0 (0.0%) | 0 (0.0%) |
| $17,500 to $19,999 | 0 (0.0%) | 40 (16.5%) |
| $20,000 to $22,499 | 38 (11.9%) | 73 (30.2%) |
| $22,500 to $24,999 | 0 (0.0%) | 0 (0.0%) |
| $25,000 to $29,999 | 26 (8.2%) | 15 (6.2%) |
| $30,000 to $34,999 | 30 (9.4%) | 22 (9.1%) |
| $35,000 to $39,999 | 0 (0.0%) | 11 (4.5%) |
| $40,000 to $44,999 | 47 (14.7%) | 22 (9.1%) |
| $45,000 to $49,999 | 35 (11.0%) | 0 (0.0%) |
| $50,000 to $54,999 | 0 (0.0%) | 0 (0.0%) |
| $55,000 to $64,999 | 64 (20.1%) | 0 (0.0%) |
| $65,000 to $74,999 | 0 (0.0%) | 10 (4.1%) |
| $75,000 to $99,999 | 21 (6.6%) | 0 (0.0%) |
| $100,000+ | 21 (6.6%) | 13 (5.4%) |
| Total | 319 (100.0%) | 242 (100.0%) |
Earnings by Sex by Educational Attainment in Brilliant
Average earnings in Brilliant are $42,219 for men and $22,312 for women, a difference of 47.1%. Men with an educational attainment of high school diploma enjoy the highest average annual earnings of $49,635, while those with college or associate's degree education earn the least with $32,240. Women with an educational attainment of college or associate's degree earn the most with the average annual earnings of $40,446, while those with high school diploma education have the smallest earnings of $21,387.
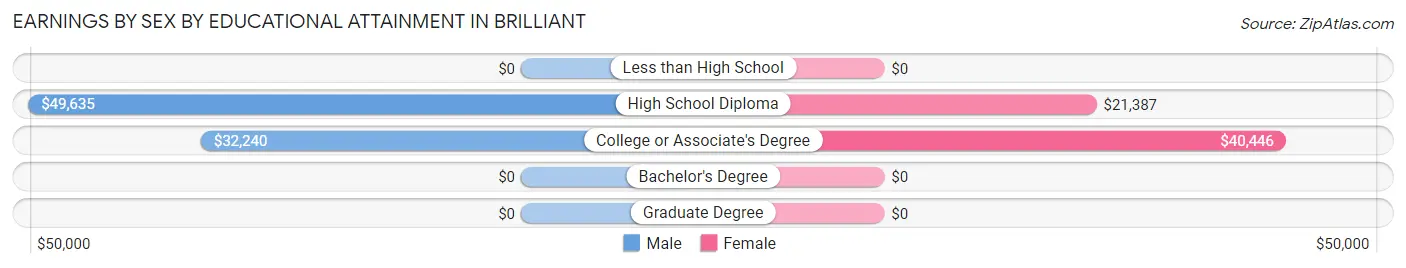
| Educational Attainment | Male Income | Female Income |
| Less than High School | - | - |
| High School Diploma | $49,635 | $21,387 |
| College or Associate's Degree | $32,240 | $40,446 |
| Bachelor's Degree | - | - |
| Graduate Degree | - | - |
| Total | $42,219 | $22,312 |
Family Income in Brilliant
Family Income Brackets in Brilliant
According to the Brilliant family income data, there are 104 families falling into the $50,000 to $74,999 income range, which is the most common income bracket and makes up 37.4% of all families.
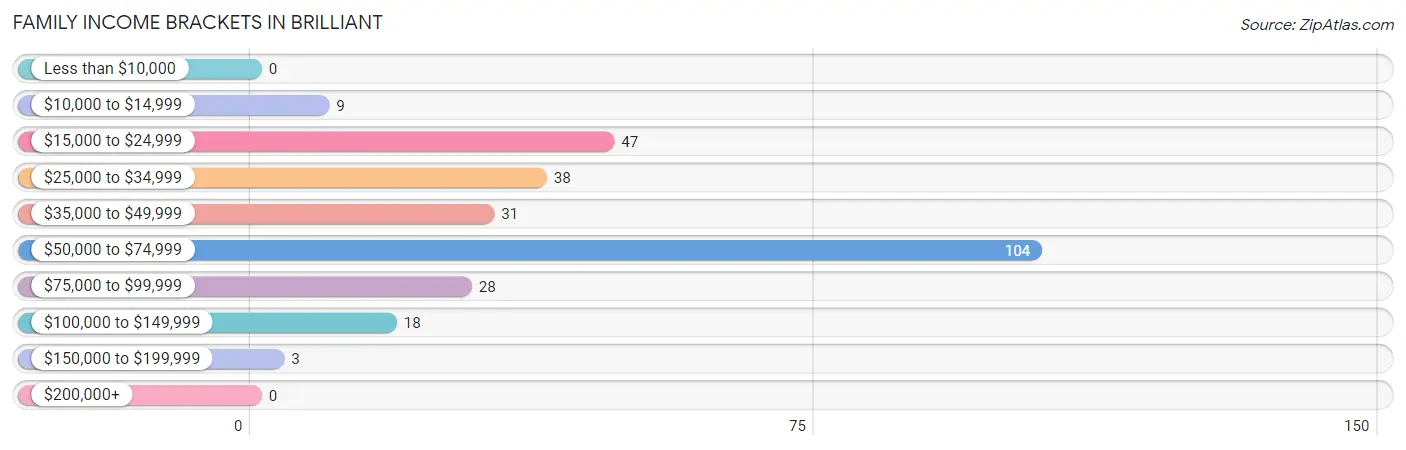
| Income Bracket | # Families | % Families |
| Less than $10,000 | 0 | 0.0% |
| $10,000 to $14,999 | 9 | 3.2% |
| $15,000 to $24,999 | 47 | 16.9% |
| $25,000 to $34,999 | 38 | 13.7% |
| $35,000 to $49,999 | 31 | 11.2% |
| $50,000 to $74,999 | 104 | 37.4% |
| $75,000 to $99,999 | 28 | 10.1% |
| $100,000 to $149,999 | 18 | 6.5% |
| $150,000 to $199,999 | 3 | 1.1% |
| $200,000+ | 0 | 0.0% |
Family Income by Famaliy Size in Brilliant
5-person families (21 | 7.5%) account for the highest median family income in Brilliant with $113,125 per family, while 2-person families (203 | 73.0%) have the highest median income of $30,038 per family member.
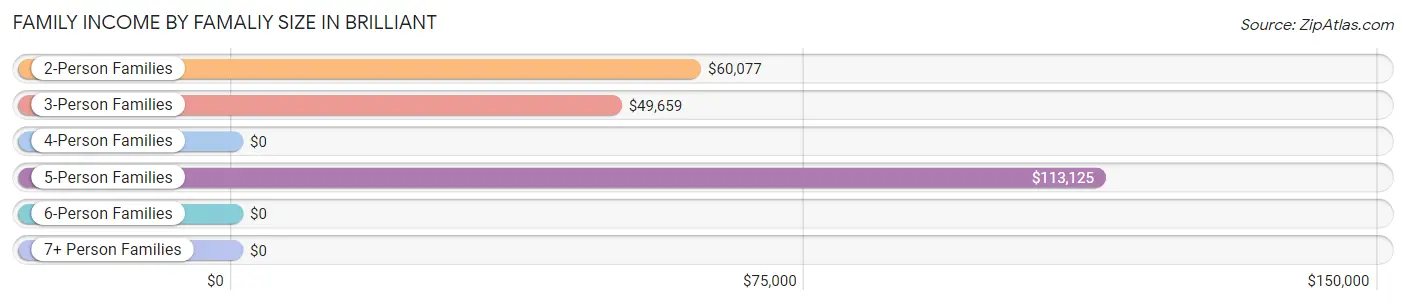
| Income Bracket | # Families | Median Income |
| 2-Person Families | 203 (73.0%) | $60,077 |
| 3-Person Families | 35 (12.6%) | $49,659 |
| 4-Person Families | 19 (6.8%) | $0 |
| 5-Person Families | 21 (7.5%) | $113,125 |
| 6-Person Families | 0 (0.0%) | $0 |
| 7+ Person Families | 0 (0.0%) | $0 |
| Total | 278 (100.0%) | $56,346 |
Family Income by Number of Earners in Brilliant
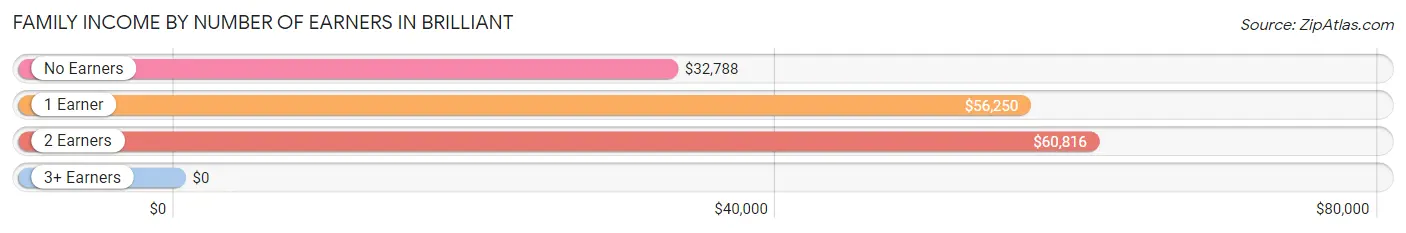
| Number of Earners | # Families | Median Income |
| No Earners | 47 (16.9%) | $32,788 |
| 1 Earner | 144 (51.8%) | $56,250 |
| 2 Earners | 84 (30.2%) | $60,816 |
| 3+ Earners | 3 (1.1%) | $0 |
| Total | 278 (100.0%) | $56,346 |
Household Income in Brilliant
Household Income Brackets in Brilliant
With 137 households falling in the category, the $50,000 to $74,999 income range is the most frequent in Brilliant, accounting for 30.4% of all households.
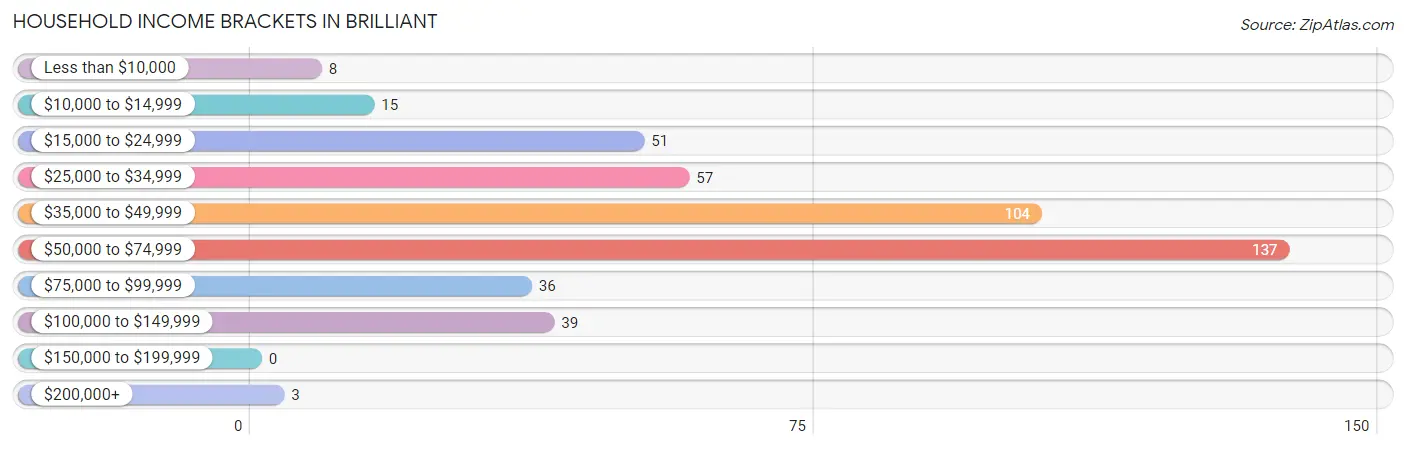
| Income Bracket | # Households | % Households |
| Less than $10,000 | 8 | 1.8% |
| $10,000 to $14,999 | 15 | 3.3% |
| $15,000 to $24,999 | 51 | 11.3% |
| $25,000 to $34,999 | 57 | 12.7% |
| $35,000 to $49,999 | 104 | 23.1% |
| $50,000 to $74,999 | 137 | 30.4% |
| $75,000 to $99,999 | 36 | 8.0% |
| $100,000 to $149,999 | 39 | 8.7% |
| $150,000 to $199,999 | 0 | 0.0% |
| $200,000+ | 3 | 0.7% |
Household Income by Householder Age in Brilliant
The median household income in Brilliant is $47,727, with the highest median household income of $61,327 found in the 45 to 64 years age bracket for the primary householder. A total of 172 households (38.2%) fall into this category. Meanwhile, the 15 to 24 years age bracket for the primary householder has the lowest median household income of $0, with 25 households (5.6%) in this group.
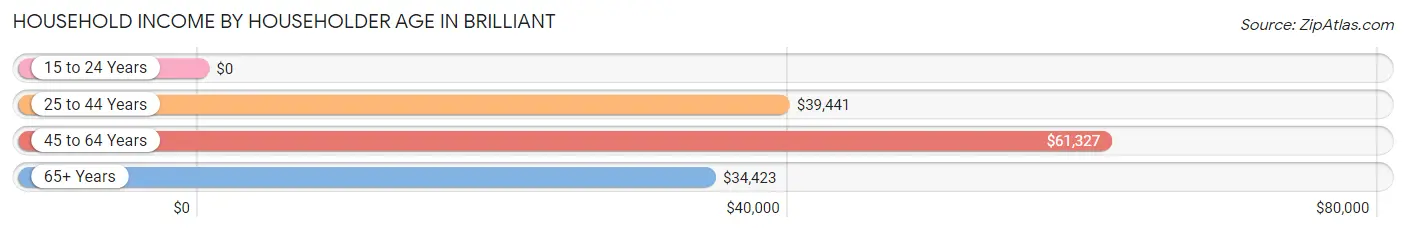
| Income Bracket | # Households | Median Income |
| 15 to 24 Years | 25 (5.6%) | $0 |
| 25 to 44 Years | 123 (27.3%) | $39,441 |
| 45 to 64 Years | 172 (38.2%) | $61,327 |
| 65+ Years | 130 (28.9%) | $34,423 |
| Total | 450 (100.0%) | $47,727 |
Poverty in Brilliant
Income Below Poverty by Sex and Age in Brilliant
With 18.1% poverty level for males and 13.2% for females among the residents of Brilliant, 18 to 24 year old males and 25 to 34 year old females are the most vulnerable to poverty, with 8 males (100.0%) and 25 females (32.9%) in their respective age groups living below the poverty level.
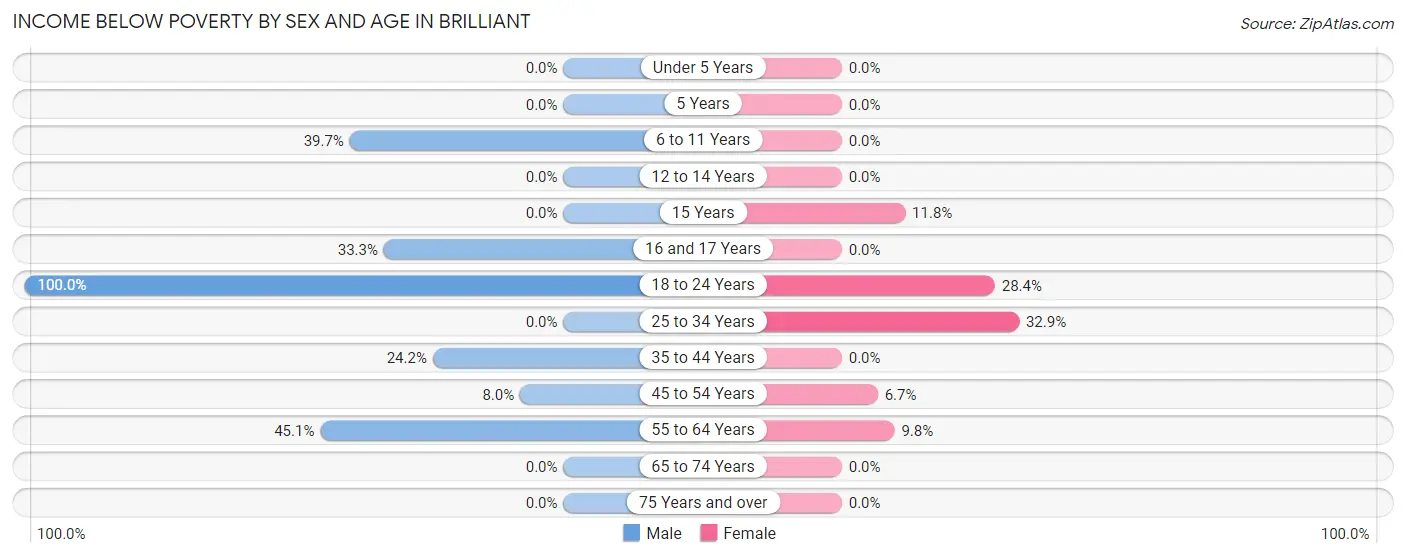
| Age Bracket | Male | Female |
| Under 5 Years | 0 (0.0%) | 0 (0.0%) |
| 5 Years | 0 (0.0%) | 0 (0.0%) |
| 6 to 11 Years | 23 (39.7%) | 0 (0.0%) |
| 12 to 14 Years | 0 (0.0%) | 0 (0.0%) |
| 15 Years | 0 (0.0%) | 2 (11.8%) |
| 16 and 17 Years | 8 (33.3%) | 0 (0.0%) |
| 18 to 24 Years | 8 (100.0%) | 23 (28.4%) |
| 25 to 34 Years | 0 (0.0%) | 25 (32.9%) |
| 35 to 44 Years | 8 (24.2%) | 0 (0.0%) |
| 45 to 54 Years | 9 (8.0%) | 4 (6.7%) |
| 55 to 64 Years | 51 (45.1%) | 9 (9.8%) |
| 65 to 74 Years | 0 (0.0%) | 0 (0.0%) |
| 75 Years and over | 0 (0.0%) | 0 (0.0%) |
| Total | 107 (18.1%) | 63 (13.2%) |
Income Above Poverty by Sex and Age in Brilliant
According to the poverty statistics in Brilliant, males aged under 5 years and females aged 6 to 11 years are the age groups that are most secure financially, with 100.0% of males and 100.0% of females in these age groups living above the poverty line.
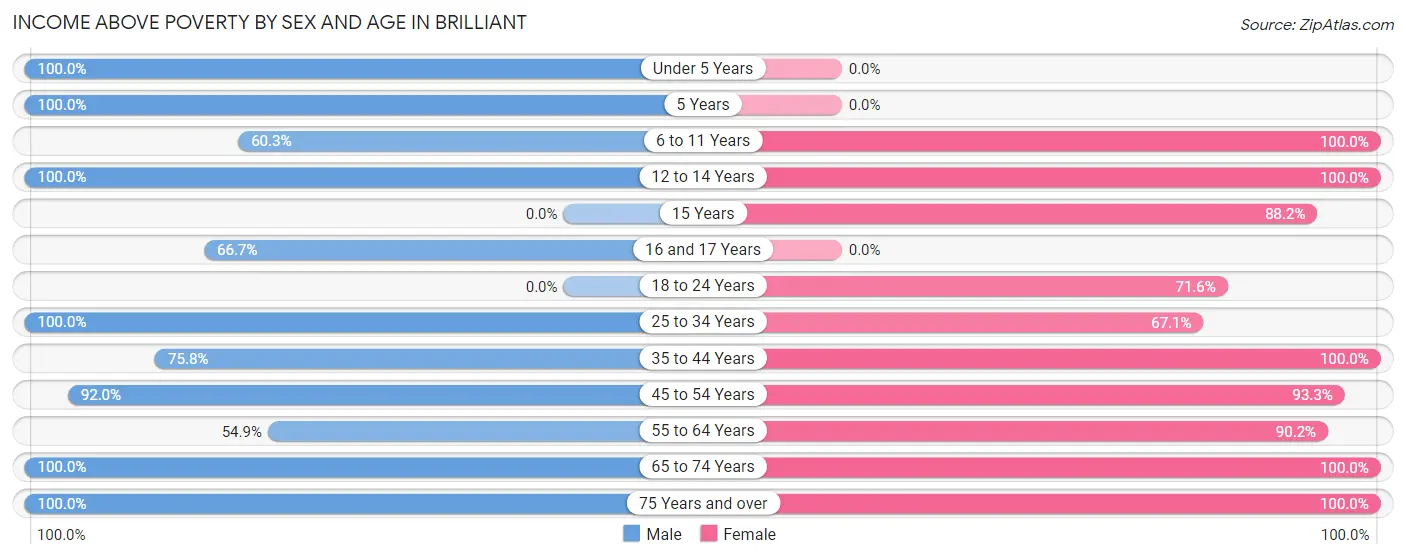
| Age Bracket | Male | Female |
| Under 5 Years | 12 (100.0%) | 0 (0.0%) |
| 5 Years | 12 (100.0%) | 0 (0.0%) |
| 6 to 11 Years | 35 (60.3%) | 38 (100.0%) |
| 12 to 14 Years | 10 (100.0%) | 30 (100.0%) |
| 15 Years | 0 (0.0%) | 15 (88.2%) |
| 16 and 17 Years | 16 (66.7%) | 0 (0.0%) |
| 18 to 24 Years | 0 (0.0%) | 58 (71.6%) |
| 25 to 34 Years | 96 (100.0%) | 51 (67.1%) |
| 35 to 44 Years | 25 (75.8%) | 18 (100.0%) |
| 45 to 54 Years | 103 (92.0%) | 56 (93.3%) |
| 55 to 64 Years | 62 (54.9%) | 83 (90.2%) |
| 65 to 74 Years | 79 (100.0%) | 42 (100.0%) |
| 75 Years and over | 34 (100.0%) | 23 (100.0%) |
| Total | 484 (81.9%) | 414 (86.8%) |
Income Below Poverty Among Married-Couple Families in Brilliant
The poverty statistics for married-couple families in Brilliant show that 5.8% or 9 of the total 156 families live below the poverty line. Families with no children have the highest poverty rate of 8.6%, comprising of 9 families. On the other hand, families with 1 or 2 children have the lowest poverty rate of 0.0%, which includes 0 families.
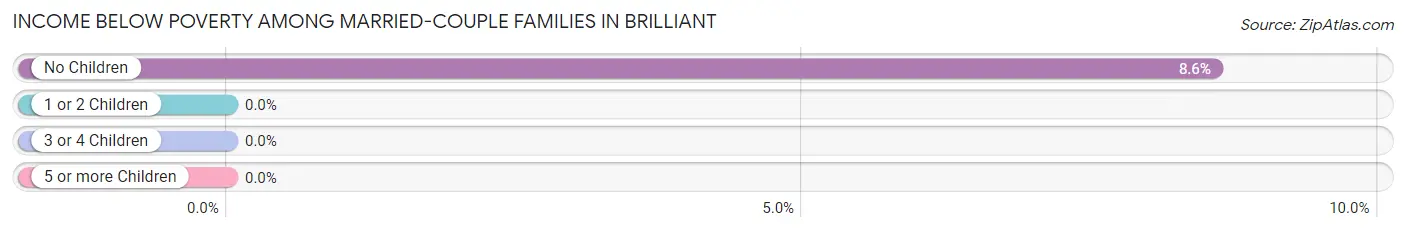
| Children | Above Poverty | Below Poverty |
| No Children | 96 (91.4%) | 9 (8.6%) |
| 1 or 2 Children | 33 (100.0%) | 0 (0.0%) |
| 3 or 4 Children | 18 (100.0%) | 0 (0.0%) |
| 5 or more Children | 0 (0.0%) | 0 (0.0%) |
| Total | 147 (94.2%) | 9 (5.8%) |
Income Below Poverty Among Single-Parent Households in Brilliant
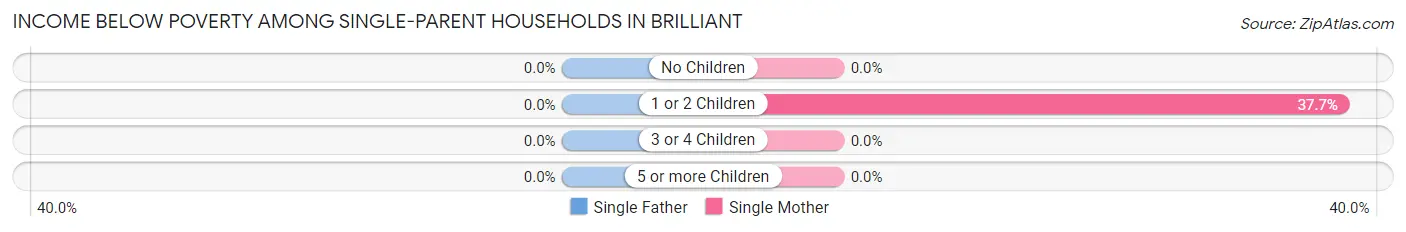
| Children | Single Father | Single Mother |
| No Children | 0 (0.0%) | 0 (0.0%) |
| 1 or 2 Children | 0 (0.0%) | 23 (37.7%) |
| 3 or 4 Children | 0 (0.0%) | 0 (0.0%) |
| 5 or more Children | 0 (0.0%) | 0 (0.0%) |
| Total | 0 (0.0%) | 23 (37.7%) |
Income Below Poverty Among Married-Couple vs Single-Parent Households in Brilliant
The poverty data for Brilliant shows that 9 of the married-couple family households (5.8%) and 23 of the single-parent households (18.9%) are living below the poverty level. Within the married-couple family households, those with no children have the highest poverty rate, with 9 households (8.6%) falling below the poverty line. Among the single-parent households, those with 1 or 2 children have the highest poverty rate, with 23 household (33.3%) living below poverty.
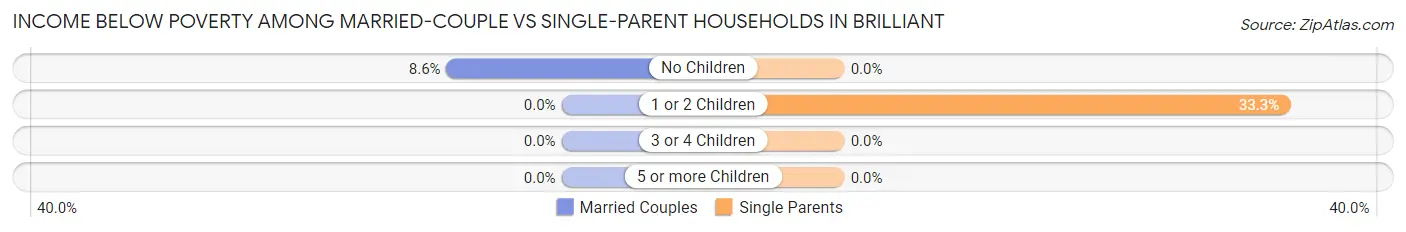
| Children | Married-Couple Families | Single-Parent Households |
| No Children | 9 (8.6%) | 0 (0.0%) |
| 1 or 2 Children | 0 (0.0%) | 23 (33.3%) |
| 3 or 4 Children | 0 (0.0%) | 0 (0.0%) |
| 5 or more Children | 0 (0.0%) | 0 (0.0%) |
| Total | 9 (5.8%) | 23 (18.9%) |
Race in Brilliant
The most populous races in Brilliant are White / Caucasian (1,034 | 96.8%), and Two or more Races (34 | 3.2%).
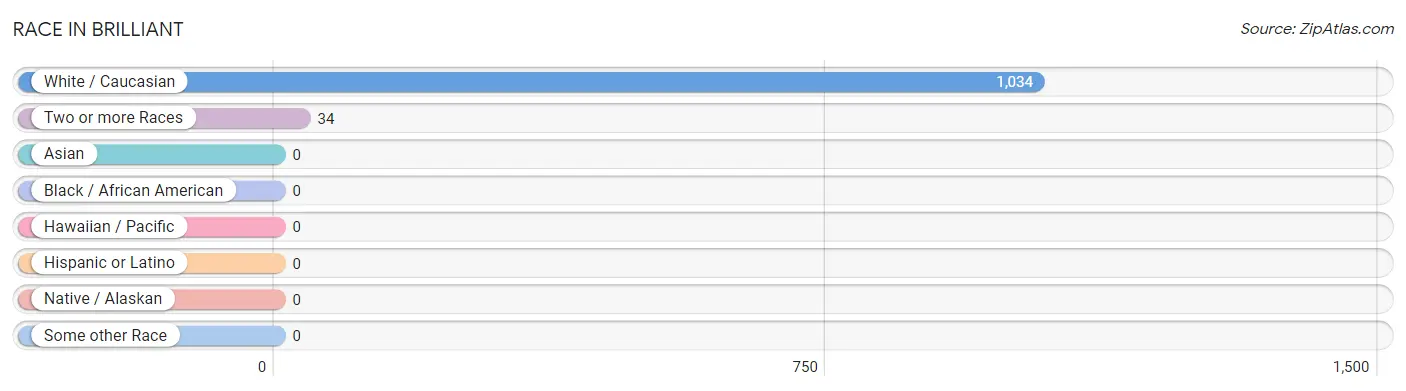
| Race | # Population | % Population |
| Asian | 0 | 0.0% |
| Black / African American | 0 | 0.0% |
| Hawaiian / Pacific | 0 | 0.0% |
| Hispanic or Latino | 0 | 0.0% |
| Native / Alaskan | 0 | 0.0% |
| White / Caucasian | 1,034 | 96.8% |
| Two or more Races | 34 | 3.2% |
| Some other Race | 0 | 0.0% |
| Total | 1,068 | 100.0% |
Ancestry in Brilliant
The most populous ancestries reported in Brilliant are Irish (361 | 33.8%), German (244 | 22.9%), English (133 | 12.4%), Italian (97 | 9.1%), and American (63 | 5.9%), together accounting for 84.1% of all Brilliant residents.
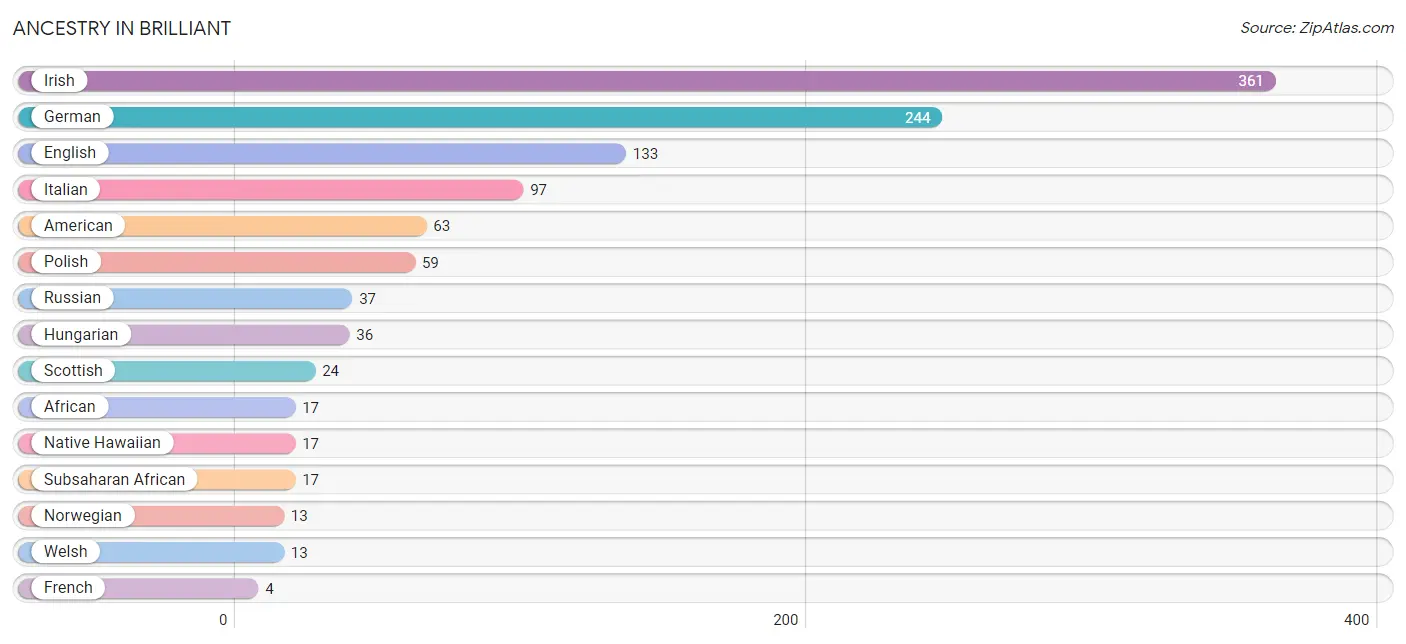
| Ancestry | # Population | % Population |
| African | 17 | 1.6% |
| American | 63 | 5.9% |
| English | 133 | 12.4% |
| French | 4 | 0.4% |
| German | 244 | 22.9% |
| Hungarian | 36 | 3.4% |
| Irish | 361 | 33.8% |
| Italian | 97 | 9.1% |
| Native Hawaiian | 17 | 1.6% |
| Norwegian | 13 | 1.2% |
| Polish | 59 | 5.5% |
| Russian | 37 | 3.5% |
| Scottish | 24 | 2.2% |
| Subsaharan African | 17 | 1.6% |
| Welsh | 13 | 1.2% | View All 15 Rows |
Immigrants in Brilliant
The most numerous immigrant groups reported in Brilliant came from Asia (8 | 0.7%), Singapore (8 | 0.7%), and South Eastern Asia (8 | 0.7%), together accounting for 2.2% of all Brilliant residents.
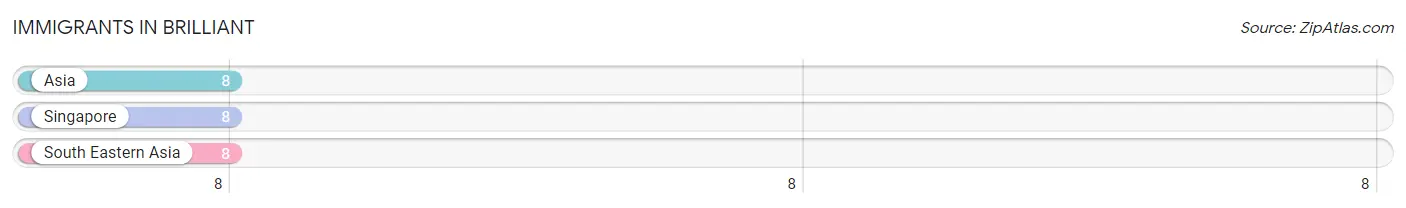
| Immigration Origin | # Population | % Population |
| Asia | 8 | 0.7% |
| Singapore | 8 | 0.7% |
| South Eastern Asia | 8 | 0.7% | View All 3 Rows |
Sex and Age in Brilliant
Sex and Age in Brilliant
The most populous age groups in Brilliant are 50 to 54 Years (76 | 12.9%) for men and 20 to 24 Years (81 | 17.0%) for women.
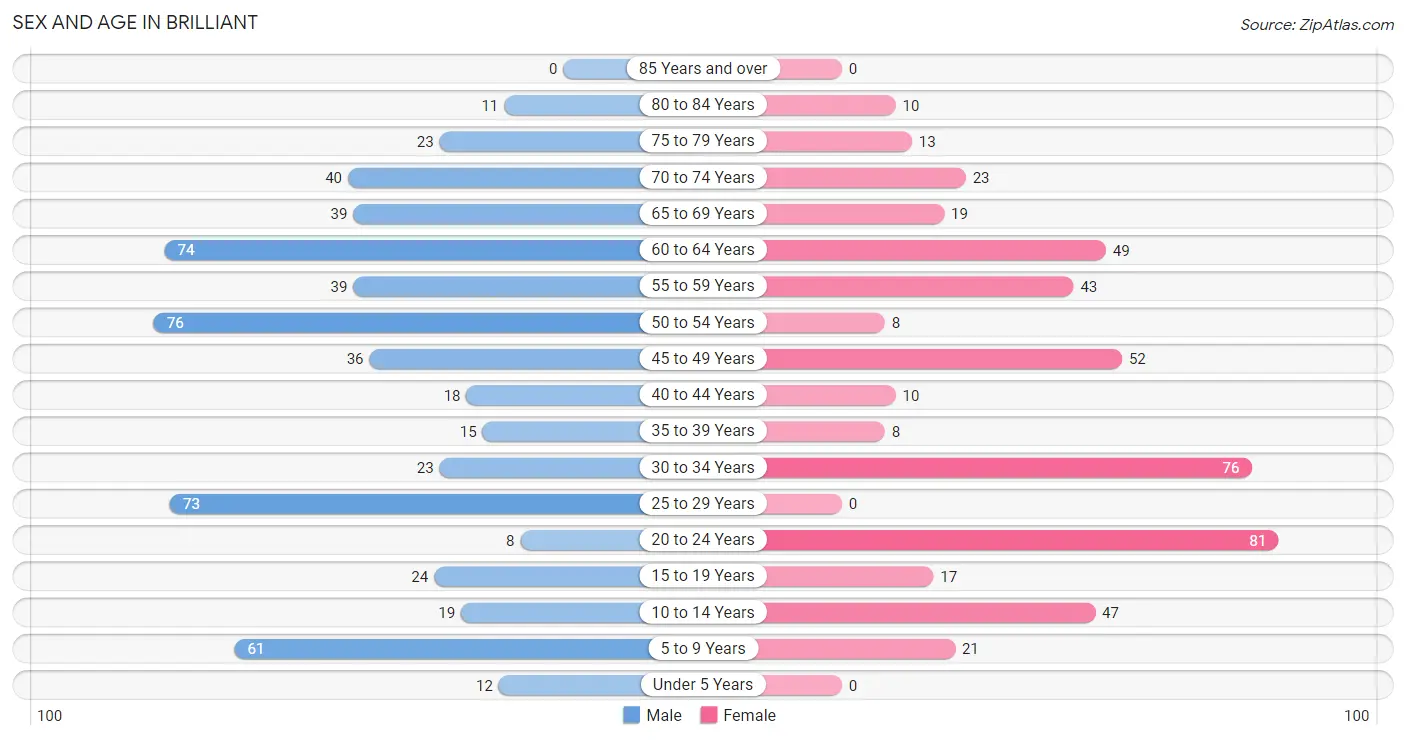
| Age Bracket | Male | Female |
| Under 5 Years | 12 (2.0%) | 0 (0.0%) |
| 5 to 9 Years | 61 (10.3%) | 21 (4.4%) |
| 10 to 14 Years | 19 (3.2%) | 47 (9.9%) |
| 15 to 19 Years | 24 (4.1%) | 17 (3.6%) |
| 20 to 24 Years | 8 (1.3%) | 81 (17.0%) |
| 25 to 29 Years | 73 (12.3%) | 0 (0.0%) |
| 30 to 34 Years | 23 (3.9%) | 76 (15.9%) |
| 35 to 39 Years | 15 (2.5%) | 8 (1.7%) |
| 40 to 44 Years | 18 (3.0%) | 10 (2.1%) |
| 45 to 49 Years | 36 (6.1%) | 52 (10.9%) |
| 50 to 54 Years | 76 (12.9%) | 8 (1.7%) |
| 55 to 59 Years | 39 (6.6%) | 43 (9.0%) |
| 60 to 64 Years | 74 (12.5%) | 49 (10.3%) |
| 65 to 69 Years | 39 (6.6%) | 19 (4.0%) |
| 70 to 74 Years | 40 (6.8%) | 23 (4.8%) |
| 75 to 79 Years | 23 (3.9%) | 13 (2.7%) |
| 80 to 84 Years | 11 (1.9%) | 10 (2.1%) |
| 85 Years and over | 0 (0.0%) | 0 (0.0%) |
| Total | 591 (100.0%) | 477 (100.0%) |
Families and Households in Brilliant
Median Family Size in Brilliant
The median family size in Brilliant is 2.58 persons per family, with married-couple families (156 | 56.1%) accounting for the largest median family size of 2.85 persons per family. On the other hand, single female/mother families (61 | 21.9%) represent the smallest median family size with 2.03 persons per family.
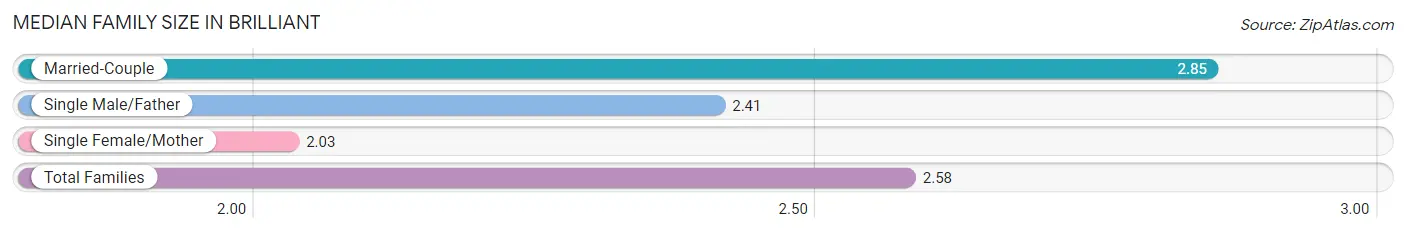
| Family Type | # Families | Family Size |
| Married-Couple | 156 (56.1%) | 2.85 |
| Single Male/Father | 61 (21.9%) | 2.41 |
| Single Female/Mother | 61 (21.9%) | 2.03 |
| Total Families | 278 (100.0%) | 2.58 |
Median Household Size in Brilliant
The median household size in Brilliant is 2.37 persons per household, with single male/father households (61 | 13.6%) accounting for the largest median household size of 3.25 persons per household. non-family households (172 | 38.2%) represent the smallest median household size with 1.41 persons per household.
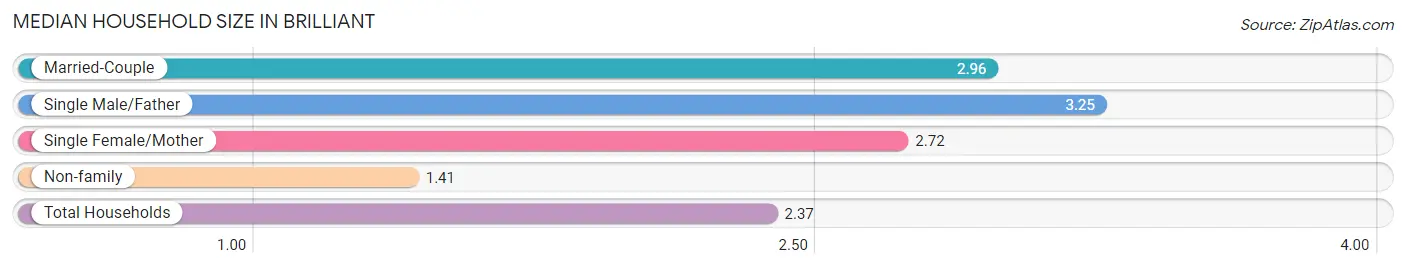
| Household Type | # Households | Household Size |
| Married-Couple | 156 (34.7%) | 2.96 |
| Single Male/Father | 61 (13.6%) | 3.25 |
| Single Female/Mother | 61 (13.6%) | 2.72 |
| Non-family | 172 (38.2%) | 1.41 |
| Total Households | 450 (100.0%) | 2.37 |
Household Size by Marriage Status in Brilliant
Out of a total of 450 households in Brilliant, 278 (61.8%) are family households, while 172 (38.2%) are nonfamily households. The most numerous type of family households are 3-person households, comprising 125, and the most common type of nonfamily households are 1-person households, comprising 100.
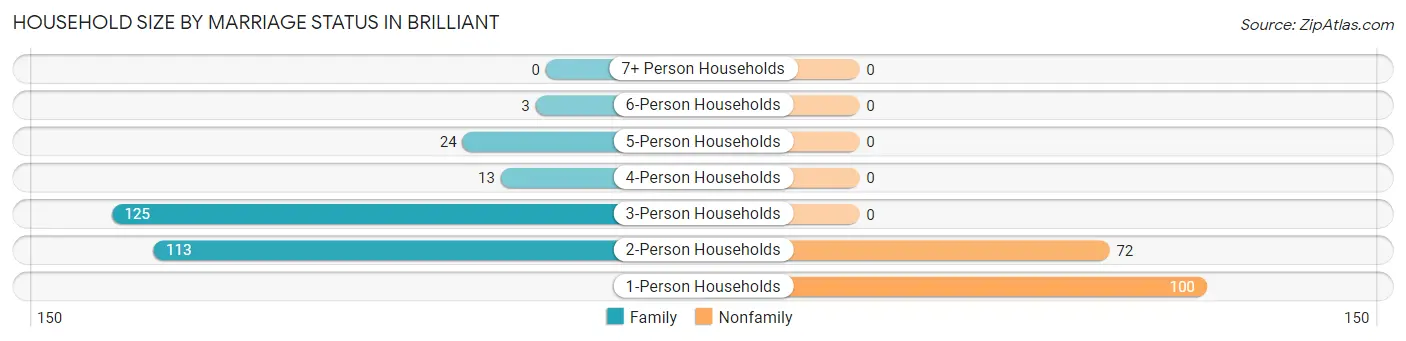
| Household Size | Family Households | Nonfamily Households |
| 1-Person Households | - | 100 (22.2%) |
| 2-Person Households | 113 (25.1%) | 72 (16.0%) |
| 3-Person Households | 125 (27.8%) | 0 (0.0%) |
| 4-Person Households | 13 (2.9%) | 0 (0.0%) |
| 5-Person Households | 24 (5.3%) | 0 (0.0%) |
| 6-Person Households | 3 (0.7%) | 0 (0.0%) |
| 7+ Person Households | 0 (0.0%) | 0 (0.0%) |
| Total | 278 (61.8%) | 172 (38.2%) |
Female Fertility in Brilliant
Fertility by Age in Brilliant
Average fertility rate in Brilliant is 16.0 births per 1,000 women. Women in the age bracket of 35 to 50 years have the highest fertility rate with 57.0 births per 1,000 women. Women in the age bracket of 35 to 50 years acount for 100.0% of all women with births.
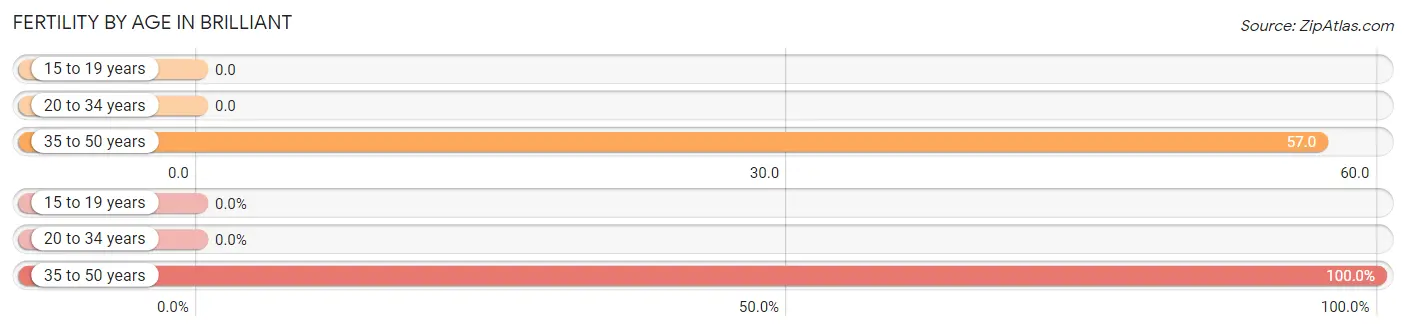
| Age Bracket | Women with Births | Births / 1,000 Women |
| 15 to 19 years | 0 (0.0%) | 0.0 |
| 20 to 34 years | 0 (0.0%) | 0.0 |
| 35 to 50 years | 4 (100.0%) | 57.0 |
| Total | 4 (100.0%) | 16.0 |
Fertility by Age by Marriage Status in Brilliant
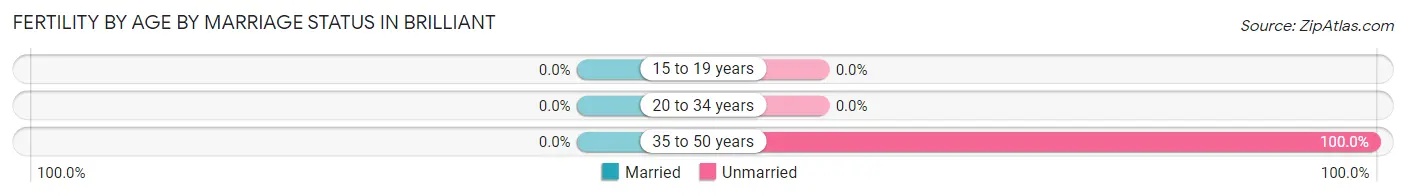
| Age Bracket | Married | Unmarried |
| 15 to 19 years | 0 (0.0%) | 0 (0.0%) |
| 20 to 34 years | 0 (0.0%) | 0 (0.0%) |
| 35 to 50 years | 0 (0.0%) | 4 (100.0%) |
| Total | 0 (0.0%) | 4 (100.0%) |
Fertility by Education in Brilliant
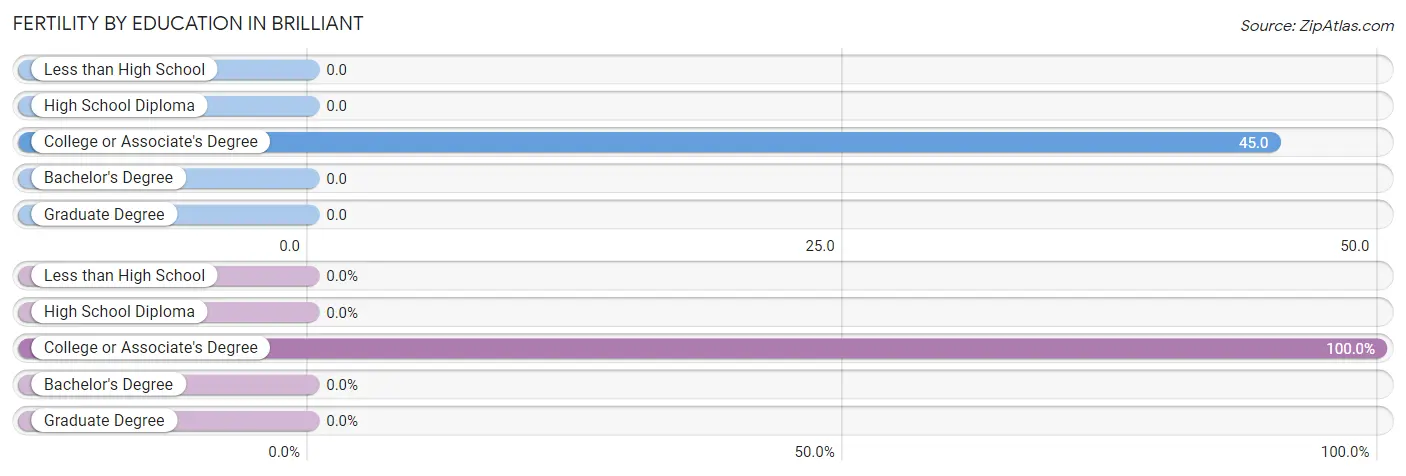
| Educational Attainment | Women with Births | Births / 1,000 Women |
| Less than High School | 0 (0.0%) | 0.0 |
| High School Diploma | 0 (0.0%) | 0.0 |
| College or Associate's Degree | 4 (100.0%) | 45.0 |
| Bachelor's Degree | 0 (0.0%) | 0.0 |
| Graduate Degree | 0 (0.0%) | 0.0 |
| Total | 4 (100.0%) | 16.0 |
Fertility by Education by Marriage Status in Brilliant
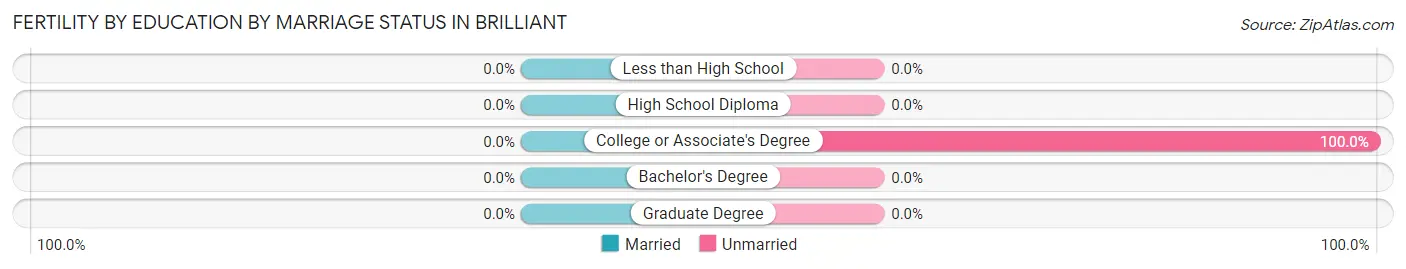
| Educational Attainment | Married | Unmarried |
| Less than High School | 0 (0.0%) | 0 (0.0%) |
| High School Diploma | 0 (0.0%) | 0 (0.0%) |
| College or Associate's Degree | 0 (0.0%) | 4 (100.0%) |
| Bachelor's Degree | 0 (0.0%) | 0 (0.0%) |
| Graduate Degree | 0 (0.0%) | 0 (0.0%) |
| Total | 0 (0.0%) | 4 (100.0%) |
Employment Characteristics in Brilliant
Employment by Class of Employer in Brilliant
Among the 497 employed individuals in Brilliant, private company employees (377 | 75.9%), local government employees (70 | 14.1%), and not-for-profit organizations (27 | 5.4%) make up the most common classes of employment.
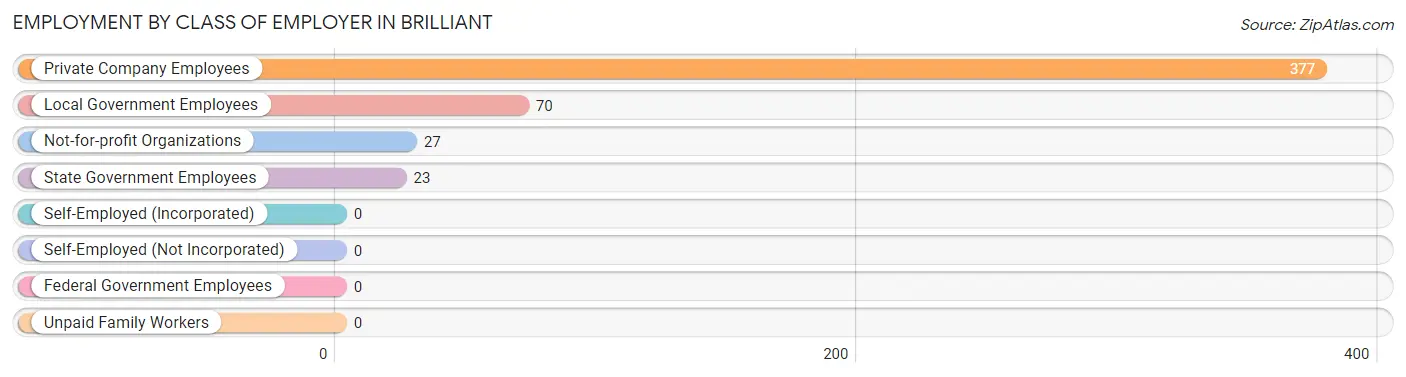
| Employer Class | # Employees | % Employees |
| Private Company Employees | 377 | 75.9% |
| Self-Employed (Incorporated) | 0 | 0.0% |
| Self-Employed (Not Incorporated) | 0 | 0.0% |
| Not-for-profit Organizations | 27 | 5.4% |
| Local Government Employees | 70 | 14.1% |
| State Government Employees | 23 | 4.6% |
| Federal Government Employees | 0 | 0.0% |
| Unpaid Family Workers | 0 | 0.0% |
| Total | 497 | 100.0% |
Employment Status by Age in Brilliant
According to the labor force statistics for Brilliant, out of the total population over 16 years of age (891), 59.6% or 531 individuals are in the labor force, with 4.0% or 21 of them unemployed. The age group with the highest labor force participation rate is 20 to 24 years, with 100.0% or 89 individuals in the labor force. Within the labor force, the 35 to 44 years age range has the highest percentage of unemployed individuals, with 23.5% or 8 of them being unemployed.
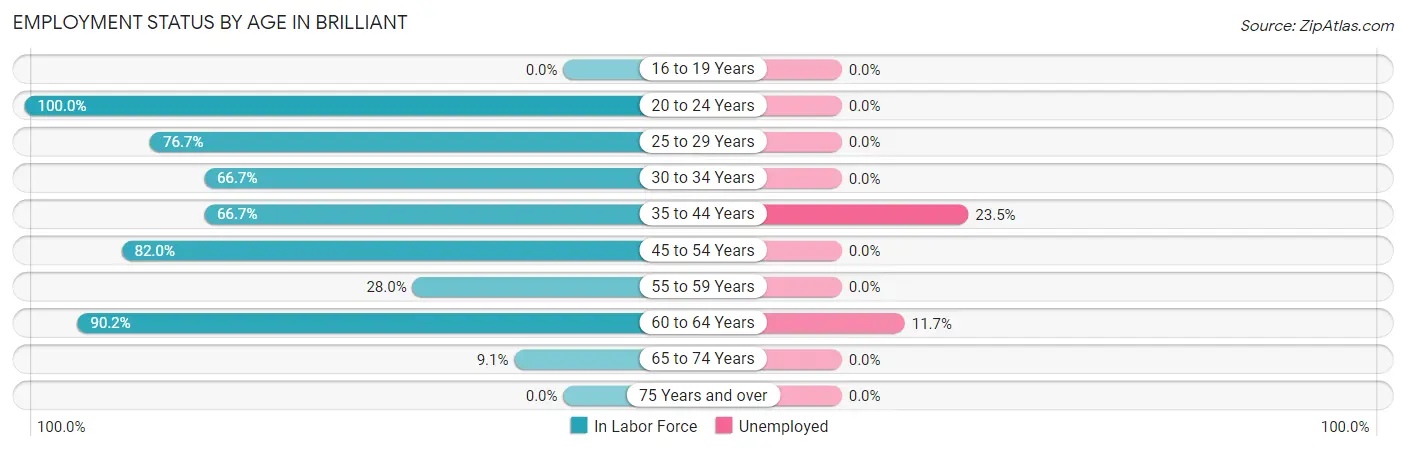
| Age Bracket | In Labor Force | Unemployed |
| 16 to 19 Years | 0 (0.0%) | 0 (0.0%) |
| 20 to 24 Years | 89 (100.0%) | 0 (0.0%) |
| 25 to 29 Years | 56 (76.7%) | 0 (0.0%) |
| 30 to 34 Years | 66 (66.7%) | 0 (0.0%) |
| 35 to 44 Years | 34 (66.7%) | 8 (23.5%) |
| 45 to 54 Years | 141 (82.0%) | 0 (0.0%) |
| 55 to 59 Years | 23 (28.0%) | 0 (0.0%) |
| 60 to 64 Years | 111 (90.2%) | 13 (11.7%) |
| 65 to 74 Years | 11 (9.1%) | 0 (0.0%) |
| 75 Years and over | 0 (0.0%) | 0 (0.0%) |
| Total | 531 (59.6%) | 21 (4.0%) |
Employment Status by Educational Attainment in Brilliant
According to labor force statistics for Brilliant, 71.8% of individuals (431) out of the total population between 25 and 64 years of age (600) are in the labor force, with 4.9% or 21 of them being unemployed. The group with the highest labor force participation rate are those with the educational attainment of bachelor's degree or higher, with 100.0% or 35 individuals in the labor force. Within the labor force, individuals with college / associate degree education have the highest percentage of unemployment, with 9.2% or 21 of them being unemployed.
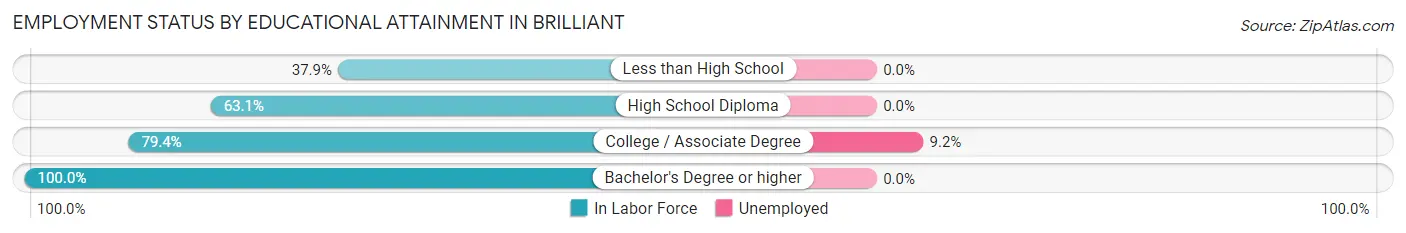
| Educational Attainment | In Labor Force | Unemployed |
| Less than High School | 11 (37.9%) | 0 (0.0%) |
| High School Diploma | 157 (63.1%) | 0 (0.0%) |
| College / Associate Degree | 228 (79.4%) | 26 (9.2%) |
| Bachelor's Degree or higher | 35 (100.0%) | 0 (0.0%) |
| Total | 431 (71.8%) | 29 (4.9%) |
Employment Occupations by Sex in Brilliant
Management, Business, Science and Arts Occupations
The most common Management, Business, Science and Arts occupations in Brilliant are Community & Social Service (19 | 3.7%), Health Diagnosing & Treating (13 | 2.5%), Health Technologists (13 | 2.5%), Computers, Engineering & Science (11 | 2.2%), and Computers & Mathematics (11 | 2.2%).
Management, Business, Science and Arts Occupations by Sex
Within the Management, Business, Science and Arts occupations in Brilliant, the most male-oriented occupations are Management (100.0%), Computers, Engineering & Science (100.0%), and Computers & Mathematics (100.0%), while the most female-oriented occupations are Community & Social Service (100.0%), Education, Arts & Media (100.0%), and Legal Services & Support (100.0%).
| Occupation | Male | Female |
| Management | 10 (100.0%) | 0 (0.0%) |
| Business & Financial | 0 (0.0%) | 0 (0.0%) |
| Computers, Engineering & Science | 11 (100.0%) | 0 (0.0%) |
| Computers & Mathematics | 11 (100.0%) | 0 (0.0%) |
| Architecture & Engineering | 0 (0.0%) | 0 (0.0%) |
| Life, Physical & Social Science | 0 (0.0%) | 0 (0.0%) |
| Community & Social Service | 0 (0.0%) | 19 (100.0%) |
| Education, Arts & Media | 0 (0.0%) | 10 (100.0%) |
| Legal Services & Support | 0 (0.0%) | 9 (100.0%) |
| Education Instruction & Library | 0 (0.0%) | 0 (0.0%) |
| Arts, Media & Entertainment | 0 (0.0%) | 0 (0.0%) |
| Health Diagnosing & Treating | 0 (0.0%) | 13 (100.0%) |
| Health Technologists | 0 (0.0%) | 13 (100.0%) |
| Total (Category) | 21 (39.6%) | 32 (60.4%) |
| Total (Overall) | 268 (52.5%) | 242 (47.4%) |
Services Occupations
The most common Services occupations in Brilliant are Security & Protection (57 | 11.2%), Law Enforcement (34 | 6.7%), Food Preparation & Serving (27 | 5.3%), Firefighting & Prevention (23 | 4.5%), and Cleaning & Maintenance (10 | 2.0%).
Services Occupations by Sex
Within the Services occupations in Brilliant, the most male-oriented occupations are Cleaning & Maintenance (100.0%), Law Enforcement (82.4%), and Security & Protection (49.1%), while the most female-oriented occupations are Healthcare Support (100.0%), Firefighting & Prevention (100.0%), and Food Preparation & Serving (100.0%).
| Occupation | Male | Female |
| Healthcare Support | 0 (0.0%) | 8 (100.0%) |
| Security & Protection | 28 (49.1%) | 29 (50.9%) |
| Firefighting & Prevention | 0 (0.0%) | 23 (100.0%) |
| Law Enforcement | 28 (82.4%) | 6 (17.6%) |
| Food Preparation & Serving | 0 (0.0%) | 27 (100.0%) |
| Cleaning & Maintenance | 10 (100.0%) | 0 (0.0%) |
| Personal Care & Service | 0 (0.0%) | 9 (100.0%) |
| Total (Category) | 38 (34.2%) | 73 (65.8%) |
| Total (Overall) | 268 (52.5%) | 242 (47.4%) |
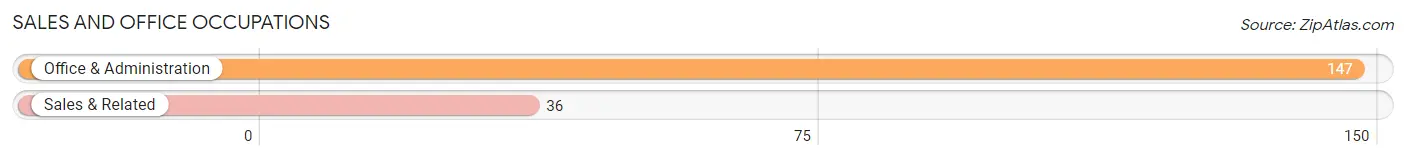
Sales and Office Occupations
The most common Sales and Office occupations in Brilliant are Office & Administration (147 | 28.8%), and Sales & Related (36 | 7.1%).
Sales and Office Occupations by Sex
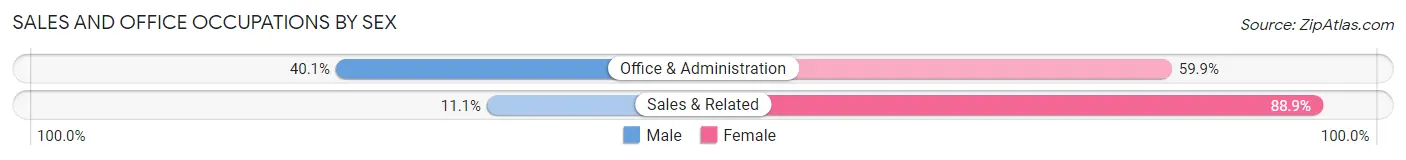
| Occupation | Male | Female |
| Sales & Related | 4 (11.1%) | 32 (88.9%) |
| Office & Administration | 59 (40.1%) | 88 (59.9%) |
| Total (Category) | 63 (34.4%) | 120 (65.6%) |
| Total (Overall) | 268 (52.5%) | 242 (47.4%) |
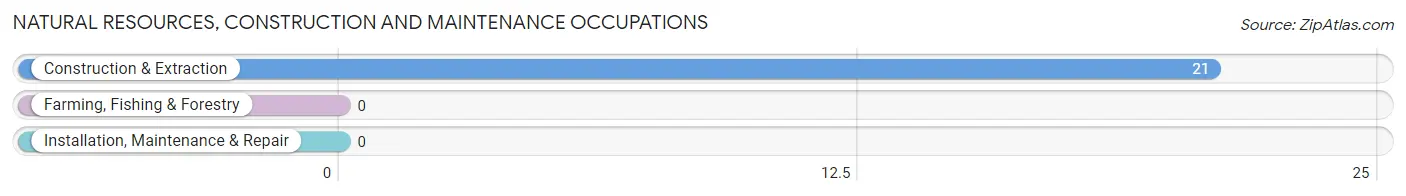
Natural Resources, Construction and Maintenance Occupations
The most common Natural Resources, Construction and Maintenance occupations in Brilliant are , and Construction & Extraction (21 | 4.1%).
Natural Resources, Construction and Maintenance Occupations by Sex
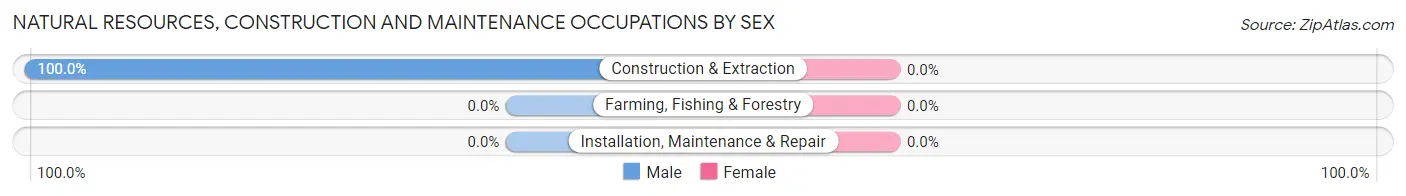
| Occupation | Male | Female |
| Farming, Fishing & Forestry | 0 (0.0%) | 0 (0.0%) |
| Construction & Extraction | 21 (100.0%) | 0 (0.0%) |
| Installation, Maintenance & Repair | 0 (0.0%) | 0 (0.0%) |
| Total (Category) | 21 (100.0%) | 0 (0.0%) |
| Total (Overall) | 268 (52.5%) | 242 (47.4%) |
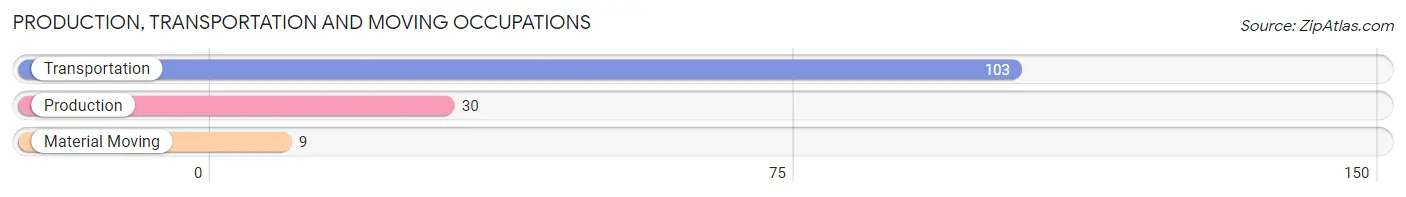
Production, Transportation and Moving Occupations
The most common Production, Transportation and Moving occupations in Brilliant are Transportation (103 | 20.2%), Production (30 | 5.9%), and Material Moving (9 | 1.8%).
Production, Transportation and Moving Occupations by Sex
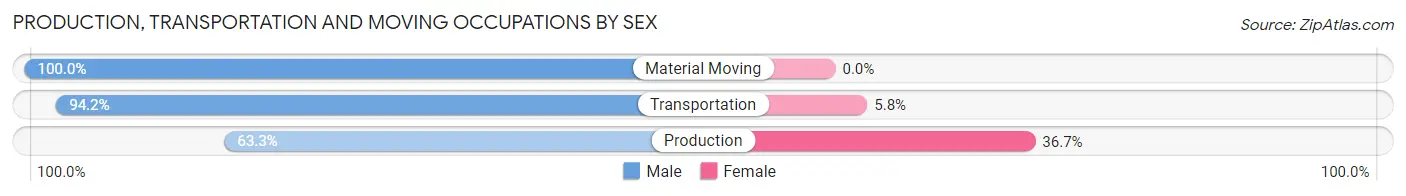
| Occupation | Male | Female |
| Production | 19 (63.3%) | 11 (36.7%) |
| Transportation | 97 (94.2%) | 6 (5.8%) |
| Material Moving | 9 (100.0%) | 0 (0.0%) |
| Total (Category) | 125 (88.0%) | 17 (12.0%) |
| Total (Overall) | 268 (52.5%) | 242 (47.4%) |
Employment Industries by Sex in Brilliant
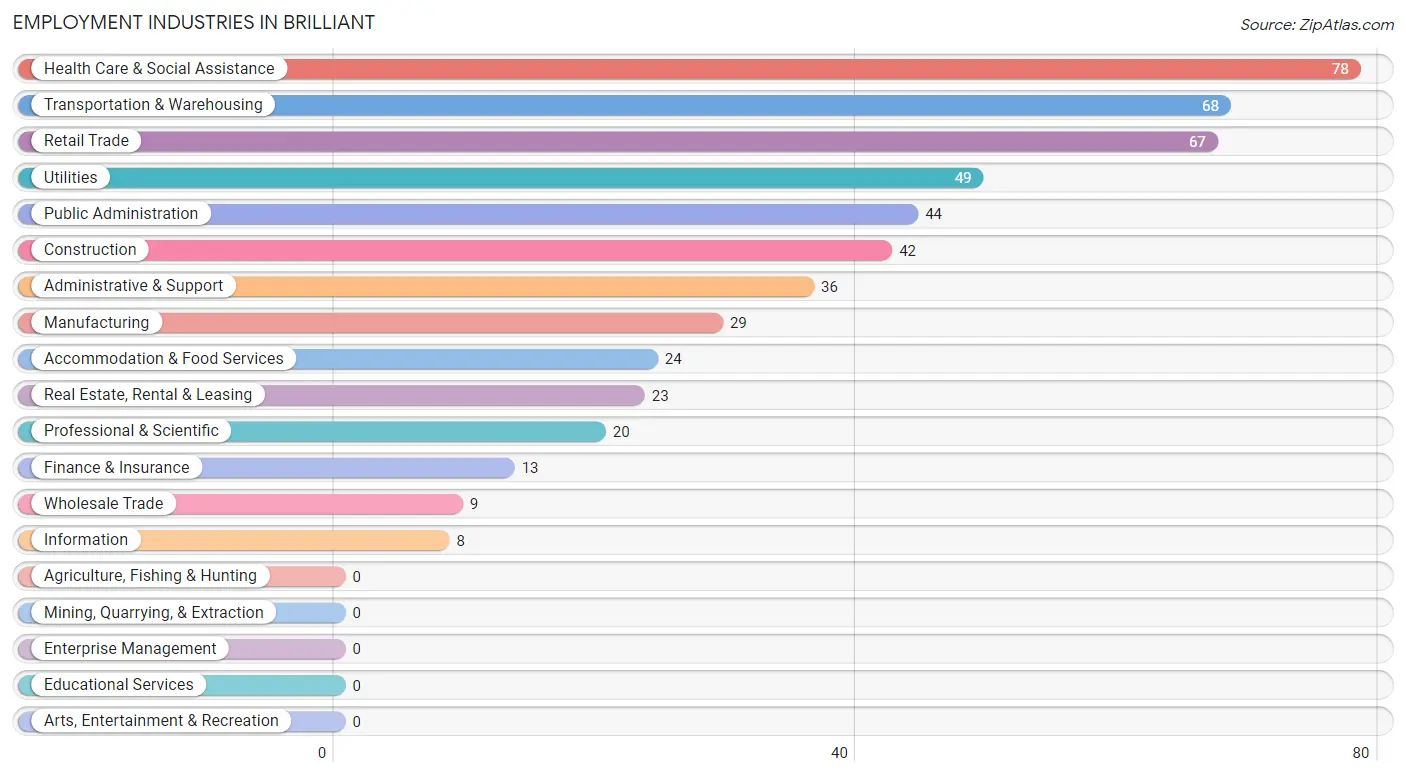
Employment Industries in Brilliant
The major employment industries in Brilliant include Health Care & Social Assistance (78 | 15.3%), Transportation & Warehousing (68 | 13.3%), Retail Trade (67 | 13.1%), Utilities (49 | 9.6%), and Public Administration (44 | 8.6%).
Employment Industries by Sex in Brilliant
The Brilliant industries that see more men than women are Construction (100.0%), Wholesale Trade (100.0%), and Information (100.0%), whereas the industries that tend to have a higher number of women are Utilities (100.0%), Finance & Insurance (100.0%), and Administrative & Support (100.0%).
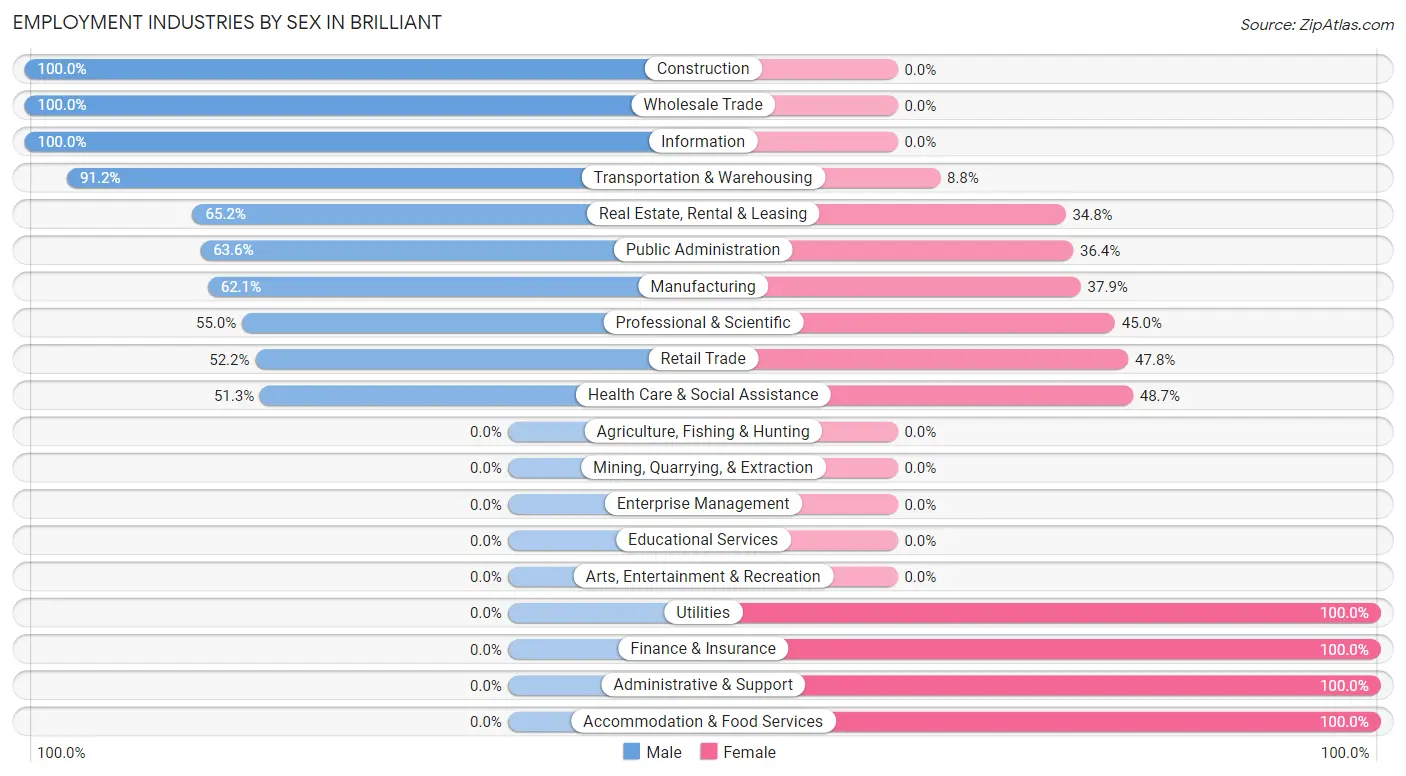
| Industry | Male | Female |
| Agriculture, Fishing & Hunting | 0 (0.0%) | 0 (0.0%) |
| Mining, Quarrying, & Extraction | 0 (0.0%) | 0 (0.0%) |
| Construction | 42 (100.0%) | 0 (0.0%) |
| Manufacturing | 18 (62.1%) | 11 (37.9%) |
| Wholesale Trade | 9 (100.0%) | 0 (0.0%) |
| Retail Trade | 35 (52.2%) | 32 (47.8%) |
| Transportation & Warehousing | 62 (91.2%) | 6 (8.8%) |
| Utilities | 0 (0.0%) | 49 (100.0%) |
| Information | 8 (100.0%) | 0 (0.0%) |
| Finance & Insurance | 0 (0.0%) | 13 (100.0%) |
| Real Estate, Rental & Leasing | 15 (65.2%) | 8 (34.8%) |
| Professional & Scientific | 11 (55.0%) | 9 (45.0%) |
| Enterprise Management | 0 (0.0%) | 0 (0.0%) |
| Administrative & Support | 0 (0.0%) | 36 (100.0%) |
| Educational Services | 0 (0.0%) | 0 (0.0%) |
| Health Care & Social Assistance | 40 (51.3%) | 38 (48.7%) |
| Arts, Entertainment & Recreation | 0 (0.0%) | 0 (0.0%) |
| Accommodation & Food Services | 0 (0.0%) | 24 (100.0%) |
| Public Administration | 28 (63.6%) | 16 (36.4%) |
| Total | 268 (52.5%) | 242 (47.4%) |
Education in Brilliant
School Enrollment in Brilliant
The most common levels of schooling among the 202 students in Brilliant are middle school (65 | 32.2%), high school (48 | 23.8%), and elementary school (47 | 23.3%).
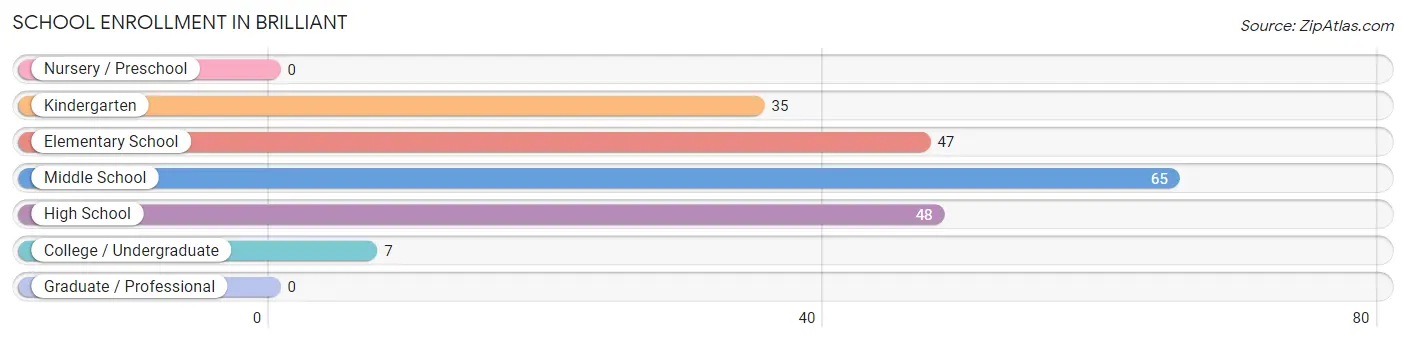
| School Level | # Students | % Students |
| Nursery / Preschool | 0 | 0.0% |
| Kindergarten | 35 | 17.3% |
| Elementary School | 47 | 23.3% |
| Middle School | 65 | 32.2% |
| High School | 48 | 23.8% |
| College / Undergraduate | 7 | 3.5% |
| Graduate / Professional | 0 | 0.0% |
| Total | 202 | 100.0% |
School Enrollment by Age by Funding Source in Brilliant
Out of a total of 202 students who are enrolled in schools in Brilliant, 24 (11.9%) attend a private institution, while the remaining 178 (88.1%) are enrolled in public schools. The age group of 5 to 9 year old has the highest likelihood of being enrolled in private schools, with 24 (29.3% in the age bracket) enrolled. Conversely, the age group of 10 to 14 year olds has the lowest likelihood of being enrolled in a private school, with 66 (100.0% in the age bracket) attending a public institution.
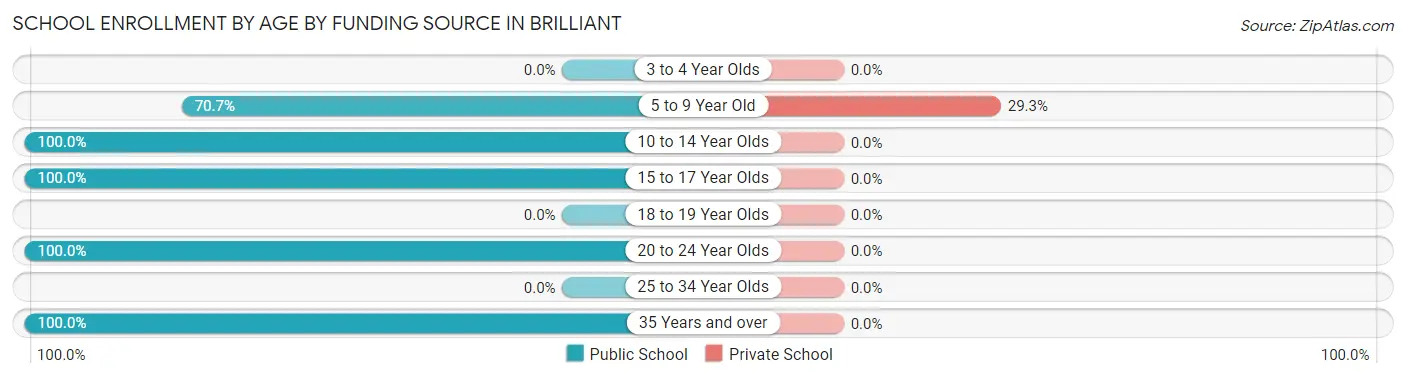
| Age Bracket | Public School | Private School |
| 3 to 4 Year Olds | 0 (0.0%) | 0 (0.0%) |
| 5 to 9 Year Old | 58 (70.7%) | 24 (29.3%) |
| 10 to 14 Year Olds | 66 (100.0%) | 0 (0.0%) |
| 15 to 17 Year Olds | 39 (100.0%) | 0 (0.0%) |
| 18 to 19 Year Olds | 0 (0.0%) | 0 (0.0%) |
| 20 to 24 Year Olds | 8 (100.0%) | 0 (0.0%) |
| 25 to 34 Year Olds | 0 (0.0%) | 0 (0.0%) |
| 35 Years and over | 7 (100.0%) | 0 (0.0%) |
| Total | 178 (88.1%) | 24 (11.9%) |
Educational Attainment by Field of Study in Brilliant
Communications (35 | 56.5%), and education (27 | 43.5%) are the most common fields of study among 62 individuals in Brilliant who have obtained a bachelor's degree or higher.
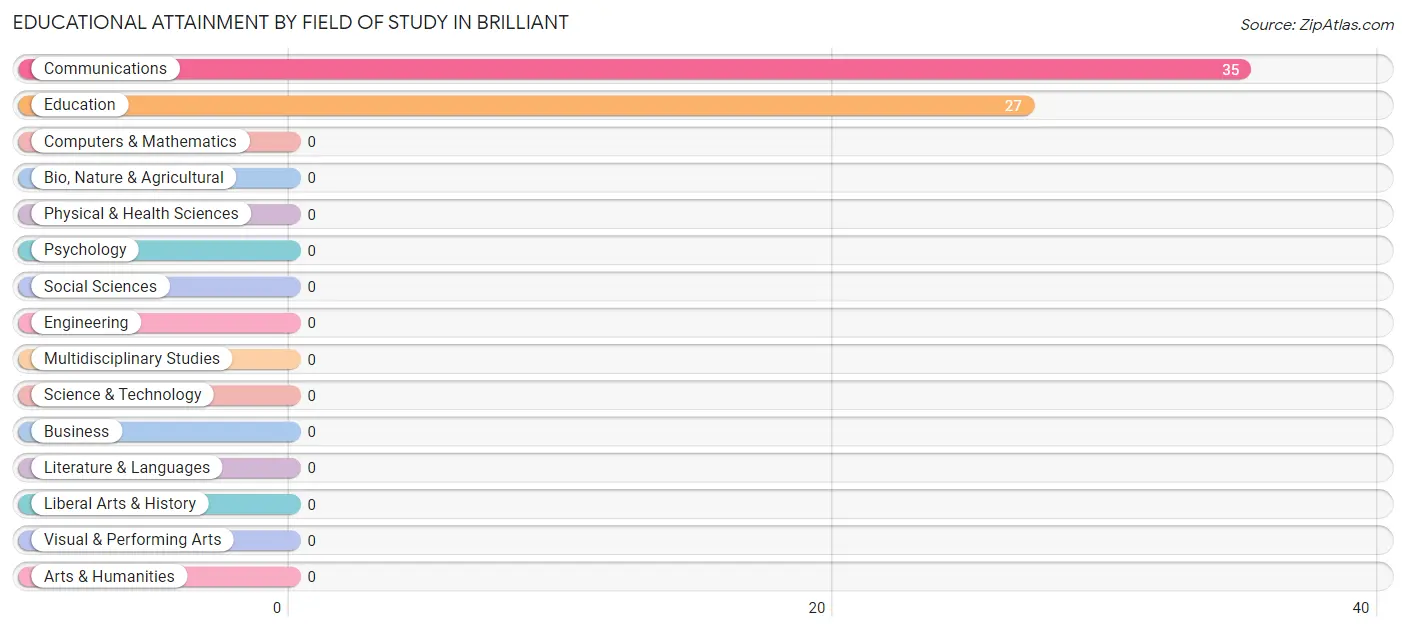
| Field of Study | # Graduates | % Graduates |
| Computers & Mathematics | 0 | 0.0% |
| Bio, Nature & Agricultural | 0 | 0.0% |
| Physical & Health Sciences | 0 | 0.0% |
| Psychology | 0 | 0.0% |
| Social Sciences | 0 | 0.0% |
| Engineering | 0 | 0.0% |
| Multidisciplinary Studies | 0 | 0.0% |
| Science & Technology | 0 | 0.0% |
| Business | 0 | 0.0% |
| Education | 27 | 43.5% |
| Literature & Languages | 0 | 0.0% |
| Liberal Arts & History | 0 | 0.0% |
| Visual & Performing Arts | 0 | 0.0% |
| Communications | 35 | 56.5% |
| Arts & Humanities | 0 | 0.0% |
| Total | 62 | 100.0% |
Transportation & Commute in Brilliant
Vehicle Availability by Sex in Brilliant
The most prevalent vehicle ownership categories in Brilliant are males with 2 vehicles (114, accounting for 42.5%) and females with 2 vehicles (121, making up 49.8%).
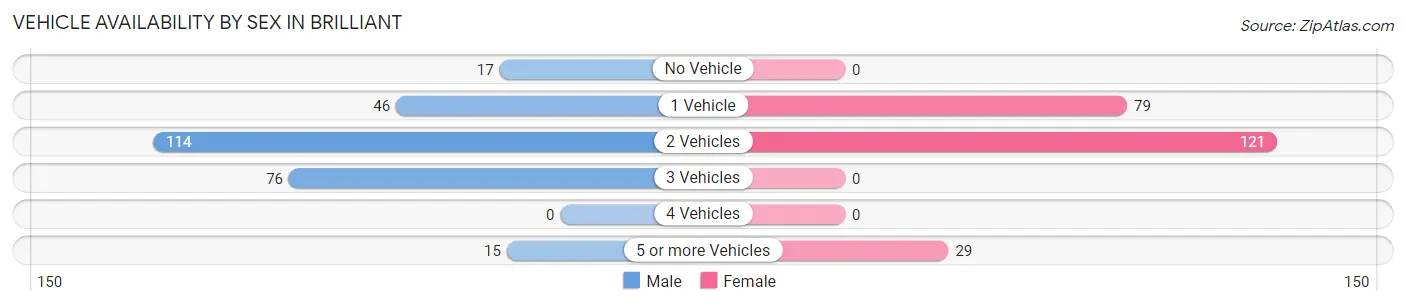
| Vehicles Available | Male | Female |
| No Vehicle | 17 (6.3%) | 0 (0.0%) |
| 1 Vehicle | 46 (17.2%) | 79 (34.5%) |
| 2 Vehicles | 114 (42.5%) | 121 (52.8%) |
| 3 Vehicles | 76 (28.4%) | 0 (0.0%) |
| 4 Vehicles | 0 (0.0%) | 0 (0.0%) |
| 5 or more Vehicles | 15 (5.6%) | 29 (12.7%) |
| Total | 268 (100.0%) | 229 (100.0%) |
Commute Time in Brilliant
The most frequently occuring commute durations in Brilliant are 15 to 19 minutes (101 commuters, 21.2%), less than 5 minutes (87 commuters, 18.3%), and 20 to 24 minutes (80 commuters, 16.8%).
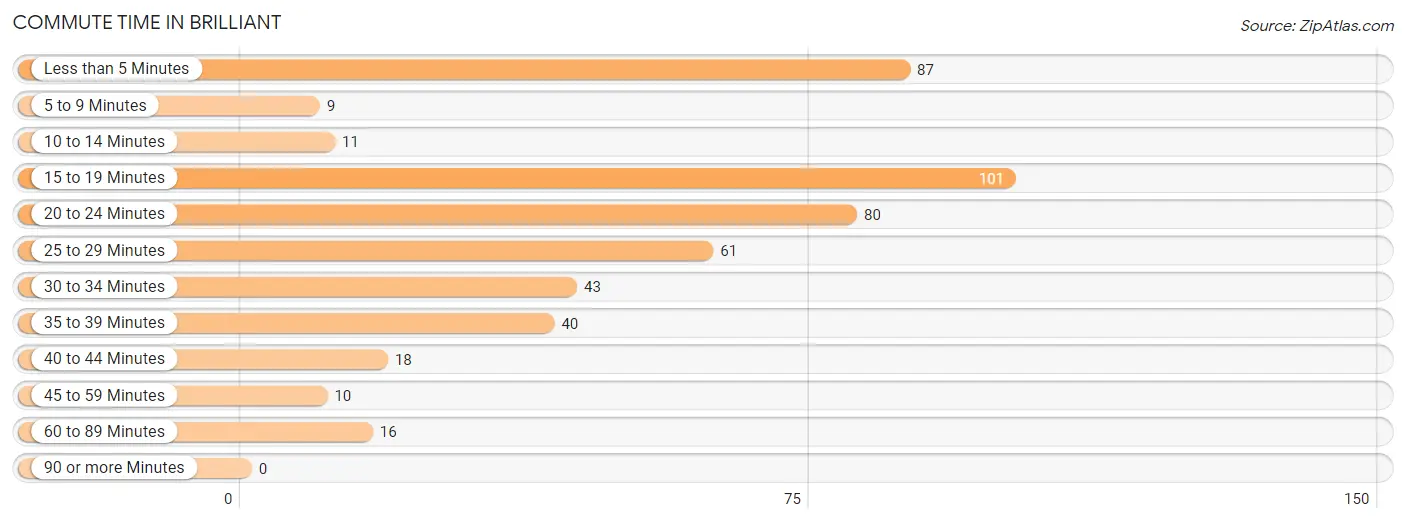
| Commute Time | # Commuters | % Commuters |
| Less than 5 Minutes | 87 | 18.3% |
| 5 to 9 Minutes | 9 | 1.9% |
| 10 to 14 Minutes | 11 | 2.3% |
| 15 to 19 Minutes | 101 | 21.2% |
| 20 to 24 Minutes | 80 | 16.8% |
| 25 to 29 Minutes | 61 | 12.8% |
| 30 to 34 Minutes | 43 | 9.0% |
| 35 to 39 Minutes | 40 | 8.4% |
| 40 to 44 Minutes | 18 | 3.8% |
| 45 to 59 Minutes | 10 | 2.1% |
| 60 to 89 Minutes | 16 | 3.4% |
| 90 or more Minutes | 0 | 0.0% |
Commute Time by Sex in Brilliant
The most common commute times in Brilliant are 15 to 19 minutes (59 commuters, 22.7%) for males and less than 5 minutes (49 commuters, 22.7%) for females.
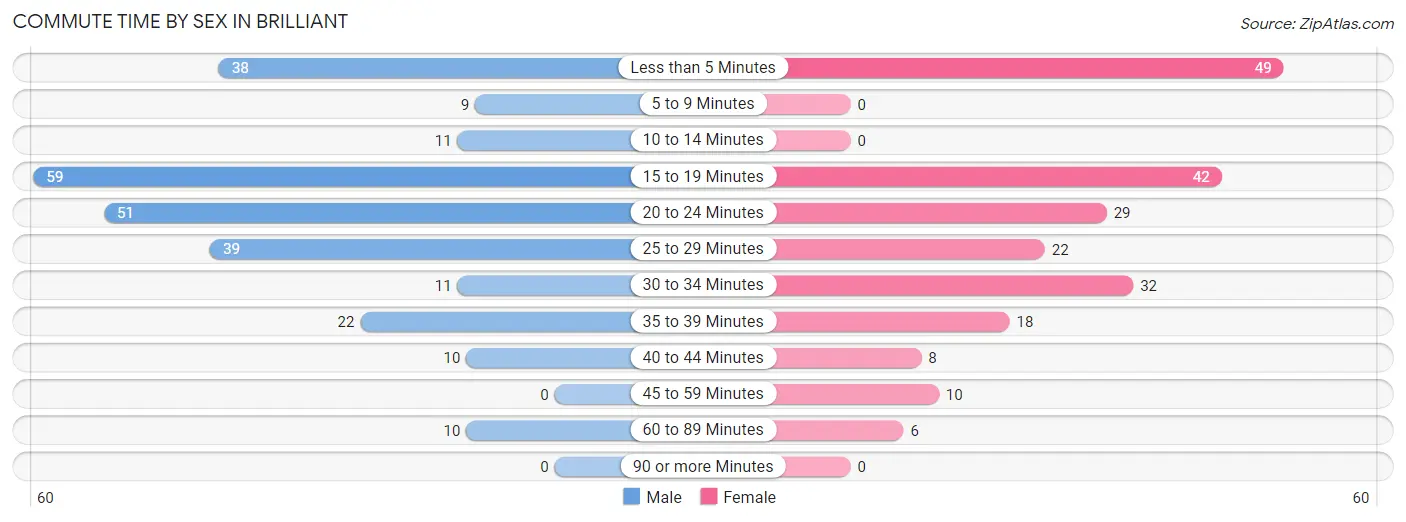
| Commute Time | Male | Female |
| Less than 5 Minutes | 38 (14.6%) | 49 (22.7%) |
| 5 to 9 Minutes | 9 (3.5%) | 0 (0.0%) |
| 10 to 14 Minutes | 11 (4.2%) | 0 (0.0%) |
| 15 to 19 Minutes | 59 (22.7%) | 42 (19.4%) |
| 20 to 24 Minutes | 51 (19.6%) | 29 (13.4%) |
| 25 to 29 Minutes | 39 (15.0%) | 22 (10.2%) |
| 30 to 34 Minutes | 11 (4.2%) | 32 (14.8%) |
| 35 to 39 Minutes | 22 (8.5%) | 18 (8.3%) |
| 40 to 44 Minutes | 10 (3.8%) | 8 (3.7%) |
| 45 to 59 Minutes | 0 (0.0%) | 10 (4.6%) |
| 60 to 89 Minutes | 10 (3.8%) | 6 (2.8%) |
| 90 or more Minutes | 0 (0.0%) | 0 (0.0%) |
Time of Departure to Work by Sex in Brilliant
The most frequent times of departure to work in Brilliant are 12:00 PM to 3:59 PM (70, 26.9%) for males and 7:30 AM to 7:59 AM (60, 27.8%) for females.
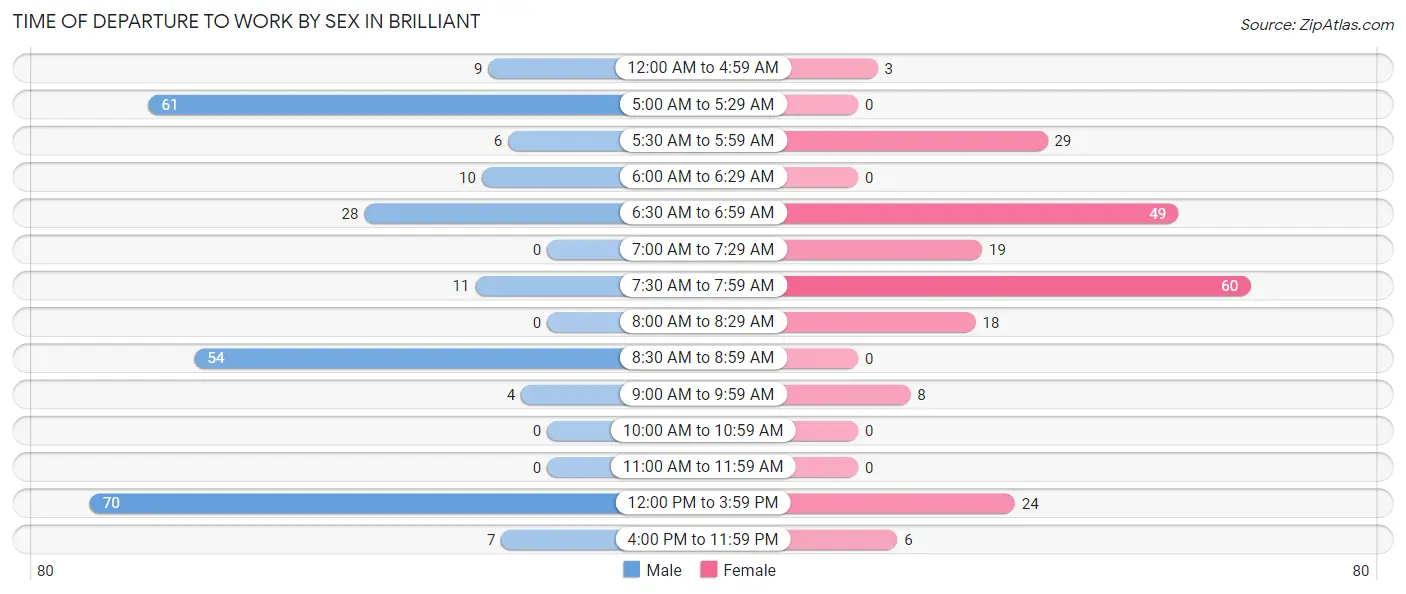
| Time of Departure | Male | Female |
| 12:00 AM to 4:59 AM | 9 (3.5%) | 3 (1.4%) |
| 5:00 AM to 5:29 AM | 61 (23.5%) | 0 (0.0%) |
| 5:30 AM to 5:59 AM | 6 (2.3%) | 29 (13.4%) |
| 6:00 AM to 6:29 AM | 10 (3.8%) | 0 (0.0%) |
| 6:30 AM to 6:59 AM | 28 (10.8%) | 49 (22.7%) |
| 7:00 AM to 7:29 AM | 0 (0.0%) | 19 (8.8%) |
| 7:30 AM to 7:59 AM | 11 (4.2%) | 60 (27.8%) |
| 8:00 AM to 8:29 AM | 0 (0.0%) | 18 (8.3%) |
| 8:30 AM to 8:59 AM | 54 (20.8%) | 0 (0.0%) |
| 9:00 AM to 9:59 AM | 4 (1.5%) | 8 (3.7%) |
| 10:00 AM to 10:59 AM | 0 (0.0%) | 0 (0.0%) |
| 11:00 AM to 11:59 AM | 0 (0.0%) | 0 (0.0%) |
| 12:00 PM to 3:59 PM | 70 (26.9%) | 24 (11.1%) |
| 4:00 PM to 11:59 PM | 7 (2.7%) | 6 (2.8%) |
| Total | 260 (100.0%) | 216 (100.0%) |
Housing Occupancy in Brilliant
Occupancy by Ownership in Brilliant
Of the total 450 dwellings in Brilliant, owner-occupied units account for 240 (53.3%), while renter-occupied units make up 210 (46.7%).
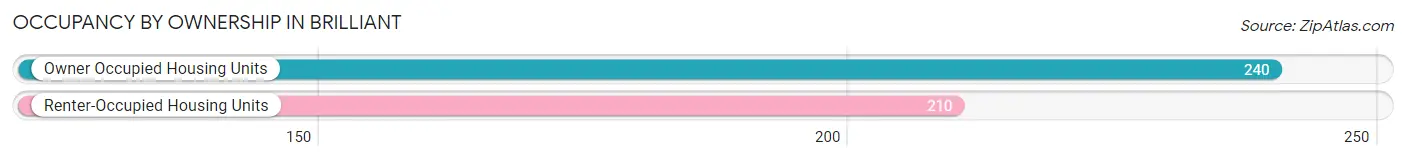
| Occupancy | # Housing Units | % Housing Units |
| Owner Occupied Housing Units | 240 | 53.3% |
| Renter-Occupied Housing Units | 210 | 46.7% |
| Total Occupied Housing Units | 450 | 100.0% |
Occupancy by Household Size in Brilliant
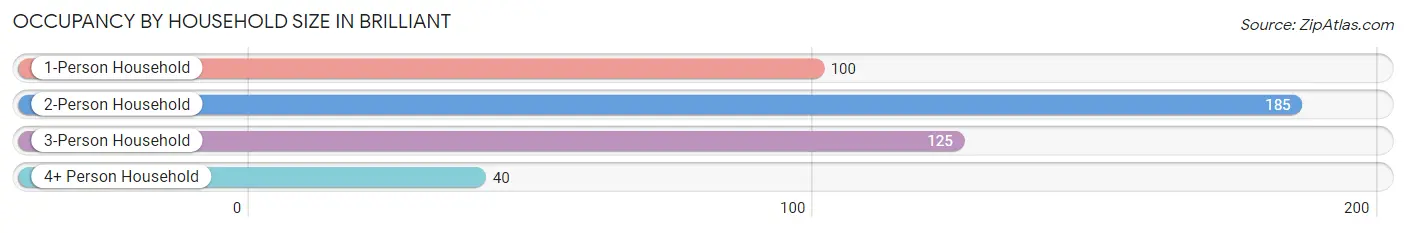
| Household Size | # Housing Units | % Housing Units |
| 1-Person Household | 100 | 22.2% |
| 2-Person Household | 185 | 41.1% |
| 3-Person Household | 125 | 27.8% |
| 4+ Person Household | 40 | 8.9% |
| Total Housing Units | 450 | 100.0% |
Occupancy by Ownership by Household Size in Brilliant
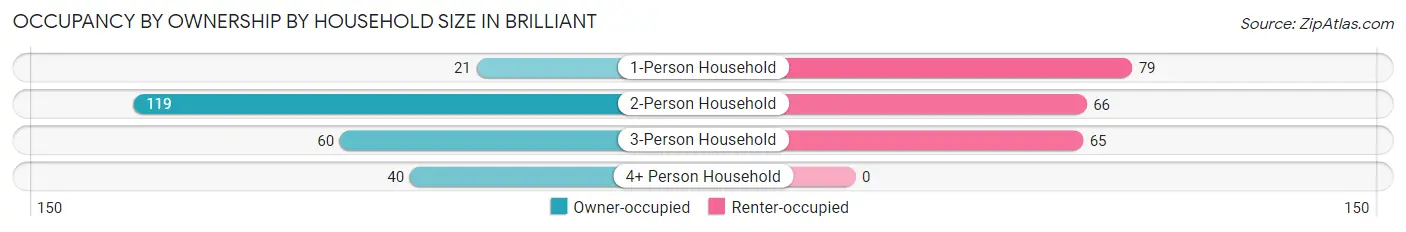
| Household Size | Owner-occupied | Renter-occupied |
| 1-Person Household | 21 (21.0%) | 79 (79.0%) |
| 2-Person Household | 119 (64.3%) | 66 (35.7%) |
| 3-Person Household | 60 (48.0%) | 65 (52.0%) |
| 4+ Person Household | 40 (100.0%) | 0 (0.0%) |
| Total Housing Units | 240 (53.3%) | 210 (46.7%) |
Occupancy by Educational Attainment in Brilliant
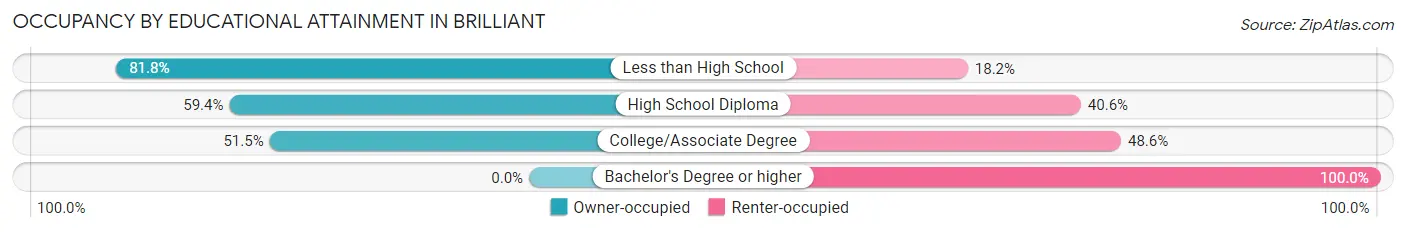
| Household Size | Owner-occupied | Renter-occupied |
| Less than High School | 9 (81.8%) | 2 (18.2%) |
| High School Diploma | 142 (59.4%) | 97 (40.6%) |
| College/Associate Degree | 89 (51.4%) | 84 (48.5%) |
| Bachelor's Degree or higher | 0 (0.0%) | 27 (100.0%) |
Occupancy by Age of Householder in Brilliant
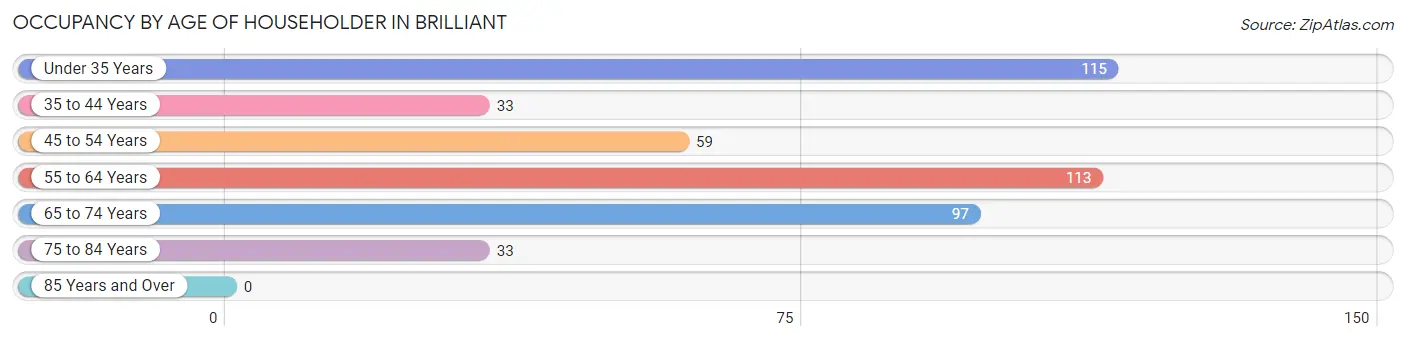
| Age Bracket | # Households | % Households |
| Under 35 Years | 115 | 25.6% |
| 35 to 44 Years | 33 | 7.3% |
| 45 to 54 Years | 59 | 13.1% |
| 55 to 64 Years | 113 | 25.1% |
| 65 to 74 Years | 97 | 21.6% |
| 75 to 84 Years | 33 | 7.3% |
| 85 Years and Over | 0 | 0.0% |
| Total | 450 | 100.0% |
Housing Finances in Brilliant
Median Income by Occupancy in Brilliant
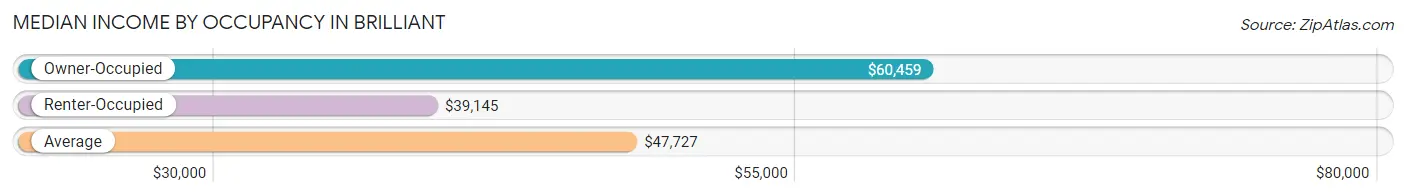
| Occupancy Type | # Households | Median Income |
| Owner-Occupied | 240 (53.3%) | $60,459 |
| Renter-Occupied | 210 (46.7%) | $39,145 |
| Average | 450 (100.0%) | $47,727 |
Occupancy by Householder Income Bracket in Brilliant
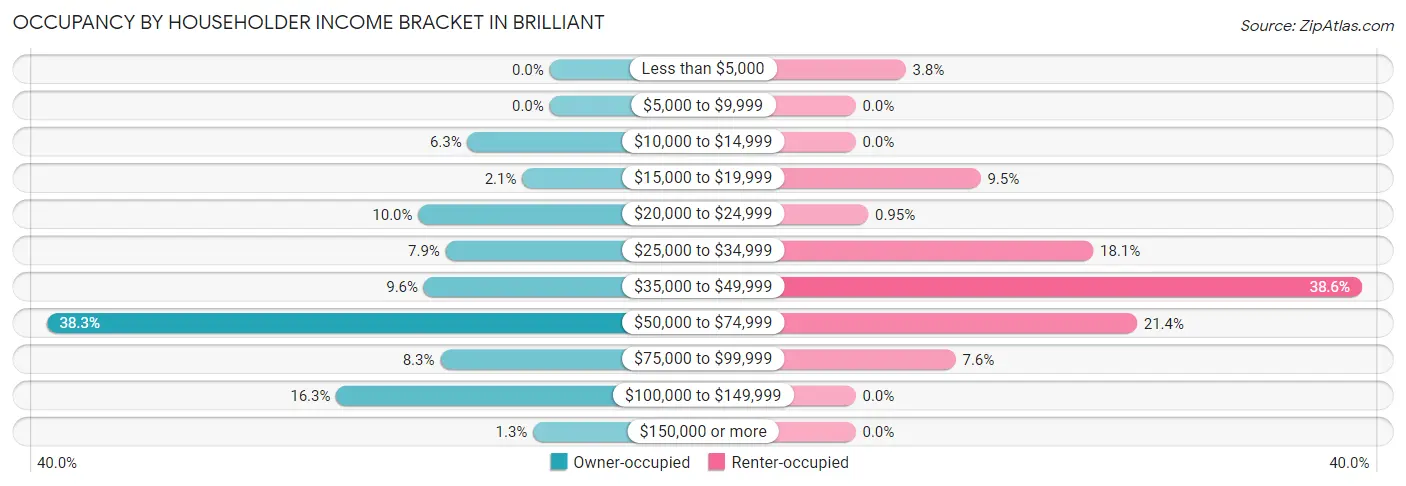
| Income Bracket | Owner-occupied | Renter-occupied |
| Less than $5,000 | 0 (0.0%) | 8 (3.8%) |
| $5,000 to $9,999 | 0 (0.0%) | 0 (0.0%) |
| $10,000 to $14,999 | 15 (6.2%) | 0 (0.0%) |
| $15,000 to $19,999 | 5 (2.1%) | 20 (9.5%) |
| $20,000 to $24,999 | 24 (10.0%) | 2 (0.9%) |
| $25,000 to $34,999 | 19 (7.9%) | 38 (18.1%) |
| $35,000 to $49,999 | 23 (9.6%) | 81 (38.6%) |
| $50,000 to $74,999 | 92 (38.3%) | 45 (21.4%) |
| $75,000 to $99,999 | 20 (8.3%) | 16 (7.6%) |
| $100,000 to $149,999 | 39 (16.3%) | 0 (0.0%) |
| $150,000 or more | 3 (1.3%) | 0 (0.0%) |
| Total | 240 (100.0%) | 210 (100.0%) |
Monthly Housing Cost Tiers in Brilliant
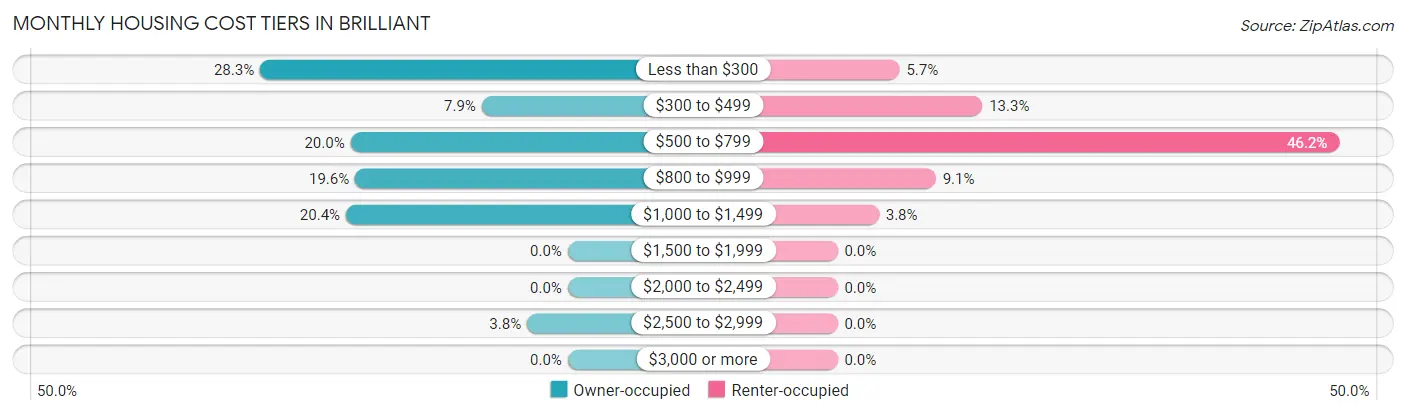
| Monthly Cost | Owner-occupied | Renter-occupied |
| Less than $300 | 68 (28.3%) | 12 (5.7%) |
| $300 to $499 | 19 (7.9%) | 28 (13.3%) |
| $500 to $799 | 48 (20.0%) | 97 (46.2%) |
| $800 to $999 | 47 (19.6%) | 19 (9.0%) |
| $1,000 to $1,499 | 49 (20.4%) | 8 (3.8%) |
| $1,500 to $1,999 | 0 (0.0%) | 0 (0.0%) |
| $2,000 to $2,499 | 0 (0.0%) | 0 (0.0%) |
| $2,500 to $2,999 | 9 (3.7%) | 0 (0.0%) |
| $3,000 or more | 0 (0.0%) | 0 (0.0%) |
| Total | 240 (100.0%) | 210 (100.0%) |
Physical Housing Characteristics in Brilliant
Housing Structures in Brilliant
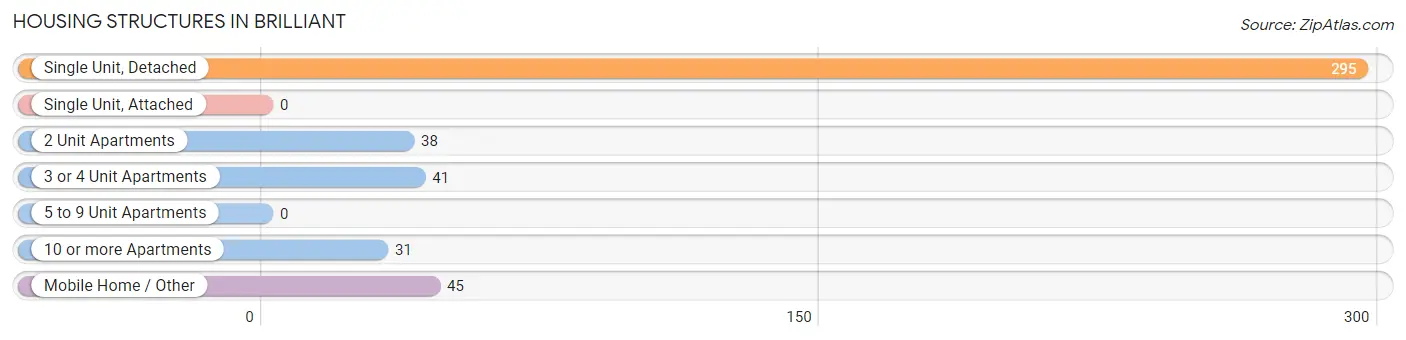
| Structure Type | # Housing Units | % Housing Units |
| Single Unit, Detached | 295 | 65.6% |
| Single Unit, Attached | 0 | 0.0% |
| 2 Unit Apartments | 38 | 8.4% |
| 3 or 4 Unit Apartments | 41 | 9.1% |
| 5 to 9 Unit Apartments | 0 | 0.0% |
| 10 or more Apartments | 31 | 6.9% |
| Mobile Home / Other | 45 | 10.0% |
| Total | 450 | 100.0% |
Housing Structures by Occupancy in Brilliant
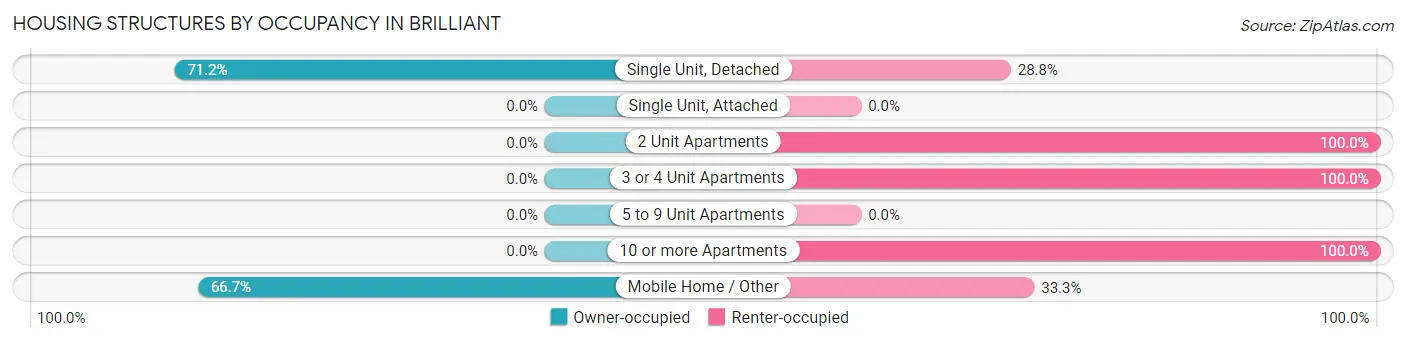
| Structure Type | Owner-occupied | Renter-occupied |
| Single Unit, Detached | 210 (71.2%) | 85 (28.8%) |
| Single Unit, Attached | 0 (0.0%) | 0 (0.0%) |
| 2 Unit Apartments | 0 (0.0%) | 38 (100.0%) |
| 3 or 4 Unit Apartments | 0 (0.0%) | 41 (100.0%) |
| 5 to 9 Unit Apartments | 0 (0.0%) | 0 (0.0%) |
| 10 or more Apartments | 0 (0.0%) | 31 (100.0%) |
| Mobile Home / Other | 30 (66.7%) | 15 (33.3%) |
| Total | 240 (53.3%) | 210 (46.7%) |
Housing Structures by Number of Rooms in Brilliant
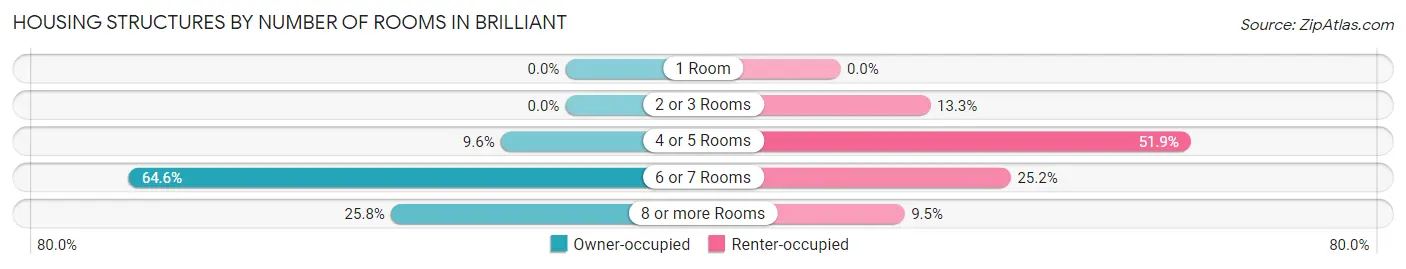
| Number of Rooms | Owner-occupied | Renter-occupied |
| 1 Room | 0 (0.0%) | 0 (0.0%) |
| 2 or 3 Rooms | 0 (0.0%) | 28 (13.3%) |
| 4 or 5 Rooms | 23 (9.6%) | 109 (51.9%) |
| 6 or 7 Rooms | 155 (64.6%) | 53 (25.2%) |
| 8 or more Rooms | 62 (25.8%) | 20 (9.5%) |
| Total | 240 (100.0%) | 210 (100.0%) |
Housing Structure by Heating Type in Brilliant
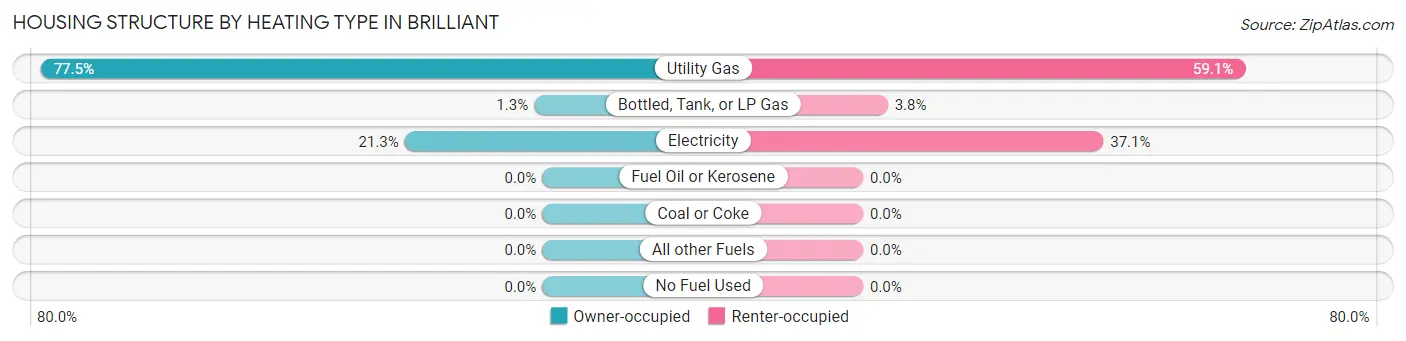
| Heating Type | Owner-occupied | Renter-occupied |
| Utility Gas | 186 (77.5%) | 124 (59.1%) |
| Bottled, Tank, or LP Gas | 3 (1.3%) | 8 (3.8%) |
| Electricity | 51 (21.2%) | 78 (37.1%) |
| Fuel Oil or Kerosene | 0 (0.0%) | 0 (0.0%) |
| Coal or Coke | 0 (0.0%) | 0 (0.0%) |
| All other Fuels | 0 (0.0%) | 0 (0.0%) |
| No Fuel Used | 0 (0.0%) | 0 (0.0%) |
| Total | 240 (100.0%) | 210 (100.0%) |
Household Vehicle Usage in Brilliant
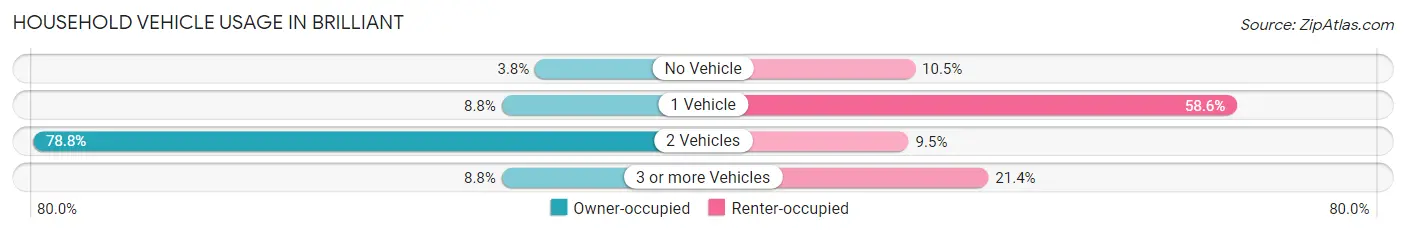
| Vehicles per Household | Owner-occupied | Renter-occupied |
| No Vehicle | 9 (3.7%) | 22 (10.5%) |
| 1 Vehicle | 21 (8.7%) | 123 (58.6%) |
| 2 Vehicles | 189 (78.7%) | 20 (9.5%) |
| 3 or more Vehicles | 21 (8.7%) | 45 (21.4%) |
| Total | 240 (100.0%) | 210 (100.0%) |
Real Estate & Mortgages in Brilliant
Real Estate and Mortgage Overview in Brilliant
| Characteristic | Without Mortgage | With Mortgage |
| Housing Units | 106 | 134 |
| Median Property Value | $43,100 | $89,400 |
| Median Household Income | $60,714 | $3 |
| Monthly Housing Costs | $287 | $0 |
| Real Estate Taxes | $335 | $0 |
Property Value by Mortgage Status in Brilliant
| Property Value | Without Mortgage | With Mortgage |
| Less than $50,000 | 87 (82.1%) | 17 (12.7%) |
| $50,000 to $99,999 | 19 (17.9%) | 63 (47.0%) |
| $100,000 to $299,999 | 0 (0.0%) | 54 (40.3%) |
| $300,000 to $499,999 | 0 (0.0%) | 0 (0.0%) |
| $500,000 to $749,999 | 0 (0.0%) | 0 (0.0%) |
| $750,000 to $999,999 | 0 (0.0%) | 0 (0.0%) |
| $1,000,000 or more | 0 (0.0%) | 0 (0.0%) |
| Total | 106 (100.0%) | 134 (100.0%) |
Household Income by Mortgage Status in Brilliant
| Household Income | Without Mortgage | With Mortgage |
| Less than $10,000 | 0 (0.0%) | 0 (0.0%) |
| $10,000 to $24,999 | 39 (36.8%) | 0 (0.0%) |
| $25,000 to $34,999 | 0 (0.0%) | 5 (3.7%) |
| $35,000 to $49,999 | 0 (0.0%) | 19 (14.2%) |
| $50,000 to $74,999 | 59 (55.7%) | 23 (17.2%) |
| $75,000 to $99,999 | 0 (0.0%) | 33 (24.6%) |
| $100,000 to $149,999 | 8 (7.5%) | 20 (14.9%) |
| $150,000 or more | 0 (0.0%) | 31 (23.1%) |
| Total | 106 (100.0%) | 134 (100.0%) |
Property Value to Household Income Ratio in Brilliant
| Value-to-Income Ratio | Without Mortgage | With Mortgage |
| Less than 2.0x | 97 (91.5%) | 56,538 (42,192.5%) |
| 2.0x to 2.9x | 0 (0.0%) | 104 (77.6%) |
| 3.0x to 3.9x | 0 (0.0%) | 18 (13.4%) |
| 4.0x or more | 9 (8.5%) | 12 (9.0%) |
| Total | 106 (100.0%) | 134 (100.0%) |
Real Estate Taxes by Mortgage Status in Brilliant
| Property Taxes | Without Mortgage | With Mortgage |
| Less than $800 | 100 (94.3%) | 0 (0.0%) |
| $800 to $1,499 | 0 (0.0%) | 65 (48.5%) |
| $800 to $1,499 | 0 (0.0%) | 57 (42.5%) |
| Total | 106 (100.0%) | 134 (100.0%) |
Health & Disability in Brilliant
Health Insurance Coverage by Age in Brilliant
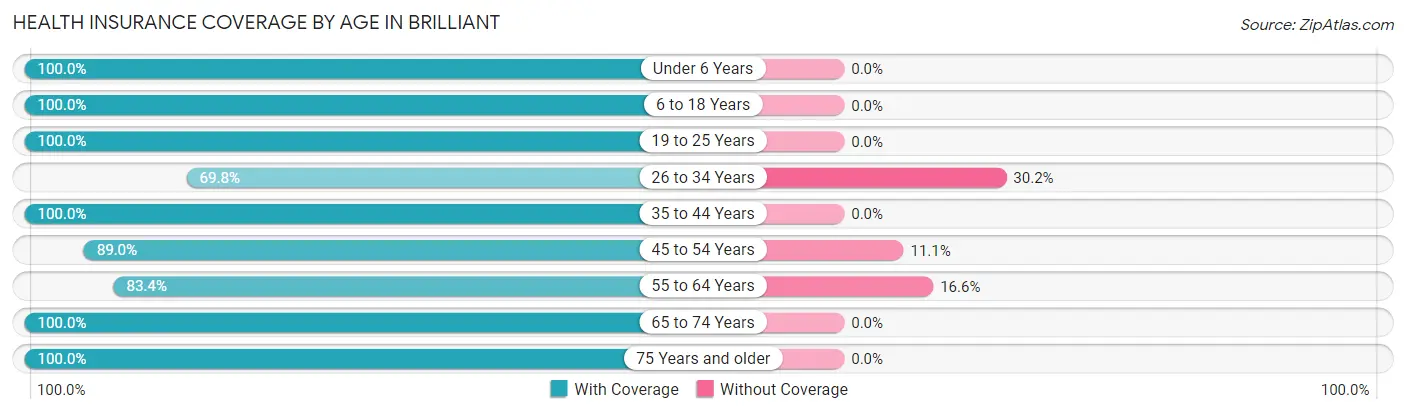
| Age Bracket | With Coverage | Without Coverage |
| Under 6 Years | 24 (100.0%) | 0 (0.0%) |
| 6 to 18 Years | 177 (100.0%) | 0 (0.0%) |
| 19 to 25 Years | 89 (100.0%) | 0 (0.0%) |
| 26 to 34 Years | 120 (69.8%) | 52 (30.2%) |
| 35 to 44 Years | 51 (100.0%) | 0 (0.0%) |
| 45 to 54 Years | 153 (88.9%) | 19 (11.1%) |
| 55 to 64 Years | 171 (83.4%) | 34 (16.6%) |
| 65 to 74 Years | 121 (100.0%) | 0 (0.0%) |
| 75 Years and older | 57 (100.0%) | 0 (0.0%) |
| Total | 963 (90.2%) | 105 (9.8%) |
Health Insurance Coverage by Citizenship Status in Brilliant
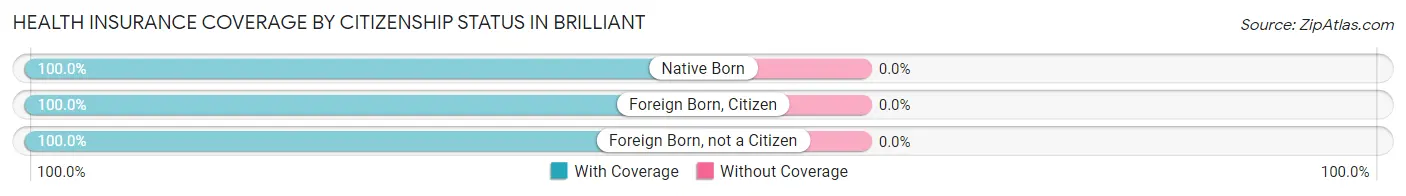
| Citizenship Status | With Coverage | Without Coverage |
| Native Born | 24 (100.0%) | 0 (0.0%) |
| Foreign Born, Citizen | 177 (100.0%) | 0 (0.0%) |
| Foreign Born, not a Citizen | 89 (100.0%) | 0 (0.0%) |
Health Insurance Coverage by Household Income in Brilliant
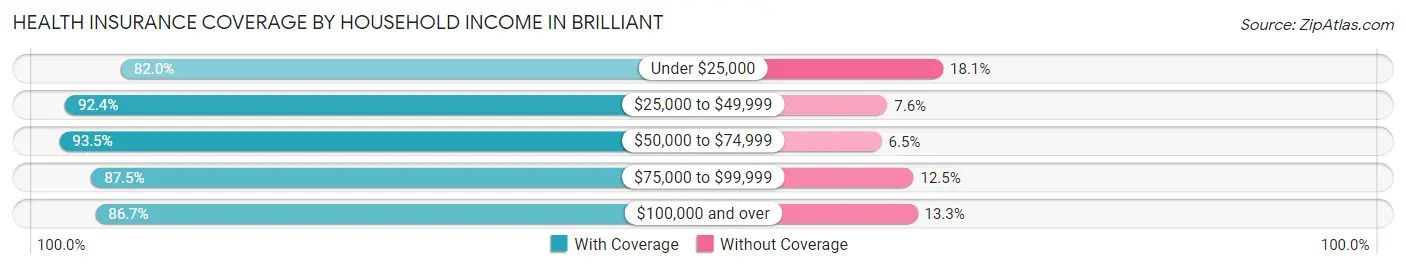
| Household Income | With Coverage | Without Coverage |
| Under $25,000 | 109 (82.0%) | 24 (18.0%) |
| $25,000 to $49,999 | 304 (92.4%) | 25 (7.6%) |
| $50,000 to $74,999 | 330 (93.5%) | 23 (6.5%) |
| $75,000 to $99,999 | 63 (87.5%) | 9 (12.5%) |
| $100,000 and over | 157 (86.7%) | 24 (13.3%) |
Public vs Private Health Insurance Coverage by Age in Brilliant
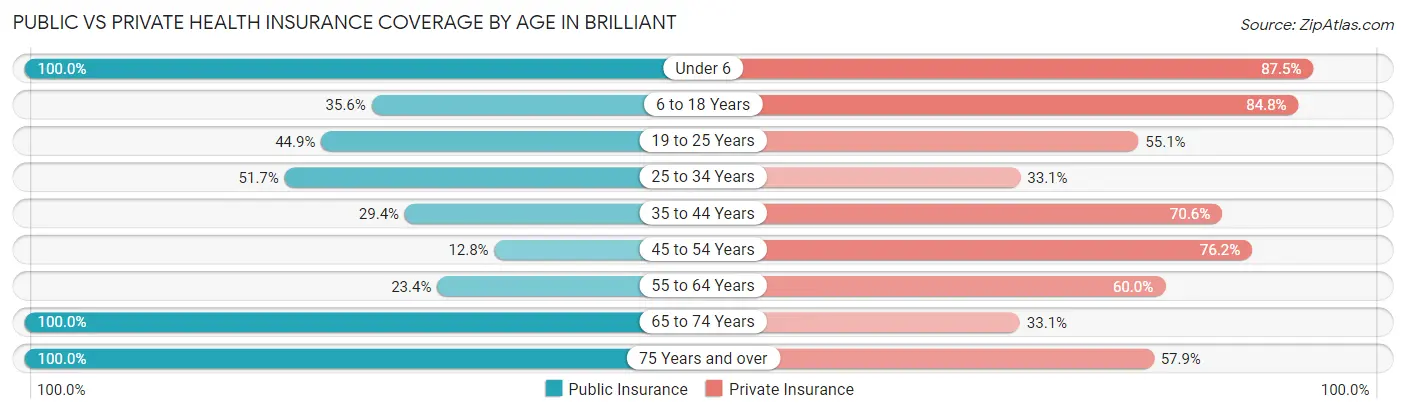
| Age Bracket | Public Insurance | Private Insurance |
| Under 6 | 24 (100.0%) | 21 (87.5%) |
| 6 to 18 Years | 63 (35.6%) | 150 (84.8%) |
| 19 to 25 Years | 40 (44.9%) | 49 (55.1%) |
| 25 to 34 Years | 89 (51.7%) | 57 (33.1%) |
| 35 to 44 Years | 15 (29.4%) | 36 (70.6%) |
| 45 to 54 Years | 22 (12.8%) | 131 (76.2%) |
| 55 to 64 Years | 48 (23.4%) | 123 (60.0%) |
| 65 to 74 Years | 121 (100.0%) | 40 (33.1%) |
| 75 Years and over | 57 (100.0%) | 33 (57.9%) |
| Total | 479 (44.9%) | 640 (59.9%) |
Disability Status by Sex by Age in Brilliant
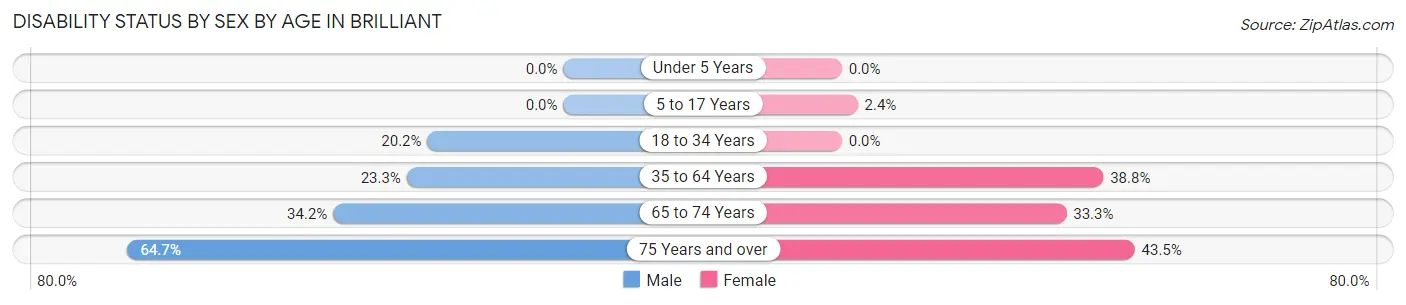
| Age Bracket | Male | Female |
| Under 5 Years | 0 (0.0%) | 0 (0.0%) |
| 5 to 17 Years | 0 (0.0%) | 2 (2.4%) |
| 18 to 34 Years | 21 (20.2%) | 0 (0.0%) |
| 35 to 64 Years | 60 (23.3%) | 66 (38.8%) |
| 65 to 74 Years | 27 (34.2%) | 14 (33.3%) |
| 75 Years and over | 22 (64.7%) | 10 (43.5%) |
Disability Class by Sex by Age in Brilliant
Disability Class: Hearing Difficulty
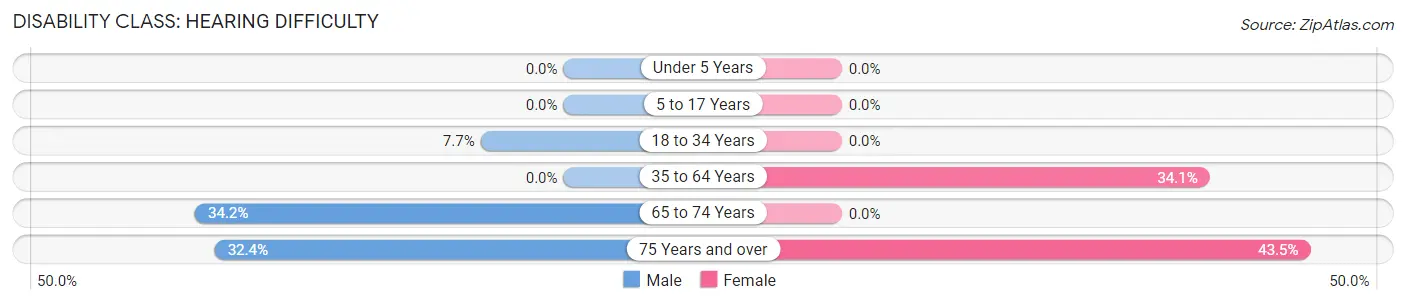
| Age Bracket | Male | Female |
| Under 5 Years | 0 (0.0%) | 0 (0.0%) |
| 5 to 17 Years | 0 (0.0%) | 0 (0.0%) |
| 18 to 34 Years | 8 (7.7%) | 0 (0.0%) |
| 35 to 64 Years | 0 (0.0%) | 58 (34.1%) |
| 65 to 74 Years | 27 (34.2%) | 0 (0.0%) |
| 75 Years and over | 11 (32.4%) | 10 (43.5%) |
Disability Class: Vision Difficulty
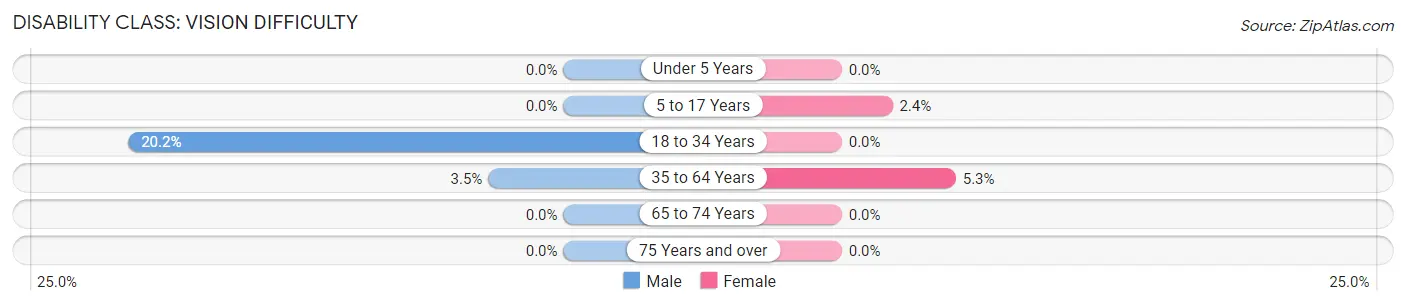
| Age Bracket | Male | Female |
| Under 5 Years | 0 (0.0%) | 0 (0.0%) |
| 5 to 17 Years | 0 (0.0%) | 2 (2.4%) |
| 18 to 34 Years | 21 (20.2%) | 0 (0.0%) |
| 35 to 64 Years | 9 (3.5%) | 9 (5.3%) |
| 65 to 74 Years | 0 (0.0%) | 0 (0.0%) |
| 75 Years and over | 0 (0.0%) | 0 (0.0%) |
Disability Class: Cognitive Difficulty
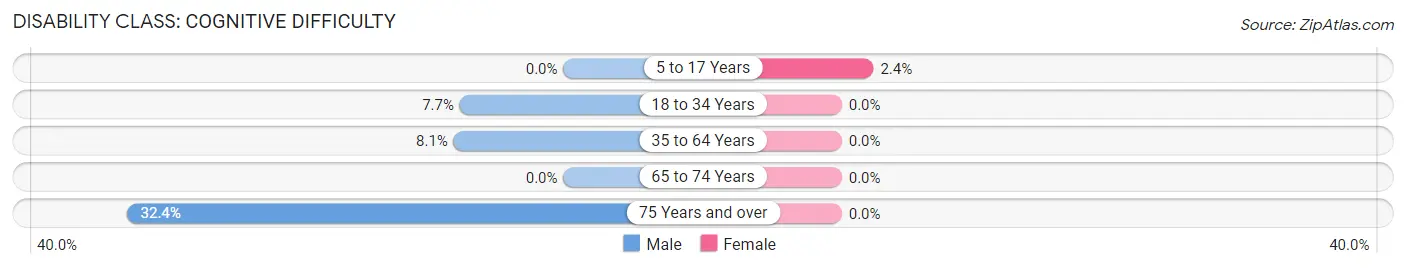
| Age Bracket | Male | Female |
| 5 to 17 Years | 0 (0.0%) | 2 (2.4%) |
| 18 to 34 Years | 8 (7.7%) | 0 (0.0%) |
| 35 to 64 Years | 21 (8.1%) | 0 (0.0%) |
| 65 to 74 Years | 0 (0.0%) | 0 (0.0%) |
| 75 Years and over | 11 (32.4%) | 0 (0.0%) |
Disability Class: Ambulatory Difficulty
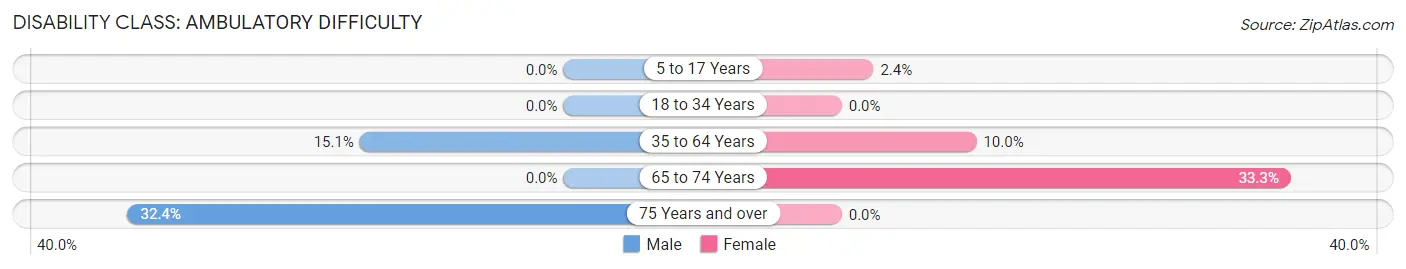
| Age Bracket | Male | Female |
| 5 to 17 Years | 0 (0.0%) | 2 (2.4%) |
| 18 to 34 Years | 0 (0.0%) | 0 (0.0%) |
| 35 to 64 Years | 39 (15.1%) | 17 (10.0%) |
| 65 to 74 Years | 0 (0.0%) | 14 (33.3%) |
| 75 Years and over | 11 (32.4%) | 0 (0.0%) |
Disability Class: Self-Care Difficulty
| Age Bracket | Male | Female |
| 5 to 17 Years | 0 (0.0%) | 0 (0.0%) |
| 18 to 34 Years | 0 (0.0%) | 0 (0.0%) |
| 35 to 64 Years | 0 (0.0%) | 0 (0.0%) |
| 65 to 74 Years | 0 (0.0%) | 0 (0.0%) |
| 75 Years and over | 0 (0.0%) | 0 (0.0%) |
Technology Access in Brilliant
Computing Device Access in Brilliant
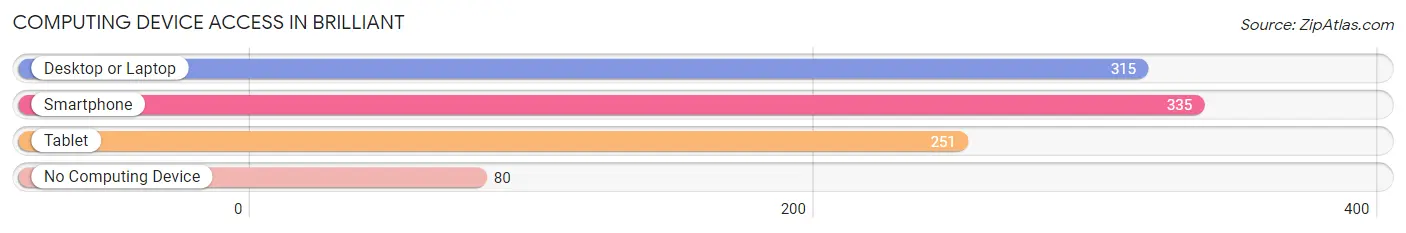
| Device Type | # Households | % Households |
| Desktop or Laptop | 315 | 70.0% |
| Smartphone | 335 | 74.4% |
| Tablet | 251 | 55.8% |
| No Computing Device | 80 | 17.8% |
| Total | 450 | 100.0% |
Internet Access in Brilliant
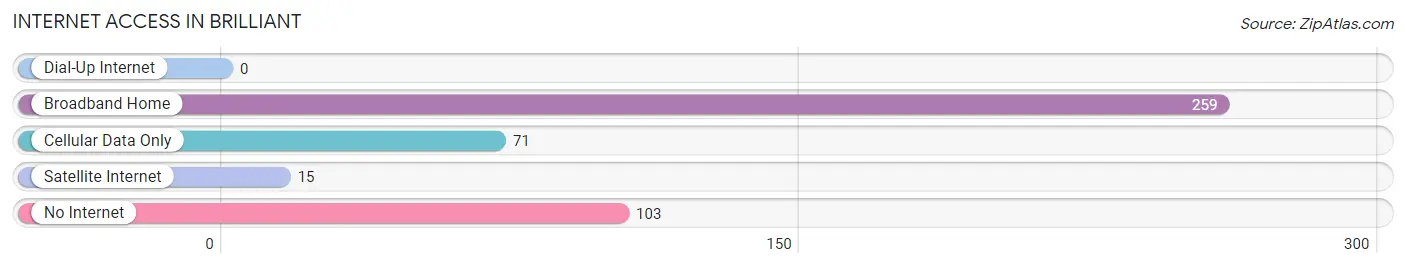
| Internet Type | # Households | % Households |
| Dial-Up Internet | 0 | 0.0% |
| Broadband Home | 259 | 57.6% |
| Cellular Data Only | 71 | 15.8% |
| Satellite Internet | 15 | 3.3% |
| No Internet | 103 | 22.9% |
| Total | 450 | 100.0% |
Brilliant Summary
Ohio is a state located in the Midwestern United States. It is the 34th largest state in the United States by area and the 7th most populous state. Ohio is bordered by Lake Erie to the north, Pennsylvania to the east, West Virginia to the southeast, Kentucky to the southwest, and Indiana to the west. Ohio is known as the “Buckeye State” due to the prevalence of Buckeye trees in the state.
History
Ohio was first inhabited by Native American tribes such as the Shawnee, Miami, and Iroquois. The first European settlers arrived in the late 17th century, and the area was ceded to the United States in the Treaty of Paris in 1783. Ohio was admitted to the Union as the 17th state in 1803.
During the 19th century, Ohio was a major center of immigration, with many German, Irish, and Italian immigrants settling in the state. Ohio was also a major center of industry, with the steel industry in particular playing a major role in the state’s economy.
In the 20th century, Ohio was a major battleground in the labor movement, with the Ohio River Valley becoming a major center of labor unrest. The state also played a major role in the civil rights movement, with the city of Cleveland becoming a major center of the movement.
Geography
Ohio is located in the Midwestern United States. It is bordered by Lake Erie to the north, Pennsylvania to the east, West Virginia to the southeast, Kentucky to the southwest, and Indiana to the west. Ohio is the 34th largest state in the United States by area, with an area of 44,825 square miles.
The state is divided into 88 counties, with the capital being Columbus. Ohio is home to several major cities, including Cleveland, Cincinnati, Toledo, Akron, and Dayton. The state is also home to several major rivers, including the Ohio River, the Cuyahoga River, and the Scioto River.
Economy
Ohio has a diverse economy, with a variety of industries contributing to the state’s economic output. The state’s largest industries include manufacturing, finance, insurance, real estate, and health care.
The state’s manufacturing sector is particularly important, with Ohio being a major center of the automotive industry. Ohio is also a major center of the steel industry, with the steel industry contributing significantly to the state’s economy.
The state’s agricultural sector is also important, with Ohio being a major producer of corn, soybeans, and wheat. The state is also a major producer of dairy products, eggs, and poultry.
Demographics
As of 2019, the population of Ohio was 11,689,100, making it the 7th most populous state in the United States. The state’s population is largely white, with 82.2% of the population identifying as white. The state’s African American population is 12.3%, while the Hispanic population is 4.2%.
The state’s median household income is $54,021, while the median home value is $164,400. The state’s poverty rate is 13.2%, with the majority of the state’s poor population living in urban areas.
Conclusion
Ohio is a state located in the Midwestern United States. It is the 34th largest state in the United States by area and the 7th most populous state. Ohio is bordered by Lake Erie to the north, Pennsylvania to the east, West Virginia to the southeast, Kentucky to the southwest, and Indiana to the west. Ohio is known as the “Buckeye State” due to the prevalence of Buckeye trees in the state.
Ohio has a diverse economy, with a variety of industries contributing to the state’s economic output. The state’s population is largely white, with 82.2% of the population identifying as white. The state’s median household income is $54,021, while the median home value is $164,400. The state’s poverty rate is 13.2%, with the majority of the state’s poor population living in urban areas.
Common Questions
What is Per Capita Income in Brilliant?
Per Capita income in Brilliant is $23,759.
What is the Median Family Income in Brilliant?
Median Family Income in Brilliant is $56,346.
What is the Median Household income in Brilliant?
Median Household Income in Brilliant is $47,727.
What is Income or Wage Gap in Brilliant?
Income or Wage Gap in Brilliant is 48.4%.
Women in Brilliant earn 51.6 cents for every dollar earned by a man.
What is Inequality or Gini Index in Brilliant?
Inequality or Gini Index in Brilliant is 0.31.
What is the Total Population of Brilliant?
Total Population of Brilliant is 1,068.
What is the Total Male Population of Brilliant?
Total Male Population of Brilliant is 591.
What is the Total Female Population of Brilliant?
Total Female Population of Brilliant is 477.
What is the Ratio of Males per 100 Females in Brilliant?
There are 123.90 Males per 100 Females in Brilliant.
What is the Ratio of Females per 100 Males in Brilliant?
There are 80.71 Females per 100 Males in Brilliant.
What is the Median Population Age in Brilliant?
Median Population Age in Brilliant is 45.8 Years.
What is the Average Family Size in Brilliant
Average Family Size in Brilliant is 2.6 People.
What is the Average Household Size in Brilliant
Average Household Size in Brilliant is 2.4 People.
How Large is the Labor Force in Brilliant?
There are 531 People in the Labor Forcein in Brilliant.
What is the Percentage of People in the Labor Force in Brilliant?
59.6% of People are in the Labor Force in Brilliant.
What is the Unemployment Rate in Brilliant?
Unemployment Rate in Brilliant is 4.0%.