Hope, AK Map & Demographics
Hope Map
Hope Overview
$23,968
PER CAPITA INCOME
$136,944
AVG FAMILY INCOME
0.58
INEQUALITY / GINI INDEX
133
TOTAL POPULATION
59
MALE POPULATION
74
FEMALE POPULATION
79.73
MALES / 100 FEMALES
125.42
FEMALES / 100 MALES
39.4
MEDIAN AGE
4.2
AVG FAMILY SIZE
2.7
AVG HOUSEHOLD SIZE
71
LABOR FORCE [ PEOPLE ]
79.8%
PERCENT IN LABOR FORCE
32.4%
UNEMPLOYMENT RATE
Hope Zip Codes
Hope Area Codes
Income in Hope
Income Overview in Hope
| Characteristic | Number | Measure |
| Per Capita Income | 133 | $23,968 |
| Median Family Income | 26 | $136,944 |
| Mean Family Income | 26 | $112,335 |
| Median Household Income | 49 | $0 |
| Mean Household Income | 49 | $60,165 |
| Income Deficit | 26 | $0 |
| Wage / Income Gap (%) | 133 | 0.00% |
| Wage / Income Gap ($) | 133 | 100.00¢ per $1 |
| Gini / Inequality Index | 133 | 0.58 |
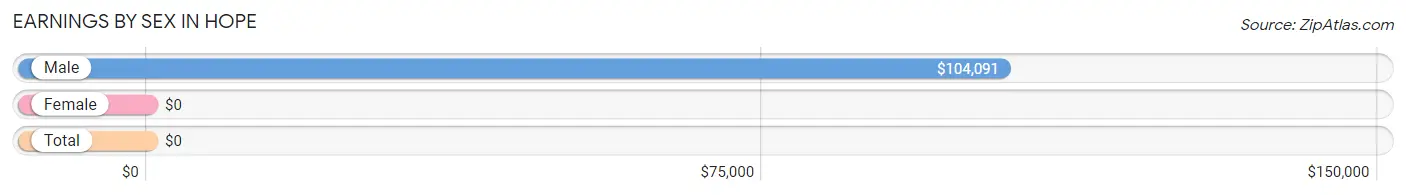
Earnings by Sex in Hope
| Sex | Number | Average Earnings |
| Male | 30 (62.5%) | $104,091 |
| Female | 18 (37.5%) | $0 |
| Total | 48 (100.0%) | $0 |
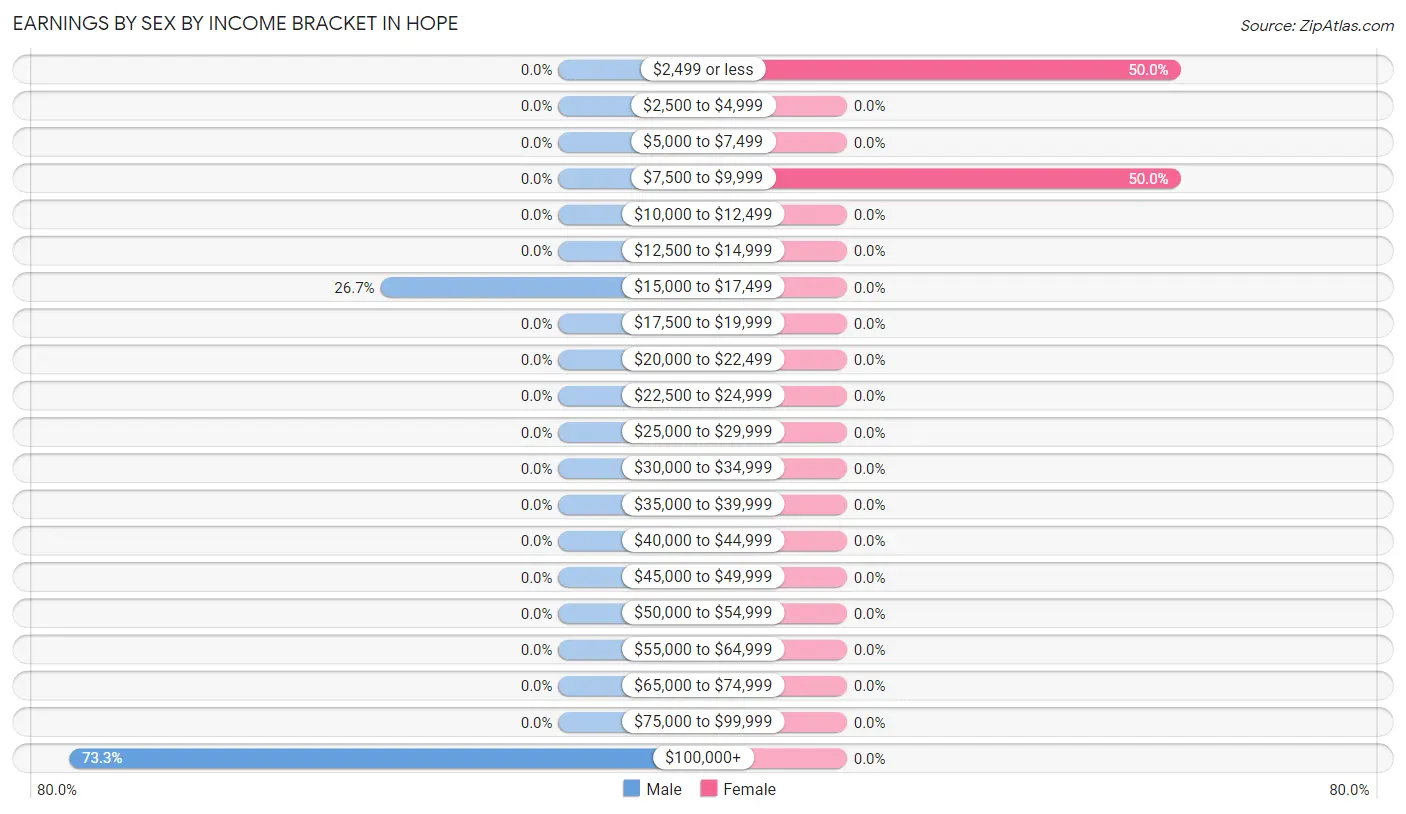
Earnings by Sex by Income Bracket in Hope
The most common earnings brackets in Hope are $100,000+ for men (22 | 73.3%) and $2,499 or less for women (9 | 50.0%).
| Income | Male | Female |
| $2,499 or less | 0 (0.0%) | 9 (50.0%) |
| $2,500 to $4,999 | 0 (0.0%) | 0 (0.0%) |
| $5,000 to $7,499 | 0 (0.0%) | 0 (0.0%) |
| $7,500 to $9,999 | 0 (0.0%) | 9 (50.0%) |
| $10,000 to $12,499 | 0 (0.0%) | 0 (0.0%) |
| $12,500 to $14,999 | 0 (0.0%) | 0 (0.0%) |
| $15,000 to $17,499 | 8 (26.7%) | 0 (0.0%) |
| $17,500 to $19,999 | 0 (0.0%) | 0 (0.0%) |
| $20,000 to $22,499 | 0 (0.0%) | 0 (0.0%) |
| $22,500 to $24,999 | 0 (0.0%) | 0 (0.0%) |
| $25,000 to $29,999 | 0 (0.0%) | 0 (0.0%) |
| $30,000 to $34,999 | 0 (0.0%) | 0 (0.0%) |
| $35,000 to $39,999 | 0 (0.0%) | 0 (0.0%) |
| $40,000 to $44,999 | 0 (0.0%) | 0 (0.0%) |
| $45,000 to $49,999 | 0 (0.0%) | 0 (0.0%) |
| $50,000 to $54,999 | 0 (0.0%) | 0 (0.0%) |
| $55,000 to $64,999 | 0 (0.0%) | 0 (0.0%) |
| $65,000 to $74,999 | 0 (0.0%) | 0 (0.0%) |
| $75,000 to $99,999 | 0 (0.0%) | 0 (0.0%) |
| $100,000+ | 22 (73.3%) | 0 (0.0%) |
| Total | 30 (100.0%) | 18 (100.0%) |
Earnings by Sex by Educational Attainment in Hope
| Educational Attainment | Male Income | Female Income |
| Less than High School | - | - |
| High School Diploma | - | - |
| College or Associate's Degree | - | - |
| Bachelor's Degree | - | - |
| Graduate Degree | - | - |
| Total | $104,091 | $0 |
Family Income in Hope
Family Income Brackets in Hope
According to the Hope family income data, there are 20 families falling into the $100,000 to $149,999 income range, which is the most common income bracket and makes up 76.9% of all families.
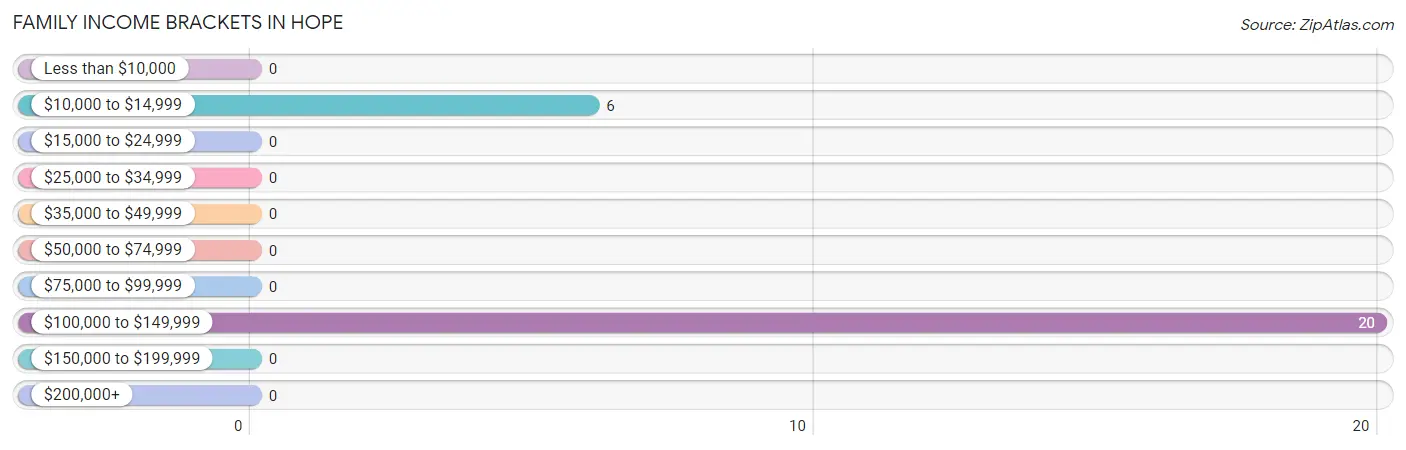
| Income Bracket | # Families | % Families |
| Less than $10,000 | 0 | 0.0% |
| $10,000 to $14,999 | 6 | 23.1% |
| $15,000 to $24,999 | 0 | 0.0% |
| $25,000 to $34,999 | 0 | 0.0% |
| $35,000 to $49,999 | 0 | 0.0% |
| $50,000 to $74,999 | 0 | 0.0% |
| $75,000 to $99,999 | 0 | 0.0% |
| $100,000 to $149,999 | 20 | 76.9% |
| $150,000 to $199,999 | 0 | 0.0% |
| $200,000+ | 0 | 0.0% |
Family Income by Famaliy Size in Hope
| Income Bracket | # Families | Median Income |
| 2-Person Families | 11 (42.3%) | $0 |
| 3-Person Families | 9 (34.6%) | $0 |
| 4-Person Families | 6 (23.1%) | $0 |
| 5-Person Families | 0 (0.0%) | $0 |
| 6-Person Families | 0 (0.0%) | $0 |
| 7+ Person Families | 0 (0.0%) | $0 |
| Total | 26 (100.0%) | $136,944 |
Family Income by Number of Earners in Hope
| Number of Earners | # Families | Median Income |
| No Earners | 0 (0.0%) | $0 |
| 1 Earner | 17 (65.4%) | $0 |
| 2 Earners | 0 (0.0%) | $0 |
| 3+ Earners | 9 (34.6%) | $0 |
| Total | 26 (100.0%) | $136,944 |
Household Income in Hope
Household Income Brackets in Hope
With 23 households falling in the category, the less than $10,000 income range is the most frequent in Hope, accounting for 46.9% of all households.
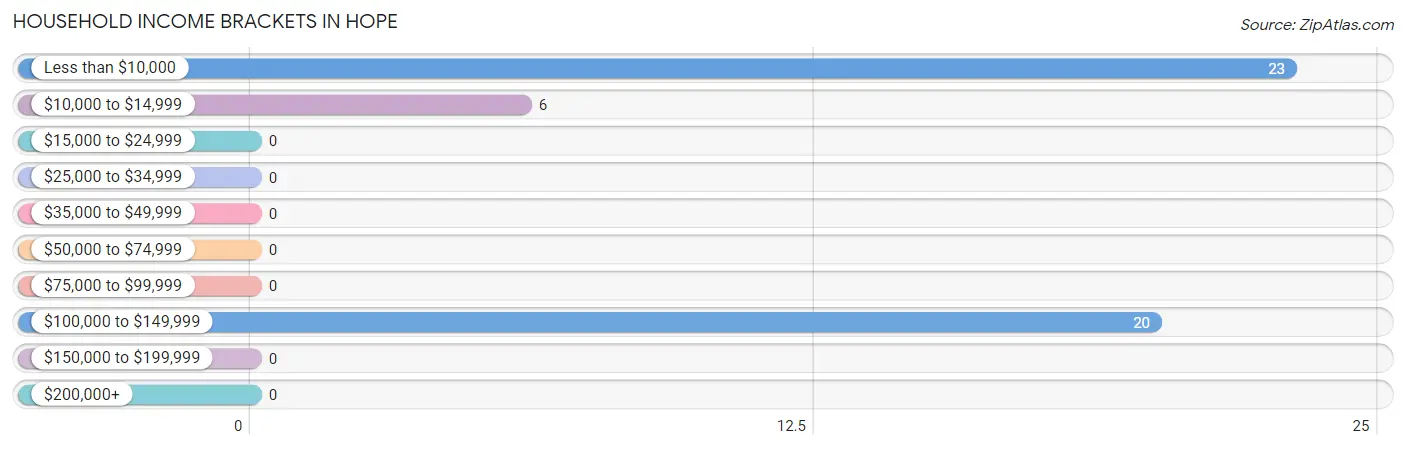
| Income Bracket | # Households | % Households |
| Less than $10,000 | 23 | 46.9% |
| $10,000 to $14,999 | 6 | 12.2% |
| $15,000 to $24,999 | 0 | 0.0% |
| $25,000 to $34,999 | 0 | 0.0% |
| $35,000 to $49,999 | 0 | 0.0% |
| $50,000 to $74,999 | 0 | 0.0% |
| $75,000 to $99,999 | 0 | 0.0% |
| $100,000 to $149,999 | 20 | 40.8% |
| $150,000 to $199,999 | 0 | 0.0% |
| $200,000+ | 0 | 0.0% |
Household Income by Householder Age in Hope
| Income Bracket | # Households | Median Income |
| 15 to 24 Years | 0 (0.0%) | $0 |
| 25 to 44 Years | 15 (30.6%) | $0 |
| 45 to 64 Years | 34 (69.4%) | $0 |
| 65+ Years | 0 (0.0%) | $0 |
| Total | 49 (100.0%) | $0 |
Poverty in Hope
Income Below Poverty by Sex and Age in Hope
With 49.1% poverty level for males and 71.6% for females among the residents of Hope, 45 to 54 year old males and under 5 year old females are the most vulnerable to poverty, with 23 males (51.1%) and 44 females (100.0%) in their respective age groups living below the poverty level.
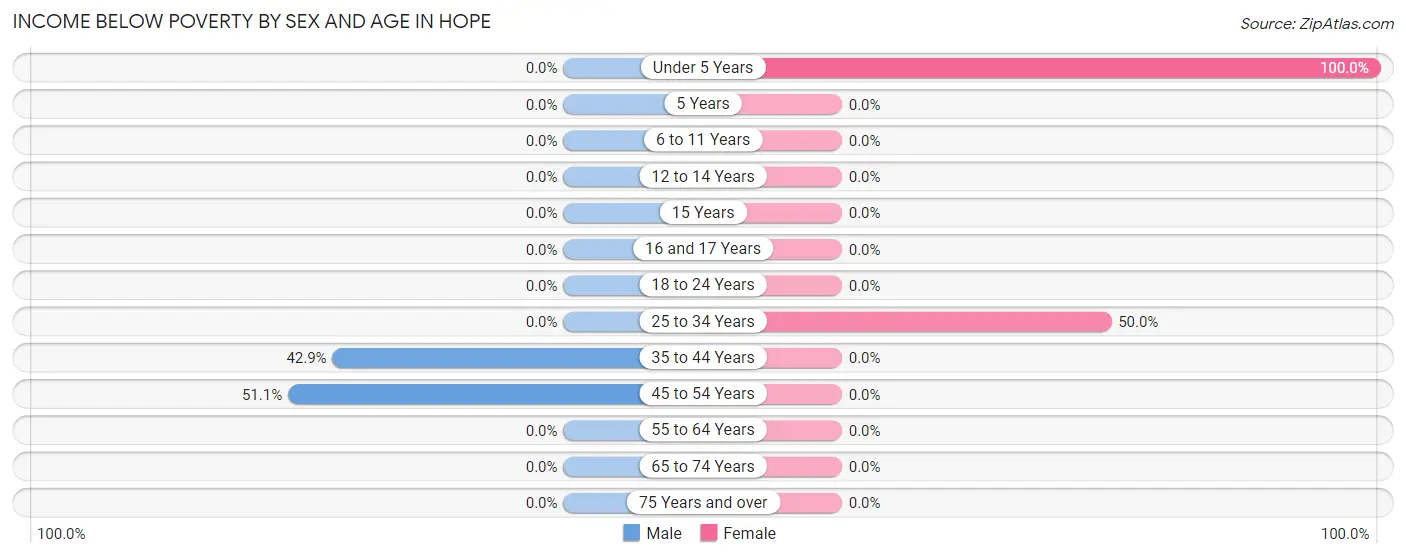
| Age Bracket | Male | Female |
| Under 5 Years | 0 (0.0%) | 44 (100.0%) |
| 5 Years | 0 (0.0%) | 0 (0.0%) |
| 6 to 11 Years | 0 (0.0%) | 0 (0.0%) |
| 12 to 14 Years | 0 (0.0%) | 0 (0.0%) |
| 15 Years | 0 (0.0%) | 0 (0.0%) |
| 16 and 17 Years | 0 (0.0%) | 0 (0.0%) |
| 18 to 24 Years | 0 (0.0%) | 0 (0.0%) |
| 25 to 34 Years | 0 (0.0%) | 9 (50.0%) |
| 35 to 44 Years | 6 (42.9%) | 0 (0.0%) |
| 45 to 54 Years | 23 (51.1%) | 0 (0.0%) |
| 55 to 64 Years | 0 (0.0%) | 0 (0.0%) |
| 65 to 74 Years | 0 (0.0%) | 0 (0.0%) |
| 75 Years and over | 0 (0.0%) | 0 (0.0%) |
| Total | 29 (49.1%) | 53 (71.6%) |
Income Above Poverty by Sex and Age in Hope
According to the poverty statistics in Hope, males aged 35 to 44 years and females aged 35 to 44 years are the age groups that are most secure financially, with 57.1% of males and 100.0% of females in these age groups living above the poverty line.
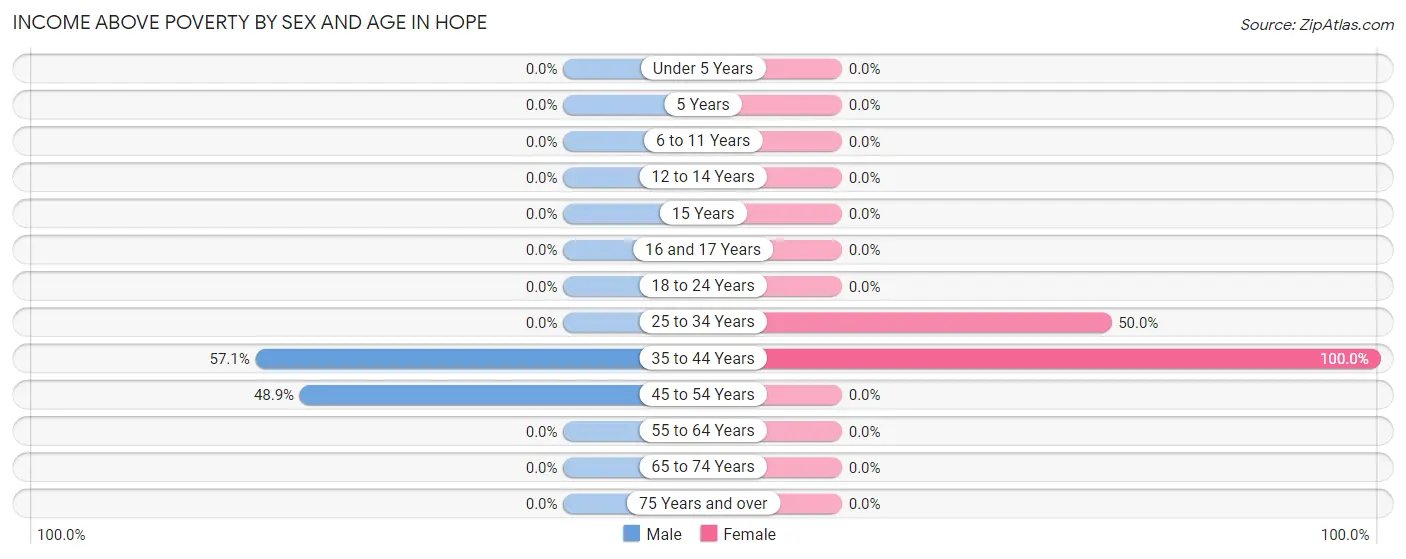
| Age Bracket | Male | Female |
| Under 5 Years | 0 (0.0%) | 0 (0.0%) |
| 5 Years | 0 (0.0%) | 0 (0.0%) |
| 6 to 11 Years | 0 (0.0%) | 0 (0.0%) |
| 12 to 14 Years | 0 (0.0%) | 0 (0.0%) |
| 15 Years | 0 (0.0%) | 0 (0.0%) |
| 16 and 17 Years | 0 (0.0%) | 0 (0.0%) |
| 18 to 24 Years | 0 (0.0%) | 0 (0.0%) |
| 25 to 34 Years | 0 (0.0%) | 9 (50.0%) |
| 35 to 44 Years | 8 (57.1%) | 12 (100.0%) |
| 45 to 54 Years | 22 (48.9%) | 0 (0.0%) |
| 55 to 64 Years | 0 (0.0%) | 0 (0.0%) |
| 65 to 74 Years | 0 (0.0%) | 0 (0.0%) |
| 75 Years and over | 0 (0.0%) | 0 (0.0%) |
| Total | 30 (50.8%) | 21 (28.4%) |
Income Below Poverty Among Married-Couple Families in Hope
The poverty statistics for married-couple families in Hope show that 23.1% or 6 of the total 26 families live below the poverty line. Families with 1 or 2 children have the highest poverty rate of 100.0%, comprising of 6 families. On the other hand, families with no children have the lowest poverty rate of 0.0%, which includes 0 families.
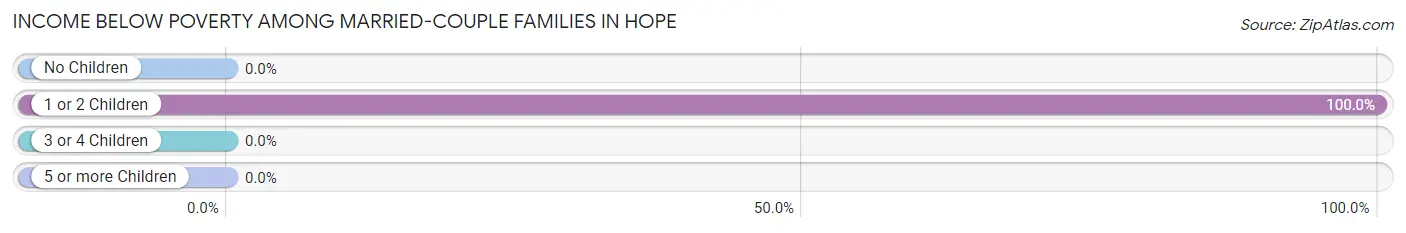
| Children | Above Poverty | Below Poverty |
| No Children | 20 (100.0%) | 0 (0.0%) |
| 1 or 2 Children | 0 (0.0%) | 6 (100.0%) |
| 3 or 4 Children | 0 (0.0%) | 0 (0.0%) |
| 5 or more Children | 0 (0.0%) | 0 (0.0%) |
| Total | 20 (76.9%) | 6 (23.1%) |
Income Below Poverty Among Single-Parent Households in Hope
| Children | Single Father | Single Mother |
| No Children | 0 (0.0%) | 0 (0.0%) |
| 1 or 2 Children | 0 (0.0%) | 0 (0.0%) |
| 3 or 4 Children | 0 (0.0%) | 0 (0.0%) |
| 5 or more Children | 0 (0.0%) | 0 (0.0%) |
| Total | 0 (0.0%) | 0 (0.0%) |
Income Below Poverty Among Married-Couple vs Single-Parent Households in Hope
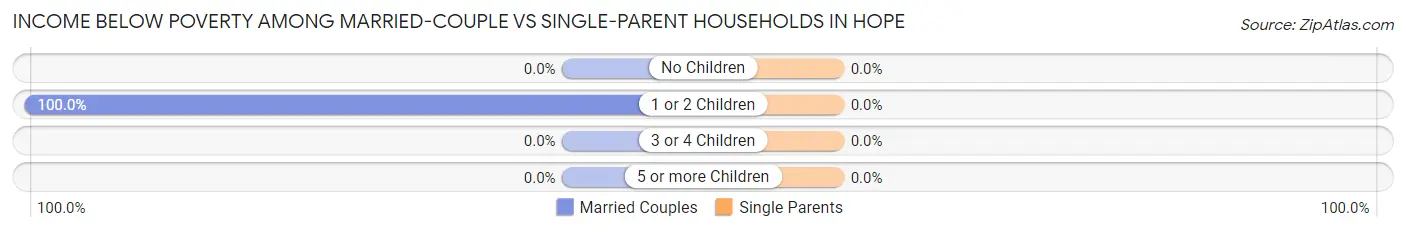
| Children | Married-Couple Families | Single-Parent Households |
| No Children | 0 (0.0%) | 0 (0.0%) |
| 1 or 2 Children | 6 (100.0%) | 0 (0.0%) |
| 3 or 4 Children | 0 (0.0%) | 0 (0.0%) |
| 5 or more Children | 0 (0.0%) | 0 (0.0%) |
| Total | 6 (23.1%) | 0 (0.0%) |
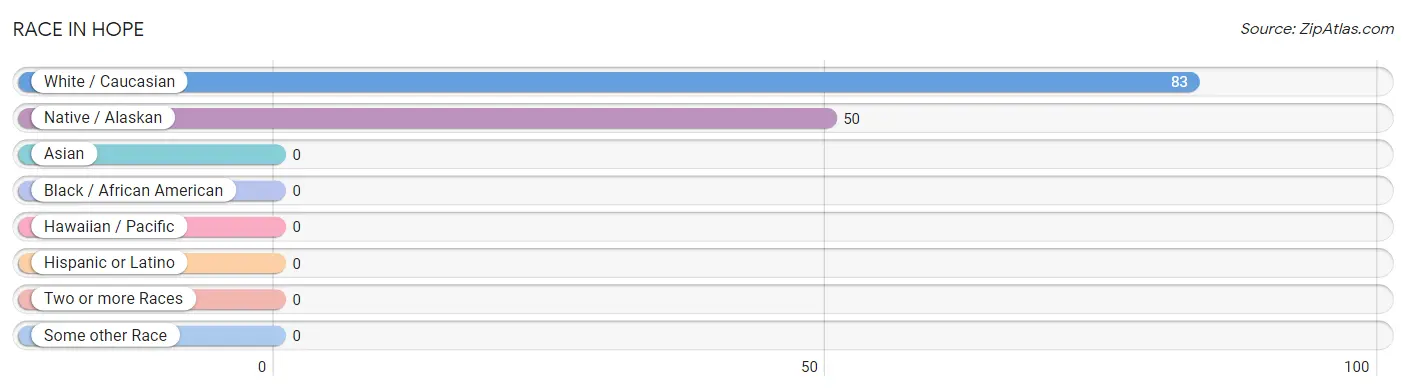
Race in Hope
The most populous races in Hope are White / Caucasian (83 | 62.4%), and Native / Alaskan (50 | 37.6%).
| Race | # Population | % Population |
| Asian | 0 | 0.0% |
| Black / African American | 0 | 0.0% |
| Hawaiian / Pacific | 0 | 0.0% |
| Hispanic or Latino | 0 | 0.0% |
| Native / Alaskan | 50 | 37.6% |
| White / Caucasian | 83 | 62.4% |
| Two or more Races | 0 | 0.0% |
| Some other Race | 0 | 0.0% |
| Total | 133 | 100.0% |
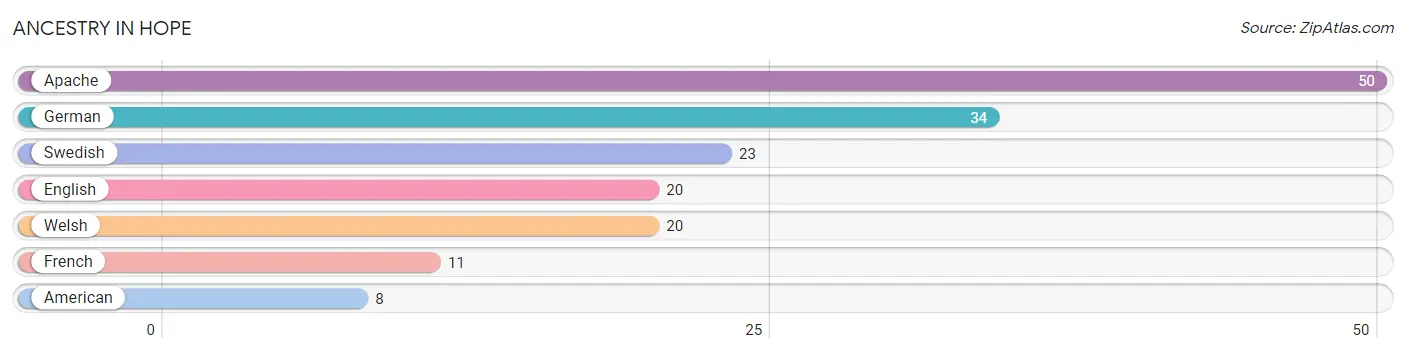
Ancestry in Hope
The most populous ancestries reported in Hope are Apache (50 | 37.6%), German (34 | 25.6%), Swedish (23 | 17.3%), English (20 | 15.0%), and Welsh (20 | 15.0%), together accounting for 110.5% of all Hope residents.
| Ancestry | # Population | % Population |
| American | 8 | 6.0% |
| Apache | 50 | 37.6% |
| English | 20 | 15.0% |
| French | 11 | 8.3% |
| German | 34 | 25.6% |
| Swedish | 23 | 17.3% |
| Welsh | 20 | 15.0% | View All 7 Rows |
Immigrants in Hope
The most numerous immigrant groups reported in Hope came from Canada (23 | 17.3%), Australia (9 | 6.8%), and Oceania (9 | 6.8%), together accounting for 30.8% of all Hope residents.
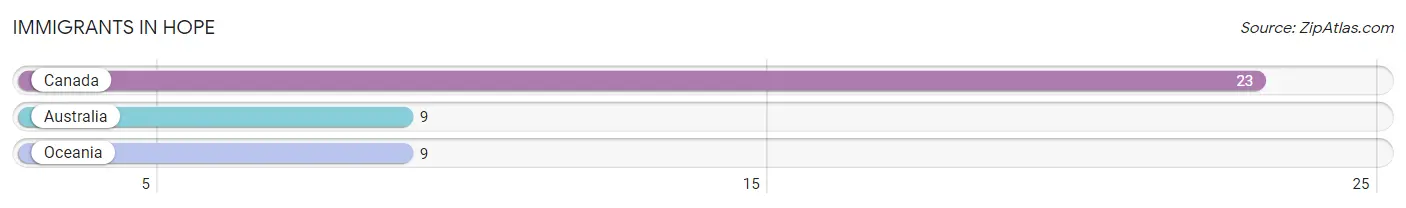
| Immigration Origin | # Population | % Population |
| Australia | 9 | 6.8% |
| Canada | 23 | 17.3% |
| Oceania | 9 | 6.8% | View All 3 Rows |
Sex and Age in Hope
Sex and Age in Hope
The most populous age groups in Hope are 50 to 54 Years (34 | 57.6%) for men and Under 5 Years (44 | 59.5%) for women.
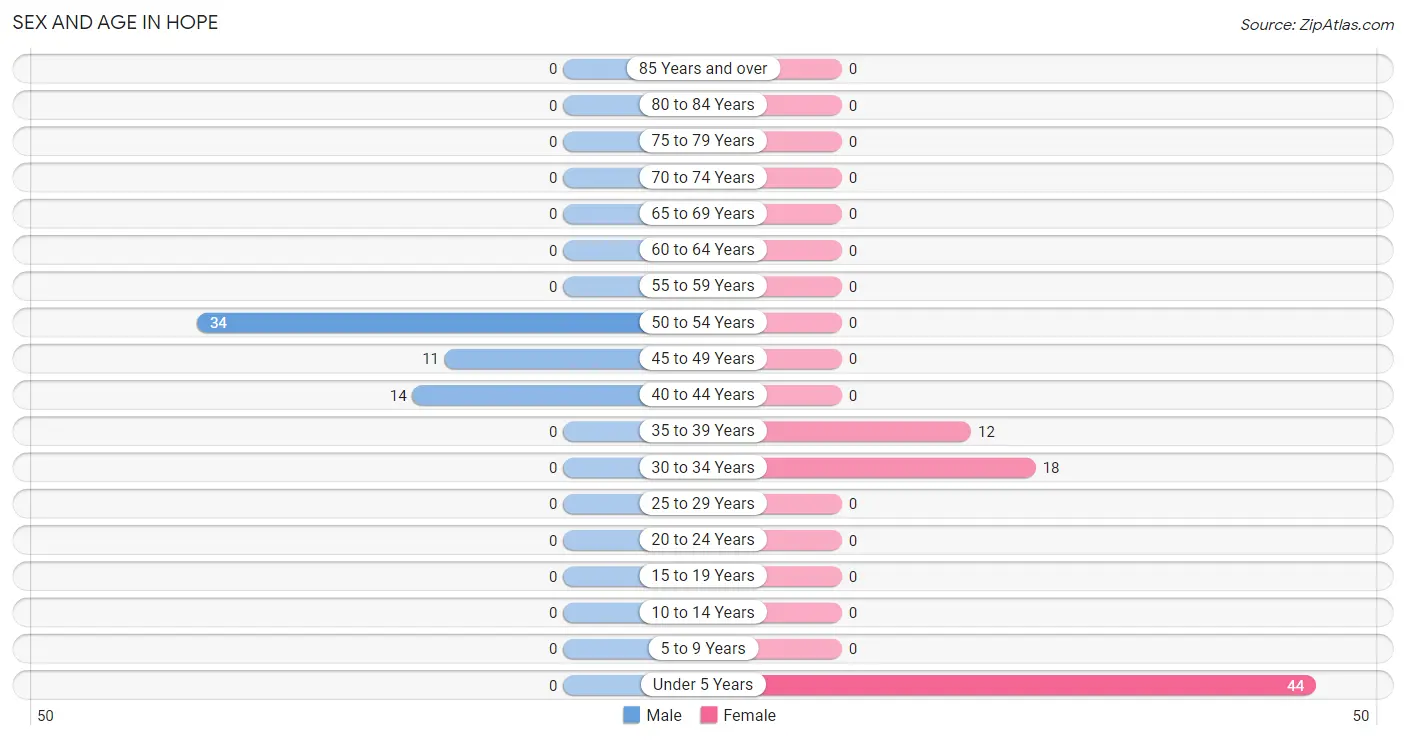
| Age Bracket | Male | Female |
| Under 5 Years | 0 (0.0%) | 44 (59.5%) |
| 5 to 9 Years | 0 (0.0%) | 0 (0.0%) |
| 10 to 14 Years | 0 (0.0%) | 0 (0.0%) |
| 15 to 19 Years | 0 (0.0%) | 0 (0.0%) |
| 20 to 24 Years | 0 (0.0%) | 0 (0.0%) |
| 25 to 29 Years | 0 (0.0%) | 0 (0.0%) |
| 30 to 34 Years | 0 (0.0%) | 18 (24.3%) |
| 35 to 39 Years | 0 (0.0%) | 12 (16.2%) |
| 40 to 44 Years | 14 (23.7%) | 0 (0.0%) |
| 45 to 49 Years | 11 (18.6%) | 0 (0.0%) |
| 50 to 54 Years | 34 (57.6%) | 0 (0.0%) |
| 55 to 59 Years | 0 (0.0%) | 0 (0.0%) |
| 60 to 64 Years | 0 (0.0%) | 0 (0.0%) |
| 65 to 69 Years | 0 (0.0%) | 0 (0.0%) |
| 70 to 74 Years | 0 (0.0%) | 0 (0.0%) |
| 75 to 79 Years | 0 (0.0%) | 0 (0.0%) |
| 80 to 84 Years | 0 (0.0%) | 0 (0.0%) |
| 85 Years and over | 0 (0.0%) | 0 (0.0%) |
| Total | 59 (100.0%) | 74 (100.0%) |
Families and Households in Hope
Median Family Size in Hope
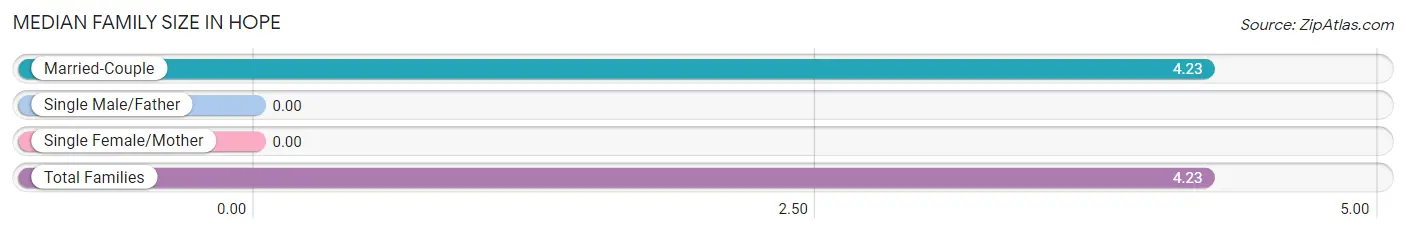
| Family Type | # Families | Family Size |
| Married-Couple | 26 (100.0%) | 4.23 |
| Single Male/Father | 0 (0.0%) | - |
| Single Female/Mother | 0 (0.0%) | - |
| Total Families | 26 (100.0%) | 4.23 |
Median Household Size in Hope
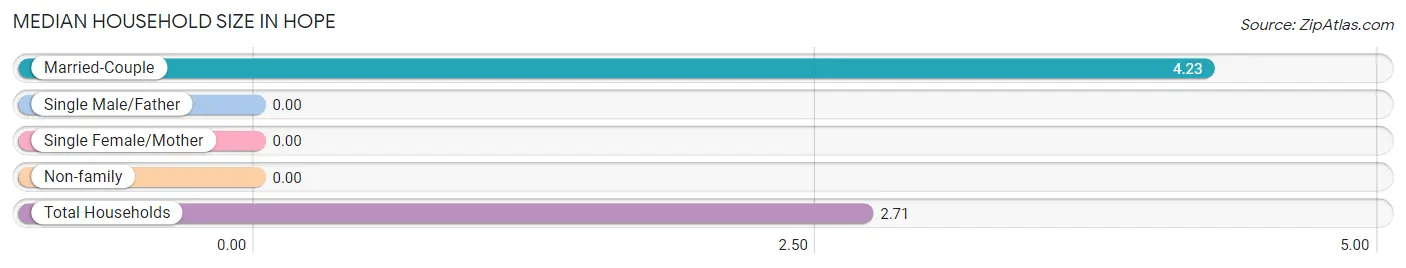
| Household Type | # Households | Household Size |
| Married-Couple | 26 (53.1%) | 4.23 |
| Single Male/Father | 0 (0.0%) | - |
| Single Female/Mother | 0 (0.0%) | - |
| Non-family | 23 (46.9%) | - |
| Total Households | 49 (100.0%) | 2.71 |
Household Size by Marriage Status in Hope
Out of a total of 49 households in Hope, 26 (53.1%) are family households, while 23 (46.9%) are nonfamily households. The most numerous type of family households are 2-person households, comprising 11, and the most common type of nonfamily households are 1-person households, comprising 23.
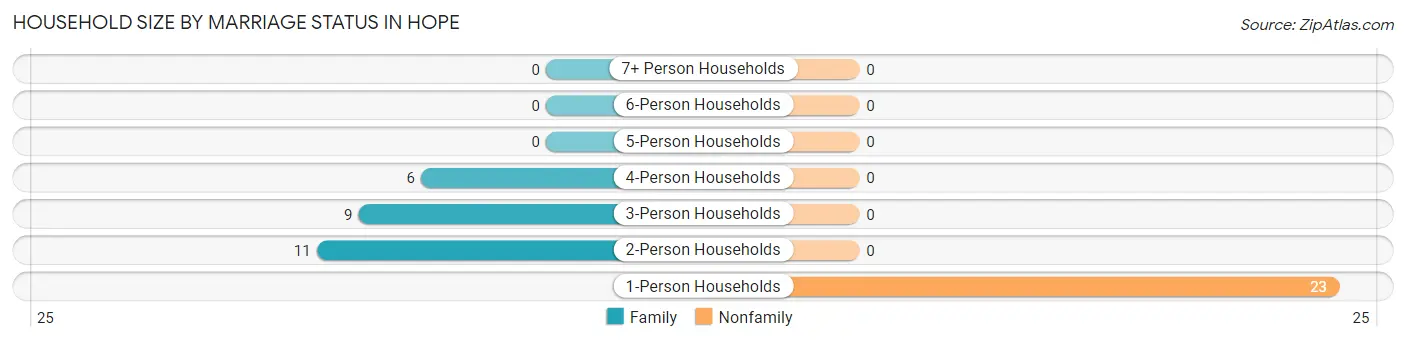
| Household Size | Family Households | Nonfamily Households |
| 1-Person Households | - | 23 (46.9%) |
| 2-Person Households | 11 (22.5%) | 0 (0.0%) |
| 3-Person Households | 9 (18.4%) | 0 (0.0%) |
| 4-Person Households | 6 (12.2%) | 0 (0.0%) |
| 5-Person Households | 0 (0.0%) | 0 (0.0%) |
| 6-Person Households | 0 (0.0%) | 0 (0.0%) |
| 7+ Person Households | 0 (0.0%) | 0 (0.0%) |
| Total | 26 (53.1%) | 23 (46.9%) |
Female Fertility in Hope
Fertility by Age in Hope
| Age Bracket | Women with Births | Births / 1,000 Women |
| 15 to 19 years | 0 (0.0%) | 0.0 |
| 20 to 34 years | 0 (0.0%) | 0.0 |
| 35 to 50 years | 0 (0.0%) | 0.0 |
| Total | 0 (0.0%) | 0.0 |
Fertility by Age by Marriage Status in Hope
| Age Bracket | Married | Unmarried |
| 15 to 19 years | 0 (0.0%) | 0 (0.0%) |
| 20 to 34 years | 0 (0.0%) | 0 (0.0%) |
| 35 to 50 years | 0 (0.0%) | 0 (0.0%) |
| Total | 0 (0.0%) | 0 (0.0%) |
Fertility by Education in Hope
| Educational Attainment | Women with Births | Births / 1,000 Women |
| Less than High School | 0 (0.0%) | 0.0 |
| High School Diploma | 0 (0.0%) | 0.0 |
| College or Associate's Degree | 0 (0.0%) | 0.0 |
| Bachelor's Degree | 0 (0.0%) | 0.0 |
| Graduate Degree | 0 (0.0%) | 0.0 |
| Total | 0 (0.0%) | 0.0 |
Fertility by Education by Marriage Status in Hope
| Educational Attainment | Married | Unmarried |
| Less than High School | 0 (0.0%) | 0 (0.0%) |
| High School Diploma | 0 (0.0%) | 0 (0.0%) |
| College or Associate's Degree | 0 (0.0%) | 0 (0.0%) |
| Bachelor's Degree | 0 (0.0%) | 0 (0.0%) |
| Graduate Degree | 0 (0.0%) | 0 (0.0%) |
| Total | 0 (0.0%) | 0 (0.0%) |
Employment Characteristics in Hope
Employment by Class of Employer in Hope
Among the 48 employed individuals in Hope, private company employees (20 | 41.7%), federal government employees (11 | 22.9%), and self-employed (not incorporated) (9 | 18.8%) make up the most common classes of employment.
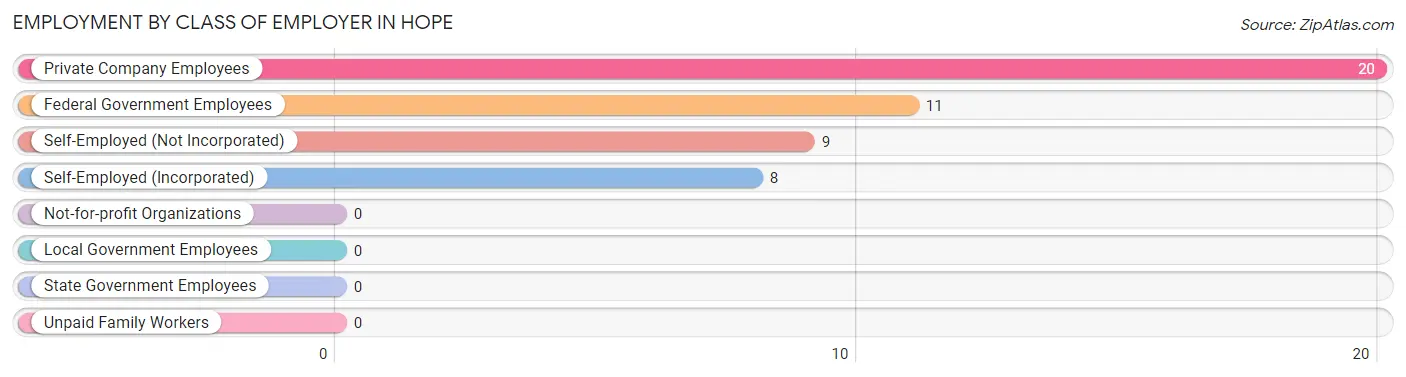
| Employer Class | # Employees | % Employees |
| Private Company Employees | 20 | 41.7% |
| Self-Employed (Incorporated) | 8 | 16.7% |
| Self-Employed (Not Incorporated) | 9 | 18.8% |
| Not-for-profit Organizations | 0 | 0.0% |
| Local Government Employees | 0 | 0.0% |
| State Government Employees | 0 | 0.0% |
| Federal Government Employees | 11 | 22.9% |
| Unpaid Family Workers | 0 | 0.0% |
| Total | 48 | 100.0% |
Employment Status by Age in Hope
According to the labor force statistics for Hope, out of the total population over 16 years of age (89), 79.8% or 71 individuals are in the labor force, with 32.4% or 23 of them unemployed. The age group with the highest labor force participation rate is 30 to 34 years, with 100.0% or 18 individuals in the labor force. Within the labor force, the 45 to 54 years age range has the highest percentage of unemployed individuals, with 51.1% or 23 of them being unemployed.
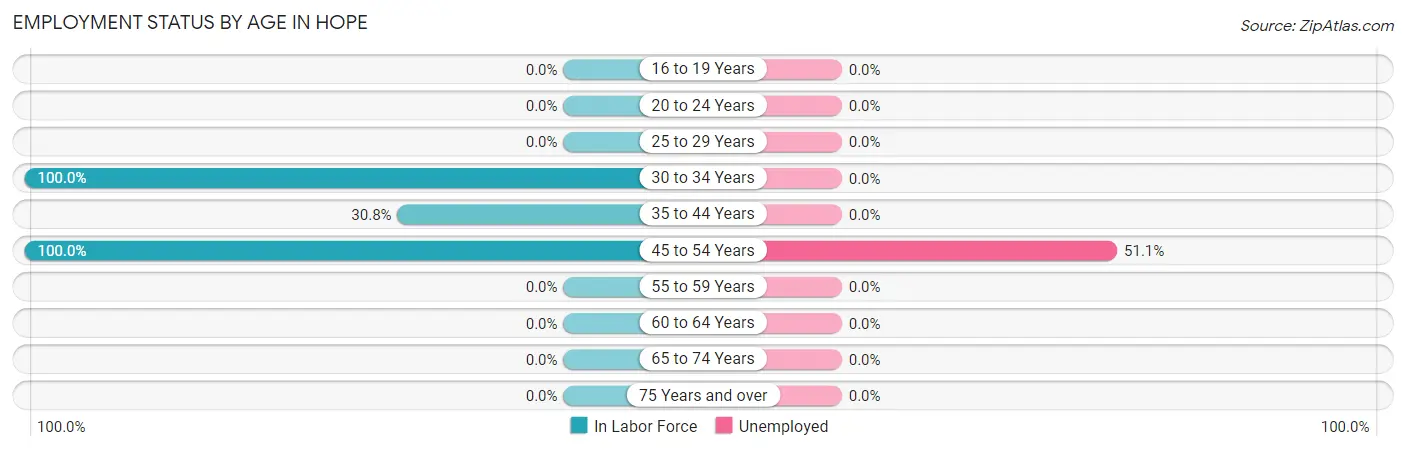
| Age Bracket | In Labor Force | Unemployed |
| 16 to 19 Years | 0 (0.0%) | 0 (0.0%) |
| 20 to 24 Years | 0 (0.0%) | 0 (0.0%) |
| 25 to 29 Years | 0 (0.0%) | 0 (0.0%) |
| 30 to 34 Years | 18 (100.0%) | 0 (0.0%) |
| 35 to 44 Years | 8 (30.8%) | 0 (0.0%) |
| 45 to 54 Years | 45 (100.0%) | 23 (51.1%) |
| 55 to 59 Years | 0 (0.0%) | 0 (0.0%) |
| 60 to 64 Years | 0 (0.0%) | 0 (0.0%) |
| 65 to 74 Years | 0 (0.0%) | 0 (0.0%) |
| 75 Years and over | 0 (0.0%) | 0 (0.0%) |
| Total | 71 (79.8%) | 23 (32.4%) |
Employment Status by Educational Attainment in Hope
According to labor force statistics for Hope, 79.8% of individuals (71) out of the total population between 25 and 64 years of age (89) are in the labor force, with 32.4% or 23 of them being unemployed. The group with the highest labor force participation rate are those with the educational attainment of less than high school, with 100.0% or 11 individuals in the labor force. Within the labor force, individuals with college / associate degree education have the highest percentage of unemployment, with 57.5% or 23 of them being unemployed.
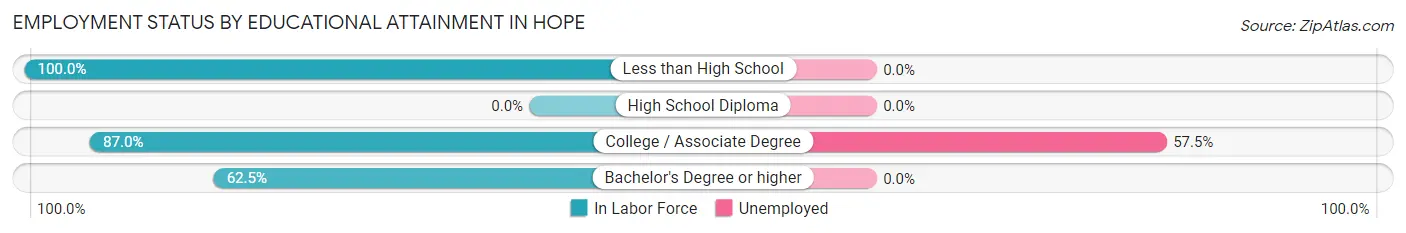
| Educational Attainment | In Labor Force | Unemployed |
| Less than High School | 11 (100.0%) | 0 (0.0%) |
| High School Diploma | 0 (0.0%) | 0 (0.0%) |
| College / Associate Degree | 40 (87.0%) | 26 (57.5%) |
| Bachelor's Degree or higher | 20 (62.5%) | 0 (0.0%) |
| Total | 71 (79.8%) | 29 (32.4%) |
Employment Occupations by Sex in Hope
Management, Business, Science and Arts Occupations
The most common Management, Business, Science and Arts occupations in Hope are Computers, Engineering & Science (11 | 22.9%), Life, Physical & Social Science (11 | 22.9%), Health Diagnosing & Treating (11 | 22.9%), and Health Technologists (11 | 22.9%).
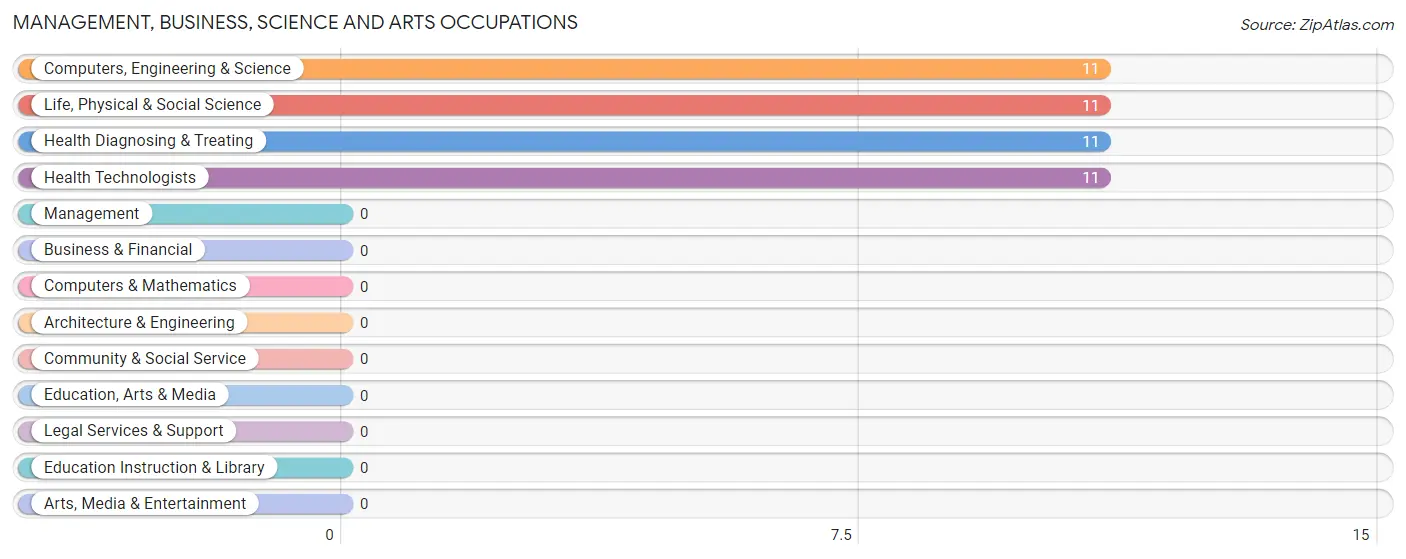
Management, Business, Science and Arts Occupations by Sex
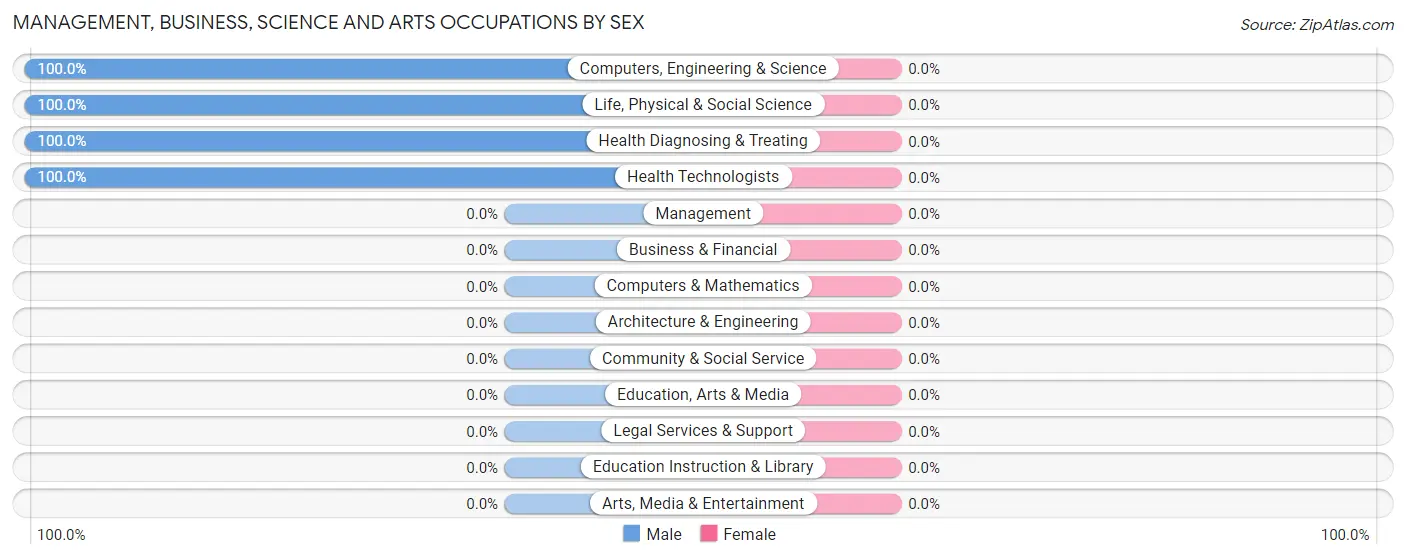
| Occupation | Male | Female |
| Management | 0 (0.0%) | 0 (0.0%) |
| Business & Financial | 0 (0.0%) | 0 (0.0%) |
| Computers, Engineering & Science | 11 (100.0%) | 0 (0.0%) |
| Computers & Mathematics | 0 (0.0%) | 0 (0.0%) |
| Architecture & Engineering | 0 (0.0%) | 0 (0.0%) |
| Life, Physical & Social Science | 11 (100.0%) | 0 (0.0%) |
| Community & Social Service | 0 (0.0%) | 0 (0.0%) |
| Education, Arts & Media | 0 (0.0%) | 0 (0.0%) |
| Legal Services & Support | 0 (0.0%) | 0 (0.0%) |
| Education Instruction & Library | 0 (0.0%) | 0 (0.0%) |
| Arts, Media & Entertainment | 0 (0.0%) | 0 (0.0%) |
| Health Diagnosing & Treating | 11 (100.0%) | 0 (0.0%) |
| Health Technologists | 11 (100.0%) | 0 (0.0%) |
| Total (Category) | 22 (100.0%) | 0 (0.0%) |
| Total (Overall) | 30 (62.5%) | 18 (37.5%) |
Services Occupations
The most common Services occupations in Hope are , and Personal Care & Service (8 | 16.7%).
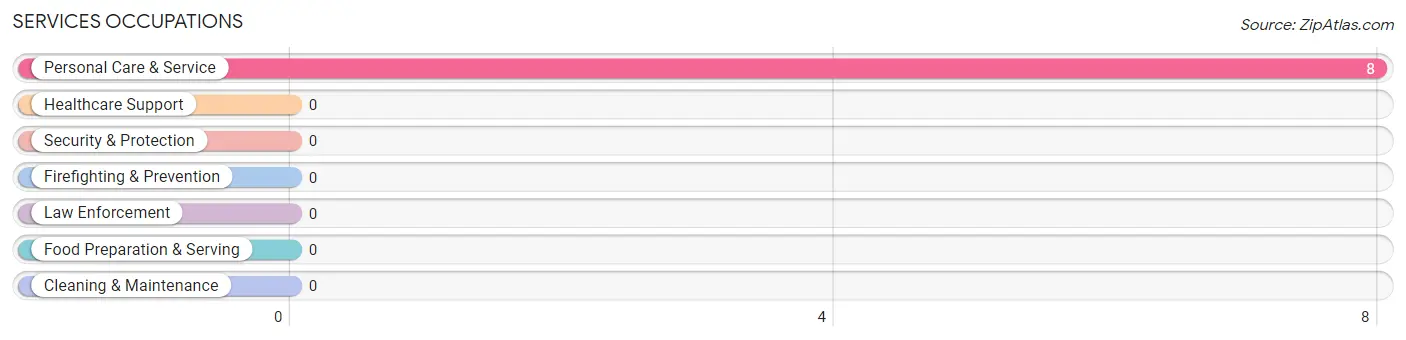
Services Occupations by Sex
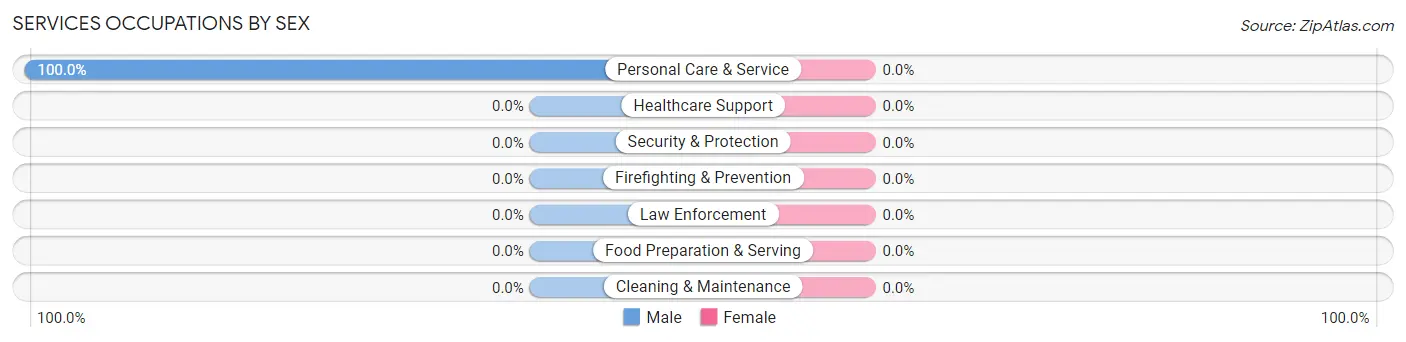
| Occupation | Male | Female |
| Healthcare Support | 0 (0.0%) | 0 (0.0%) |
| Security & Protection | 0 (0.0%) | 0 (0.0%) |
| Firefighting & Prevention | 0 (0.0%) | 0 (0.0%) |
| Law Enforcement | 0 (0.0%) | 0 (0.0%) |
| Food Preparation & Serving | 0 (0.0%) | 0 (0.0%) |
| Cleaning & Maintenance | 0 (0.0%) | 0 (0.0%) |
| Personal Care & Service | 8 (100.0%) | 0 (0.0%) |
| Total (Category) | 8 (100.0%) | 0 (0.0%) |
| Total (Overall) | 30 (62.5%) | 18 (37.5%) |
Sales and Office Occupations
The most common Sales and Office occupations in Hope are , and Office & Administration (18 | 37.5%).
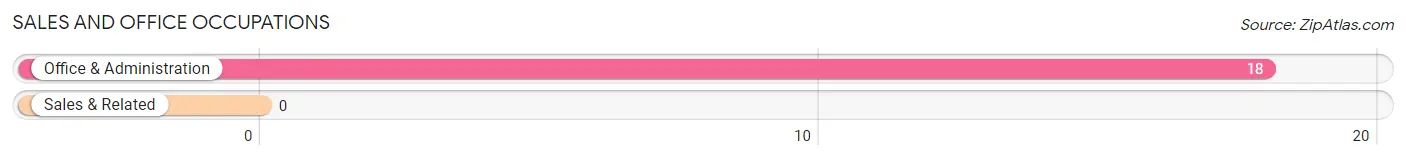
Sales and Office Occupations by Sex
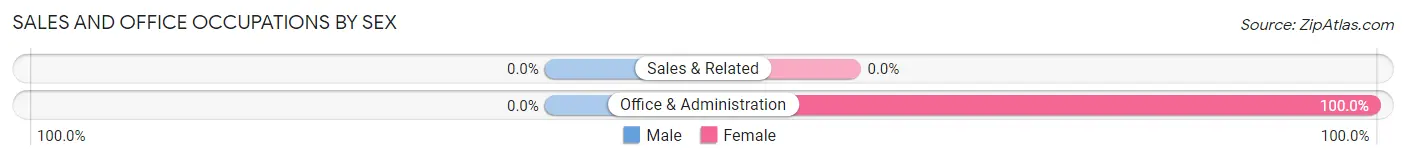
| Occupation | Male | Female |
| Sales & Related | 0 (0.0%) | 0 (0.0%) |
| Office & Administration | 0 (0.0%) | 18 (100.0%) |
| Total (Category) | 0 (0.0%) | 18 (100.0%) |
| Total (Overall) | 30 (62.5%) | 18 (37.5%) |
Natural Resources, Construction and Maintenance Occupations
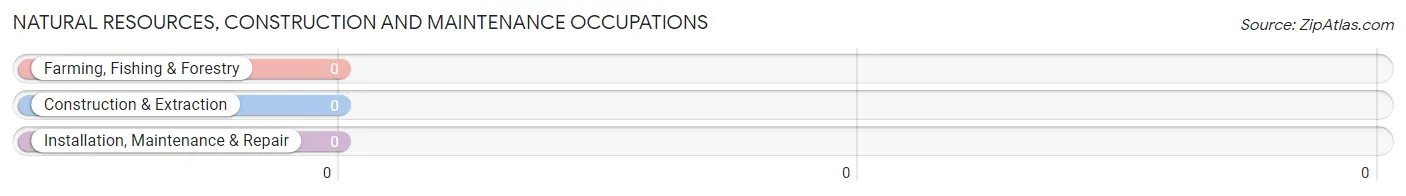
Natural Resources, Construction and Maintenance Occupations by Sex
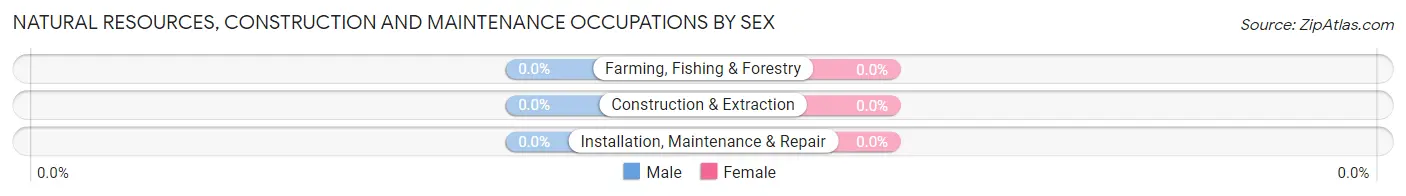
| Occupation | Male | Female |
| Farming, Fishing & Forestry | 0 (0.0%) | 0 (0.0%) |
| Construction & Extraction | 0 (0.0%) | 0 (0.0%) |
| Installation, Maintenance & Repair | 0 (0.0%) | 0 (0.0%) |
| Total (Category) | 0 (0.0%) | 0 (0.0%) |
| Total (Overall) | 30 (62.5%) | 18 (37.5%) |
Production, Transportation and Moving Occupations
Production, Transportation and Moving Occupations by Sex
| Occupation | Male | Female |
| Production | 0 (0.0%) | 0 (0.0%) |
| Transportation | 0 (0.0%) | 0 (0.0%) |
| Material Moving | 0 (0.0%) | 0 (0.0%) |
| Total (Category) | 0 (0.0%) | 0 (0.0%) |
| Total (Overall) | 30 (62.5%) | 18 (37.5%) |
Employment Industries by Sex in Hope
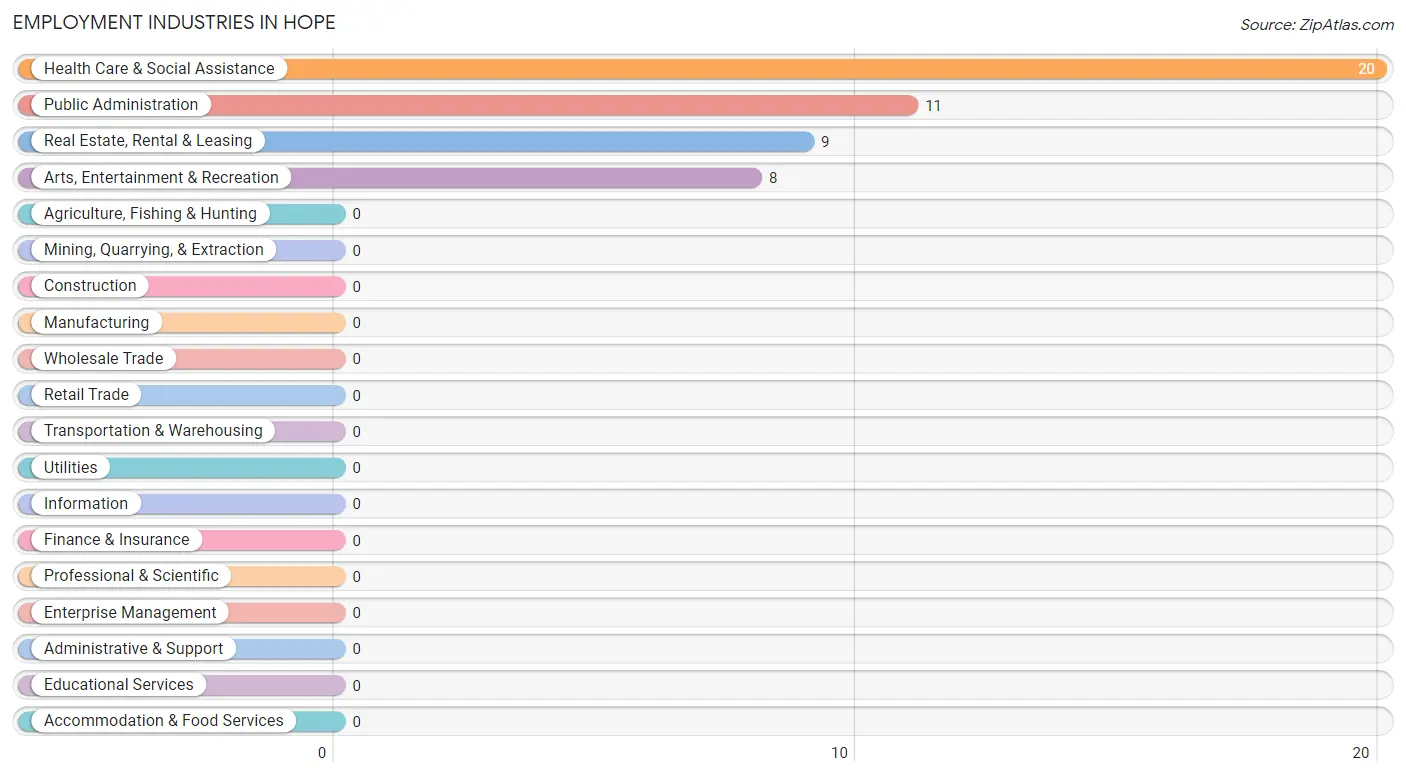
Employment Industries in Hope
The major employment industries in Hope include Health Care & Social Assistance (20 | 41.7%), Public Administration (11 | 22.9%), Real Estate, Rental & Leasing (9 | 18.8%), and Arts, Entertainment & Recreation (8 | 16.7%).
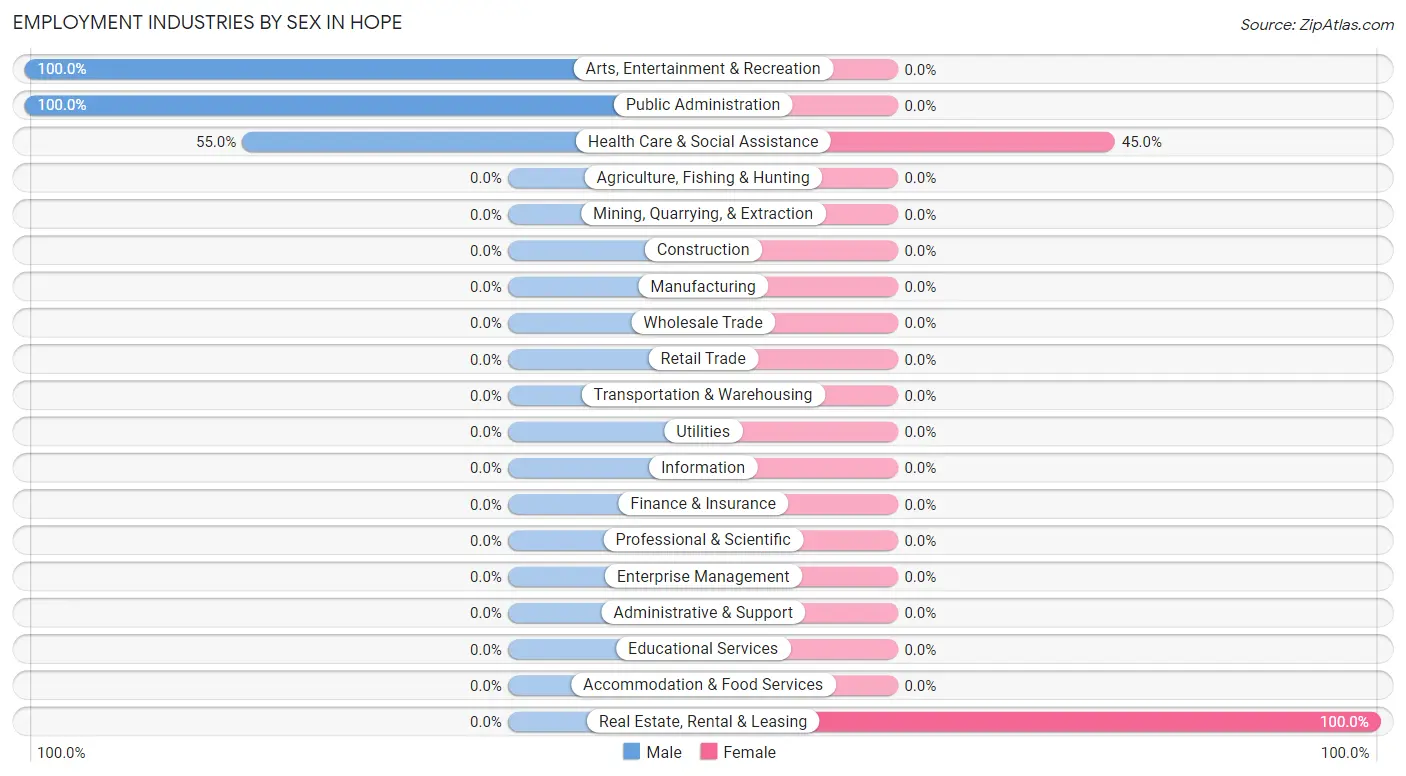
Employment Industries by Sex in Hope
The Hope industries that see more men than women are Arts, Entertainment & Recreation (100.0%), Public Administration (100.0%), and Health Care & Social Assistance (55.0%), whereas the industries that tend to have a higher number of women are Real Estate, Rental & Leasing (100.0%), and Health Care & Social Assistance (45.0%).
| Industry | Male | Female |
| Agriculture, Fishing & Hunting | 0 (0.0%) | 0 (0.0%) |
| Mining, Quarrying, & Extraction | 0 (0.0%) | 0 (0.0%) |
| Construction | 0 (0.0%) | 0 (0.0%) |
| Manufacturing | 0 (0.0%) | 0 (0.0%) |
| Wholesale Trade | 0 (0.0%) | 0 (0.0%) |
| Retail Trade | 0 (0.0%) | 0 (0.0%) |
| Transportation & Warehousing | 0 (0.0%) | 0 (0.0%) |
| Utilities | 0 (0.0%) | 0 (0.0%) |
| Information | 0 (0.0%) | 0 (0.0%) |
| Finance & Insurance | 0 (0.0%) | 0 (0.0%) |
| Real Estate, Rental & Leasing | 0 (0.0%) | 9 (100.0%) |
| Professional & Scientific | 0 (0.0%) | 0 (0.0%) |
| Enterprise Management | 0 (0.0%) | 0 (0.0%) |
| Administrative & Support | 0 (0.0%) | 0 (0.0%) |
| Educational Services | 0 (0.0%) | 0 (0.0%) |
| Health Care & Social Assistance | 11 (55.0%) | 9 (45.0%) |
| Arts, Entertainment & Recreation | 8 (100.0%) | 0 (0.0%) |
| Accommodation & Food Services | 0 (0.0%) | 0 (0.0%) |
| Public Administration | 11 (100.0%) | 0 (0.0%) |
| Total | 30 (62.5%) | 18 (37.5%) |
Education in Hope
School Enrollment in Hope
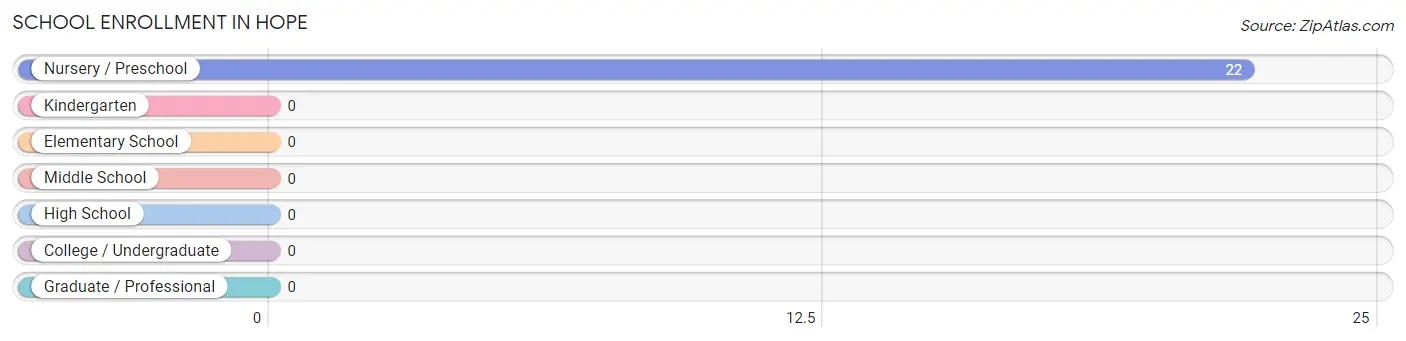
| School Level | # Students | % Students |
| Nursery / Preschool | 22 | 100.0% |
| Kindergarten | 0 | 0.0% |
| Elementary School | 0 | 0.0% |
| Middle School | 0 | 0.0% |
| High School | 0 | 0.0% |
| College / Undergraduate | 0 | 0.0% |
| Graduate / Professional | 0 | 0.0% |
| Total | 22 | 100.0% |
School Enrollment by Age by Funding Source in Hope
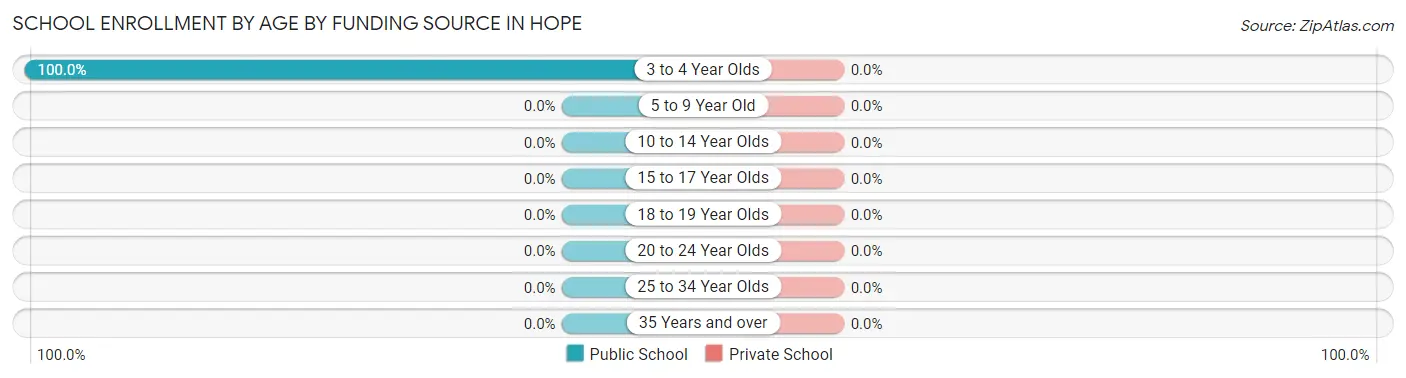
| Age Bracket | Public School | Private School |
| 3 to 4 Year Olds | 22 (100.0%) | 0 (0.0%) |
| 5 to 9 Year Old | 0 (0.0%) | 0 (0.0%) |
| 10 to 14 Year Olds | 0 (0.0%) | 0 (0.0%) |
| 15 to 17 Year Olds | 0 (0.0%) | 0 (0.0%) |
| 18 to 19 Year Olds | 0 (0.0%) | 0 (0.0%) |
| 20 to 24 Year Olds | 0 (0.0%) | 0 (0.0%) |
| 25 to 34 Year Olds | 0 (0.0%) | 0 (0.0%) |
| 35 Years and over | 0 (0.0%) | 0 (0.0%) |
| Total | 22 (100.0%) | 0 (0.0%) |
Educational Attainment by Field of Study in Hope
Communications (23 | 56.1%), education (9 | 22.0%), and literature & languages (9 | 22.0%) are the most common fields of study among 41 individuals in Hope who have obtained a bachelor's degree or higher.
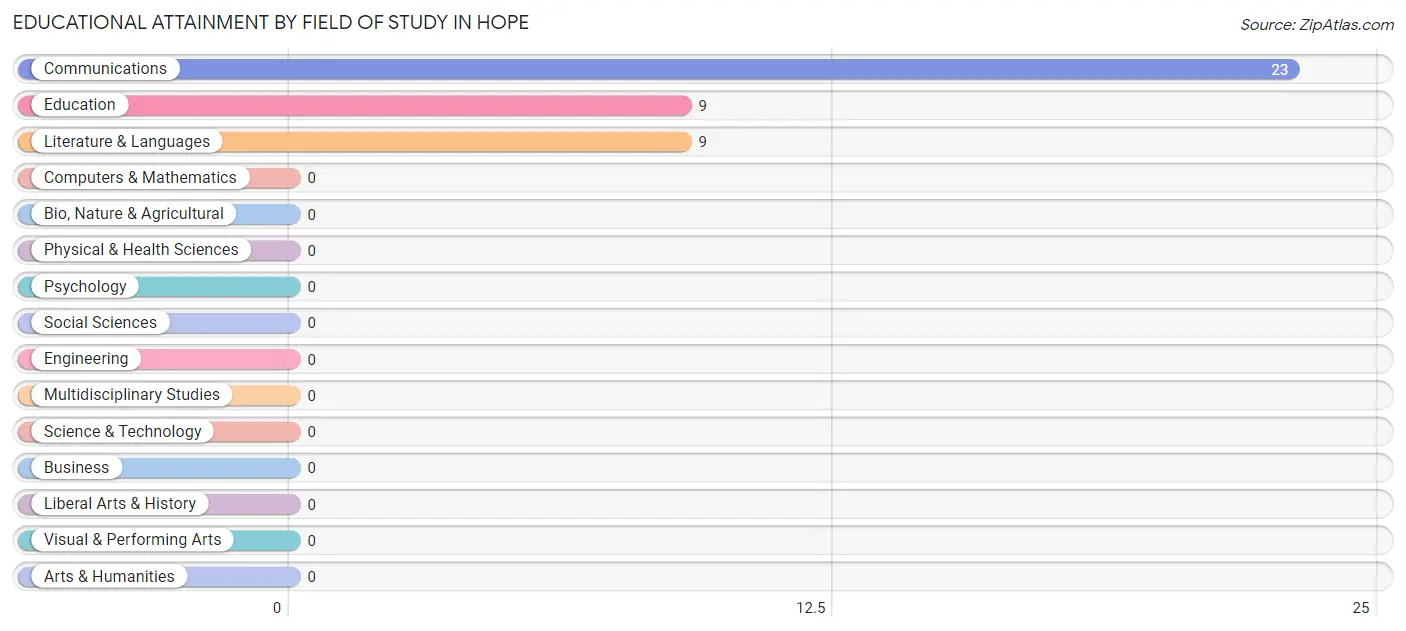
| Field of Study | # Graduates | % Graduates |
| Computers & Mathematics | 0 | 0.0% |
| Bio, Nature & Agricultural | 0 | 0.0% |
| Physical & Health Sciences | 0 | 0.0% |
| Psychology | 0 | 0.0% |
| Social Sciences | 0 | 0.0% |
| Engineering | 0 | 0.0% |
| Multidisciplinary Studies | 0 | 0.0% |
| Science & Technology | 0 | 0.0% |
| Business | 0 | 0.0% |
| Education | 9 | 22.0% |
| Literature & Languages | 9 | 22.0% |
| Liberal Arts & History | 0 | 0.0% |
| Visual & Performing Arts | 0 | 0.0% |
| Communications | 23 | 56.1% |
| Arts & Humanities | 0 | 0.0% |
| Total | 41 | 100.0% |
Transportation & Commute in Hope
Vehicle Availability by Sex in Hope
The most prevalent vehicle ownership categories in Hope are males with 1 vehicle (19, accounting for 63.3%) and females with 1 vehicle (18, making up 105.6%).
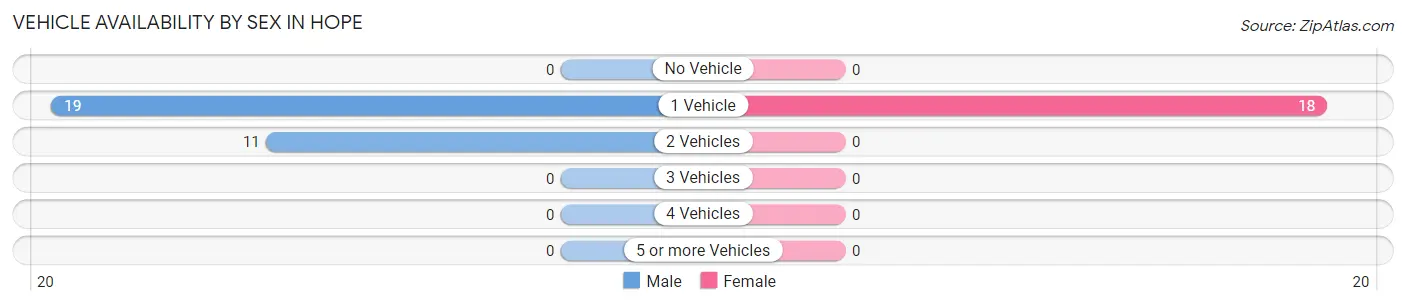
| Vehicles Available | Male | Female |
| No Vehicle | 0 (0.0%) | 0 (0.0%) |
| 1 Vehicle | 19 (63.3%) | 18 (100.0%) |
| 2 Vehicles | 11 (36.7%) | 0 (0.0%) |
| 3 Vehicles | 0 (0.0%) | 0 (0.0%) |
| 4 Vehicles | 0 (0.0%) | 0 (0.0%) |
| 5 or more Vehicles | 0 (0.0%) | 0 (0.0%) |
| Total | 30 (100.0%) | 18 (100.0%) |
Commute Time in Hope
The most frequently occuring commute durations in Hope are 45 to 59 minutes (19 commuters, 63.3%), 15 to 19 minutes (11 commuters, 36.7%), and less than 5 minutes (0 commuters, 0.0%).
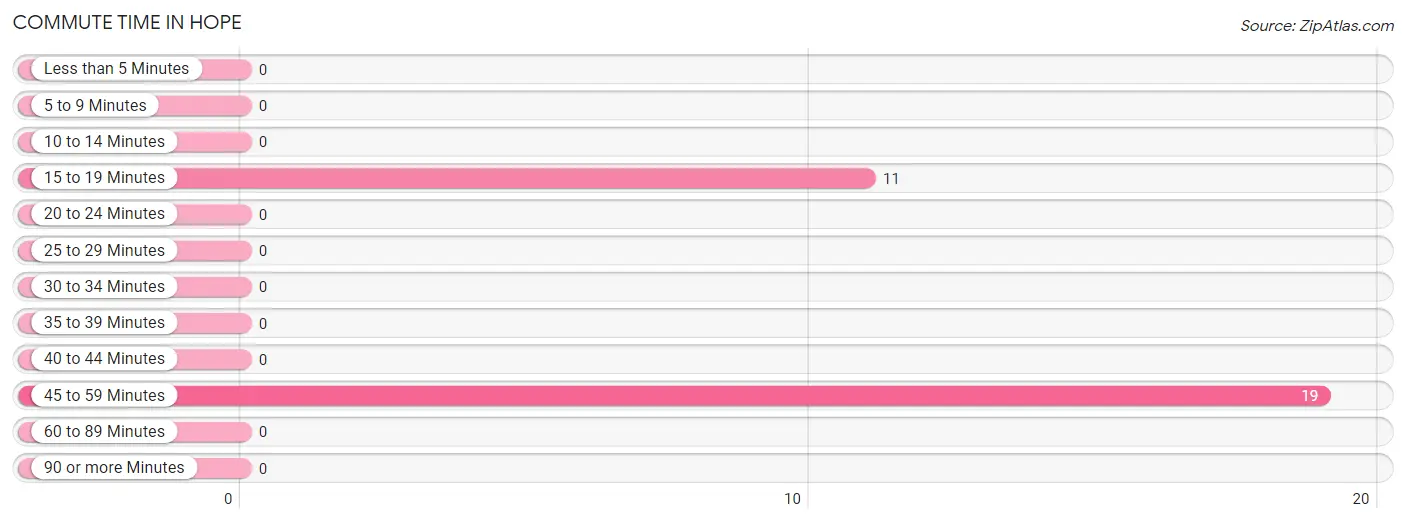
| Commute Time | # Commuters | % Commuters |
| Less than 5 Minutes | 0 | 0.0% |
| 5 to 9 Minutes | 0 | 0.0% |
| 10 to 14 Minutes | 0 | 0.0% |
| 15 to 19 Minutes | 11 | 36.7% |
| 20 to 24 Minutes | 0 | 0.0% |
| 25 to 29 Minutes | 0 | 0.0% |
| 30 to 34 Minutes | 0 | 0.0% |
| 35 to 39 Minutes | 0 | 0.0% |
| 40 to 44 Minutes | 0 | 0.0% |
| 45 to 59 Minutes | 19 | 63.3% |
| 60 to 89 Minutes | 0 | 0.0% |
| 90 or more Minutes | 0 | 0.0% |
Commute Time by Sex in Hope
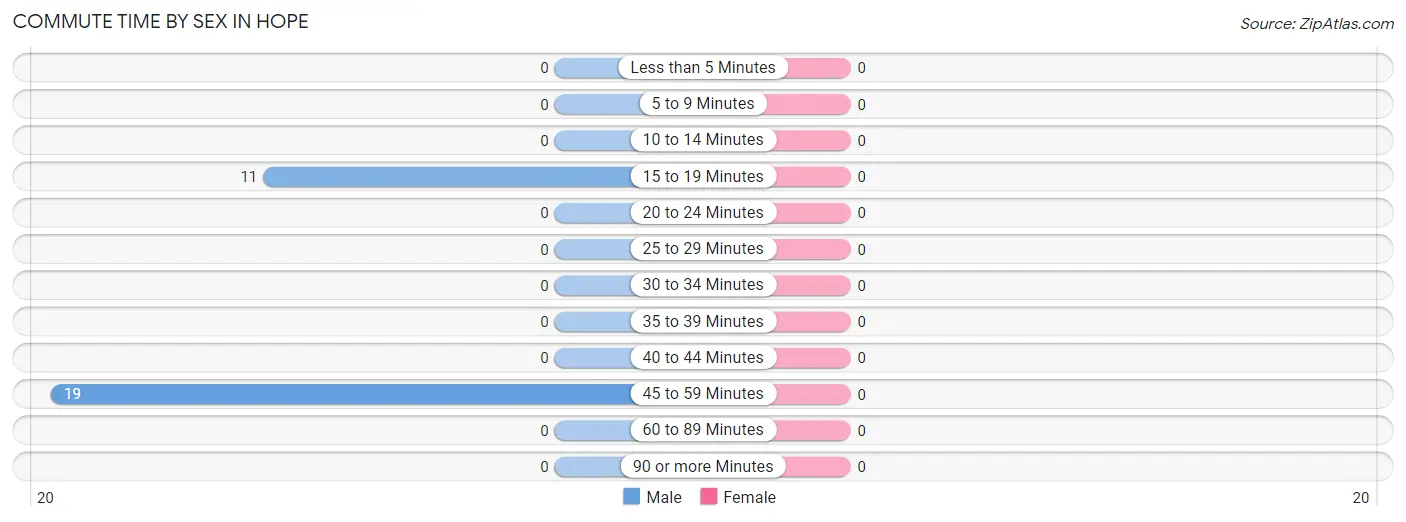
| Commute Time | Male | Female |
| Less than 5 Minutes | 0 (0.0%) | 0 (0.0%) |
| 5 to 9 Minutes | 0 (0.0%) | 0 (0.0%) |
| 10 to 14 Minutes | 0 (0.0%) | 0 (0.0%) |
| 15 to 19 Minutes | 11 (36.7%) | 0 (0.0%) |
| 20 to 24 Minutes | 0 (0.0%) | 0 (0.0%) |
| 25 to 29 Minutes | 0 (0.0%) | 0 (0.0%) |
| 30 to 34 Minutes | 0 (0.0%) | 0 (0.0%) |
| 35 to 39 Minutes | 0 (0.0%) | 0 (0.0%) |
| 40 to 44 Minutes | 0 (0.0%) | 0 (0.0%) |
| 45 to 59 Minutes | 19 (63.3%) | 0 (0.0%) |
| 60 to 89 Minutes | 0 (0.0%) | 0 (0.0%) |
| 90 or more Minutes | 0 (0.0%) | 0 (0.0%) |
Time of Departure to Work by Sex in Hope
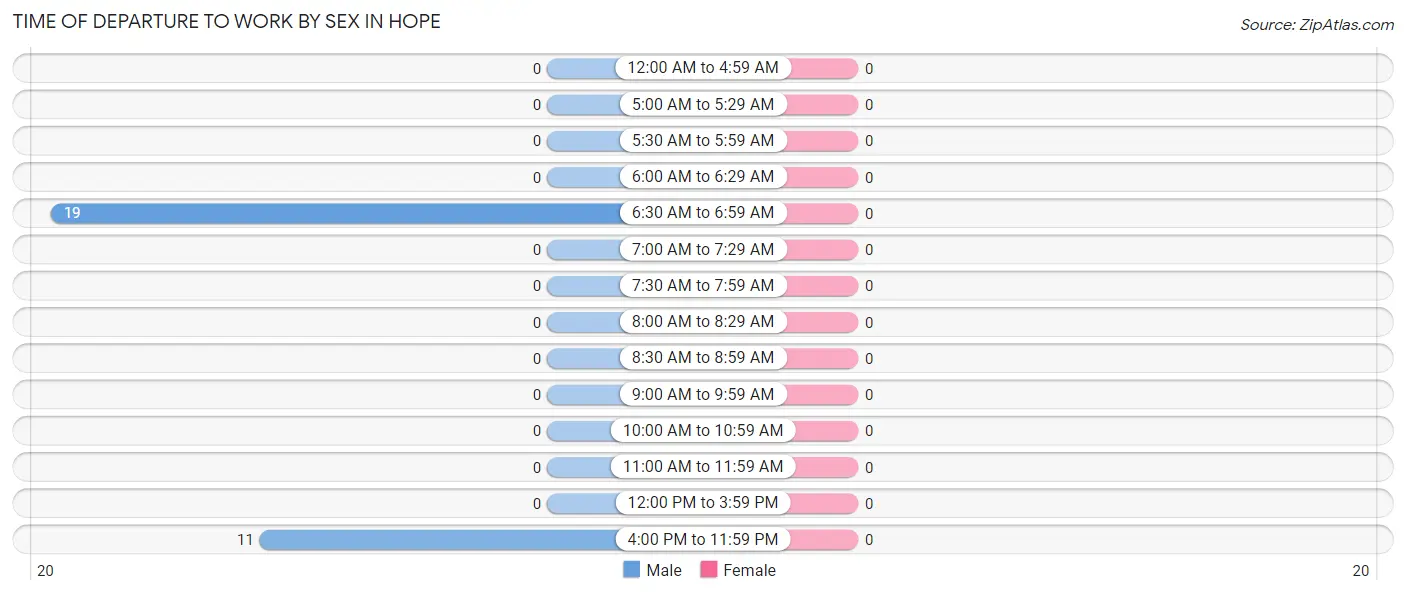
| Time of Departure | Male | Female |
| 12:00 AM to 4:59 AM | 0 (0.0%) | 0 (0.0%) |
| 5:00 AM to 5:29 AM | 0 (0.0%) | 0 (0.0%) |
| 5:30 AM to 5:59 AM | 0 (0.0%) | 0 (0.0%) |
| 6:00 AM to 6:29 AM | 0 (0.0%) | 0 (0.0%) |
| 6:30 AM to 6:59 AM | 19 (63.3%) | 0 (0.0%) |
| 7:00 AM to 7:29 AM | 0 (0.0%) | 0 (0.0%) |
| 7:30 AM to 7:59 AM | 0 (0.0%) | 0 (0.0%) |
| 8:00 AM to 8:29 AM | 0 (0.0%) | 0 (0.0%) |
| 8:30 AM to 8:59 AM | 0 (0.0%) | 0 (0.0%) |
| 9:00 AM to 9:59 AM | 0 (0.0%) | 0 (0.0%) |
| 10:00 AM to 10:59 AM | 0 (0.0%) | 0 (0.0%) |
| 11:00 AM to 11:59 AM | 0 (0.0%) | 0 (0.0%) |
| 12:00 PM to 3:59 PM | 0 (0.0%) | 0 (0.0%) |
| 4:00 PM to 11:59 PM | 11 (36.7%) | 0 (0.0%) |
| Total | 30 (100.0%) | 0 (0.0%) |
Housing Occupancy in Hope
Occupancy by Ownership in Hope
Of the total 49 dwellings in Hope, owner-occupied units account for 49 (100.0%), while renter-occupied units make up 0 (0.0%).
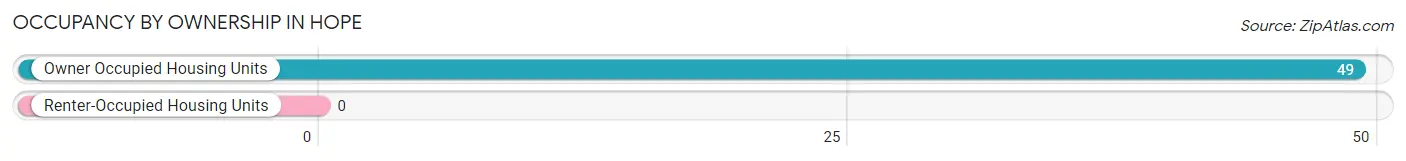
| Occupancy | # Housing Units | % Housing Units |
| Owner Occupied Housing Units | 49 | 100.0% |
| Renter-Occupied Housing Units | 0 | 0.0% |
| Total Occupied Housing Units | 49 | 100.0% |
Occupancy by Household Size in Hope
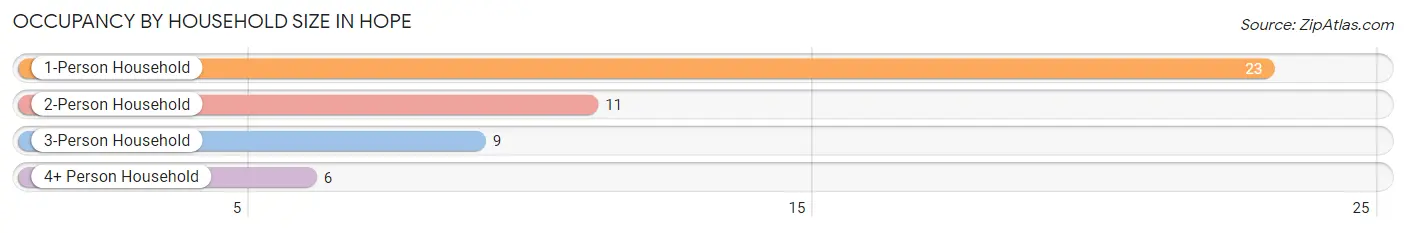
| Household Size | # Housing Units | % Housing Units |
| 1-Person Household | 23 | 46.9% |
| 2-Person Household | 11 | 22.5% |
| 3-Person Household | 9 | 18.4% |
| 4+ Person Household | 6 | 12.2% |
| Total Housing Units | 49 | 100.0% |
Occupancy by Ownership by Household Size in Hope
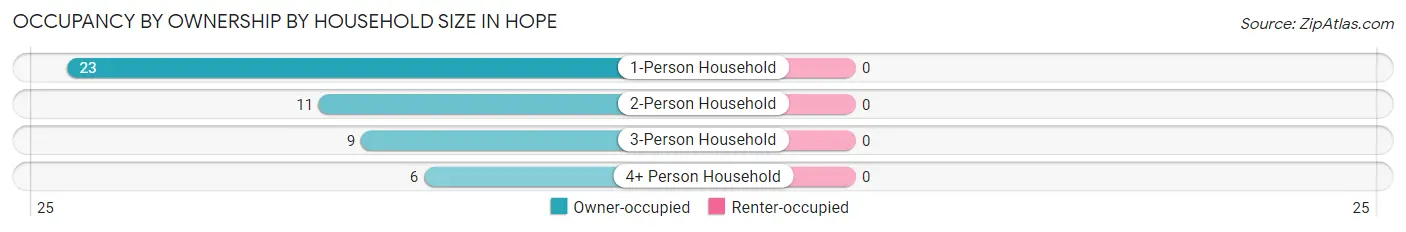
| Household Size | Owner-occupied | Renter-occupied |
| 1-Person Household | 23 (100.0%) | 0 (0.0%) |
| 2-Person Household | 11 (100.0%) | 0 (0.0%) |
| 3-Person Household | 9 (100.0%) | 0 (0.0%) |
| 4+ Person Household | 6 (100.0%) | 0 (0.0%) |
| Total Housing Units | 49 (100.0%) | 0 (0.0%) |
Occupancy by Educational Attainment in Hope
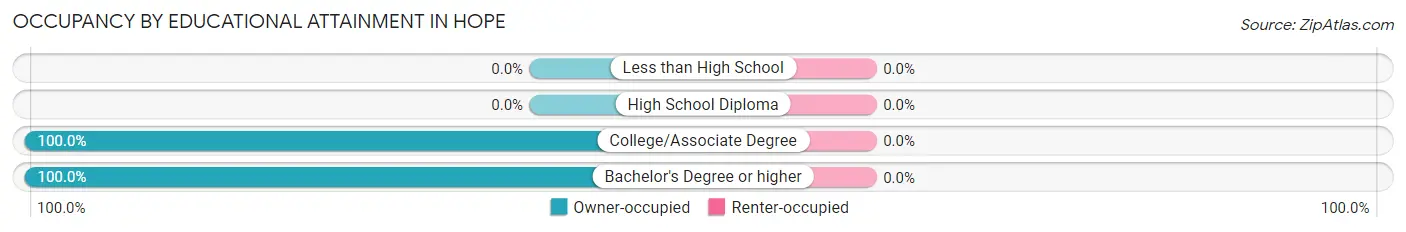
| Household Size | Owner-occupied | Renter-occupied |
| Less than High School | 0 (0.0%) | 0 (0.0%) |
| High School Diploma | 0 (0.0%) | 0 (0.0%) |
| College/Associate Degree | 38 (100.0%) | 0 (0.0%) |
| Bachelor's Degree or higher | 11 (100.0%) | 0 (0.0%) |
Occupancy by Age of Householder in Hope
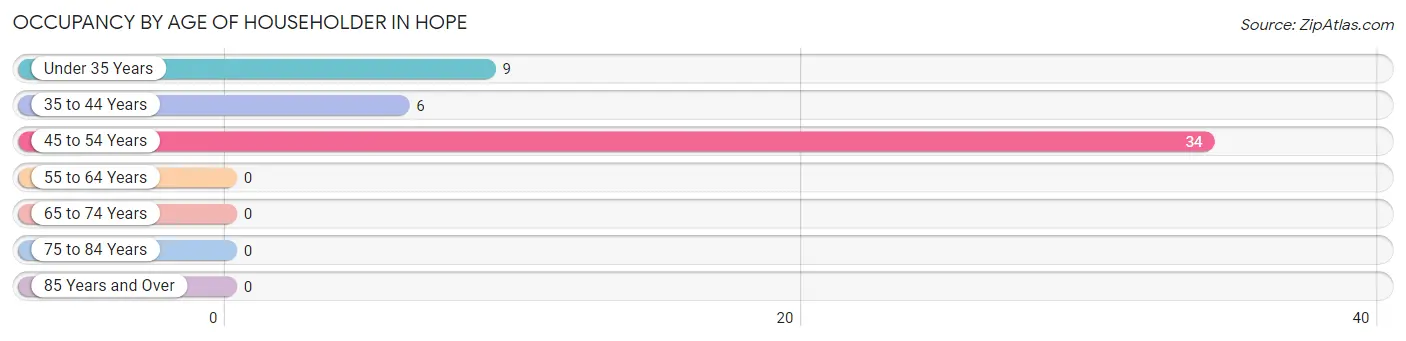
| Age Bracket | # Households | % Households |
| Under 35 Years | 9 | 18.4% |
| 35 to 44 Years | 6 | 12.2% |
| 45 to 54 Years | 34 | 69.4% |
| 55 to 64 Years | 0 | 0.0% |
| 65 to 74 Years | 0 | 0.0% |
| 75 to 84 Years | 0 | 0.0% |
| 85 Years and Over | 0 | 0.0% |
| Total | 49 | 100.0% |
Housing Finances in Hope
Median Income by Occupancy in Hope
| Occupancy Type | # Households | Median Income |
| Owner-Occupied | 49 (100.0%) | $0 |
| Renter-Occupied | 0 (0.0%) | $0 |
| Average | 49 (100.0%) | $0 |
Occupancy by Householder Income Bracket in Hope
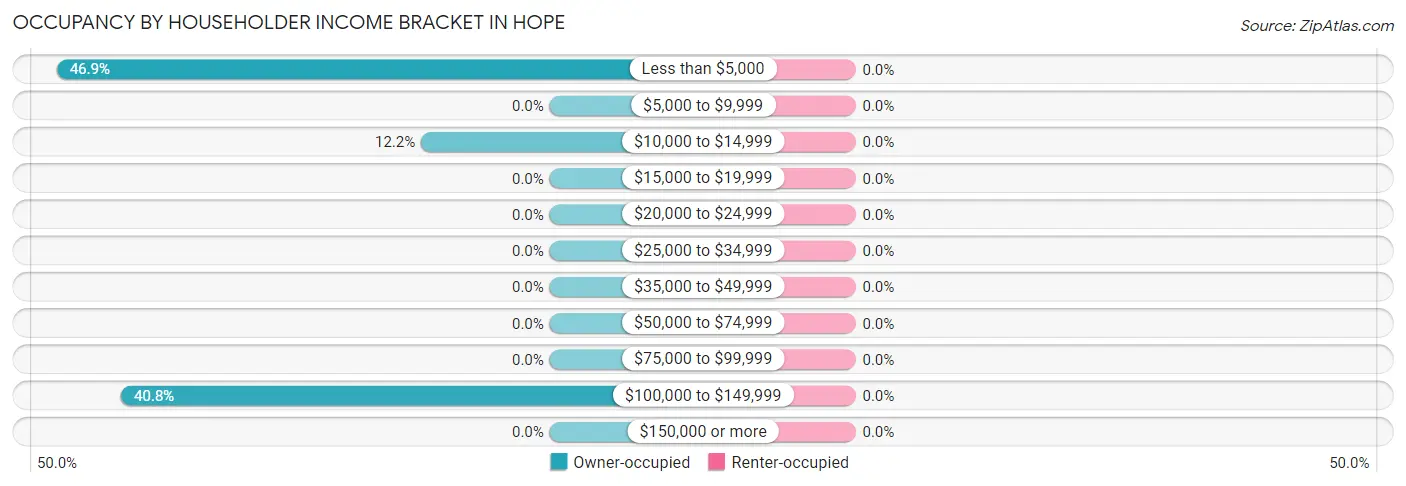
| Income Bracket | Owner-occupied | Renter-occupied |
| Less than $5,000 | 23 (46.9%) | 0 (0.0%) |
| $5,000 to $9,999 | 0 (0.0%) | 0 (0.0%) |
| $10,000 to $14,999 | 6 (12.2%) | 0 (0.0%) |
| $15,000 to $19,999 | 0 (0.0%) | 0 (0.0%) |
| $20,000 to $24,999 | 0 (0.0%) | 0 (0.0%) |
| $25,000 to $34,999 | 0 (0.0%) | 0 (0.0%) |
| $35,000 to $49,999 | 0 (0.0%) | 0 (0.0%) |
| $50,000 to $74,999 | 0 (0.0%) | 0 (0.0%) |
| $75,000 to $99,999 | 0 (0.0%) | 0 (0.0%) |
| $100,000 to $149,999 | 20 (40.8%) | 0 (0.0%) |
| $150,000 or more | 0 (0.0%) | 0 (0.0%) |
| Total | 49 (100.0%) | 0 (0.0%) |
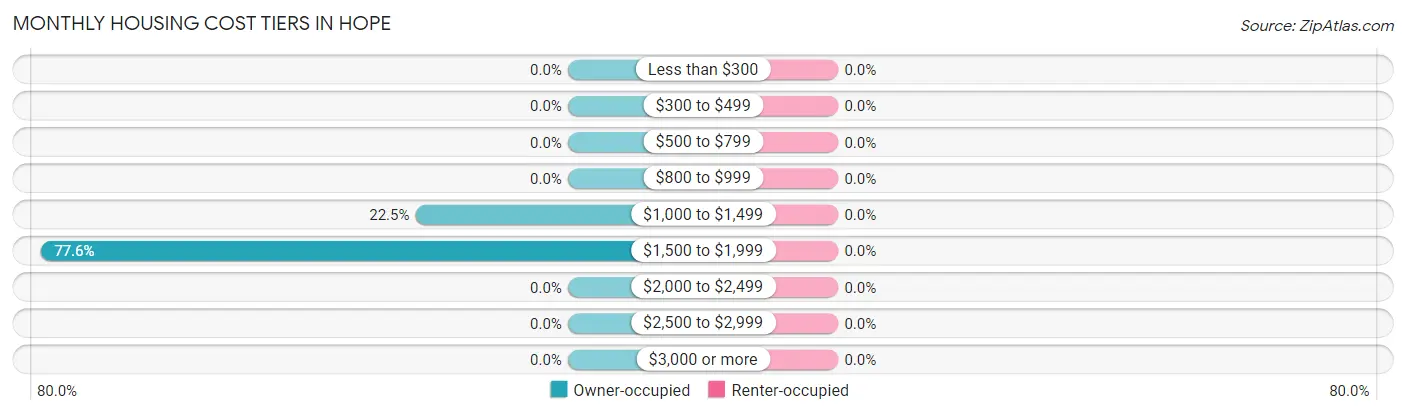
Monthly Housing Cost Tiers in Hope
| Monthly Cost | Owner-occupied | Renter-occupied |
| Less than $300 | 0 (0.0%) | 0 (0.0%) |
| $300 to $499 | 0 (0.0%) | 0 (0.0%) |
| $500 to $799 | 0 (0.0%) | 0 (0.0%) |
| $800 to $999 | 0 (0.0%) | 0 (0.0%) |
| $1,000 to $1,499 | 11 (22.5%) | 0 (0.0%) |
| $1,500 to $1,999 | 38 (77.5%) | 0 (0.0%) |
| $2,000 to $2,499 | 0 (0.0%) | 0 (0.0%) |
| $2,500 to $2,999 | 0 (0.0%) | 0 (0.0%) |
| $3,000 or more | 0 (0.0%) | 0 (0.0%) |
| Total | 49 (100.0%) | 0 (0.0%) |
Physical Housing Characteristics in Hope
Housing Structures in Hope
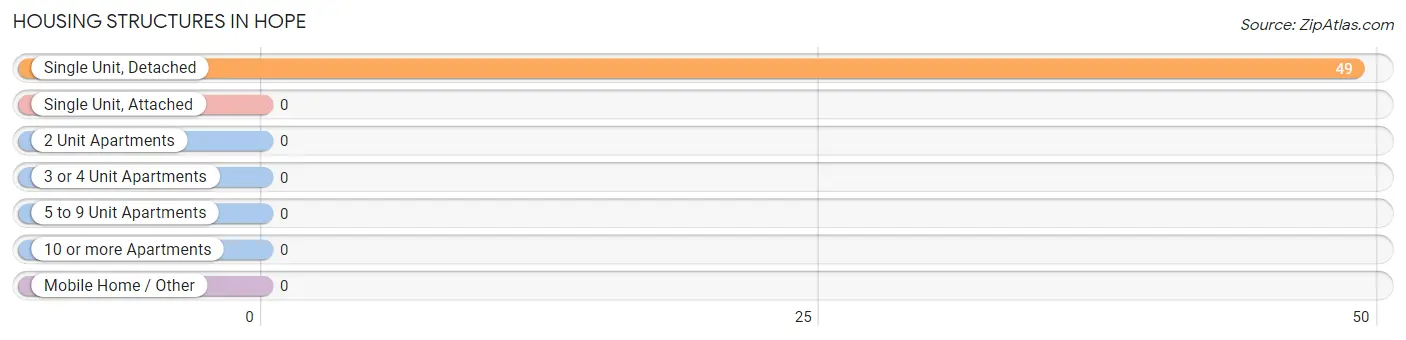
| Structure Type | # Housing Units | % Housing Units |
| Single Unit, Detached | 49 | 100.0% |
| Single Unit, Attached | 0 | 0.0% |
| 2 Unit Apartments | 0 | 0.0% |
| 3 or 4 Unit Apartments | 0 | 0.0% |
| 5 to 9 Unit Apartments | 0 | 0.0% |
| 10 or more Apartments | 0 | 0.0% |
| Mobile Home / Other | 0 | 0.0% |
| Total | 49 | 100.0% |
Housing Structures by Occupancy in Hope
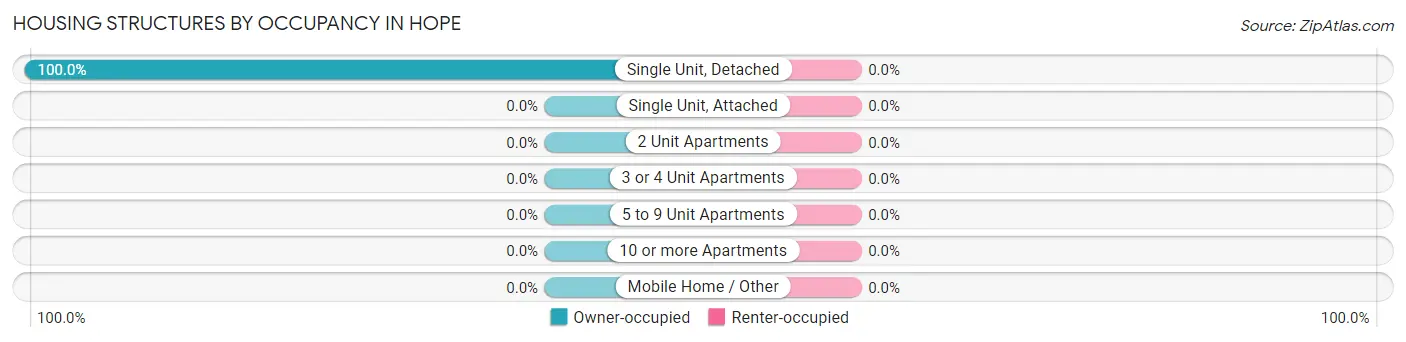
| Structure Type | Owner-occupied | Renter-occupied |
| Single Unit, Detached | 49 (100.0%) | 0 (0.0%) |
| Single Unit, Attached | 0 (0.0%) | 0 (0.0%) |
| 2 Unit Apartments | 0 (0.0%) | 0 (0.0%) |
| 3 or 4 Unit Apartments | 0 (0.0%) | 0 (0.0%) |
| 5 to 9 Unit Apartments | 0 (0.0%) | 0 (0.0%) |
| 10 or more Apartments | 0 (0.0%) | 0 (0.0%) |
| Mobile Home / Other | 0 (0.0%) | 0 (0.0%) |
| Total | 49 (100.0%) | 0 (0.0%) |
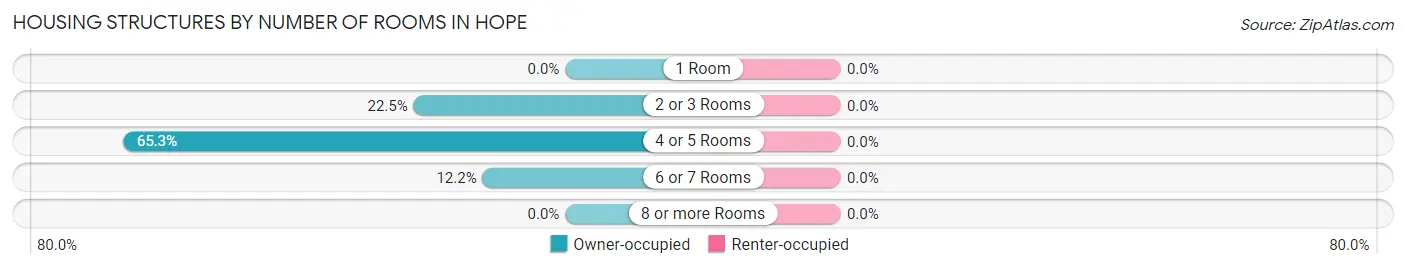
Housing Structures by Number of Rooms in Hope
| Number of Rooms | Owner-occupied | Renter-occupied |
| 1 Room | 0 (0.0%) | 0 (0.0%) |
| 2 or 3 Rooms | 11 (22.5%) | 0 (0.0%) |
| 4 or 5 Rooms | 32 (65.3%) | 0 (0.0%) |
| 6 or 7 Rooms | 6 (12.2%) | 0 (0.0%) |
| 8 or more Rooms | 0 (0.0%) | 0 (0.0%) |
| Total | 49 (100.0%) | 0 (0.0%) |
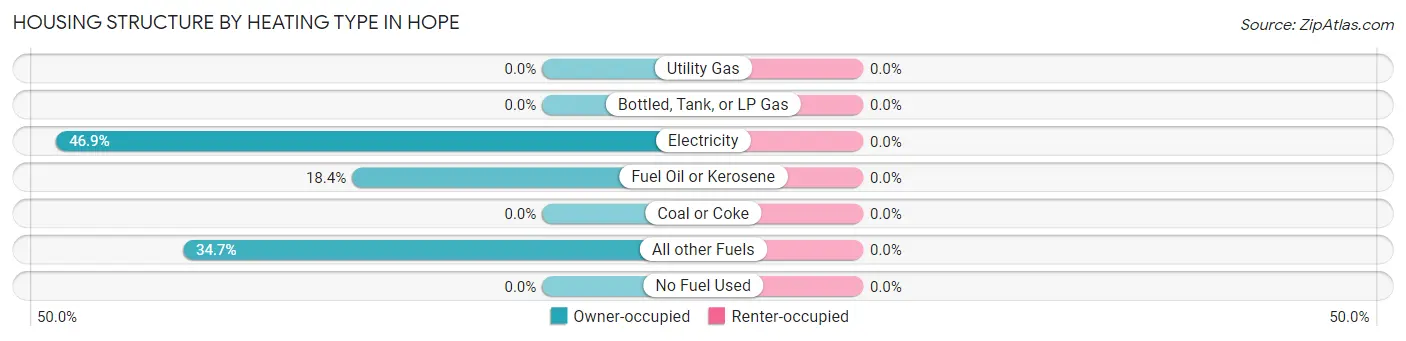
Housing Structure by Heating Type in Hope
| Heating Type | Owner-occupied | Renter-occupied |
| Utility Gas | 0 (0.0%) | 0 (0.0%) |
| Bottled, Tank, or LP Gas | 0 (0.0%) | 0 (0.0%) |
| Electricity | 23 (46.9%) | 0 (0.0%) |
| Fuel Oil or Kerosene | 9 (18.4%) | 0 (0.0%) |
| Coal or Coke | 0 (0.0%) | 0 (0.0%) |
| All other Fuels | 17 (34.7%) | 0 (0.0%) |
| No Fuel Used | 0 (0.0%) | 0 (0.0%) |
| Total | 49 (100.0%) | 0 (0.0%) |
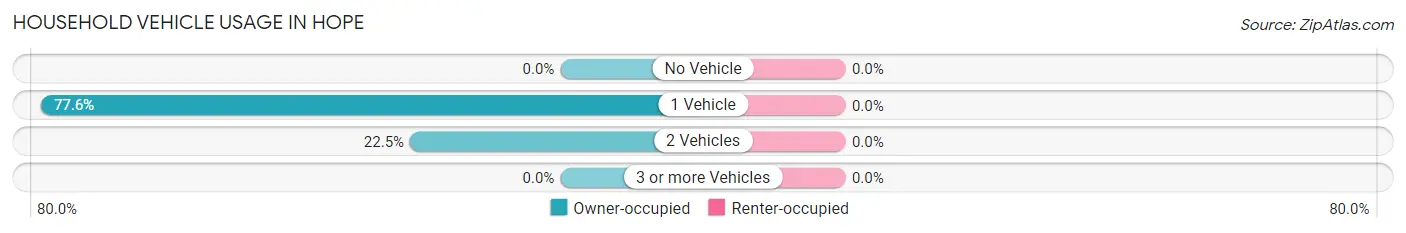
Household Vehicle Usage in Hope
| Vehicles per Household | Owner-occupied | Renter-occupied |
| No Vehicle | 0 (0.0%) | 0 (0.0%) |
| 1 Vehicle | 38 (77.5%) | 0 (0.0%) |
| 2 Vehicles | 11 (22.5%) | 0 (0.0%) |
| 3 or more Vehicles | 0 (0.0%) | 0 (0.0%) |
| Total | 49 (100.0%) | 0 (0.0%) |
Real Estate & Mortgages in Hope
Real Estate and Mortgage Overview in Hope
| Characteristic | Without Mortgage | With Mortgage |
| Housing Units | 0 | 49 |
| Median Property Value | - | - |
| Median Household Income | - | - |
| Monthly Housing Costs | - | - |
| Real Estate Taxes | - | - |
Property Value by Mortgage Status in Hope
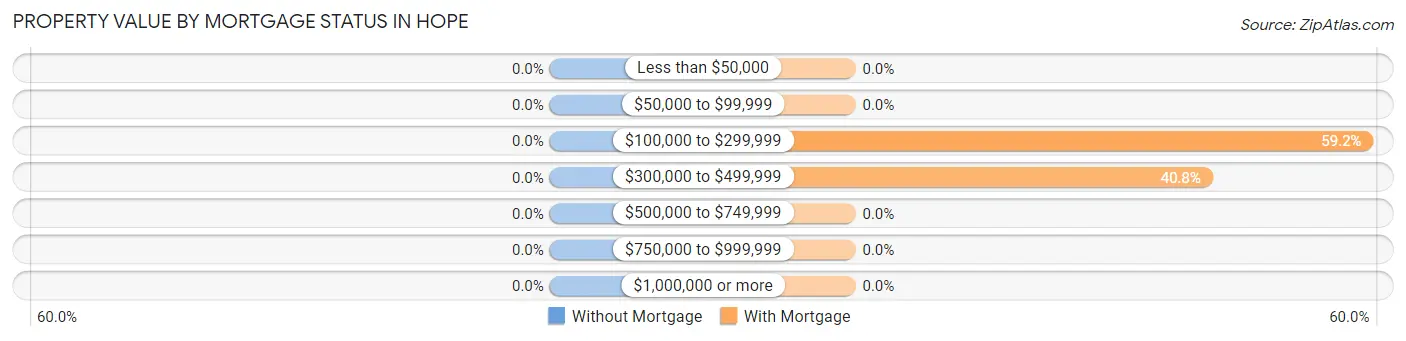
| Property Value | Without Mortgage | With Mortgage |
| Less than $50,000 | 0 (0.0%) | 0 (0.0%) |
| $50,000 to $99,999 | 0 (0.0%) | 0 (0.0%) |
| $100,000 to $299,999 | 0 (0.0%) | 29 (59.2%) |
| $300,000 to $499,999 | 0 (0.0%) | 20 (40.8%) |
| $500,000 to $749,999 | 0 (0.0%) | 0 (0.0%) |
| $750,000 to $999,999 | 0 (0.0%) | 0 (0.0%) |
| $1,000,000 or more | 0 (0.0%) | 0 (0.0%) |
| Total | 0 (0.0%) | 49 (100.0%) |
Household Income by Mortgage Status in Hope
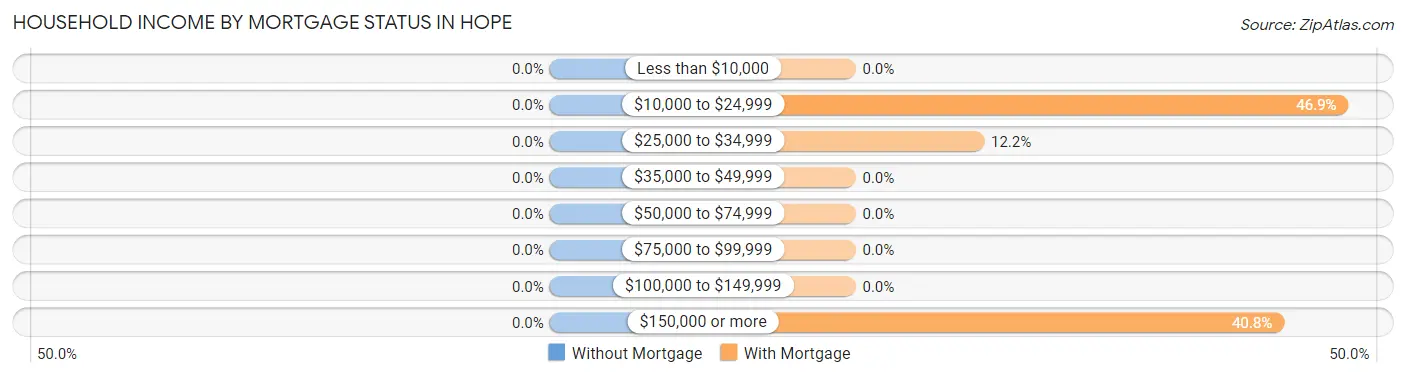
| Household Income | Without Mortgage | With Mortgage |
| Less than $10,000 | 0 (0.0%) | 0 (0.0%) |
| $10,000 to $24,999 | 0 (0.0%) | 23 (46.9%) |
| $25,000 to $34,999 | 0 (0.0%) | 6 (12.2%) |
| $35,000 to $49,999 | 0 (0.0%) | 0 (0.0%) |
| $50,000 to $74,999 | 0 (0.0%) | 0 (0.0%) |
| $75,000 to $99,999 | 0 (0.0%) | 0 (0.0%) |
| $100,000 to $149,999 | 0 (0.0%) | 0 (0.0%) |
| $150,000 or more | 0 (0.0%) | 20 (40.8%) |
| Total | 0 (0.0%) | 49 (100.0%) |
Property Value to Household Income Ratio in Hope
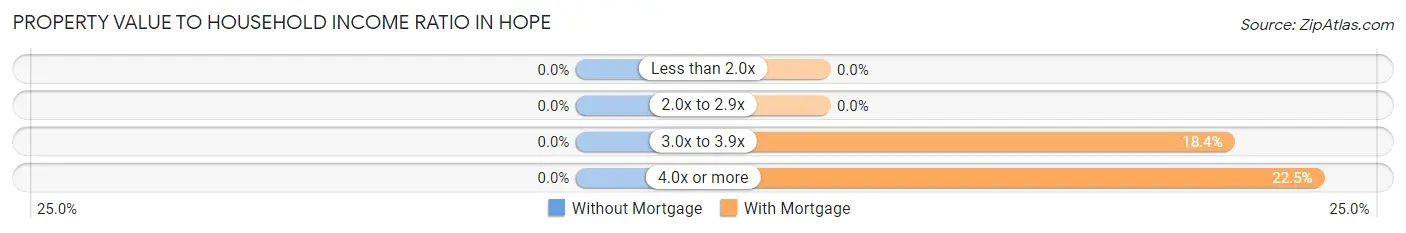
| Value-to-Income Ratio | Without Mortgage | With Mortgage |
| Less than 2.0x | 0 (0.0%) | 0 (0.0%) |
| 2.0x to 2.9x | 0 (0.0%) | 0 (0.0%) |
| 3.0x to 3.9x | 0 (0.0%) | 9 (18.4%) |
| 4.0x or more | 0 (0.0%) | 11 (22.5%) |
| Total | 0 (0.0%) | 49 (100.0%) |
Real Estate Taxes by Mortgage Status in Hope
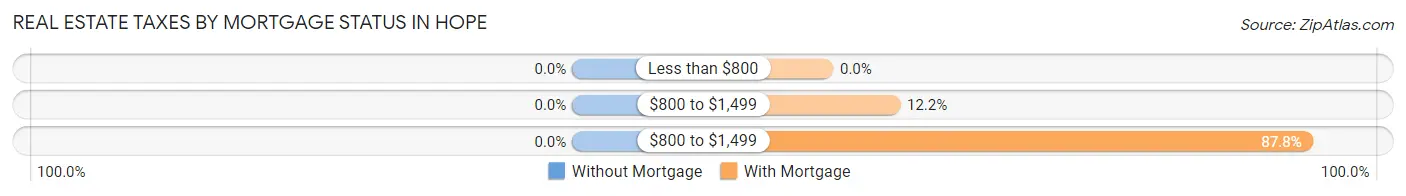
| Property Taxes | Without Mortgage | With Mortgage |
| Less than $800 | 0 (0.0%) | 0 (0.0%) |
| $800 to $1,499 | 0 (0.0%) | 6 (12.2%) |
| $800 to $1,499 | 0 (0.0%) | 43 (87.8%) |
| Total | 0 (0.0%) | 49 (100.0%) |
Health & Disability in Hope
Health Insurance Coverage by Age in Hope
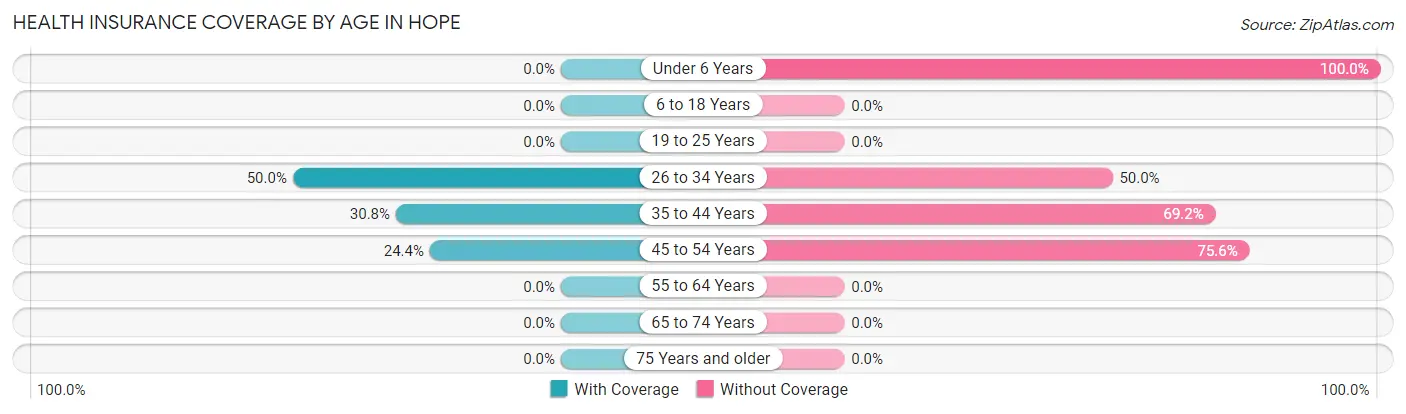
| Age Bracket | With Coverage | Without Coverage |
| Under 6 Years | 0 (0.0%) | 44 (100.0%) |
| 6 to 18 Years | 0 (0.0%) | 0 (0.0%) |
| 19 to 25 Years | 0 (0.0%) | 0 (0.0%) |
| 26 to 34 Years | 9 (50.0%) | 9 (50.0%) |
| 35 to 44 Years | 8 (30.8%) | 18 (69.2%) |
| 45 to 54 Years | 11 (24.4%) | 34 (75.6%) |
| 55 to 64 Years | 0 (0.0%) | 0 (0.0%) |
| 65 to 74 Years | 0 (0.0%) | 0 (0.0%) |
| 75 Years and older | 0 (0.0%) | 0 (0.0%) |
| Total | 28 (21.0%) | 105 (78.9%) |
Health Insurance Coverage by Citizenship Status in Hope
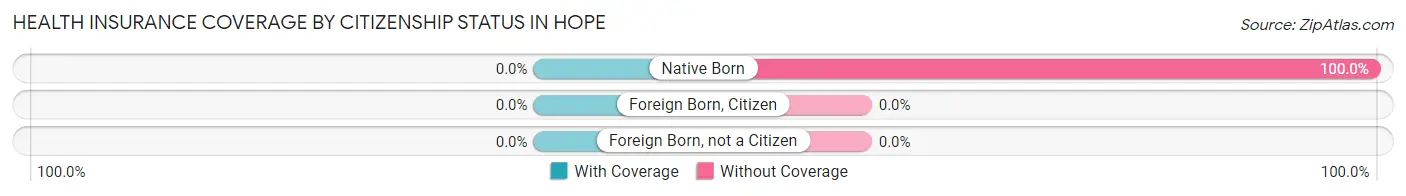
| Citizenship Status | With Coverage | Without Coverage |
| Native Born | 0 (0.0%) | 44 (100.0%) |
| Foreign Born, Citizen | 0 (0.0%) | 0 (0.0%) |
| Foreign Born, not a Citizen | 0 (0.0%) | 0 (0.0%) |
Health Insurance Coverage by Household Income in Hope
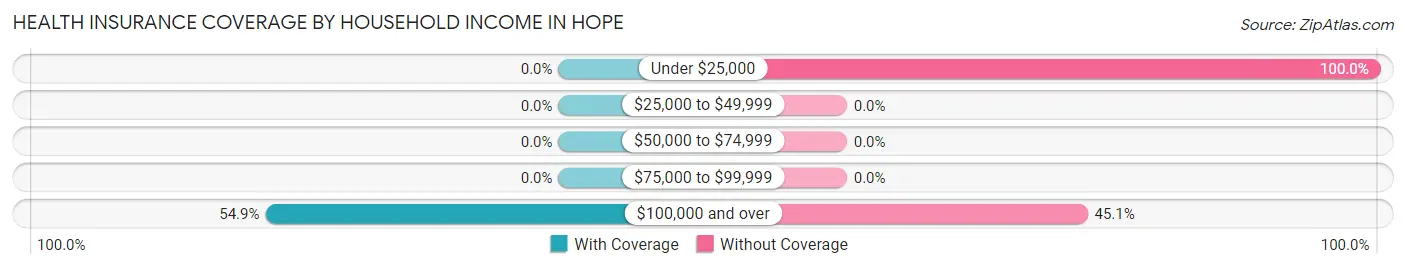
| Household Income | With Coverage | Without Coverage |
| Under $25,000 | 0 (0.0%) | 82 (100.0%) |
| $25,000 to $49,999 | 0 (0.0%) | 0 (0.0%) |
| $50,000 to $74,999 | 0 (0.0%) | 0 (0.0%) |
| $75,000 to $99,999 | 0 (0.0%) | 0 (0.0%) |
| $100,000 and over | 28 (54.9%) | 23 (45.1%) |
Public vs Private Health Insurance Coverage by Age in Hope
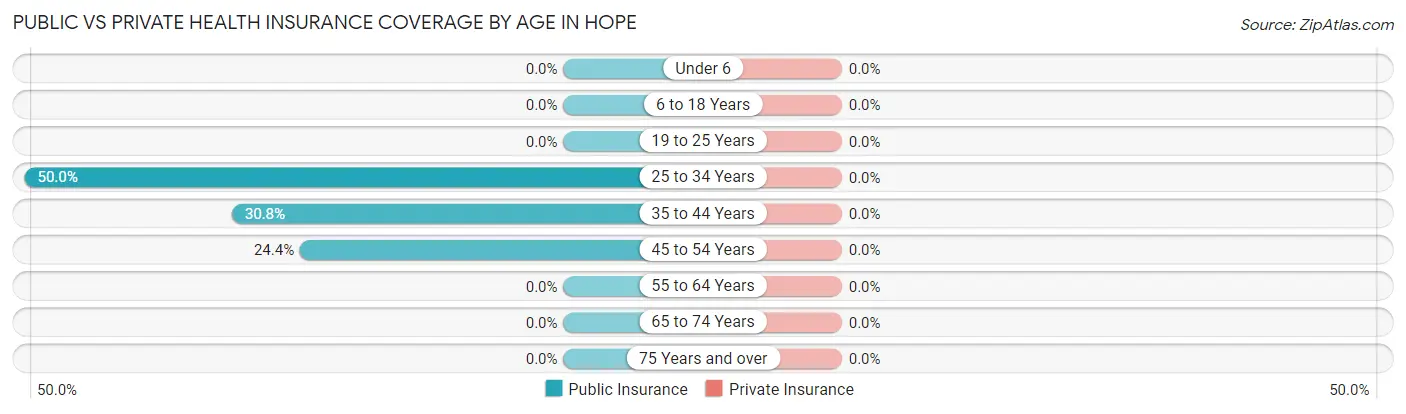
| Age Bracket | Public Insurance | Private Insurance |
| Under 6 | 0 (0.0%) | 0 (0.0%) |
| 6 to 18 Years | 0 (0.0%) | 0 (0.0%) |
| 19 to 25 Years | 0 (0.0%) | 0 (0.0%) |
| 25 to 34 Years | 9 (50.0%) | 0 (0.0%) |
| 35 to 44 Years | 8 (30.8%) | 0 (0.0%) |
| 45 to 54 Years | 11 (24.4%) | 0 (0.0%) |
| 55 to 64 Years | 0 (0.0%) | 0 (0.0%) |
| 65 to 74 Years | 0 (0.0%) | 0 (0.0%) |
| 75 Years and over | 0 (0.0%) | 0 (0.0%) |
| Total | 28 (21.0%) | 0 (0.0%) |
Disability Status by Sex by Age in Hope
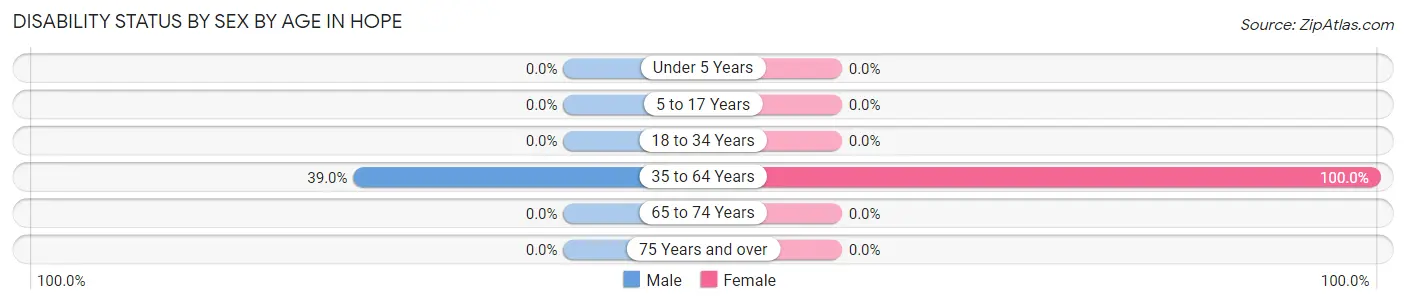
| Age Bracket | Male | Female |
| Under 5 Years | 0 (0.0%) | 0 (0.0%) |
| 5 to 17 Years | 0 (0.0%) | 0 (0.0%) |
| 18 to 34 Years | 0 (0.0%) | 0 (0.0%) |
| 35 to 64 Years | 23 (39.0%) | 12 (100.0%) |
| 65 to 74 Years | 0 (0.0%) | 0 (0.0%) |
| 75 Years and over | 0 (0.0%) | 0 (0.0%) |
Disability Class by Sex by Age in Hope
Disability Class: Hearing Difficulty

| Age Bracket | Male | Female |
| Under 5 Years | 0 (0.0%) | 0 (0.0%) |
| 5 to 17 Years | 0 (0.0%) | 0 (0.0%) |
| 18 to 34 Years | 0 (0.0%) | 0 (0.0%) |
| 35 to 64 Years | 0 (0.0%) | 12 (100.0%) |
| 65 to 74 Years | 0 (0.0%) | 0 (0.0%) |
| 75 Years and over | 0 (0.0%) | 0 (0.0%) |
Disability Class: Vision Difficulty
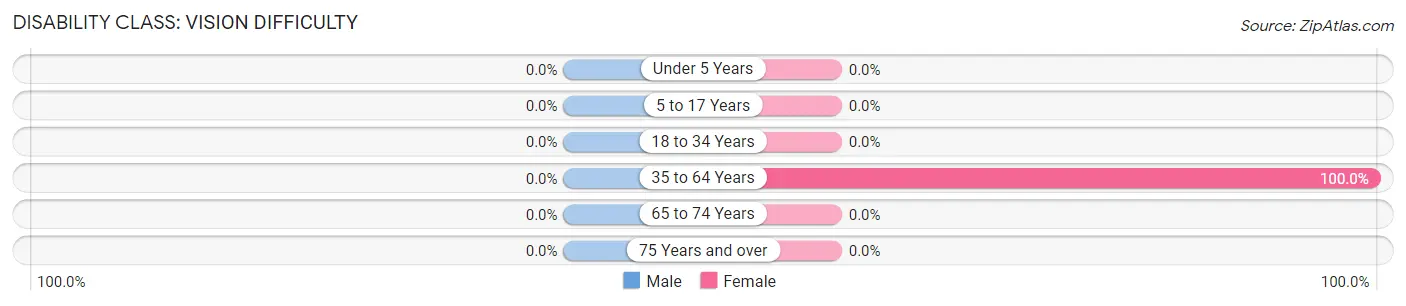
| Age Bracket | Male | Female |
| Under 5 Years | 0 (0.0%) | 0 (0.0%) |
| 5 to 17 Years | 0 (0.0%) | 0 (0.0%) |
| 18 to 34 Years | 0 (0.0%) | 0 (0.0%) |
| 35 to 64 Years | 0 (0.0%) | 12 (100.0%) |
| 65 to 74 Years | 0 (0.0%) | 0 (0.0%) |
| 75 Years and over | 0 (0.0%) | 0 (0.0%) |
Disability Class: Cognitive Difficulty

| Age Bracket | Male | Female |
| 5 to 17 Years | 0 (0.0%) | 0 (0.0%) |
| 18 to 34 Years | 0 (0.0%) | 0 (0.0%) |
| 35 to 64 Years | 0 (0.0%) | 12 (100.0%) |
| 65 to 74 Years | 0 (0.0%) | 0 (0.0%) |
| 75 Years and over | 0 (0.0%) | 0 (0.0%) |
Disability Class: Ambulatory Difficulty

| Age Bracket | Male | Female |
| 5 to 17 Years | 0 (0.0%) | 0 (0.0%) |
| 18 to 34 Years | 0 (0.0%) | 0 (0.0%) |
| 35 to 64 Years | 0 (0.0%) | 12 (100.0%) |
| 65 to 74 Years | 0 (0.0%) | 0 (0.0%) |
| 75 Years and over | 0 (0.0%) | 0 (0.0%) |
Disability Class: Self-Care Difficulty
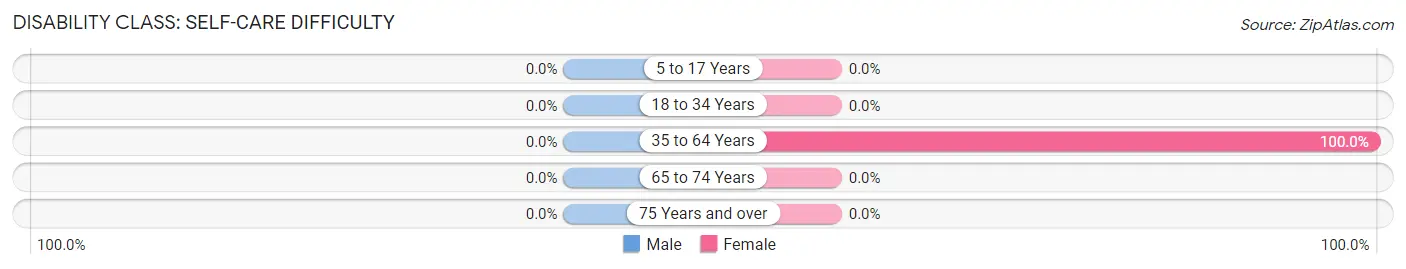
| Age Bracket | Male | Female |
| 5 to 17 Years | 0 (0.0%) | 0 (0.0%) |
| 18 to 34 Years | 0 (0.0%) | 0 (0.0%) |
| 35 to 64 Years | 0 (0.0%) | 12 (100.0%) |
| 65 to 74 Years | 0 (0.0%) | 0 (0.0%) |
| 75 Years and over | 0 (0.0%) | 0 (0.0%) |
Technology Access in Hope
Computing Device Access in Hope
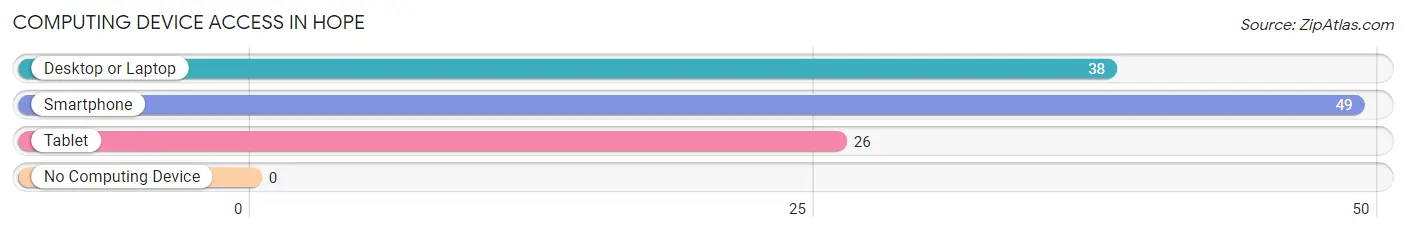
| Device Type | # Households | % Households |
| Desktop or Laptop | 38 | 77.5% |
| Smartphone | 49 | 100.0% |
| Tablet | 26 | 53.1% |
| No Computing Device | 0 | 0.0% |
| Total | 49 | 100.0% |
Internet Access in Hope
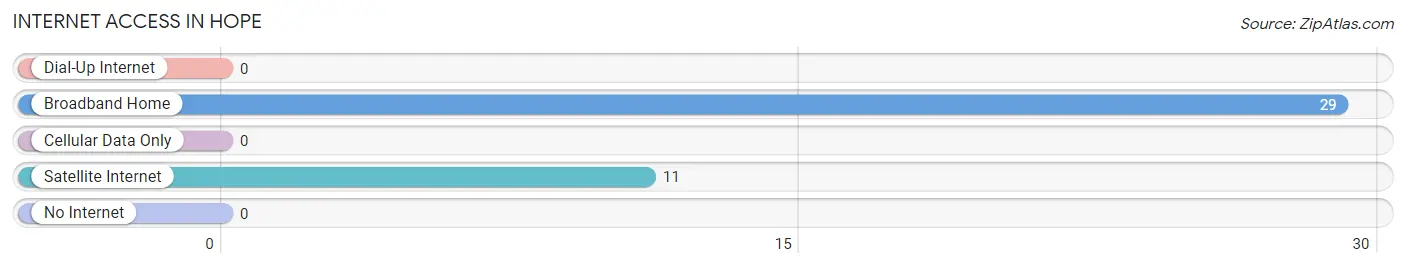
| Internet Type | # Households | % Households |
| Dial-Up Internet | 0 | 0.0% |
| Broadband Home | 29 | 59.2% |
| Cellular Data Only | 0 | 0.0% |
| Satellite Internet | 11 | 22.5% |
| No Internet | 0 | 0.0% |
| Total | 49 | 100.0% |
Hope Summary
Hope, Alaska is a small city located in the Kenai Peninsula Borough of Alaska. It is situated on the Turnagain Arm of the Cook Inlet, approximately 50 miles south of Anchorage. The city was founded in 1895 by gold prospectors and has a population of 1,722 as of the 2010 census.
Geography
Hope is located at 60°47'N 149°41'W, at an elevation of approximately 100 feet. The city is situated on the Turnagain Arm of the Cook Inlet, approximately 50 miles south of Anchorage. The area is characterized by its mountainous terrain, with the Chugach Mountains to the east and the Kenai Mountains to the west. The city is surrounded by the Chugach National Forest, which provides a variety of recreational opportunities.
Climate
Hope has a subarctic climate, with cold winters and mild summers. The average high temperature in July is 63°F, and the average low temperature in January is 8°F. The area receives an average of 44 inches of precipitation annually, with the majority of it falling in the form of snow.
Economy
Hope’s economy is largely based on tourism and fishing. The city is a popular destination for sport fishing, and is home to several charter fishing companies. The city also has a number of bed and breakfasts, restaurants, and gift shops that cater to tourists. In addition, the city is home to a number of small businesses, including a sawmill, a boat repair shop, and a general store.
Demographics
As of the 2010 census, Hope had a population of 1,722. The racial makeup of the city was 94.2% White, 0.7% Native American, 0.3% Asian, 0.2% Pacific Islander, 0.1% Black or African American, and 4.5% from two or more races. The median household income was $50,938, and the median family income was $58,750.
Education
Hope is served by the Kenai Peninsula Borough School District. The city is home to Hope Elementary School, which serves students in grades K-6. The nearest secondary school is Homer High School, located approximately 30 miles away in Homer.
Conclusion
Hope, Alaska is a small city located in the Kenai Peninsula Borough of Alaska. It is situated on the Turnagain Arm of the Cook Inlet, approximately 50 miles south of Anchorage. The city was founded in 1895 by gold prospectors and has a population of 1,722 as of the 2010 census. The economy of Hope is largely based on tourism and fishing, and the city is home to a number of small businesses. The city is served by the Kenai Peninsula Borough School District, and is home to Hope Elementary School.
Common Questions
What is Per Capita Income in Hope?
Per Capita income in Hope is $23,968.
What is the Median Family Income in Hope?
Median Family Income in Hope is $136,944.
What is Inequality or Gini Index in Hope?
Inequality or Gini Index in Hope is 0.58.
What is the Total Population of Hope?
Total Population of Hope is 133.
What is the Total Male Population of Hope?
Total Male Population of Hope is 59.
What is the Total Female Population of Hope?
Total Female Population of Hope is 74.
What is the Ratio of Males per 100 Females in Hope?
There are 79.73 Males per 100 Females in Hope.
What is the Ratio of Females per 100 Males in Hope?
There are 125.42 Females per 100 Males in Hope.
What is the Median Population Age in Hope?
Median Population Age in Hope is 39.4 Years.
What is the Average Family Size in Hope
Average Family Size in Hope is 4.2 People.
What is the Average Household Size in Hope
Average Household Size in Hope is 2.7 People.
How Large is the Labor Force in Hope?
There are 71 People in the Labor Forcein in Hope.
What is the Percentage of People in the Labor Force in Hope?
79.8% of People are in the Labor Force in Hope.
What is the Unemployment Rate in Hope?
Unemployment Rate in Hope is 32.4%.