Drakesboro, KY Map & Demographics
Drakesboro Map
Drakesboro Overview
$18,525
PER CAPITA INCOME
$65,000
AVG FAMILY INCOME
$39,659
AVG HOUSEHOLD INCOME
66.8%
WAGE / INCOME GAP [ % ]
33.2¢/ $1
WAGE / INCOME GAP [ $ ]
0.41
INEQUALITY / GINI INDEX
491
TOTAL POPULATION
209
MALE POPULATION
282
FEMALE POPULATION
74.11
MALES / 100 FEMALES
134.93
FEMALES / 100 MALES
42.7
MEDIAN AGE
3.7
AVG FAMILY SIZE
3.0
AVG HOUSEHOLD SIZE
166
LABOR FORCE [ PEOPLE ]
43.0%
PERCENT IN LABOR FORCE
4.8%
UNEMPLOYMENT RATE
Drakesboro Zip Codes
Drakesboro Area Codes
Income in Drakesboro
Income Overview in Drakesboro
Per Capita Income in Drakesboro is $18,525, while median incomes of families and households are $65,000 and $39,659 respectively.
| Characteristic | Number | Measure |
| Per Capita Income | 491 | $18,525 |
| Median Family Income | 120 | $65,000 |
| Mean Family Income | 120 | $59,623 |
| Median Household Income | 163 | $39,659 |
| Mean Household Income | 163 | $51,983 |
| Income Deficit | 120 | $0 |
| Wage / Income Gap (%) | 491 | 66.85% |
| Wage / Income Gap ($) | 491 | 33.15¢ per $1 |
| Gini / Inequality Index | 491 | 0.41 |
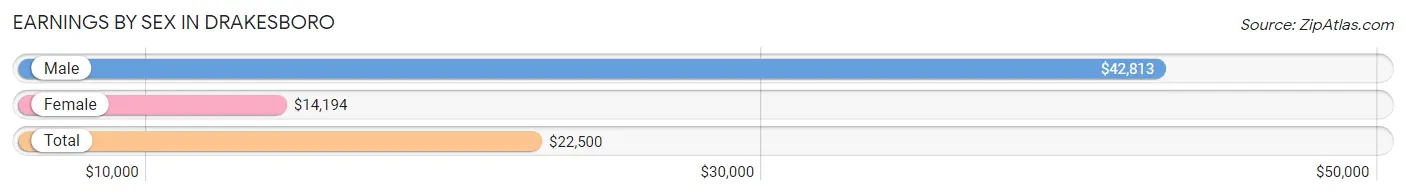
Earnings by Sex in Drakesboro
Average Earnings in Drakesboro are $22,500, $42,813 for men and $14,194 for women, a difference of 66.8%.
| Sex | Number | Average Earnings |
| Male | 74 (41.6%) | $42,813 |
| Female | 104 (58.4%) | $14,194 |
| Total | 178 (100.0%) | $22,500 |
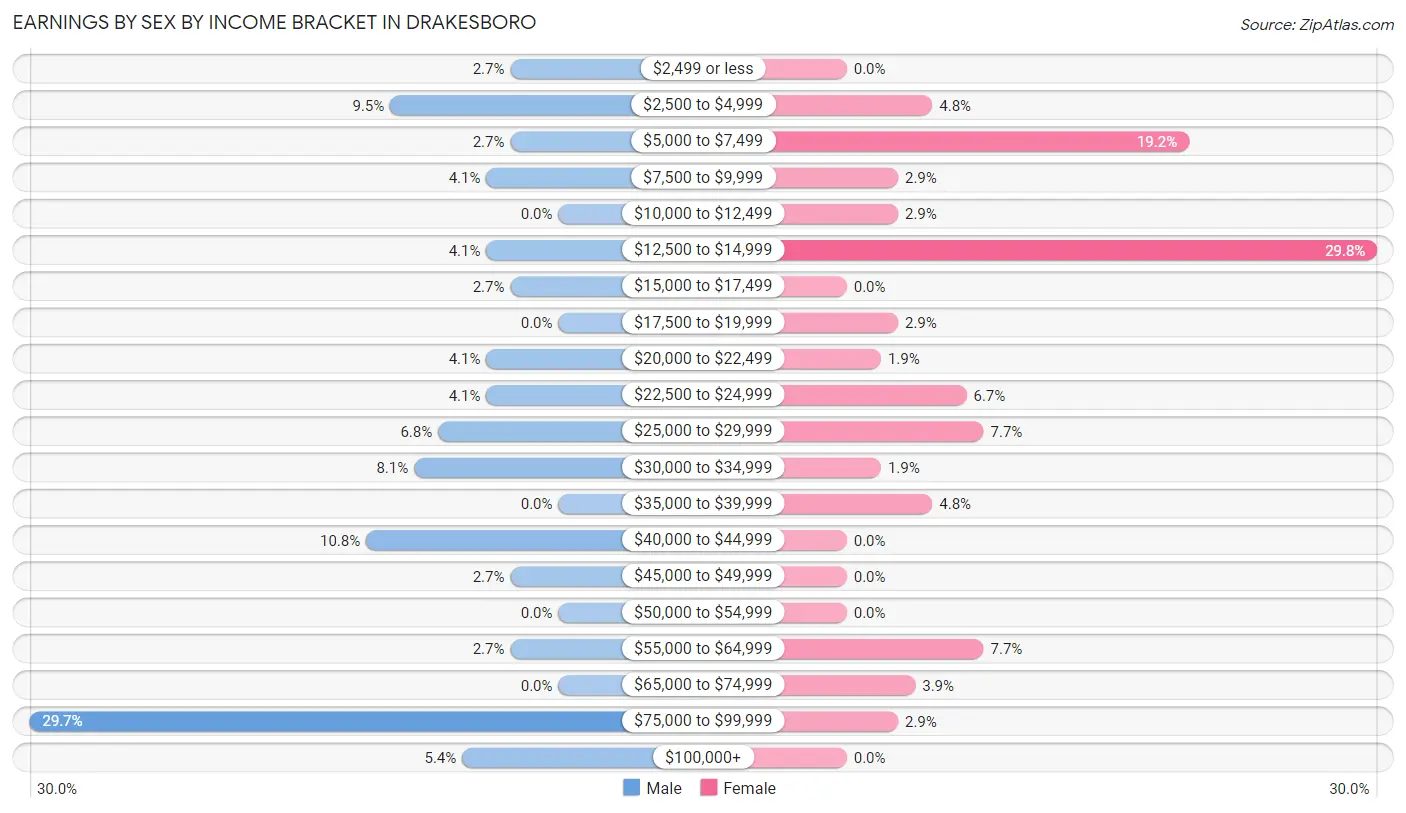
Earnings by Sex by Income Bracket in Drakesboro
The most common earnings brackets in Drakesboro are $75,000 to $99,999 for men (22 | 29.7%) and $12,500 to $14,999 for women (31 | 29.8%).
| Income | Male | Female |
| $2,499 or less | 2 (2.7%) | 0 (0.0%) |
| $2,500 to $4,999 | 7 (9.5%) | 5 (4.8%) |
| $5,000 to $7,499 | 2 (2.7%) | 20 (19.2%) |
| $7,500 to $9,999 | 3 (4.1%) | 3 (2.9%) |
| $10,000 to $12,499 | 0 (0.0%) | 3 (2.9%) |
| $12,500 to $14,999 | 3 (4.1%) | 31 (29.8%) |
| $15,000 to $17,499 | 2 (2.7%) | 0 (0.0%) |
| $17,500 to $19,999 | 0 (0.0%) | 3 (2.9%) |
| $20,000 to $22,499 | 3 (4.1%) | 2 (1.9%) |
| $22,500 to $24,999 | 3 (4.1%) | 7 (6.7%) |
| $25,000 to $29,999 | 5 (6.8%) | 8 (7.7%) |
| $30,000 to $34,999 | 6 (8.1%) | 2 (1.9%) |
| $35,000 to $39,999 | 0 (0.0%) | 5 (4.8%) |
| $40,000 to $44,999 | 8 (10.8%) | 0 (0.0%) |
| $45,000 to $49,999 | 2 (2.7%) | 0 (0.0%) |
| $50,000 to $54,999 | 0 (0.0%) | 0 (0.0%) |
| $55,000 to $64,999 | 2 (2.7%) | 8 (7.7%) |
| $65,000 to $74,999 | 0 (0.0%) | 4 (3.8%) |
| $75,000 to $99,999 | 22 (29.7%) | 3 (2.9%) |
| $100,000+ | 4 (5.4%) | 0 (0.0%) |
| Total | 74 (100.0%) | 104 (100.0%) |
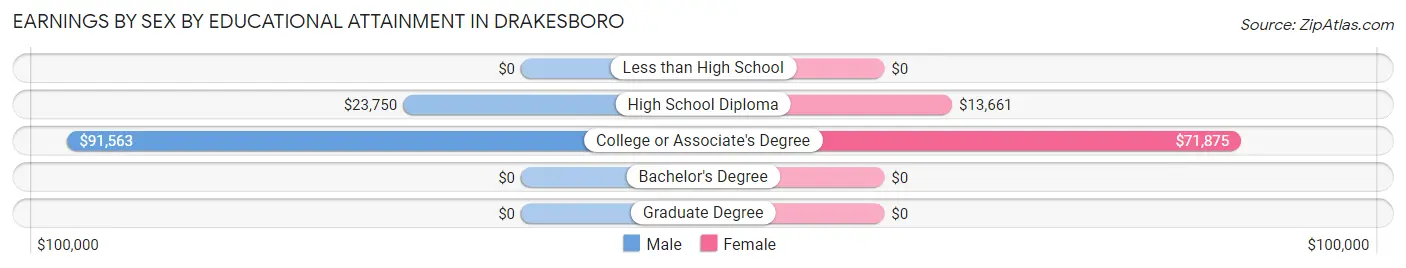
Earnings by Sex by Educational Attainment in Drakesboro
Average earnings in Drakesboro are $43,281 for men and $14,375 for women, a difference of 66.8%. Men with an educational attainment of college or associate's degree enjoy the highest average annual earnings of $91,563, while those with high school diploma education earn the least with $23,750. Women with an educational attainment of college or associate's degree earn the most with the average annual earnings of $71,875, while those with high school diploma education have the smallest earnings of $13,661.
| Educational Attainment | Male Income | Female Income |
| Less than High School | - | - |
| High School Diploma | $23,750 | $13,661 |
| College or Associate's Degree | $91,563 | $71,875 |
| Bachelor's Degree | - | - |
| Graduate Degree | - | - |
| Total | $43,281 | $14,375 |
Family Income in Drakesboro
Family Income Brackets in Drakesboro
According to the Drakesboro family income data, there are 31 families falling into the $75,000 to $99,999 income range, which is the most common income bracket and makes up 25.8% of all families.
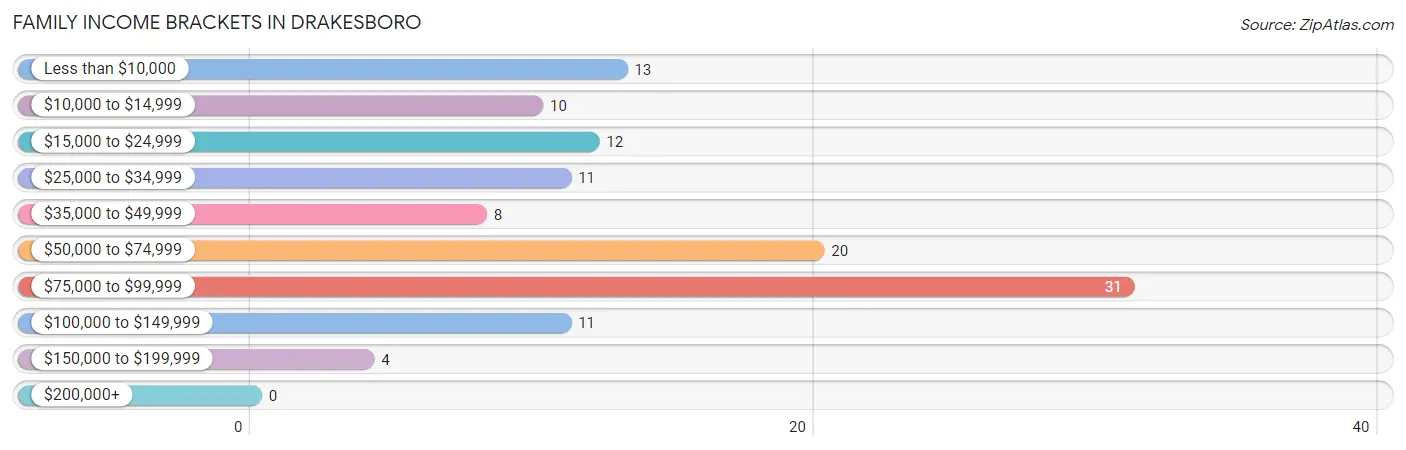
| Income Bracket | # Families | % Families |
| Less than $10,000 | 13 | 10.8% |
| $10,000 to $14,999 | 10 | 8.3% |
| $15,000 to $24,999 | 12 | 10.0% |
| $25,000 to $34,999 | 11 | 9.2% |
| $35,000 to $49,999 | 8 | 6.7% |
| $50,000 to $74,999 | 20 | 16.7% |
| $75,000 to $99,999 | 31 | 25.8% |
| $100,000 to $149,999 | 11 | 9.2% |
| $150,000 to $199,999 | 4 | 3.3% |
| $200,000+ | 0 | 0.0% |
Family Income by Famaliy Size in Drakesboro
3-person families (32 | 26.7%) account for the highest median family income in Drakesboro with $87,857 per family, while 3-person families (32 | 26.7%) have the highest median income of $29,286 per family member.
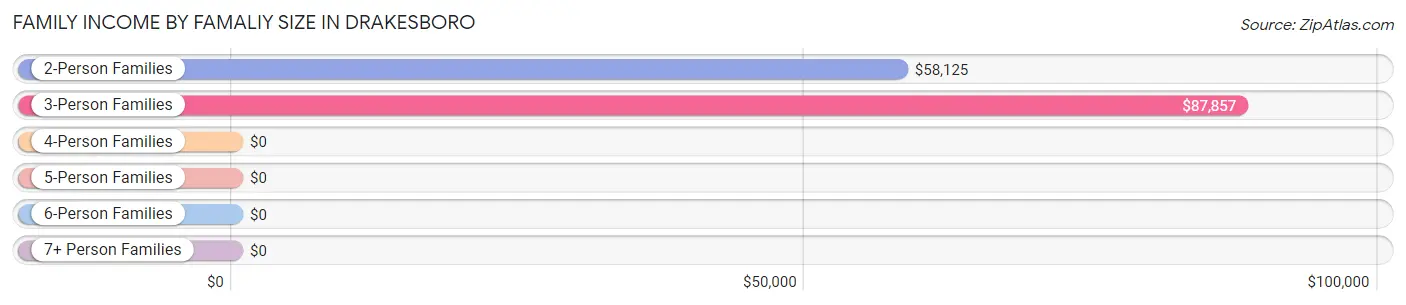
| Income Bracket | # Families | Median Income |
| 2-Person Families | 61 (50.8%) | $58,125 |
| 3-Person Families | 32 (26.7%) | $87,857 |
| 4-Person Families | 8 (6.7%) | $0 |
| 5-Person Families | 9 (7.5%) | $0 |
| 6-Person Families | 0 (0.0%) | $0 |
| 7+ Person Families | 10 (8.3%) | $0 |
| Total | 120 (100.0%) | $65,000 |
Family Income by Number of Earners in Drakesboro
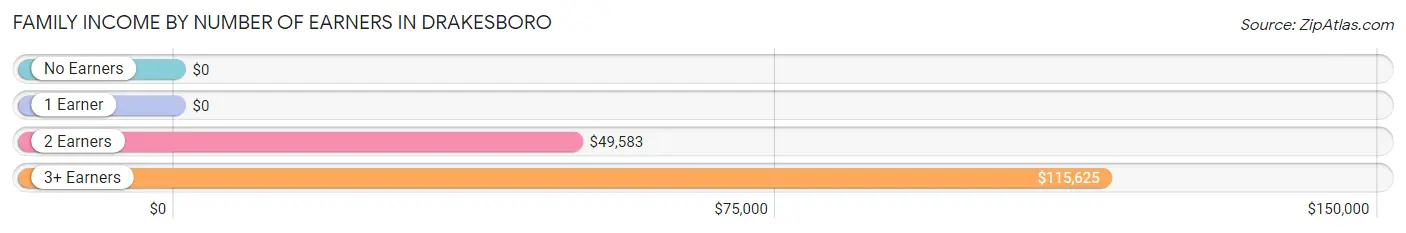
| Number of Earners | # Families | Median Income |
| No Earners | 33 (27.5%) | $0 |
| 1 Earner | 55 (45.8%) | $0 |
| 2 Earners | 15 (12.5%) | $49,583 |
| 3+ Earners | 17 (14.2%) | $115,625 |
| Total | 120 (100.0%) | $65,000 |
Household Income in Drakesboro
Household Income Brackets in Drakesboro
With 31 households falling in the category, the $75,000 to $99,999 income range is the most frequent in Drakesboro, accounting for 19.0% of all households.
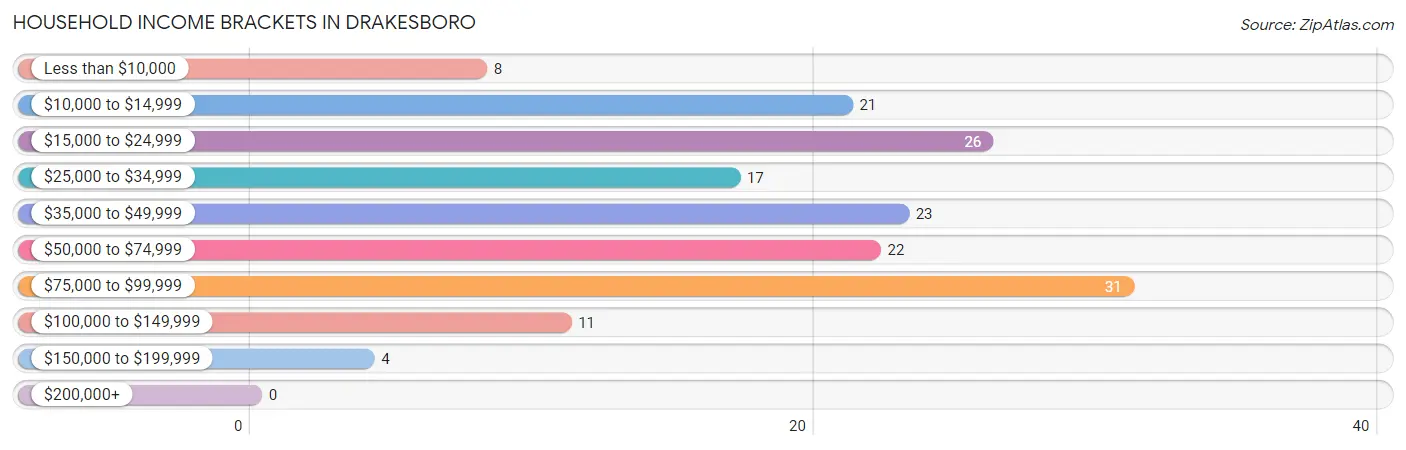
| Income Bracket | # Households | % Households |
| Less than $10,000 | 8 | 4.9% |
| $10,000 to $14,999 | 21 | 12.9% |
| $15,000 to $24,999 | 26 | 16.0% |
| $25,000 to $34,999 | 17 | 10.4% |
| $35,000 to $49,999 | 23 | 14.1% |
| $50,000 to $74,999 | 22 | 13.5% |
| $75,000 to $99,999 | 31 | 19.0% |
| $100,000 to $149,999 | 11 | 6.7% |
| $150,000 to $199,999 | 4 | 2.5% |
| $200,000+ | 0 | 0.0% |
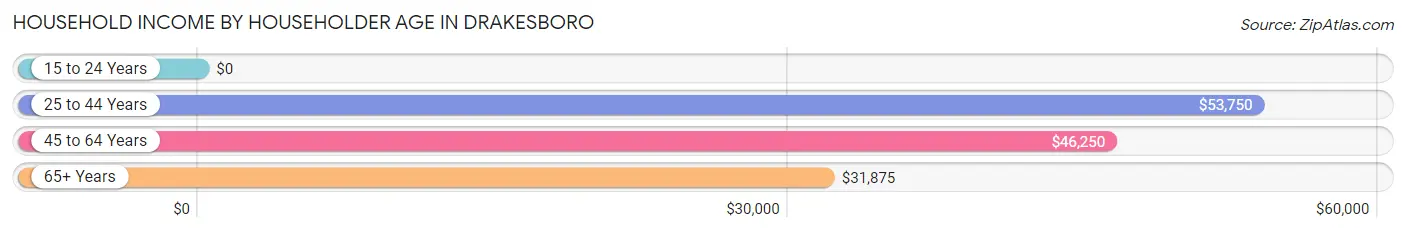
Household Income by Householder Age in Drakesboro
The median household income in Drakesboro is $39,659, with the highest median household income of $53,750 found in the 25 to 44 years age bracket for the primary householder. A total of 28 households (17.2%) fall into this category.
| Income Bracket | # Households | Median Income |
| 15 to 24 Years | 0 (0.0%) | $0 |
| 25 to 44 Years | 28 (17.2%) | $53,750 |
| 45 to 64 Years | 74 (45.4%) | $46,250 |
| 65+ Years | 61 (37.4%) | $31,875 |
| Total | 163 (100.0%) | $39,659 |
Poverty in Drakesboro
Income Below Poverty by Sex and Age in Drakesboro
With 35.9% poverty level for males and 35.8% for females among the residents of Drakesboro, under 5 year old males and 12 to 14 year old females are the most vulnerable to poverty, with 21 males (100.0%) and 20 females (100.0%) in their respective age groups living below the poverty level.
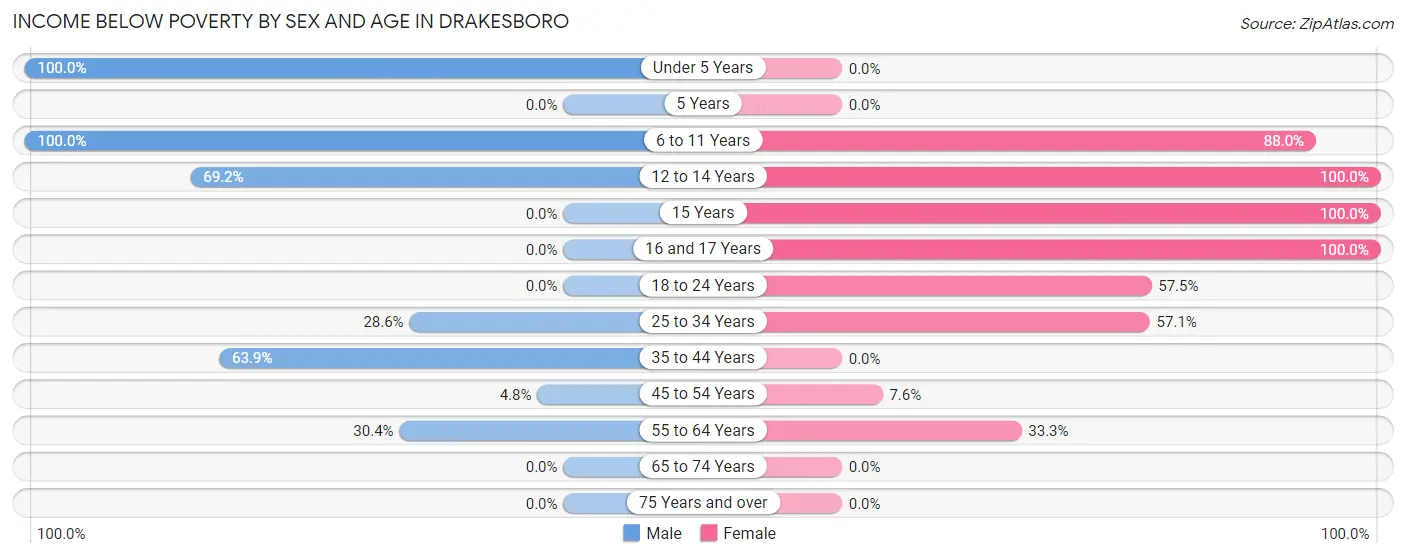
| Age Bracket | Male | Female |
| Under 5 Years | 21 (100.0%) | 0 (0.0%) |
| 5 Years | 0 (0.0%) | 0 (0.0%) |
| 6 to 11 Years | 10 (100.0%) | 22 (88.0%) |
| 12 to 14 Years | 9 (69.2%) | 20 (100.0%) |
| 15 Years | 0 (0.0%) | 3 (100.0%) |
| 16 and 17 Years | 0 (0.0%) | 3 (100.0%) |
| 18 to 24 Years | 0 (0.0%) | 27 (57.5%) |
| 25 to 34 Years | 2 (28.6%) | 8 (57.1%) |
| 35 to 44 Years | 23 (63.9%) | 0 (0.0%) |
| 45 to 54 Years | 3 (4.8%) | 4 (7.5%) |
| 55 to 64 Years | 7 (30.4%) | 14 (33.3%) |
| 65 to 74 Years | 0 (0.0%) | 0 (0.0%) |
| 75 Years and over | 0 (0.0%) | 0 (0.0%) |
| Total | 75 (35.9%) | 101 (35.8%) |
Income Above Poverty by Sex and Age in Drakesboro
According to the poverty statistics in Drakesboro, males aged 16 and 17 years and females aged under 5 years are the age groups that are most secure financially, with 100.0% of males and 100.0% of females in these age groups living above the poverty line.
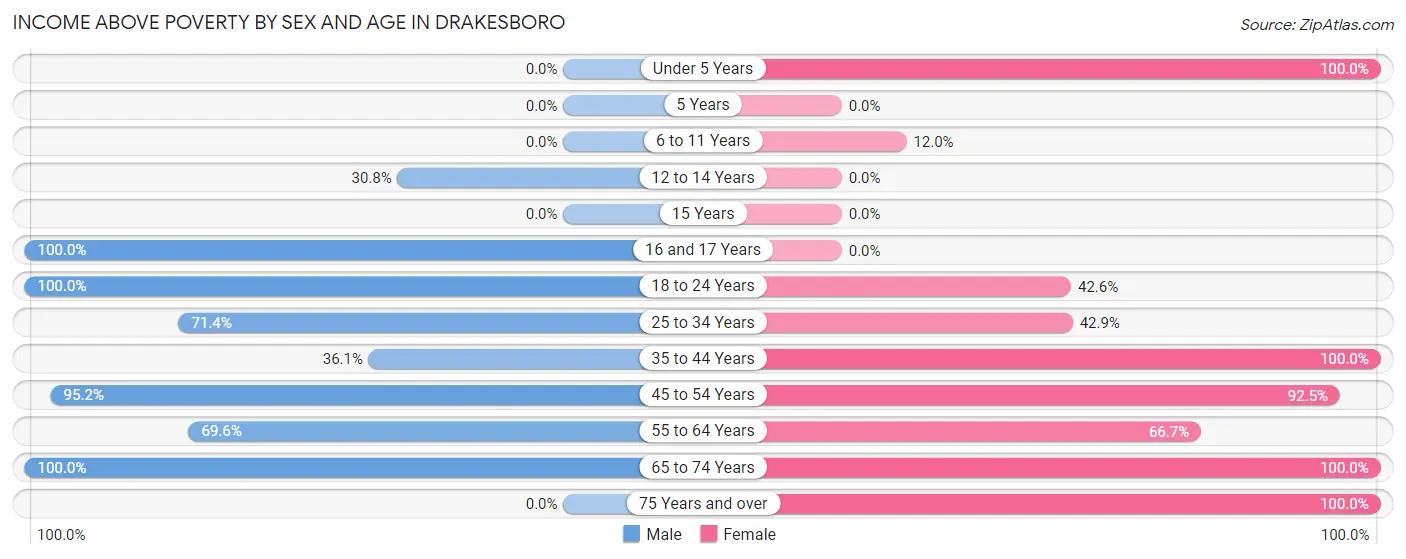
| Age Bracket | Male | Female |
| Under 5 Years | 0 (0.0%) | 13 (100.0%) |
| 5 Years | 0 (0.0%) | 0 (0.0%) |
| 6 to 11 Years | 0 (0.0%) | 3 (12.0%) |
| 12 to 14 Years | 4 (30.8%) | 0 (0.0%) |
| 15 Years | 0 (0.0%) | 0 (0.0%) |
| 16 and 17 Years | 4 (100.0%) | 0 (0.0%) |
| 18 to 24 Years | 10 (100.0%) | 20 (42.5%) |
| 25 to 34 Years | 5 (71.4%) | 6 (42.9%) |
| 35 to 44 Years | 13 (36.1%) | 24 (100.0%) |
| 45 to 54 Years | 59 (95.2%) | 49 (92.4%) |
| 55 to 64 Years | 16 (69.6%) | 28 (66.7%) |
| 65 to 74 Years | 23 (100.0%) | 19 (100.0%) |
| 75 Years and over | 0 (0.0%) | 19 (100.0%) |
| Total | 134 (64.1%) | 181 (64.2%) |
Income Below Poverty Among Married-Couple Families in Drakesboro
The poverty statistics for married-couple families in Drakesboro show that 6.1% or 4 of the total 65 families live below the poverty line. Families with no children have the highest poverty rate of 7.0%, comprising of 4 families. On the other hand, families with 1 or 2 children have the lowest poverty rate of 0.0%, which includes 0 families.
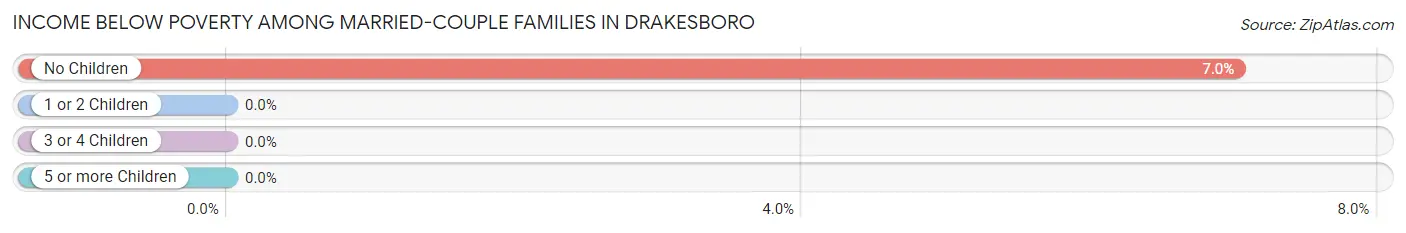
| Children | Above Poverty | Below Poverty |
| No Children | 53 (93.0%) | 4 (7.0%) |
| 1 or 2 Children | 8 (100.0%) | 0 (0.0%) |
| 3 or 4 Children | 0 (0.0%) | 0 (0.0%) |
| 5 or more Children | 0 (0.0%) | 0 (0.0%) |
| Total | 61 (93.9%) | 4 (6.1%) |
Income Below Poverty Among Single-Parent Households in Drakesboro
According to the poverty data in Drakesboro, 13.3% or 2 single-father households and 47.5% or 19 single-mother households are living below the poverty line. Among single-father households, those with 1 or 2 children have the highest poverty rate, with 2 households (100.0%) experiencing poverty. Likewise, among single-mother households, those with 3 or 4 children have the highest poverty rate, with 19 households (100.0%) falling below the poverty line.
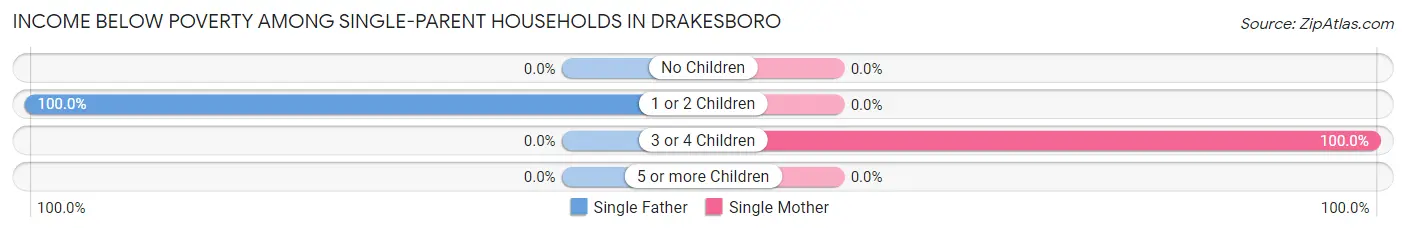
| Children | Single Father | Single Mother |
| No Children | 0 (0.0%) | 0 (0.0%) |
| 1 or 2 Children | 2 (100.0%) | 0 (0.0%) |
| 3 or 4 Children | 0 (0.0%) | 19 (100.0%) |
| 5 or more Children | 0 (0.0%) | 0 (0.0%) |
| Total | 2 (13.3%) | 19 (47.5%) |
Income Below Poverty Among Married-Couple vs Single-Parent Households in Drakesboro
The poverty data for Drakesboro shows that 4 of the married-couple family households (6.1%) and 21 of the single-parent households (38.2%) are living below the poverty level. Within the married-couple family households, those with no children have the highest poverty rate, with 4 households (7.0%) falling below the poverty line. Among the single-parent households, those with 3 or 4 children have the highest poverty rate, with 19 household (100.0%) living below poverty.
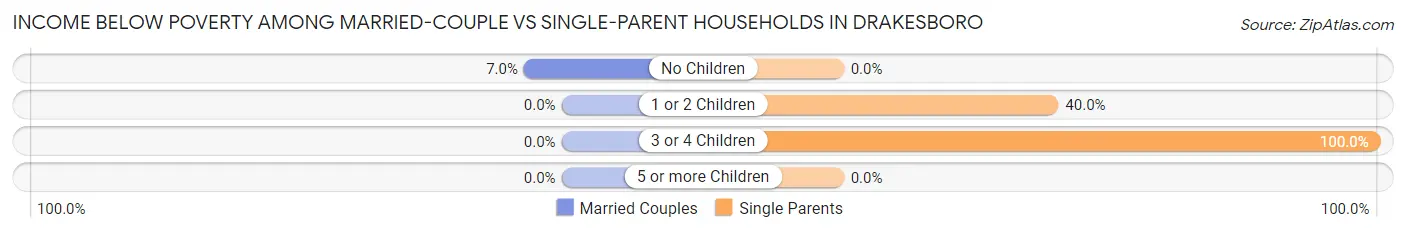
| Children | Married-Couple Families | Single-Parent Households |
| No Children | 4 (7.0%) | 0 (0.0%) |
| 1 or 2 Children | 0 (0.0%) | 2 (40.0%) |
| 3 or 4 Children | 0 (0.0%) | 19 (100.0%) |
| 5 or more Children | 0 (0.0%) | 0 (0.0%) |
| Total | 4 (6.1%) | 21 (38.2%) |
Race in Drakesboro
The most populous races in Drakesboro are White / Caucasian (429 | 87.4%), Black / African American (41 | 8.4%), and Hispanic or Latino (35 | 7.1%).
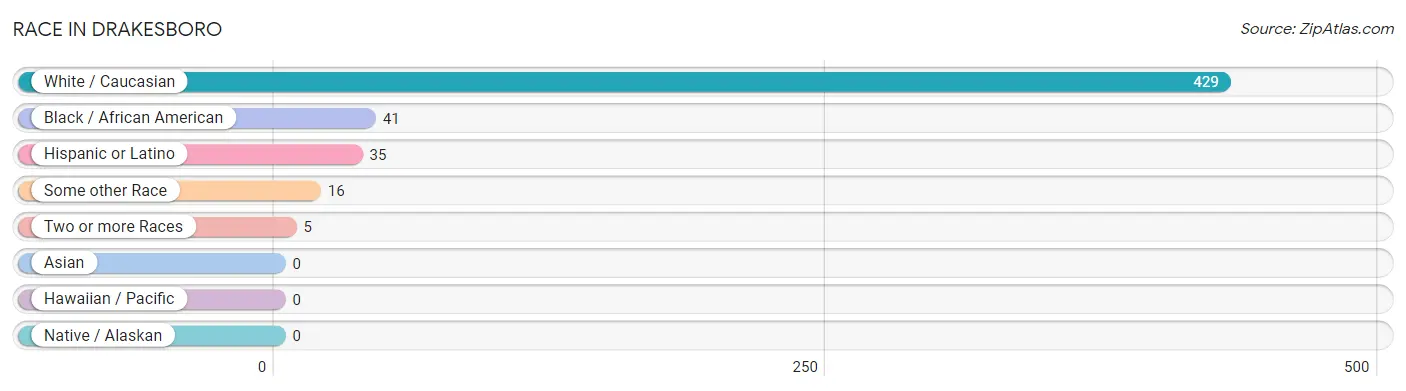
| Race | # Population | % Population |
| Asian | 0 | 0.0% |
| Black / African American | 41 | 8.4% |
| Hawaiian / Pacific | 0 | 0.0% |
| Hispanic or Latino | 35 | 7.1% |
| Native / Alaskan | 0 | 0.0% |
| White / Caucasian | 429 | 87.4% |
| Two or more Races | 5 | 1.0% |
| Some other Race | 16 | 3.3% |
| Total | 491 | 100.0% |
Ancestry in Drakesboro
The most populous ancestries reported in Drakesboro are German (124 | 25.3%), Irish (122 | 24.8%), English (56 | 11.4%), Dominican (16 | 3.3%), and European (9 | 1.8%), together accounting for 66.6% of all Drakesboro residents.
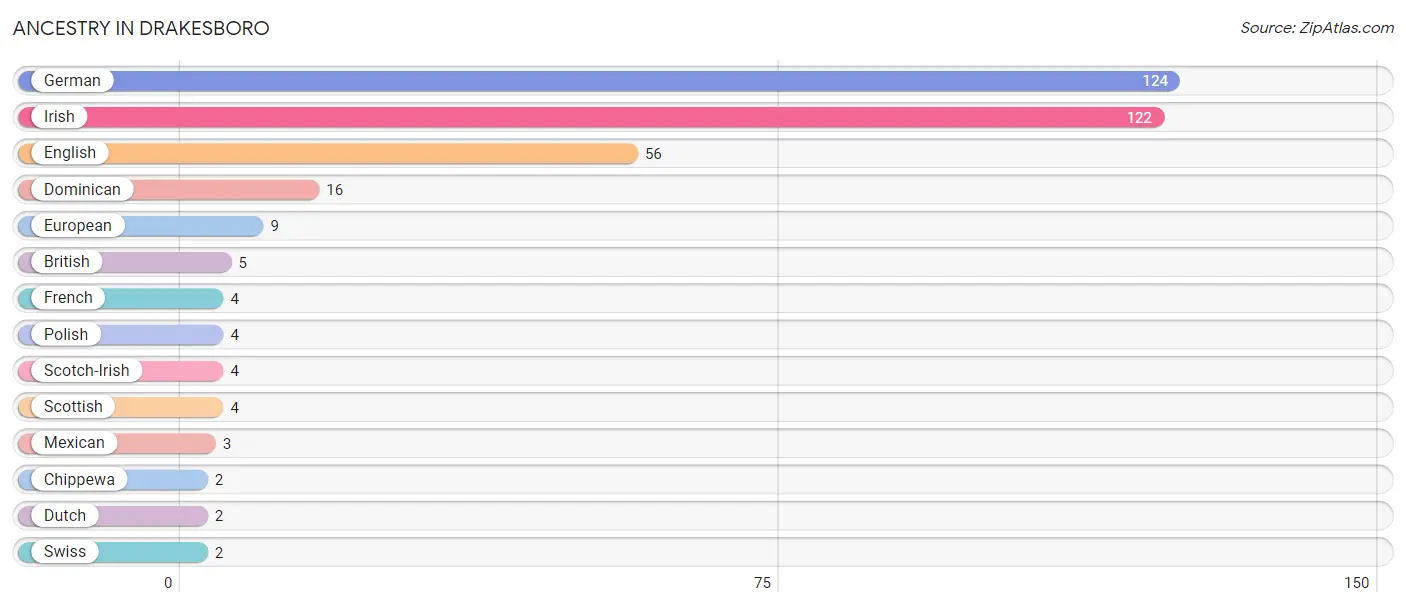
| Ancestry | # Population | % Population |
| British | 5 | 1.0% |
| Chippewa | 2 | 0.4% |
| Dominican | 16 | 3.3% |
| Dutch | 2 | 0.4% |
| English | 56 | 11.4% |
| European | 9 | 1.8% |
| French | 4 | 0.8% |
| German | 124 | 25.3% |
| Irish | 122 | 24.8% |
| Mexican | 3 | 0.6% |
| Polish | 4 | 0.8% |
| Scotch-Irish | 4 | 0.8% |
| Scottish | 4 | 0.8% |
| Swiss | 2 | 0.4% | View All 14 Rows |
Immigrants in Drakesboro

| Immigration Origin | # Population | % Population | View All 0 Rows |
Sex and Age in Drakesboro
Sex and Age in Drakesboro
The most populous age groups in Drakesboro are 45 to 49 Years (46 | 22.0%) for men and 45 to 49 Years (40 | 14.2%) for women.
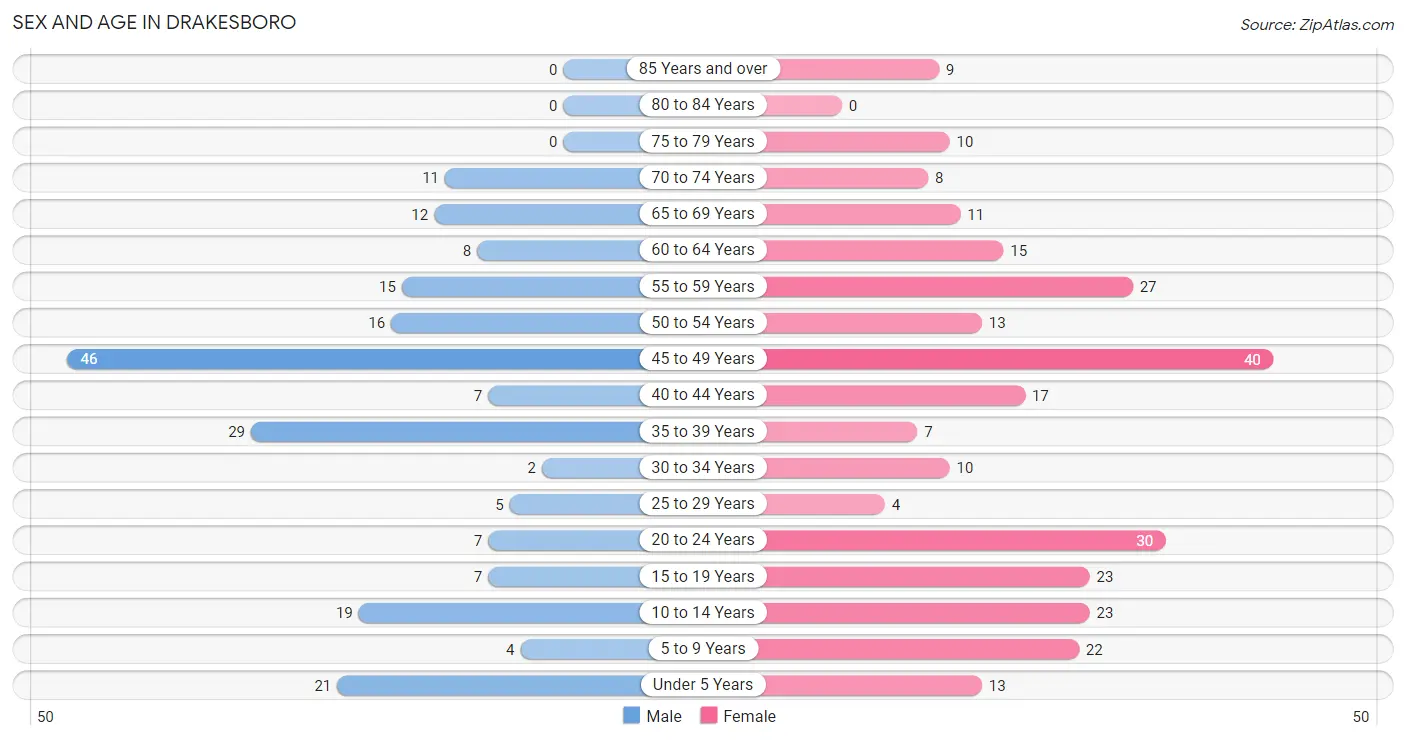
| Age Bracket | Male | Female |
| Under 5 Years | 21 (10.1%) | 13 (4.6%) |
| 5 to 9 Years | 4 (1.9%) | 22 (7.8%) |
| 10 to 14 Years | 19 (9.1%) | 23 (8.2%) |
| 15 to 19 Years | 7 (3.4%) | 23 (8.2%) |
| 20 to 24 Years | 7 (3.4%) | 30 (10.6%) |
| 25 to 29 Years | 5 (2.4%) | 4 (1.4%) |
| 30 to 34 Years | 2 (1.0%) | 10 (3.5%) |
| 35 to 39 Years | 29 (13.9%) | 7 (2.5%) |
| 40 to 44 Years | 7 (3.4%) | 17 (6.0%) |
| 45 to 49 Years | 46 (22.0%) | 40 (14.2%) |
| 50 to 54 Years | 16 (7.7%) | 13 (4.6%) |
| 55 to 59 Years | 15 (7.2%) | 27 (9.6%) |
| 60 to 64 Years | 8 (3.8%) | 15 (5.3%) |
| 65 to 69 Years | 12 (5.7%) | 11 (3.9%) |
| 70 to 74 Years | 11 (5.3%) | 8 (2.8%) |
| 75 to 79 Years | 0 (0.0%) | 10 (3.5%) |
| 80 to 84 Years | 0 (0.0%) | 0 (0.0%) |
| 85 Years and over | 0 (0.0%) | 9 (3.2%) |
| Total | 209 (100.0%) | 282 (100.0%) |
Families and Households in Drakesboro
Median Family Size in Drakesboro
The median family size in Drakesboro is 3.67 persons per family, with single female/mother families (40 | 33.3%) accounting for the largest median family size of 5.65 persons per family. On the other hand, married-couple families (65 | 54.2%) represent the smallest median family size with 2.63 persons per family.
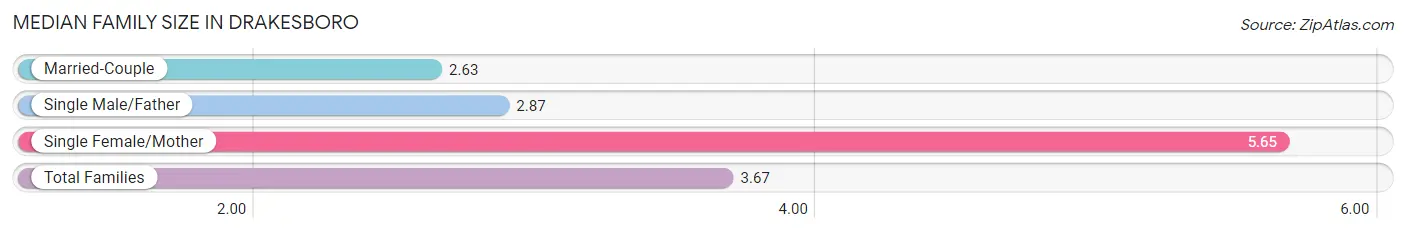
| Family Type | # Families | Family Size |
| Married-Couple | 65 (54.2%) | 2.63 |
| Single Male/Father | 15 (12.5%) | 2.87 |
| Single Female/Mother | 40 (33.3%) | 5.65 |
| Total Families | 120 (100.0%) | 3.67 |
Median Household Size in Drakesboro
The median household size in Drakesboro is 3.01 persons per household, with single female/mother households (40 | 24.5%) accounting for the largest median household size of 5.73 persons per household. non-family households (43 | 26.4%) represent the smallest median household size with 1.07 persons per household.
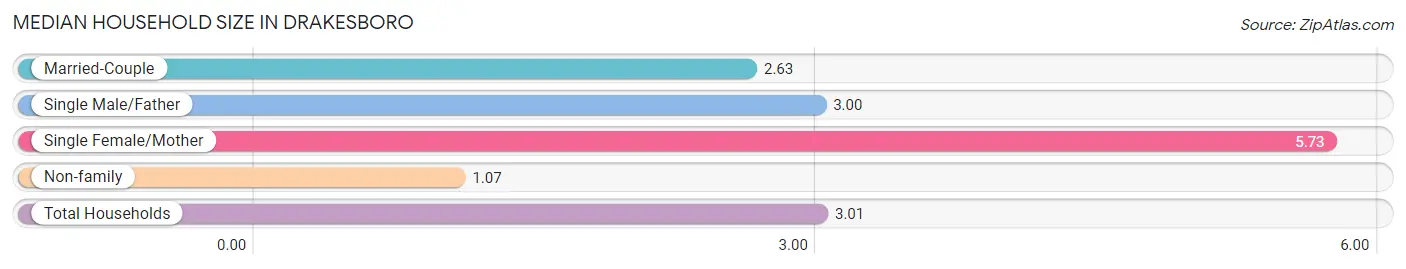
| Household Type | # Households | Household Size |
| Married-Couple | 65 (39.9%) | 2.63 |
| Single Male/Father | 15 (9.2%) | 3.00 |
| Single Female/Mother | 40 (24.5%) | 5.73 |
| Non-family | 43 (26.4%) | 1.07 |
| Total Households | 163 (100.0%) | 3.01 |
Household Size by Marriage Status in Drakesboro
Out of a total of 163 households in Drakesboro, 120 (73.6%) are family households, while 43 (26.4%) are nonfamily households. The most numerous type of family households are 2-person households, comprising 59, and the most common type of nonfamily households are 1-person households, comprising 40.
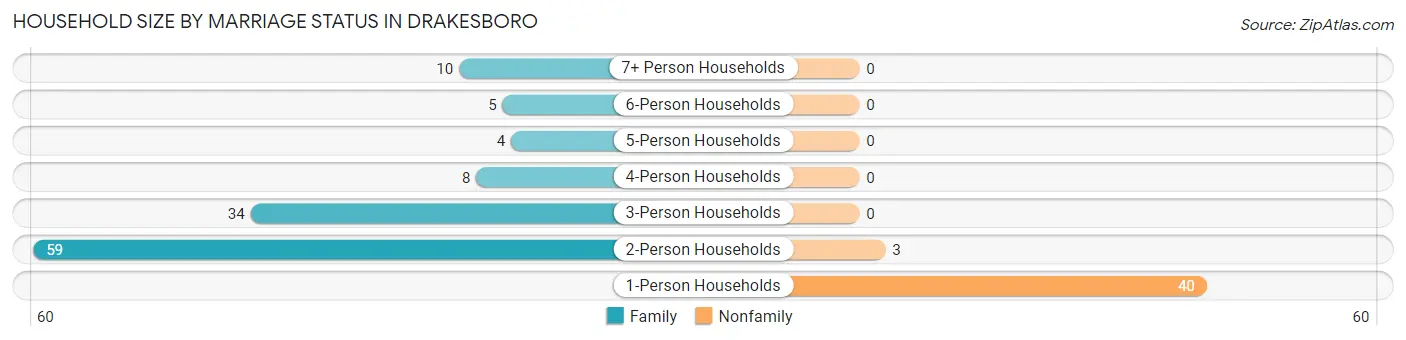
| Household Size | Family Households | Nonfamily Households |
| 1-Person Households | - | 40 (24.5%) |
| 2-Person Households | 59 (36.2%) | 3 (1.8%) |
| 3-Person Households | 34 (20.9%) | 0 (0.0%) |
| 4-Person Households | 8 (4.9%) | 0 (0.0%) |
| 5-Person Households | 4 (2.5%) | 0 (0.0%) |
| 6-Person Households | 5 (3.1%) | 0 (0.0%) |
| 7+ Person Households | 10 (6.1%) | 0 (0.0%) |
| Total | 120 (73.6%) | 43 (26.4%) |
Female Fertility in Drakesboro
Fertility by Age in Drakesboro
Average fertility rate in Drakesboro is 30.0 births per 1,000 women. Women in the age bracket of 20 to 34 years have the highest fertility rate with 91.0 births per 1,000 women. Women in the age bracket of 20 to 34 years acount for 100.0% of all women with births.
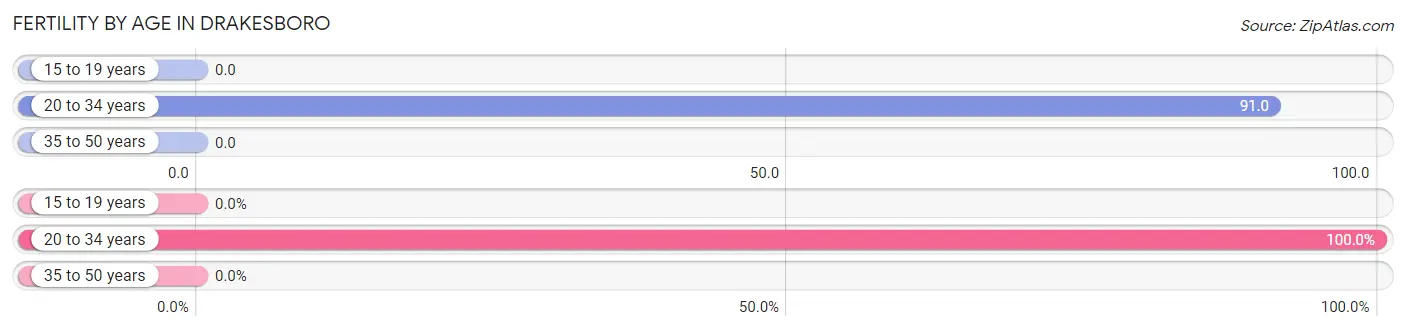
| Age Bracket | Women with Births | Births / 1,000 Women |
| 15 to 19 years | 0 (0.0%) | 0.0 |
| 20 to 34 years | 4 (100.0%) | 91.0 |
| 35 to 50 years | 0 (0.0%) | 0.0 |
| Total | 4 (100.0%) | 30.0 |
Fertility by Age by Marriage Status in Drakesboro
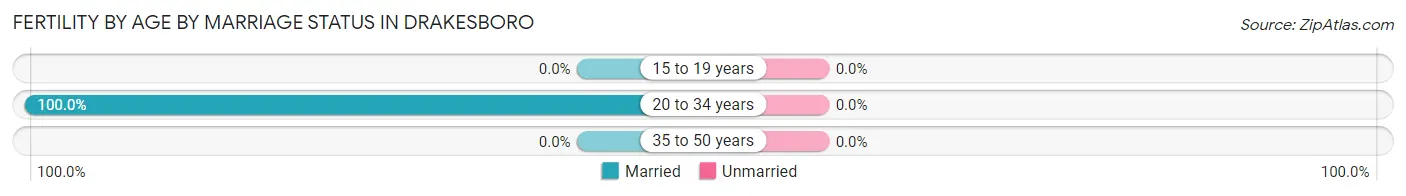
| Age Bracket | Married | Unmarried |
| 15 to 19 years | 0 (0.0%) | 0 (0.0%) |
| 20 to 34 years | 4 (100.0%) | 0 (0.0%) |
| 35 to 50 years | 0 (0.0%) | 0 (0.0%) |
| Total | 4 (100.0%) | 0 (0.0%) |
Fertility by Education in Drakesboro
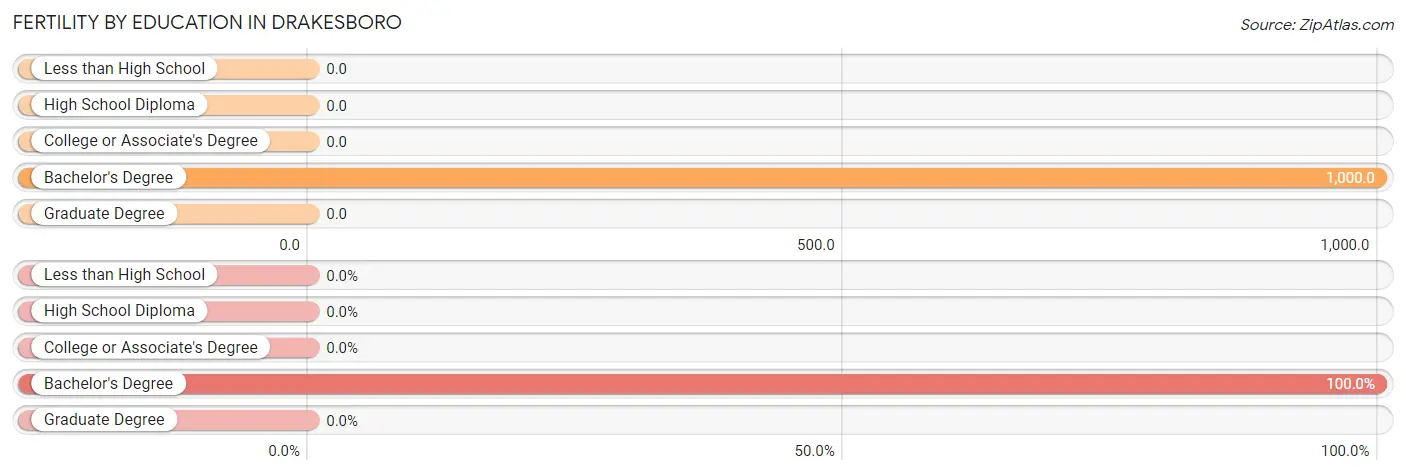
| Educational Attainment | Women with Births | Births / 1,000 Women |
| Less than High School | 0 (0.0%) | 0.0 |
| High School Diploma | 0 (0.0%) | 0.0 |
| College or Associate's Degree | 0 (0.0%) | 0.0 |
| Bachelor's Degree | 4 (100.0%) | 1,000.0 |
| Graduate Degree | 0 (0.0%) | 0.0 |
| Total | 4 (100.0%) | 30.0 |
Fertility by Education by Marriage Status in Drakesboro
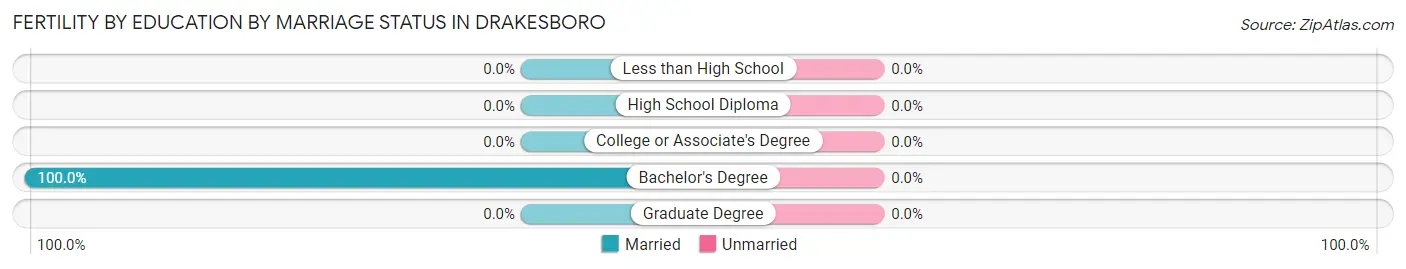
| Educational Attainment | Married | Unmarried |
| Less than High School | 0 (0.0%) | 0 (0.0%) |
| High School Diploma | 0 (0.0%) | 0 (0.0%) |
| College or Associate's Degree | 0 (0.0%) | 0 (0.0%) |
| Bachelor's Degree | 4 (100.0%) | 0 (0.0%) |
| Graduate Degree | 0 (0.0%) | 0 (0.0%) |
| Total | 4 (100.0%) | 0 (0.0%) |
Employment Characteristics in Drakesboro
Employment by Class of Employer in Drakesboro
Among the 134 employed individuals in Drakesboro, private company employees (90 | 67.2%), local government employees (20 | 14.9%), and not-for-profit organizations (15 | 11.2%) make up the most common classes of employment.
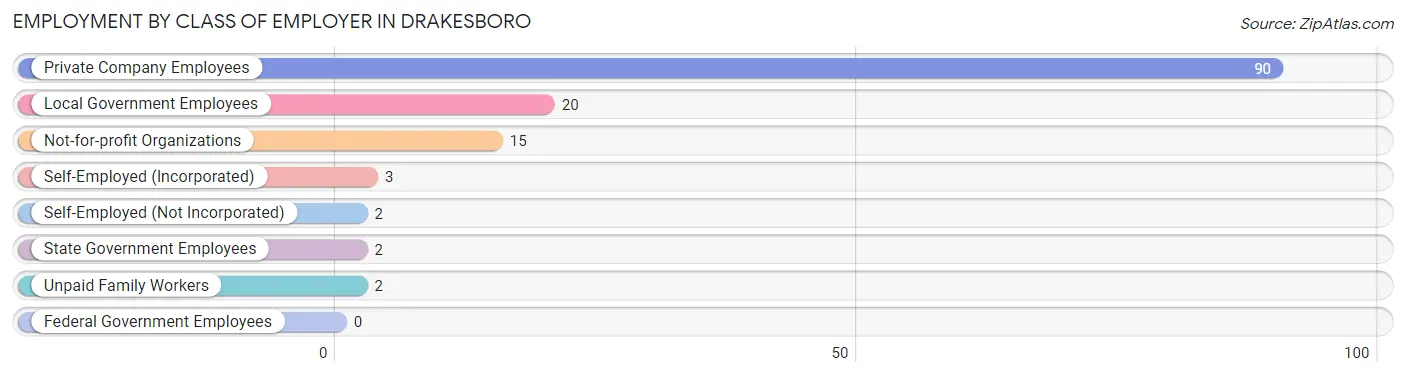
| Employer Class | # Employees | % Employees |
| Private Company Employees | 90 | 67.2% |
| Self-Employed (Incorporated) | 3 | 2.2% |
| Self-Employed (Not Incorporated) | 2 | 1.5% |
| Not-for-profit Organizations | 15 | 11.2% |
| Local Government Employees | 20 | 14.9% |
| State Government Employees | 2 | 1.5% |
| Federal Government Employees | 0 | 0.0% |
| Unpaid Family Workers | 2 | 1.5% |
| Total | 134 | 100.0% |
Employment Status by Age in Drakesboro
According to the labor force statistics for Drakesboro, out of the total population over 16 years of age (386), 43.0% or 166 individuals are in the labor force, with 4.8% or 8 of them unemployed. The age group with the highest labor force participation rate is 30 to 34 years, with 100.0% or 12 individuals in the labor force. Within the labor force, the 25 to 29 years age range has the highest percentage of unemployed individuals, with 60.0% or 3 of them being unemployed.
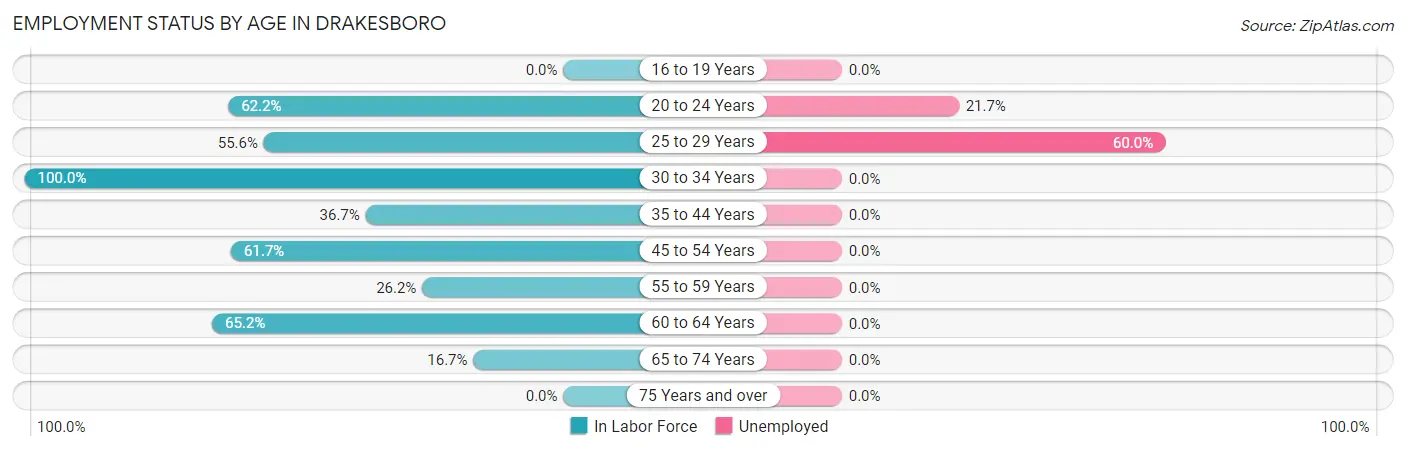
| Age Bracket | In Labor Force | Unemployed |
| 16 to 19 Years | 0 (0.0%) | 0 (0.0%) |
| 20 to 24 Years | 23 (62.2%) | 5 (21.7%) |
| 25 to 29 Years | 5 (55.6%) | 3 (60.0%) |
| 30 to 34 Years | 12 (100.0%) | 0 (0.0%) |
| 35 to 44 Years | 22 (36.7%) | 0 (0.0%) |
| 45 to 54 Years | 71 (61.7%) | 0 (0.0%) |
| 55 to 59 Years | 11 (26.2%) | 0 (0.0%) |
| 60 to 64 Years | 15 (65.2%) | 0 (0.0%) |
| 65 to 74 Years | 7 (16.7%) | 0 (0.0%) |
| 75 Years and over | 0 (0.0%) | 0 (0.0%) |
| Total | 166 (43.0%) | 8 (4.8%) |
Employment Status by Educational Attainment in Drakesboro
According to labor force statistics for Drakesboro, 52.1% of individuals (136) out of the total population between 25 and 64 years of age (261) are in the labor force, with 2.2% or 3 of them being unemployed. The group with the highest labor force participation rate are those with the educational attainment of less than high school, with 64.3% or 36 individuals in the labor force. Within the labor force, individuals with less than high school education have the highest percentage of unemployment, with 8.3% or 3 of them being unemployed.
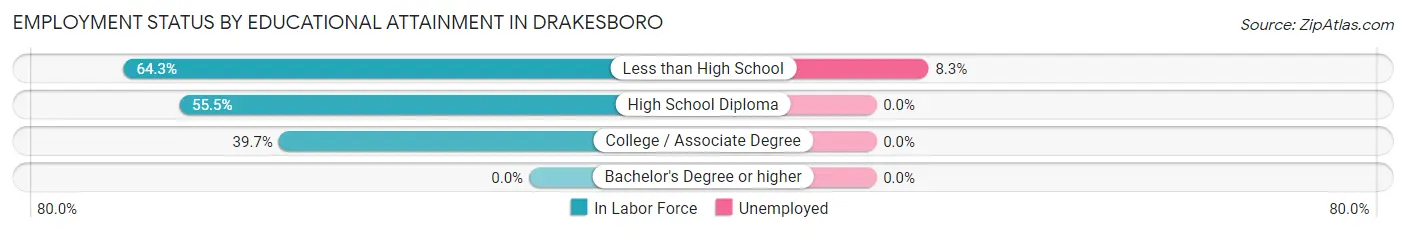
| Educational Attainment | In Labor Force | Unemployed |
| Less than High School | 36 (64.3%) | 5 (8.3%) |
| High School Diploma | 71 (55.5%) | 0 (0.0%) |
| College / Associate Degree | 29 (39.7%) | 0 (0.0%) |
| Bachelor's Degree or higher | 0 (0.0%) | 0 (0.0%) |
| Total | 136 (52.1%) | 6 (2.2%) |
Employment Occupations by Sex in Drakesboro
Management, Business, Science and Arts Occupations
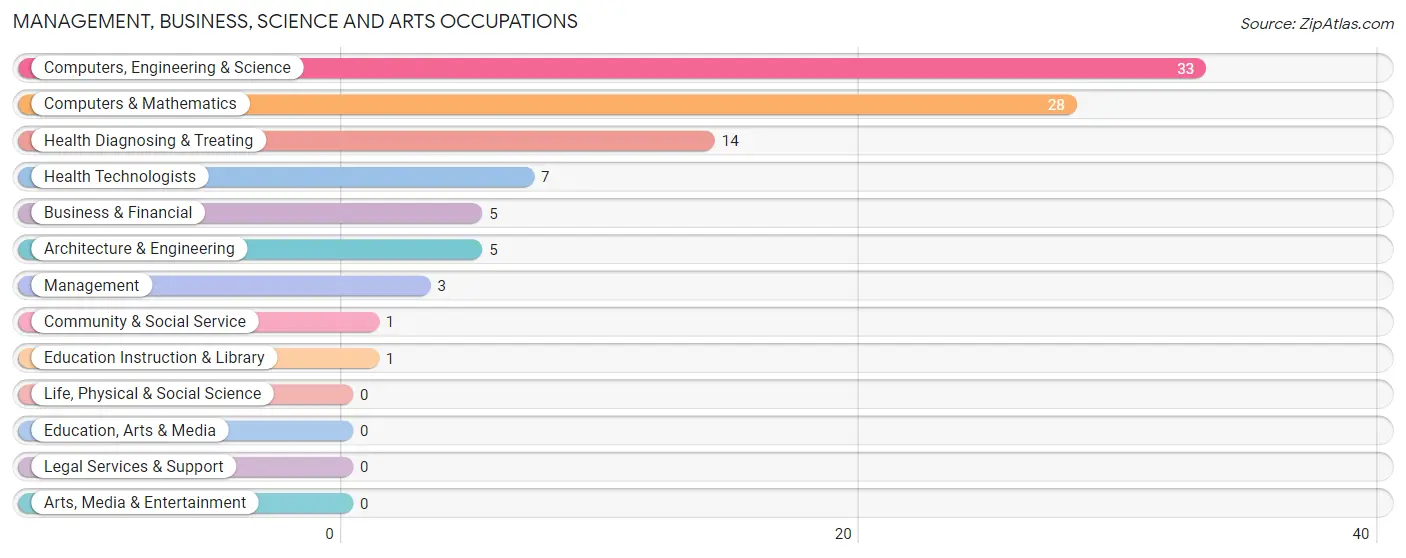
The most common Management, Business, Science and Arts occupations in Drakesboro are Computers, Engineering & Science (33 | 20.9%), Computers & Mathematics (28 | 17.7%), Health Diagnosing & Treating (14 | 8.9%), Health Technologists (7 | 4.4%), and Business & Financial (5 | 3.2%).
Management, Business, Science and Arts Occupations by Sex
Within the Management, Business, Science and Arts occupations in Drakesboro, the most male-oriented occupations are Management (100.0%), Architecture & Engineering (100.0%), and Computers, Engineering & Science (27.3%), while the most female-oriented occupations are Business & Financial (100.0%), Community & Social Service (100.0%), and Education Instruction & Library (100.0%).
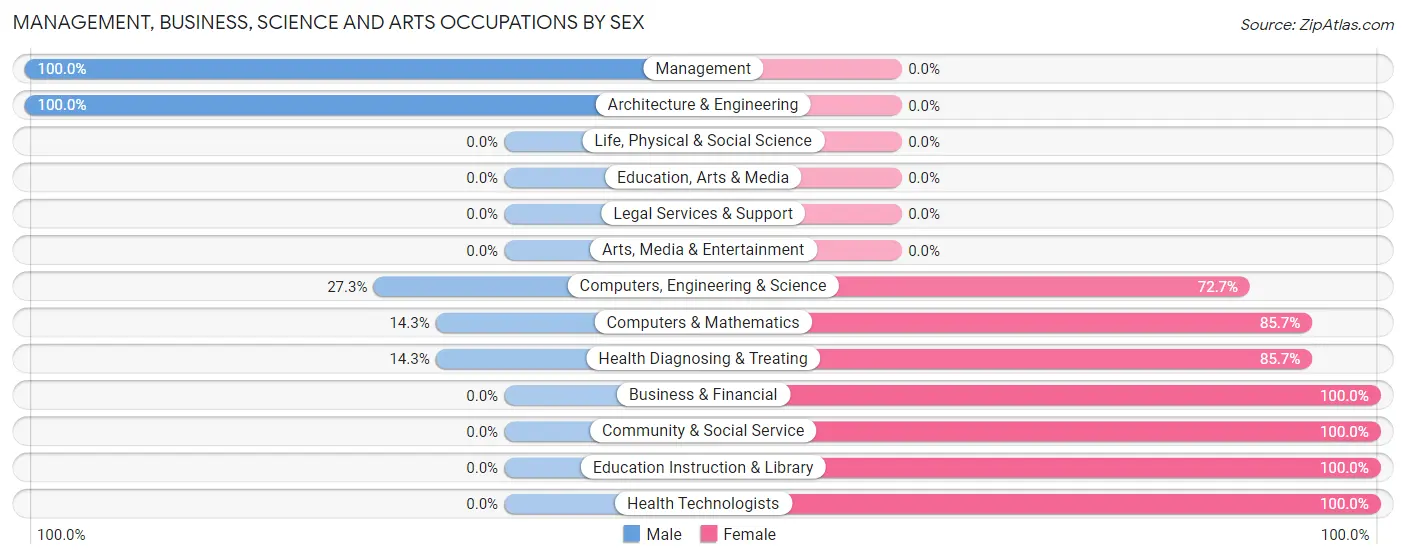
| Occupation | Male | Female |
| Management | 3 (100.0%) | 0 (0.0%) |
| Business & Financial | 0 (0.0%) | 5 (100.0%) |
| Computers, Engineering & Science | 9 (27.3%) | 24 (72.7%) |
| Computers & Mathematics | 4 (14.3%) | 24 (85.7%) |
| Architecture & Engineering | 5 (100.0%) | 0 (0.0%) |
| Life, Physical & Social Science | 0 (0.0%) | 0 (0.0%) |
| Community & Social Service | 0 (0.0%) | 1 (100.0%) |
| Education, Arts & Media | 0 (0.0%) | 0 (0.0%) |
| Legal Services & Support | 0 (0.0%) | 0 (0.0%) |
| Education Instruction & Library | 0 (0.0%) | 1 (100.0%) |
| Arts, Media & Entertainment | 0 (0.0%) | 0 (0.0%) |
| Health Diagnosing & Treating | 2 (14.3%) | 12 (85.7%) |
| Health Technologists | 0 (0.0%) | 7 (100.0%) |
| Total (Category) | 14 (25.0%) | 42 (75.0%) |
| Total (Overall) | 69 (43.7%) | 89 (56.3%) |
Services Occupations
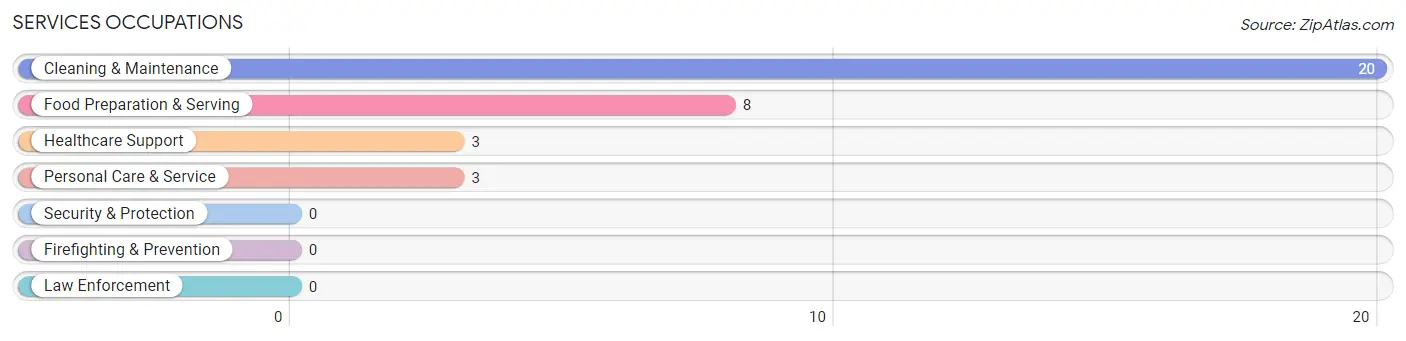
The most common Services occupations in Drakesboro are Cleaning & Maintenance (20 | 12.7%), Food Preparation & Serving (8 | 5.1%), Healthcare Support (3 | 1.9%), and Personal Care & Service (3 | 1.9%).
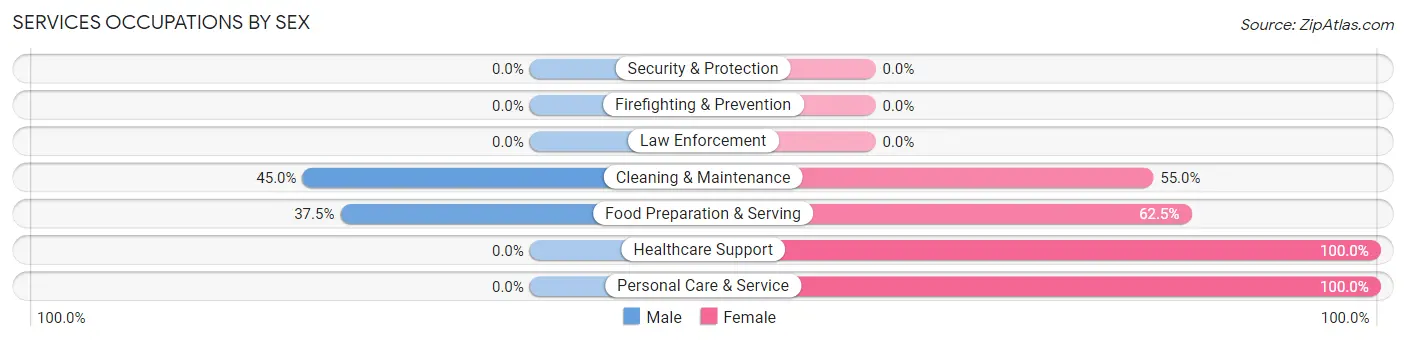
Services Occupations by Sex
Within the Services occupations in Drakesboro, the most male-oriented occupations are Cleaning & Maintenance (45.0%), and Food Preparation & Serving (37.5%), while the most female-oriented occupations are Healthcare Support (100.0%), Personal Care & Service (100.0%), and Food Preparation & Serving (62.5%).
| Occupation | Male | Female |
| Healthcare Support | 0 (0.0%) | 3 (100.0%) |
| Security & Protection | 0 (0.0%) | 0 (0.0%) |
| Firefighting & Prevention | 0 (0.0%) | 0 (0.0%) |
| Law Enforcement | 0 (0.0%) | 0 (0.0%) |
| Food Preparation & Serving | 3 (37.5%) | 5 (62.5%) |
| Cleaning & Maintenance | 9 (45.0%) | 11 (55.0%) |
| Personal Care & Service | 0 (0.0%) | 3 (100.0%) |
| Total (Category) | 12 (35.3%) | 22 (64.7%) |
| Total (Overall) | 69 (43.7%) | 89 (56.3%) |
Sales and Office Occupations
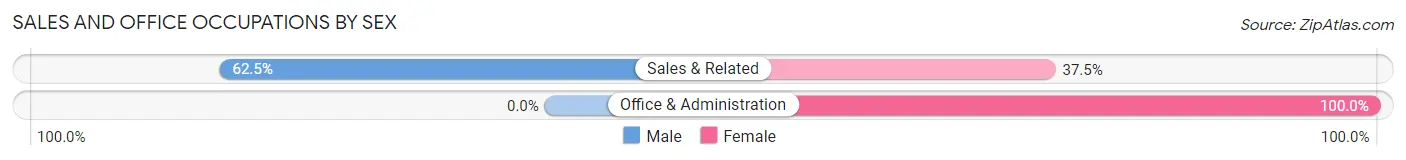
The most common Sales and Office occupations in Drakesboro are Office & Administration (12 | 7.6%), and Sales & Related (8 | 5.1%).

Sales and Office Occupations by Sex
| Occupation | Male | Female |
| Sales & Related | 5 (62.5%) | 3 (37.5%) |
| Office & Administration | 0 (0.0%) | 12 (100.0%) |
| Total (Category) | 5 (25.0%) | 15 (75.0%) |
| Total (Overall) | 69 (43.7%) | 89 (56.3%) |
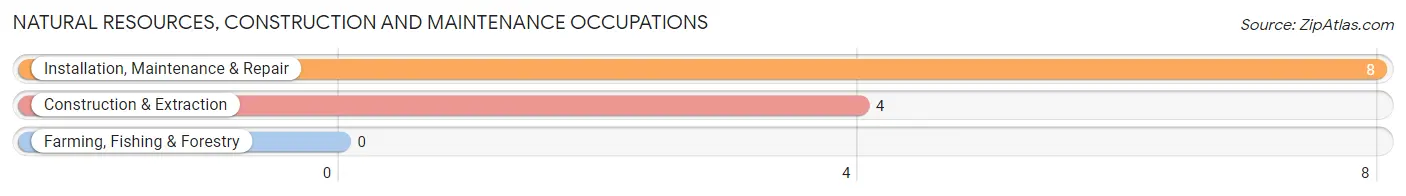
Natural Resources, Construction and Maintenance Occupations
The most common Natural Resources, Construction and Maintenance occupations in Drakesboro are Installation, Maintenance & Repair (8 | 5.1%), and Construction & Extraction (4 | 2.5%).
Natural Resources, Construction and Maintenance Occupations by Sex
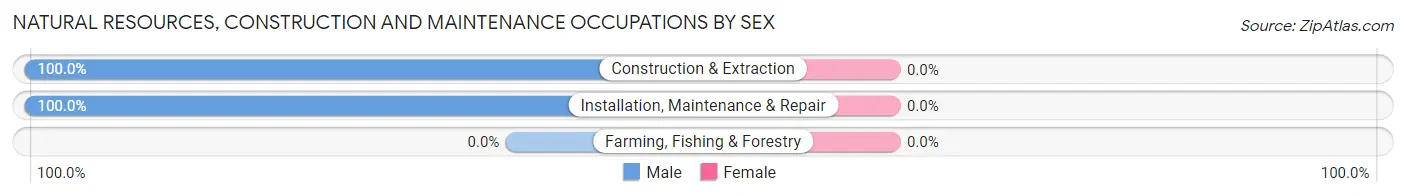
| Occupation | Male | Female |
| Farming, Fishing & Forestry | 0 (0.0%) | 0 (0.0%) |
| Construction & Extraction | 4 (100.0%) | 0 (0.0%) |
| Installation, Maintenance & Repair | 8 (100.0%) | 0 (0.0%) |
| Total (Category) | 12 (100.0%) | 0 (0.0%) |
| Total (Overall) | 69 (43.7%) | 89 (56.3%) |
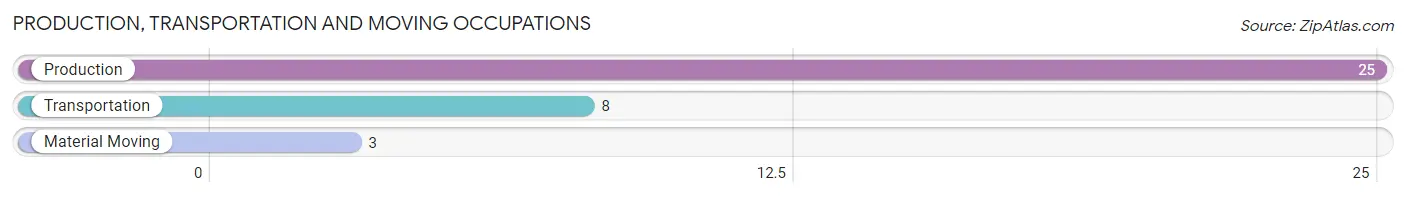
Production, Transportation and Moving Occupations
The most common Production, Transportation and Moving occupations in Drakesboro are Production (25 | 15.8%), Transportation (8 | 5.1%), and Material Moving (3 | 1.9%).
Production, Transportation and Moving Occupations by Sex
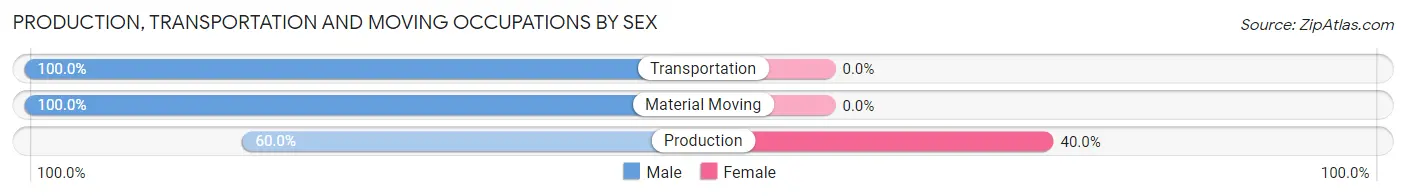
| Occupation | Male | Female |
| Production | 15 (60.0%) | 10 (40.0%) |
| Transportation | 8 (100.0%) | 0 (0.0%) |
| Material Moving | 3 (100.0%) | 0 (0.0%) |
| Total (Category) | 26 (72.2%) | 10 (27.8%) |
| Total (Overall) | 69 (43.7%) | 89 (56.3%) |
Employment Industries by Sex in Drakesboro
Employment Industries in Drakesboro
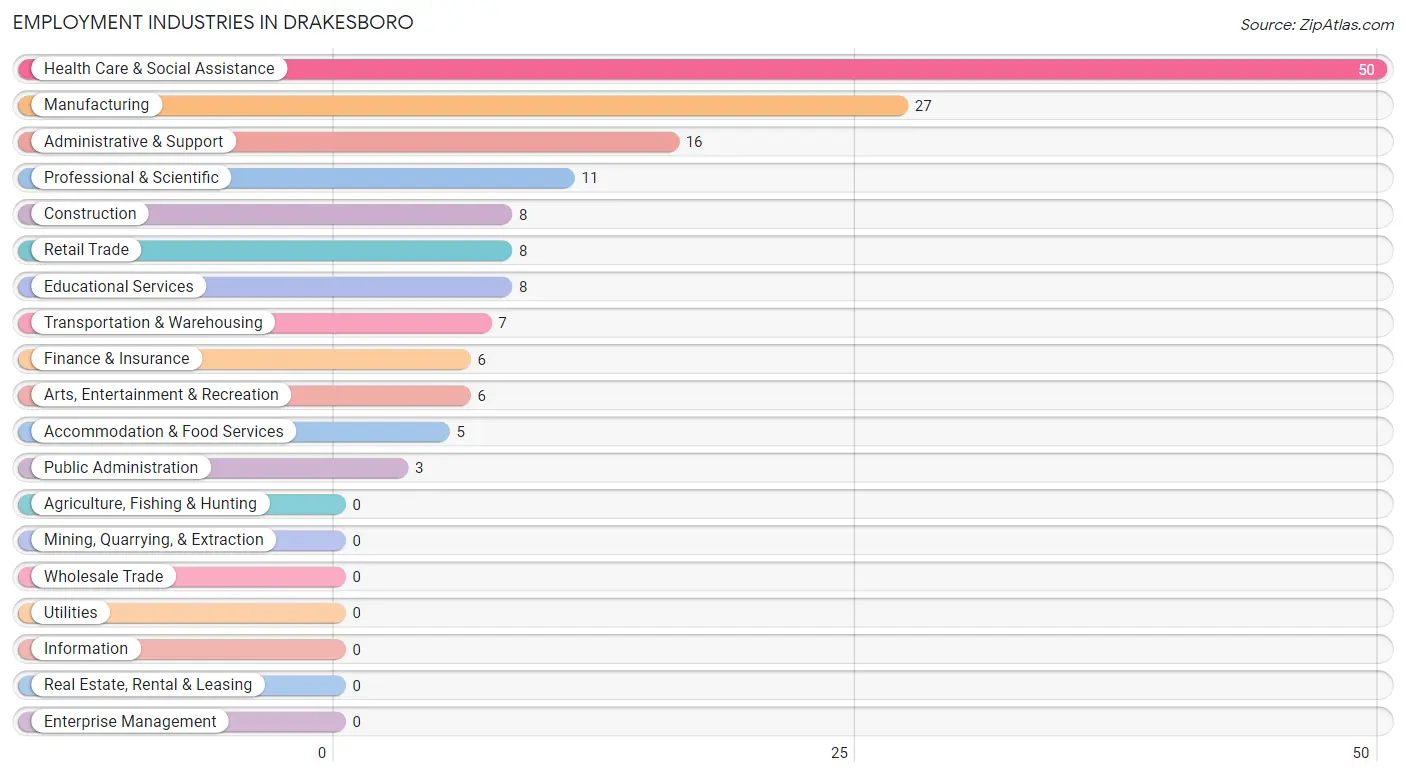
The major employment industries in Drakesboro include Health Care & Social Assistance (50 | 31.7%), Manufacturing (27 | 17.1%), Administrative & Support (16 | 10.1%), Professional & Scientific (11 | 7.0%), and Construction (8 | 5.1%).
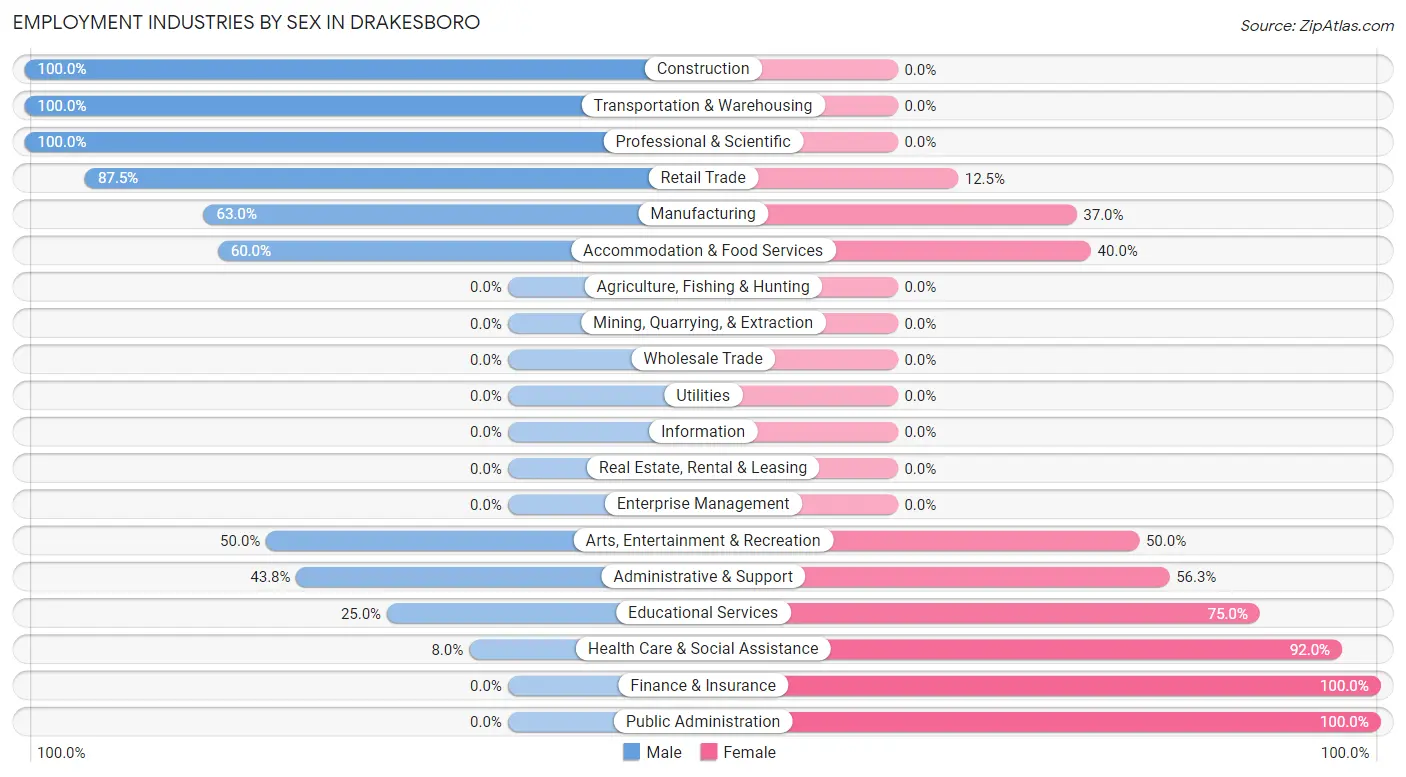
Employment Industries by Sex in Drakesboro
The Drakesboro industries that see more men than women are Construction (100.0%), Transportation & Warehousing (100.0%), and Professional & Scientific (100.0%), whereas the industries that tend to have a higher number of women are Finance & Insurance (100.0%), Public Administration (100.0%), and Health Care & Social Assistance (92.0%).
| Industry | Male | Female |
| Agriculture, Fishing & Hunting | 0 (0.0%) | 0 (0.0%) |
| Mining, Quarrying, & Extraction | 0 (0.0%) | 0 (0.0%) |
| Construction | 8 (100.0%) | 0 (0.0%) |
| Manufacturing | 17 (63.0%) | 10 (37.0%) |
| Wholesale Trade | 0 (0.0%) | 0 (0.0%) |
| Retail Trade | 7 (87.5%) | 1 (12.5%) |
| Transportation & Warehousing | 7 (100.0%) | 0 (0.0%) |
| Utilities | 0 (0.0%) | 0 (0.0%) |
| Information | 0 (0.0%) | 0 (0.0%) |
| Finance & Insurance | 0 (0.0%) | 6 (100.0%) |
| Real Estate, Rental & Leasing | 0 (0.0%) | 0 (0.0%) |
| Professional & Scientific | 11 (100.0%) | 0 (0.0%) |
| Enterprise Management | 0 (0.0%) | 0 (0.0%) |
| Administrative & Support | 7 (43.8%) | 9 (56.2%) |
| Educational Services | 2 (25.0%) | 6 (75.0%) |
| Health Care & Social Assistance | 4 (8.0%) | 46 (92.0%) |
| Arts, Entertainment & Recreation | 3 (50.0%) | 3 (50.0%) |
| Accommodation & Food Services | 3 (60.0%) | 2 (40.0%) |
| Public Administration | 0 (0.0%) | 3 (100.0%) |
| Total | 69 (43.7%) | 89 (56.3%) |
Education in Drakesboro
School Enrollment in Drakesboro
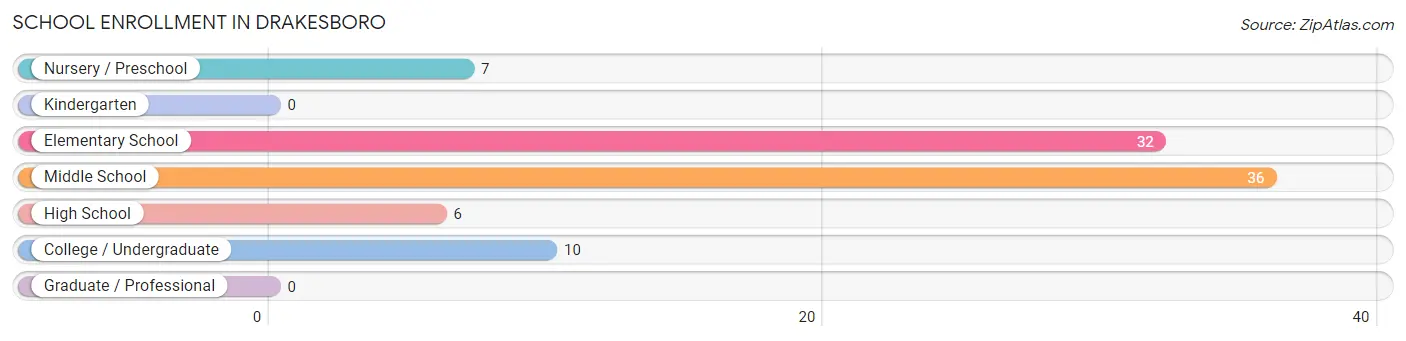
The most common levels of schooling among the 91 students in Drakesboro are middle school (36 | 39.6%), elementary school (32 | 35.2%), and college / undergraduate (10 | 11.0%).
| School Level | # Students | % Students |
| Nursery / Preschool | 7 | 7.7% |
| Kindergarten | 0 | 0.0% |
| Elementary School | 32 | 35.2% |
| Middle School | 36 | 39.6% |
| High School | 6 | 6.6% |
| College / Undergraduate | 10 | 11.0% |
| Graduate / Professional | 0 | 0.0% |
| Total | 91 | 100.0% |
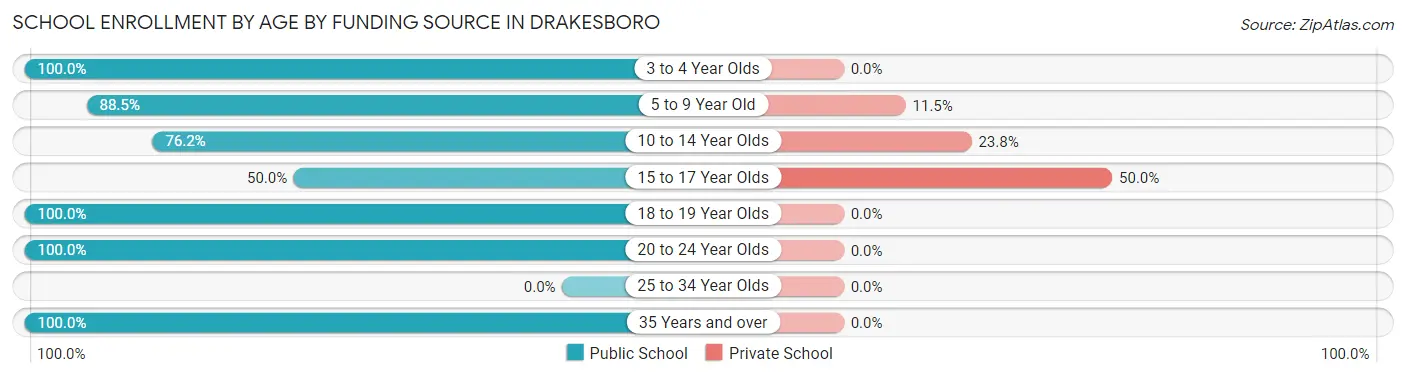
School Enrollment by Age by Funding Source in Drakesboro
Out of a total of 91 students who are enrolled in schools in Drakesboro, 16 (17.6%) attend a private institution, while the remaining 75 (82.4%) are enrolled in public schools. The age group of 15 to 17 year olds has the highest likelihood of being enrolled in private schools, with 3 (50.0% in the age bracket) enrolled. Conversely, the age group of 3 to 4 year olds has the lowest likelihood of being enrolled in a private school, with 7 (100.0% in the age bracket) attending a public institution.
| Age Bracket | Public School | Private School |
| 3 to 4 Year Olds | 7 (100.0%) | 0 (0.0%) |
| 5 to 9 Year Old | 23 (88.5%) | 3 (11.5%) |
| 10 to 14 Year Olds | 32 (76.2%) | 10 (23.8%) |
| 15 to 17 Year Olds | 3 (50.0%) | 3 (50.0%) |
| 18 to 19 Year Olds | 3 (100.0%) | 0 (0.0%) |
| 20 to 24 Year Olds | 5 (100.0%) | 0 (0.0%) |
| 25 to 34 Year Olds | 0 (0.0%) | 0 (0.0%) |
| 35 Years and over | 2 (100.0%) | 0 (0.0%) |
| Total | 75 (82.4%) | 16 (17.6%) |
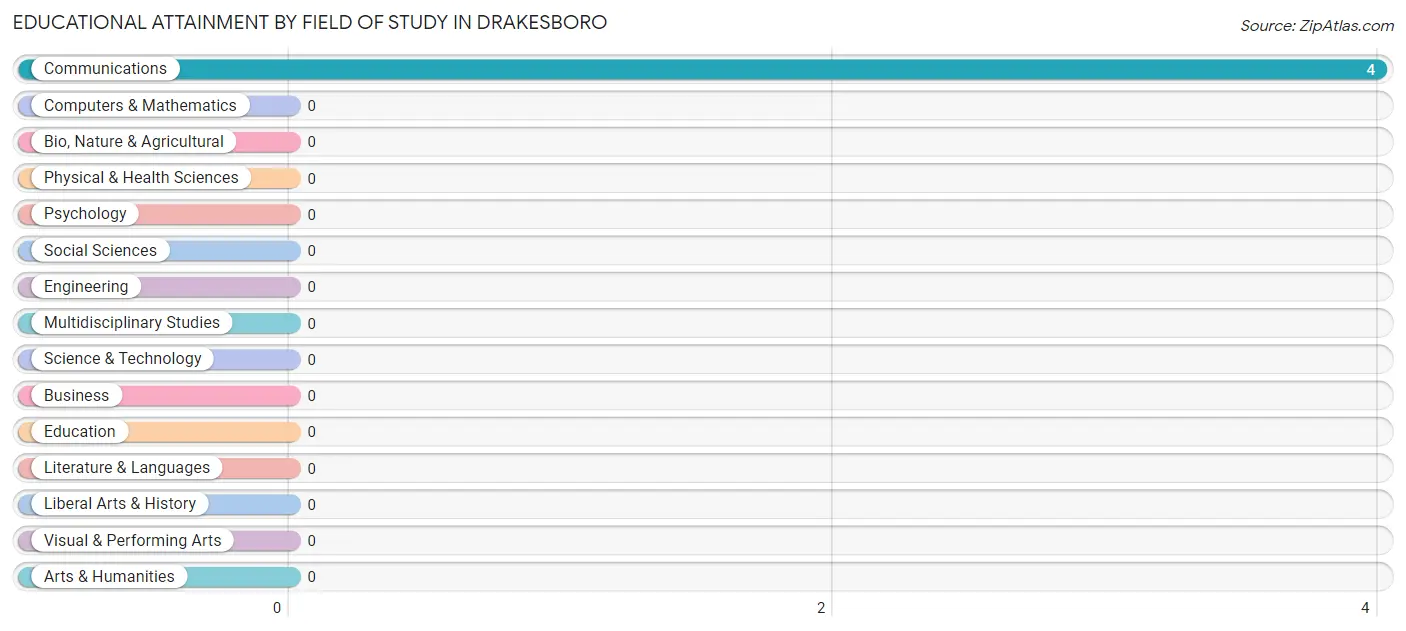
Educational Attainment by Field of Study in Drakesboro
, and communications (4 | 100.0%) are the most common fields of study among 4 individuals in Drakesboro who have obtained a bachelor's degree or higher.
| Field of Study | # Graduates | % Graduates |
| Computers & Mathematics | 0 | 0.0% |
| Bio, Nature & Agricultural | 0 | 0.0% |
| Physical & Health Sciences | 0 | 0.0% |
| Psychology | 0 | 0.0% |
| Social Sciences | 0 | 0.0% |
| Engineering | 0 | 0.0% |
| Multidisciplinary Studies | 0 | 0.0% |
| Science & Technology | 0 | 0.0% |
| Business | 0 | 0.0% |
| Education | 0 | 0.0% |
| Literature & Languages | 0 | 0.0% |
| Liberal Arts & History | 0 | 0.0% |
| Visual & Performing Arts | 0 | 0.0% |
| Communications | 4 | 100.0% |
| Arts & Humanities | 0 | 0.0% |
| Total | 4 | 100.0% |
Transportation & Commute in Drakesboro
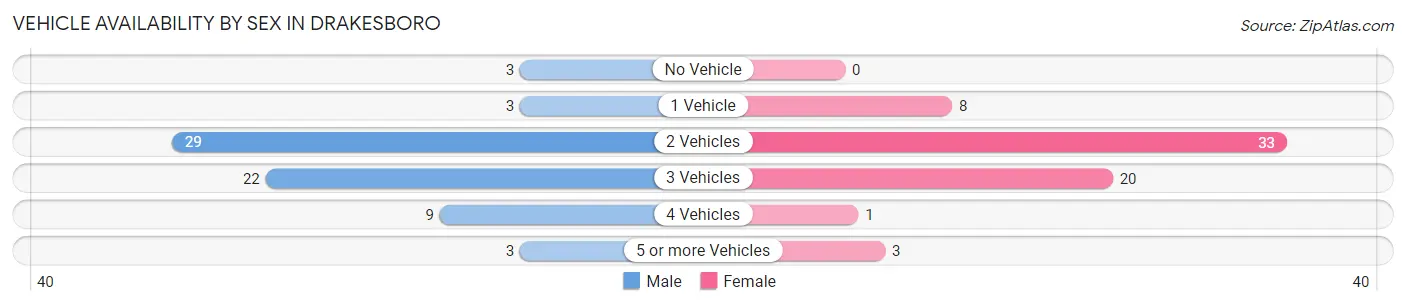
Vehicle Availability by Sex in Drakesboro
The most prevalent vehicle ownership categories in Drakesboro are males with 2 vehicles (29, accounting for 42.0%) and females with 2 vehicles (33, making up 44.6%).
| Vehicles Available | Male | Female |
| No Vehicle | 3 (4.3%) | 0 (0.0%) |
| 1 Vehicle | 3 (4.3%) | 8 (12.3%) |
| 2 Vehicles | 29 (42.0%) | 33 (50.8%) |
| 3 Vehicles | 22 (31.9%) | 20 (30.8%) |
| 4 Vehicles | 9 (13.0%) | 1 (1.5%) |
| 5 or more Vehicles | 3 (4.3%) | 3 (4.6%) |
| Total | 69 (100.0%) | 65 (100.0%) |
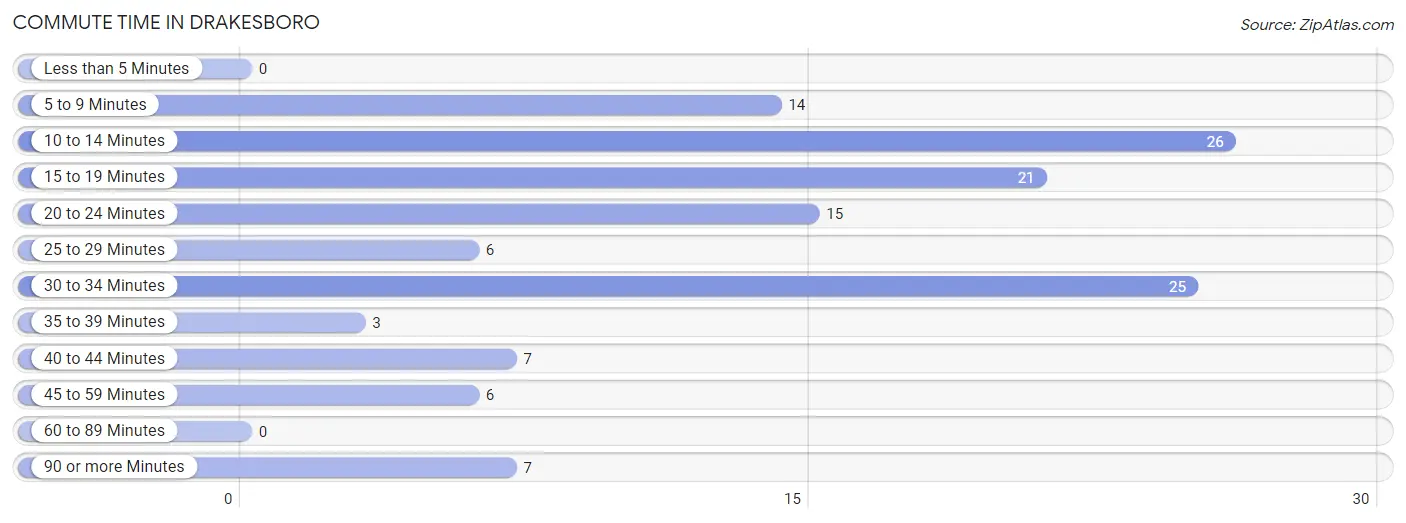
Commute Time in Drakesboro
The most frequently occuring commute durations in Drakesboro are 10 to 14 minutes (26 commuters, 20.0%), 30 to 34 minutes (25 commuters, 19.2%), and 15 to 19 minutes (21 commuters, 16.2%).
| Commute Time | # Commuters | % Commuters |
| Less than 5 Minutes | 0 | 0.0% |
| 5 to 9 Minutes | 14 | 10.8% |
| 10 to 14 Minutes | 26 | 20.0% |
| 15 to 19 Minutes | 21 | 16.2% |
| 20 to 24 Minutes | 15 | 11.5% |
| 25 to 29 Minutes | 6 | 4.6% |
| 30 to 34 Minutes | 25 | 19.2% |
| 35 to 39 Minutes | 3 | 2.3% |
| 40 to 44 Minutes | 7 | 5.4% |
| 45 to 59 Minutes | 6 | 4.6% |
| 60 to 89 Minutes | 0 | 0.0% |
| 90 or more Minutes | 7 | 5.4% |
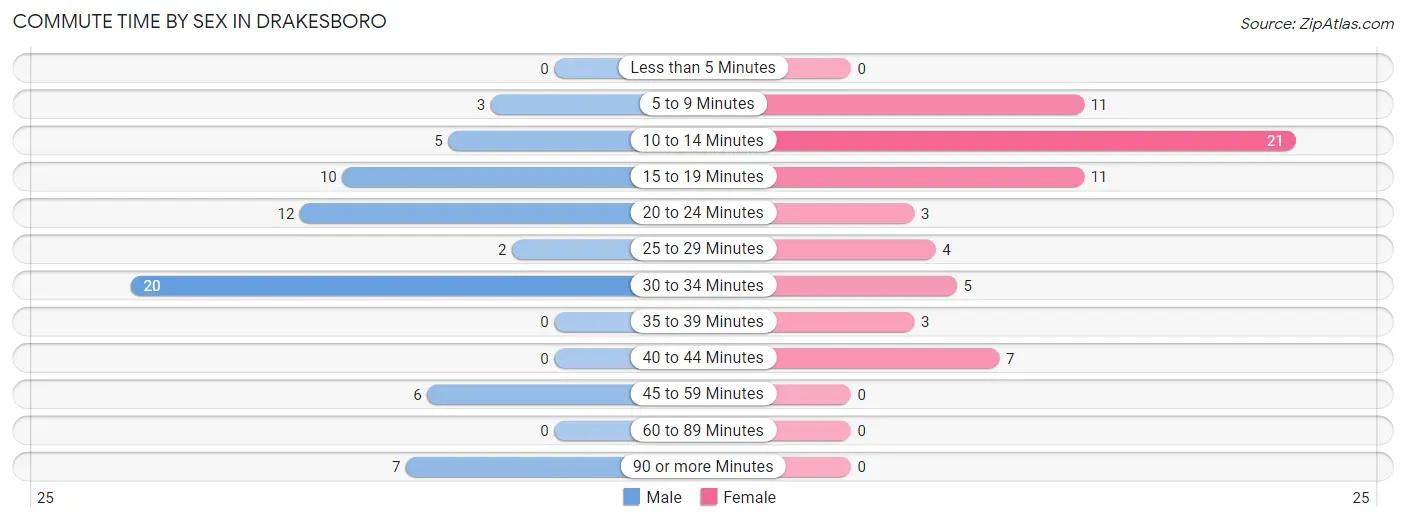
Commute Time by Sex in Drakesboro
The most common commute times in Drakesboro are 30 to 34 minutes (20 commuters, 30.8%) for males and 10 to 14 minutes (21 commuters, 32.3%) for females.
| Commute Time | Male | Female |
| Less than 5 Minutes | 0 (0.0%) | 0 (0.0%) |
| 5 to 9 Minutes | 3 (4.6%) | 11 (16.9%) |
| 10 to 14 Minutes | 5 (7.7%) | 21 (32.3%) |
| 15 to 19 Minutes | 10 (15.4%) | 11 (16.9%) |
| 20 to 24 Minutes | 12 (18.5%) | 3 (4.6%) |
| 25 to 29 Minutes | 2 (3.1%) | 4 (6.1%) |
| 30 to 34 Minutes | 20 (30.8%) | 5 (7.7%) |
| 35 to 39 Minutes | 0 (0.0%) | 3 (4.6%) |
| 40 to 44 Minutes | 0 (0.0%) | 7 (10.8%) |
| 45 to 59 Minutes | 6 (9.2%) | 0 (0.0%) |
| 60 to 89 Minutes | 0 (0.0%) | 0 (0.0%) |
| 90 or more Minutes | 7 (10.8%) | 0 (0.0%) |
Time of Departure to Work by Sex in Drakesboro
The most frequent times of departure to work in Drakesboro are 12:00 AM to 4:59 AM (16, 24.6%) for males and 6:00 AM to 6:29 AM (18, 27.7%) for females.
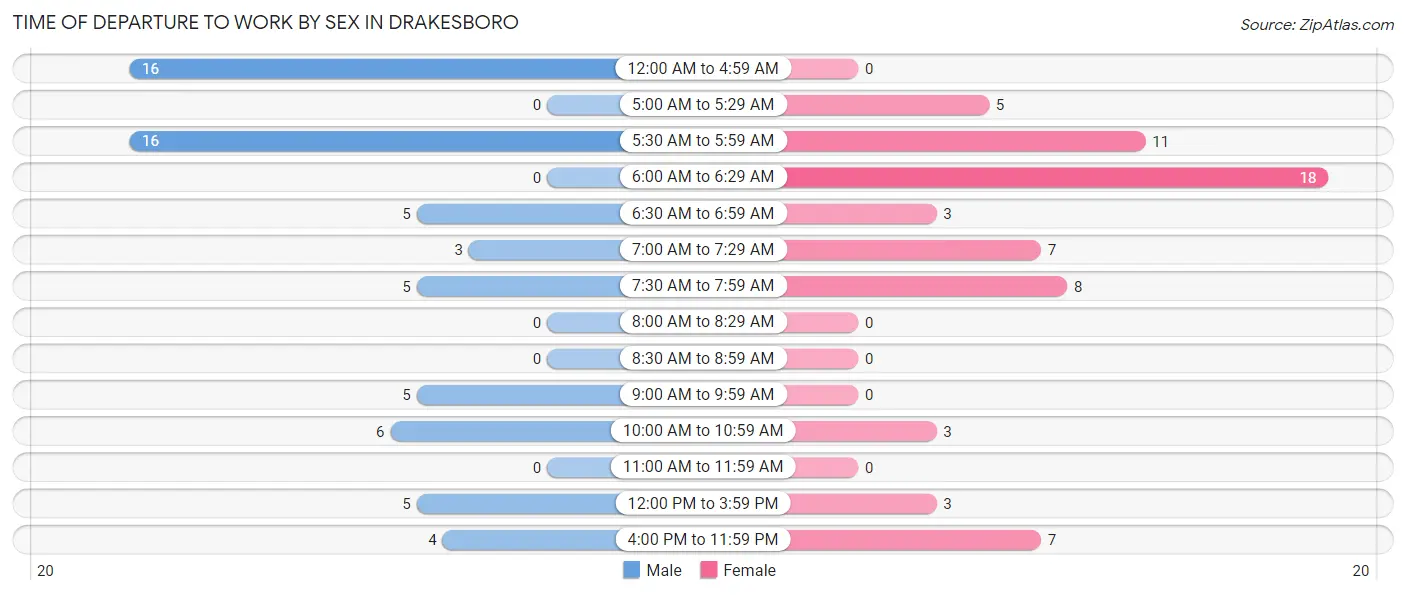
| Time of Departure | Male | Female |
| 12:00 AM to 4:59 AM | 16 (24.6%) | 0 (0.0%) |
| 5:00 AM to 5:29 AM | 0 (0.0%) | 5 (7.7%) |
| 5:30 AM to 5:59 AM | 16 (24.6%) | 11 (16.9%) |
| 6:00 AM to 6:29 AM | 0 (0.0%) | 18 (27.7%) |
| 6:30 AM to 6:59 AM | 5 (7.7%) | 3 (4.6%) |
| 7:00 AM to 7:29 AM | 3 (4.6%) | 7 (10.8%) |
| 7:30 AM to 7:59 AM | 5 (7.7%) | 8 (12.3%) |
| 8:00 AM to 8:29 AM | 0 (0.0%) | 0 (0.0%) |
| 8:30 AM to 8:59 AM | 0 (0.0%) | 0 (0.0%) |
| 9:00 AM to 9:59 AM | 5 (7.7%) | 0 (0.0%) |
| 10:00 AM to 10:59 AM | 6 (9.2%) | 3 (4.6%) |
| 11:00 AM to 11:59 AM | 0 (0.0%) | 0 (0.0%) |
| 12:00 PM to 3:59 PM | 5 (7.7%) | 3 (4.6%) |
| 4:00 PM to 11:59 PM | 4 (6.1%) | 7 (10.8%) |
| Total | 65 (100.0%) | 65 (100.0%) |
Housing Occupancy in Drakesboro
Occupancy by Ownership in Drakesboro
Of the total 163 dwellings in Drakesboro, owner-occupied units account for 143 (87.7%), while renter-occupied units make up 20 (12.3%).
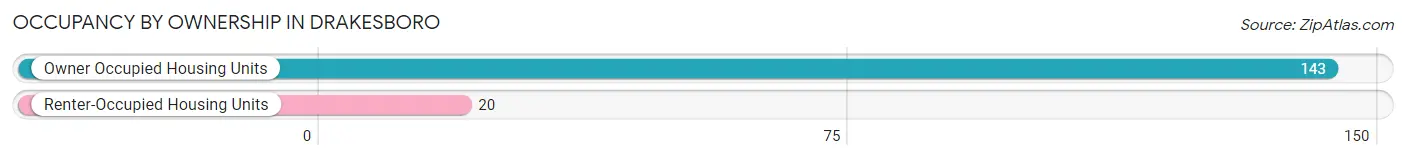
| Occupancy | # Housing Units | % Housing Units |
| Owner Occupied Housing Units | 143 | 87.7% |
| Renter-Occupied Housing Units | 20 | 12.3% |
| Total Occupied Housing Units | 163 | 100.0% |
Occupancy by Household Size in Drakesboro
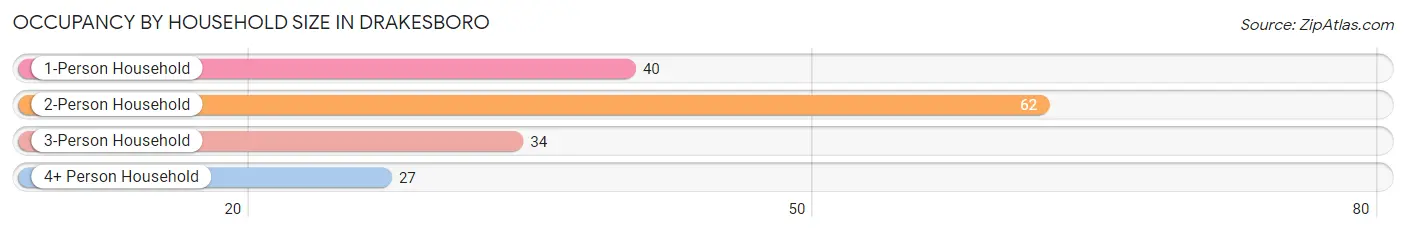
| Household Size | # Housing Units | % Housing Units |
| 1-Person Household | 40 | 24.5% |
| 2-Person Household | 62 | 38.0% |
| 3-Person Household | 34 | 20.9% |
| 4+ Person Household | 27 | 16.6% |
| Total Housing Units | 163 | 100.0% |
Occupancy by Ownership by Household Size in Drakesboro
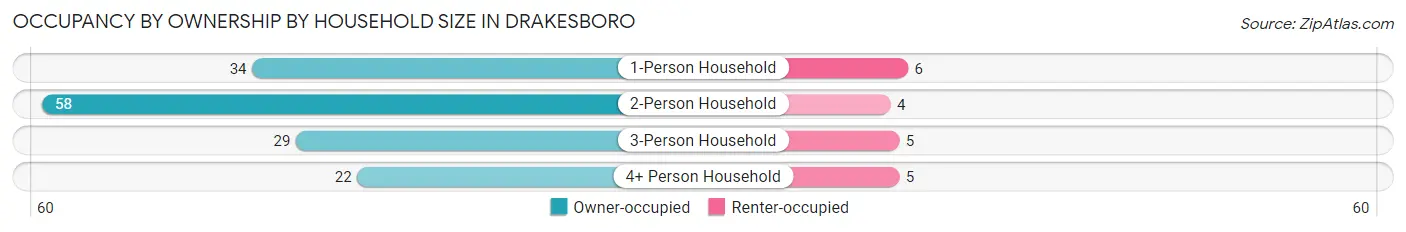
| Household Size | Owner-occupied | Renter-occupied |
| 1-Person Household | 34 (85.0%) | 6 (15.0%) |
| 2-Person Household | 58 (93.5%) | 4 (6.5%) |
| 3-Person Household | 29 (85.3%) | 5 (14.7%) |
| 4+ Person Household | 22 (81.5%) | 5 (18.5%) |
| Total Housing Units | 143 (87.7%) | 20 (12.3%) |
Occupancy by Educational Attainment in Drakesboro
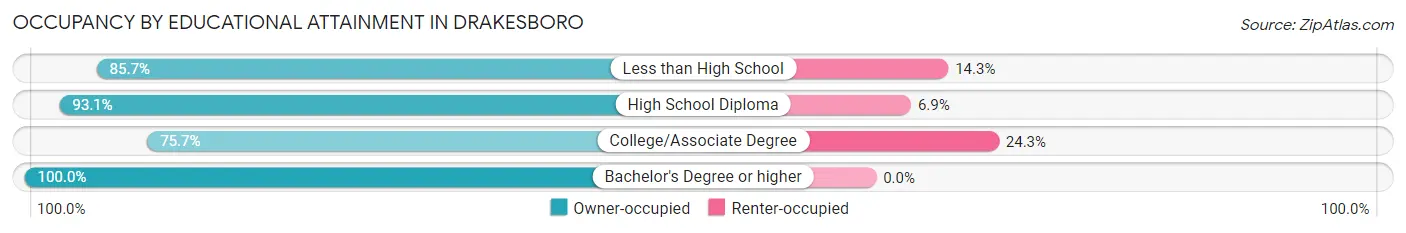
| Household Size | Owner-occupied | Renter-occupied |
| Less than High School | 30 (85.7%) | 5 (14.3%) |
| High School Diploma | 81 (93.1%) | 6 (6.9%) |
| College/Associate Degree | 28 (75.7%) | 9 (24.3%) |
| Bachelor's Degree or higher | 4 (100.0%) | 0 (0.0%) |
Occupancy by Age of Householder in Drakesboro
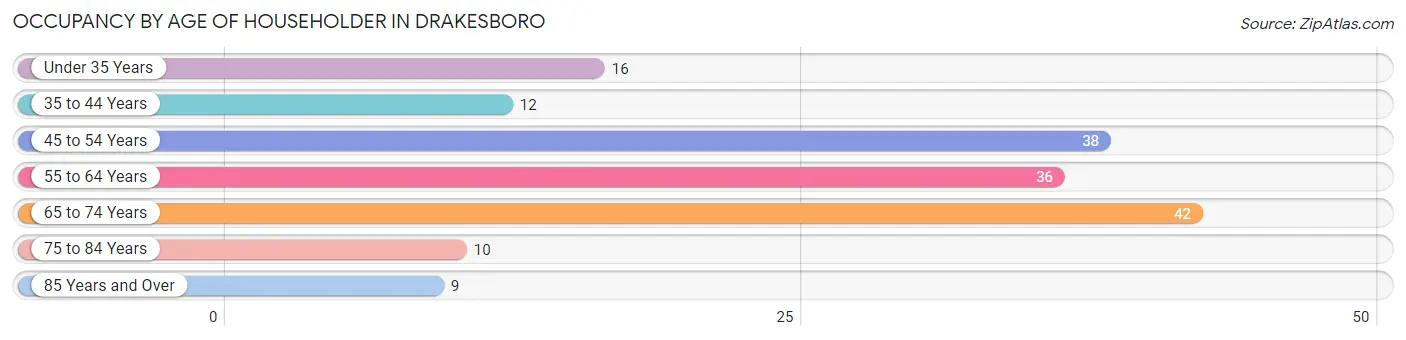
| Age Bracket | # Households | % Households |
| Under 35 Years | 16 | 9.8% |
| 35 to 44 Years | 12 | 7.4% |
| 45 to 54 Years | 38 | 23.3% |
| 55 to 64 Years | 36 | 22.1% |
| 65 to 74 Years | 42 | 25.8% |
| 75 to 84 Years | 10 | 6.1% |
| 85 Years and Over | 9 | 5.5% |
| Total | 163 | 100.0% |
Housing Finances in Drakesboro
Median Income by Occupancy in Drakesboro
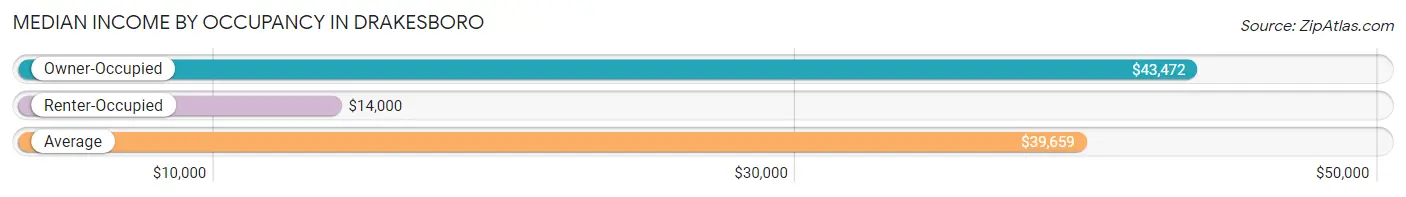
| Occupancy Type | # Households | Median Income |
| Owner-Occupied | 143 (87.7%) | $43,472 |
| Renter-Occupied | 20 (12.3%) | $14,000 |
| Average | 163 (100.0%) | $39,659 |
Occupancy by Householder Income Bracket in Drakesboro
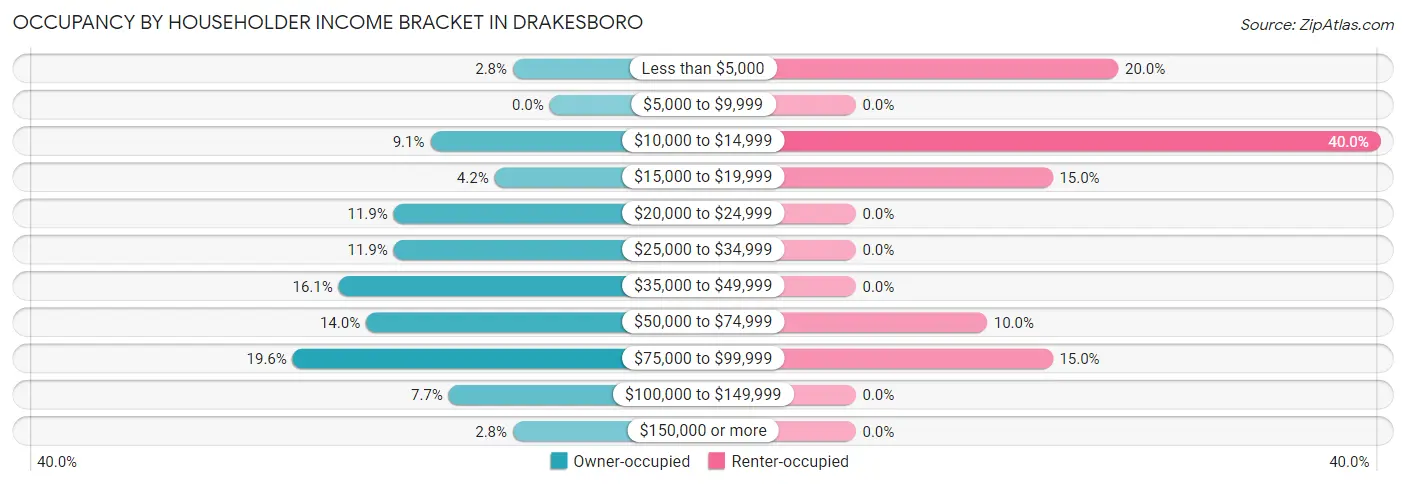
| Income Bracket | Owner-occupied | Renter-occupied |
| Less than $5,000 | 4 (2.8%) | 4 (20.0%) |
| $5,000 to $9,999 | 0 (0.0%) | 0 (0.0%) |
| $10,000 to $14,999 | 13 (9.1%) | 8 (40.0%) |
| $15,000 to $19,999 | 6 (4.2%) | 3 (15.0%) |
| $20,000 to $24,999 | 17 (11.9%) | 0 (0.0%) |
| $25,000 to $34,999 | 17 (11.9%) | 0 (0.0%) |
| $35,000 to $49,999 | 23 (16.1%) | 0 (0.0%) |
| $50,000 to $74,999 | 20 (14.0%) | 2 (10.0%) |
| $75,000 to $99,999 | 28 (19.6%) | 3 (15.0%) |
| $100,000 to $149,999 | 11 (7.7%) | 0 (0.0%) |
| $150,000 or more | 4 (2.8%) | 0 (0.0%) |
| Total | 143 (100.0%) | 20 (100.0%) |
Monthly Housing Cost Tiers in Drakesboro
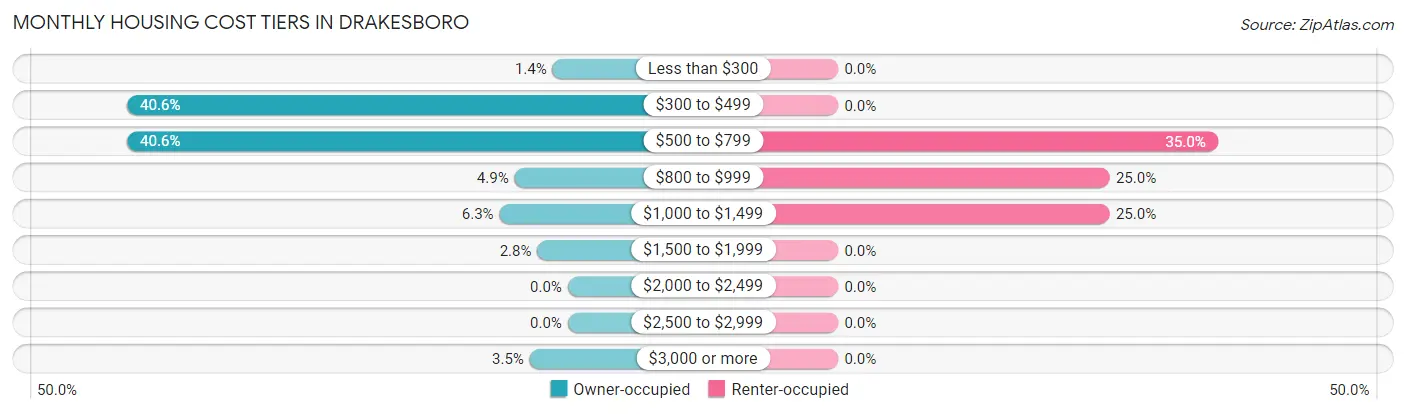
| Monthly Cost | Owner-occupied | Renter-occupied |
| Less than $300 | 2 (1.4%) | 0 (0.0%) |
| $300 to $499 | 58 (40.6%) | 0 (0.0%) |
| $500 to $799 | 58 (40.6%) | 7 (35.0%) |
| $800 to $999 | 7 (4.9%) | 5 (25.0%) |
| $1,000 to $1,499 | 9 (6.3%) | 5 (25.0%) |
| $1,500 to $1,999 | 4 (2.8%) | 0 (0.0%) |
| $2,000 to $2,499 | 0 (0.0%) | 0 (0.0%) |
| $2,500 to $2,999 | 0 (0.0%) | 0 (0.0%) |
| $3,000 or more | 5 (3.5%) | 0 (0.0%) |
| Total | 143 (100.0%) | 20 (100.0%) |
Physical Housing Characteristics in Drakesboro
Housing Structures in Drakesboro
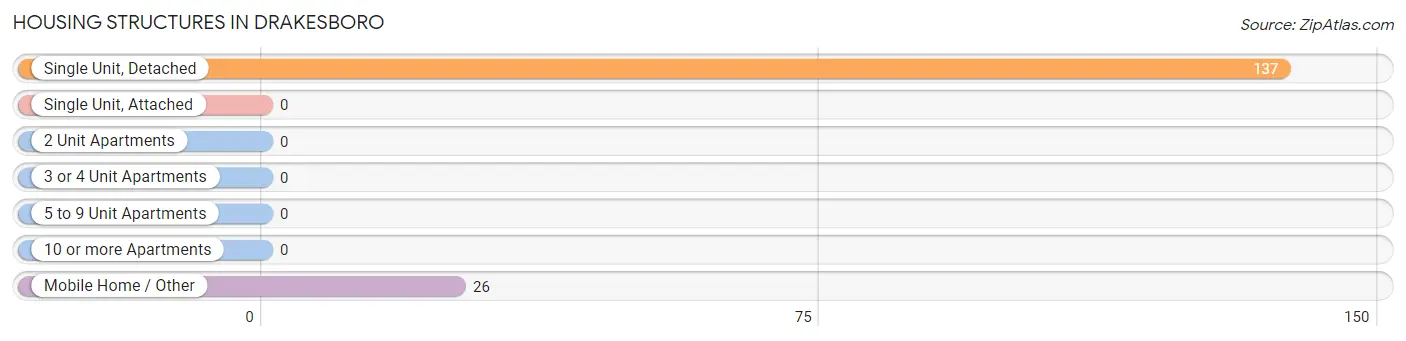
| Structure Type | # Housing Units | % Housing Units |
| Single Unit, Detached | 137 | 84.1% |
| Single Unit, Attached | 0 | 0.0% |
| 2 Unit Apartments | 0 | 0.0% |
| 3 or 4 Unit Apartments | 0 | 0.0% |
| 5 to 9 Unit Apartments | 0 | 0.0% |
| 10 or more Apartments | 0 | 0.0% |
| Mobile Home / Other | 26 | 16.0% |
| Total | 163 | 100.0% |
Housing Structures by Occupancy in Drakesboro
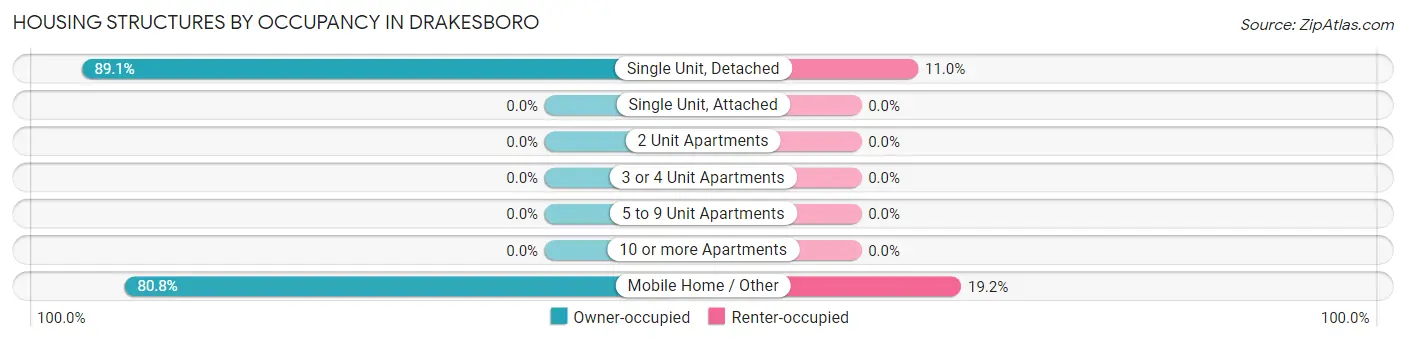
| Structure Type | Owner-occupied | Renter-occupied |
| Single Unit, Detached | 122 (89.0%) | 15 (11.0%) |
| Single Unit, Attached | 0 (0.0%) | 0 (0.0%) |
| 2 Unit Apartments | 0 (0.0%) | 0 (0.0%) |
| 3 or 4 Unit Apartments | 0 (0.0%) | 0 (0.0%) |
| 5 to 9 Unit Apartments | 0 (0.0%) | 0 (0.0%) |
| 10 or more Apartments | 0 (0.0%) | 0 (0.0%) |
| Mobile Home / Other | 21 (80.8%) | 5 (19.2%) |
| Total | 143 (87.7%) | 20 (12.3%) |
Housing Structures by Number of Rooms in Drakesboro
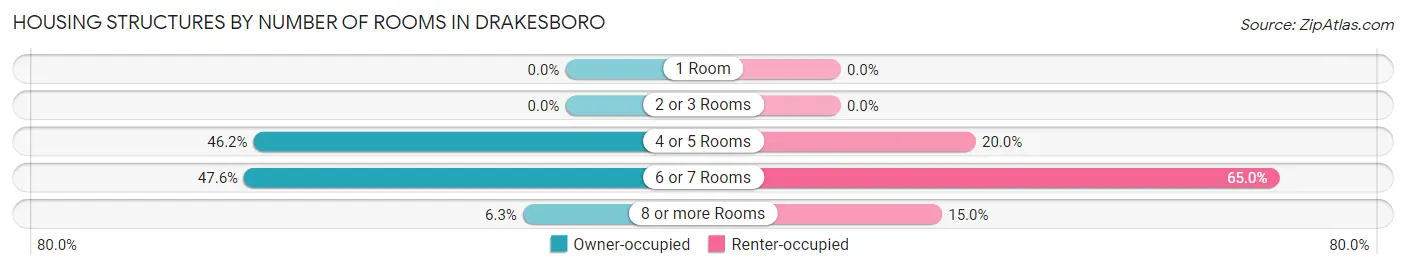
| Number of Rooms | Owner-occupied | Renter-occupied |
| 1 Room | 0 (0.0%) | 0 (0.0%) |
| 2 or 3 Rooms | 0 (0.0%) | 0 (0.0%) |
| 4 or 5 Rooms | 66 (46.2%) | 4 (20.0%) |
| 6 or 7 Rooms | 68 (47.5%) | 13 (65.0%) |
| 8 or more Rooms | 9 (6.3%) | 3 (15.0%) |
| Total | 143 (100.0%) | 20 (100.0%) |
Housing Structure by Heating Type in Drakesboro
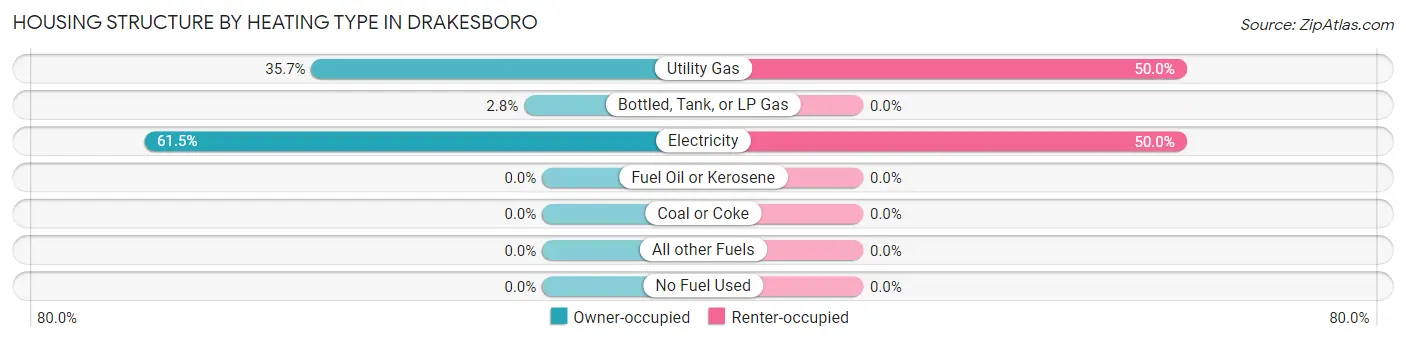
| Heating Type | Owner-occupied | Renter-occupied |
| Utility Gas | 51 (35.7%) | 10 (50.0%) |
| Bottled, Tank, or LP Gas | 4 (2.8%) | 0 (0.0%) |
| Electricity | 88 (61.5%) | 10 (50.0%) |
| Fuel Oil or Kerosene | 0 (0.0%) | 0 (0.0%) |
| Coal or Coke | 0 (0.0%) | 0 (0.0%) |
| All other Fuels | 0 (0.0%) | 0 (0.0%) |
| No Fuel Used | 0 (0.0%) | 0 (0.0%) |
| Total | 143 (100.0%) | 20 (100.0%) |
Household Vehicle Usage in Drakesboro
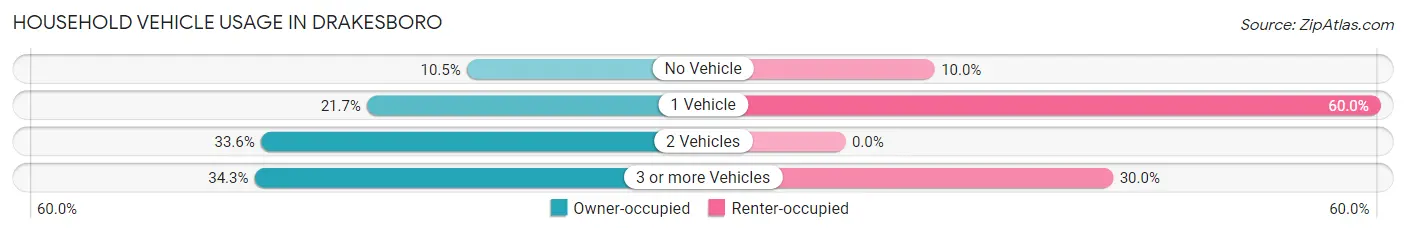
| Vehicles per Household | Owner-occupied | Renter-occupied |
| No Vehicle | 15 (10.5%) | 2 (10.0%) |
| 1 Vehicle | 31 (21.7%) | 12 (60.0%) |
| 2 Vehicles | 48 (33.6%) | 0 (0.0%) |
| 3 or more Vehicles | 49 (34.3%) | 6 (30.0%) |
| Total | 143 (100.0%) | 20 (100.0%) |
Real Estate & Mortgages in Drakesboro
Real Estate and Mortgage Overview in Drakesboro
| Characteristic | Without Mortgage | With Mortgage |
| Housing Units | 81 | 62 |
| Median Property Value | $74,300 | $75,700 |
| Median Household Income | - | - |
| Monthly Housing Costs | $467 | $5 |
| Real Estate Taxes | $588 | $7 |
Property Value by Mortgage Status in Drakesboro
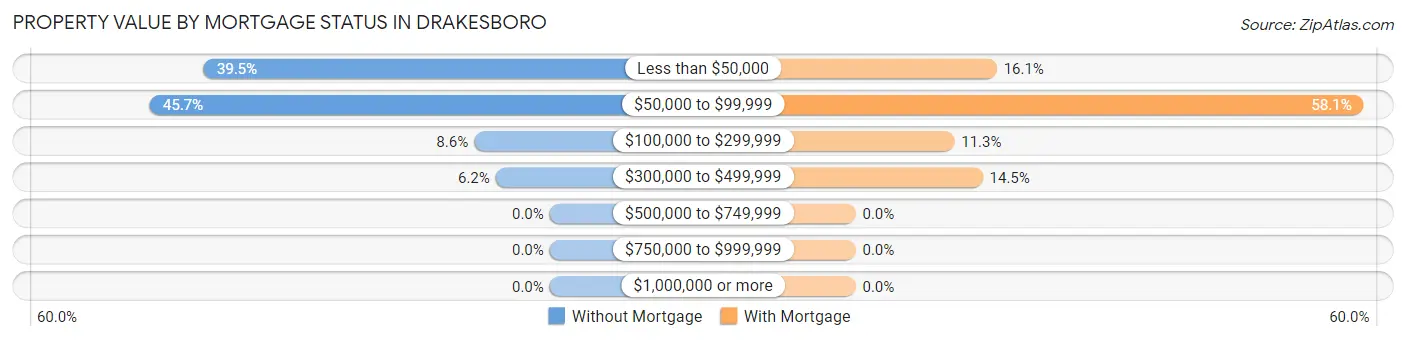
| Property Value | Without Mortgage | With Mortgage |
| Less than $50,000 | 32 (39.5%) | 10 (16.1%) |
| $50,000 to $99,999 | 37 (45.7%) | 36 (58.1%) |
| $100,000 to $299,999 | 7 (8.6%) | 7 (11.3%) |
| $300,000 to $499,999 | 5 (6.2%) | 9 (14.5%) |
| $500,000 to $749,999 | 0 (0.0%) | 0 (0.0%) |
| $750,000 to $999,999 | 0 (0.0%) | 0 (0.0%) |
| $1,000,000 or more | 0 (0.0%) | 0 (0.0%) |
| Total | 81 (100.0%) | 62 (100.0%) |
Household Income by Mortgage Status in Drakesboro
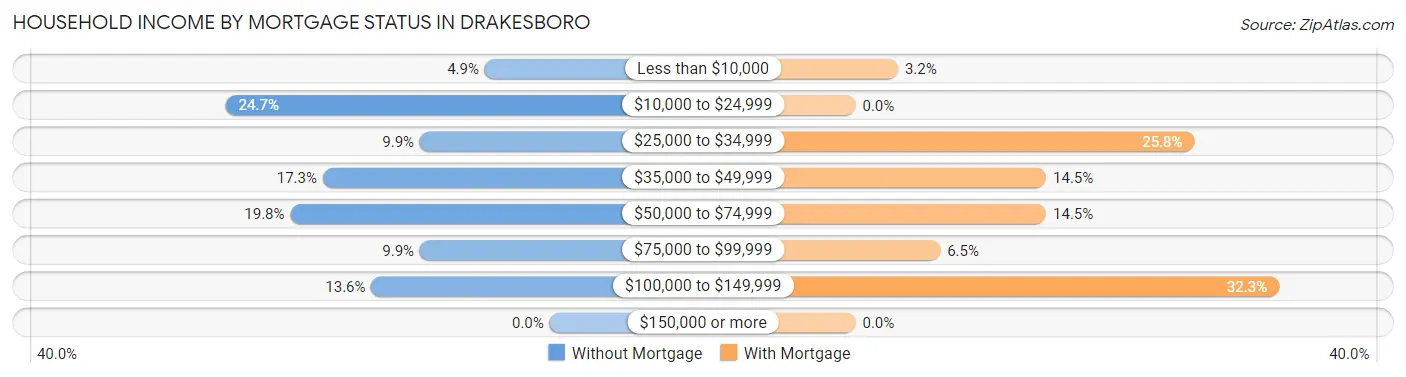
| Household Income | Without Mortgage | With Mortgage |
| Less than $10,000 | 4 (4.9%) | 2 (3.2%) |
| $10,000 to $24,999 | 20 (24.7%) | 0 (0.0%) |
| $25,000 to $34,999 | 8 (9.9%) | 16 (25.8%) |
| $35,000 to $49,999 | 14 (17.3%) | 9 (14.5%) |
| $50,000 to $74,999 | 16 (19.8%) | 9 (14.5%) |
| $75,000 to $99,999 | 8 (9.9%) | 4 (6.5%) |
| $100,000 to $149,999 | 11 (13.6%) | 20 (32.3%) |
| $150,000 or more | 0 (0.0%) | 0 (0.0%) |
| Total | 81 (100.0%) | 62 (100.0%) |
Property Value to Household Income Ratio in Drakesboro
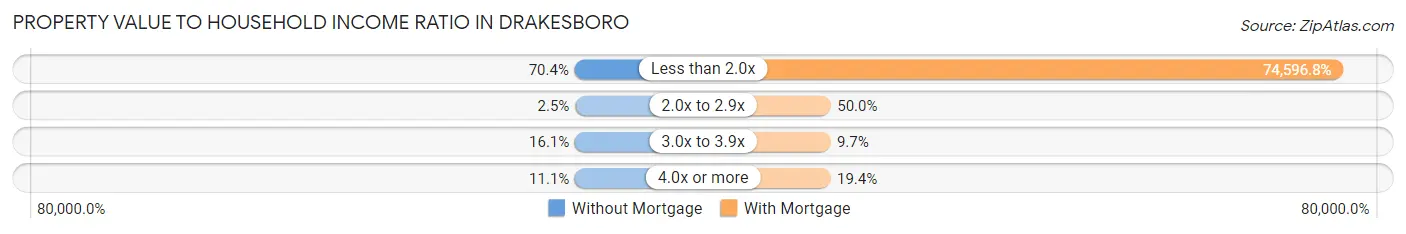
| Value-to-Income Ratio | Without Mortgage | With Mortgage |
| Less than 2.0x | 57 (70.4%) | 46,250 (74,596.8%) |
| 2.0x to 2.9x | 2 (2.5%) | 31 (50.0%) |
| 3.0x to 3.9x | 13 (16.1%) | 6 (9.7%) |
| 4.0x or more | 9 (11.1%) | 12 (19.4%) |
| Total | 81 (100.0%) | 62 (100.0%) |
Real Estate Taxes by Mortgage Status in Drakesboro
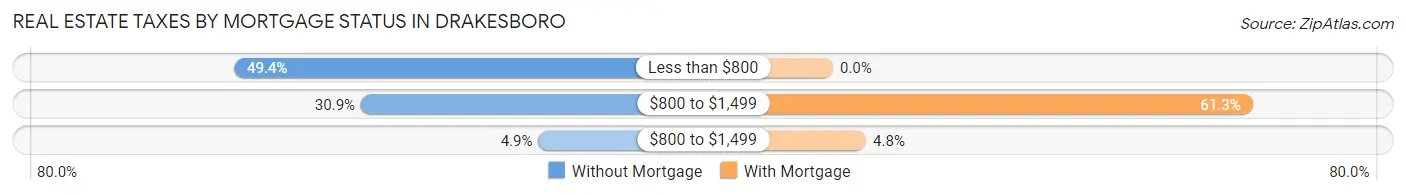
| Property Taxes | Without Mortgage | With Mortgage |
| Less than $800 | 40 (49.4%) | 0 (0.0%) |
| $800 to $1,499 | 25 (30.9%) | 38 (61.3%) |
| $800 to $1,499 | 4 (4.9%) | 3 (4.8%) |
| Total | 81 (100.0%) | 62 (100.0%) |
Health & Disability in Drakesboro
Health Insurance Coverage by Age in Drakesboro
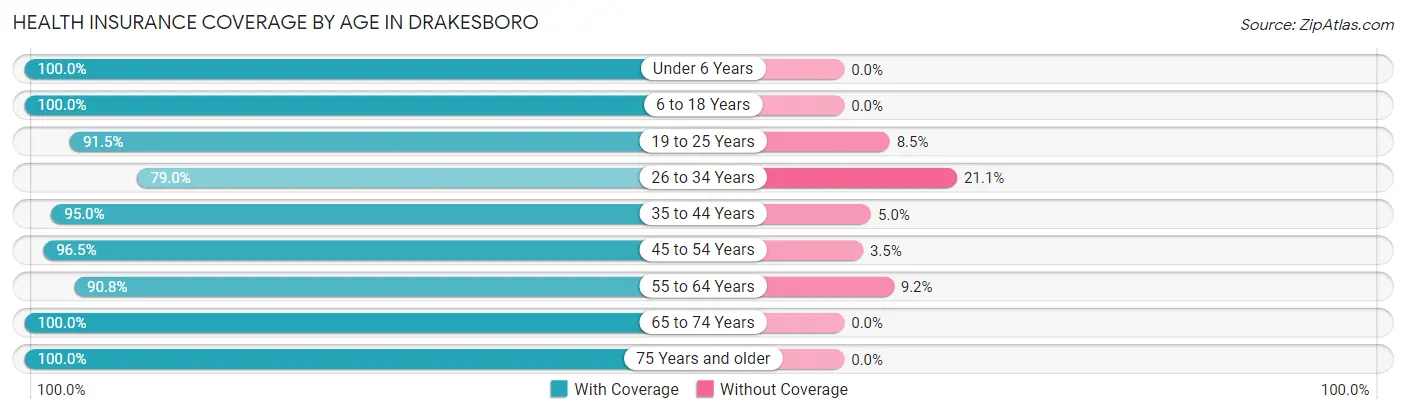
| Age Bracket | With Coverage | Without Coverage |
| Under 6 Years | 34 (100.0%) | 0 (0.0%) |
| 6 to 18 Years | 78 (100.0%) | 0 (0.0%) |
| 19 to 25 Years | 54 (91.5%) | 5 (8.5%) |
| 26 to 34 Years | 15 (78.9%) | 4 (21.0%) |
| 35 to 44 Years | 57 (95.0%) | 3 (5.0%) |
| 45 to 54 Years | 111 (96.5%) | 4 (3.5%) |
| 55 to 64 Years | 59 (90.8%) | 6 (9.2%) |
| 65 to 74 Years | 42 (100.0%) | 0 (0.0%) |
| 75 Years and older | 19 (100.0%) | 0 (0.0%) |
| Total | 469 (95.5%) | 22 (4.5%) |
Health Insurance Coverage by Citizenship Status in Drakesboro
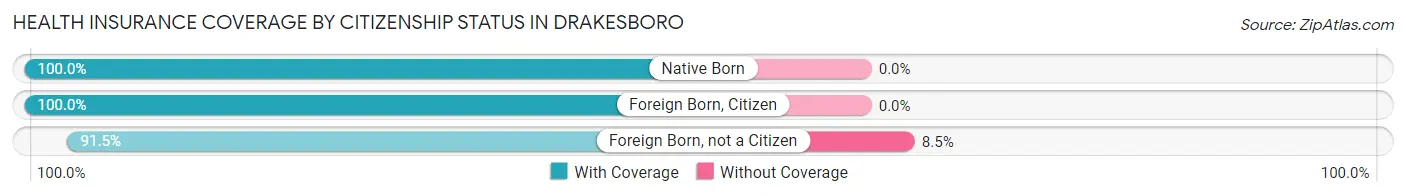
| Citizenship Status | With Coverage | Without Coverage |
| Native Born | 34 (100.0%) | 0 (0.0%) |
| Foreign Born, Citizen | 78 (100.0%) | 0 (0.0%) |
| Foreign Born, not a Citizen | 54 (91.5%) | 5 (8.5%) |
Health Insurance Coverage by Household Income in Drakesboro
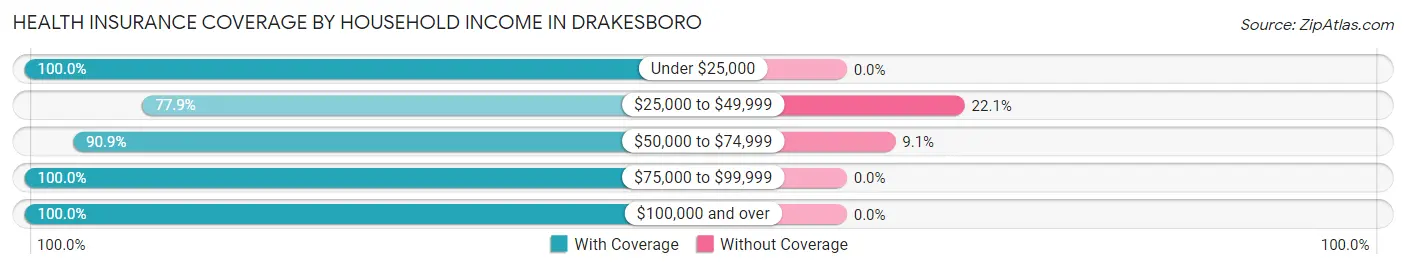
| Household Income | With Coverage | Without Coverage |
| Under $25,000 | 218 (100.0%) | 0 (0.0%) |
| $25,000 to $49,999 | 60 (77.9%) | 17 (22.1%) |
| $50,000 to $74,999 | 50 (90.9%) | 5 (9.1%) |
| $75,000 to $99,999 | 103 (100.0%) | 0 (0.0%) |
| $100,000 and over | 38 (100.0%) | 0 (0.0%) |
Public vs Private Health Insurance Coverage by Age in Drakesboro
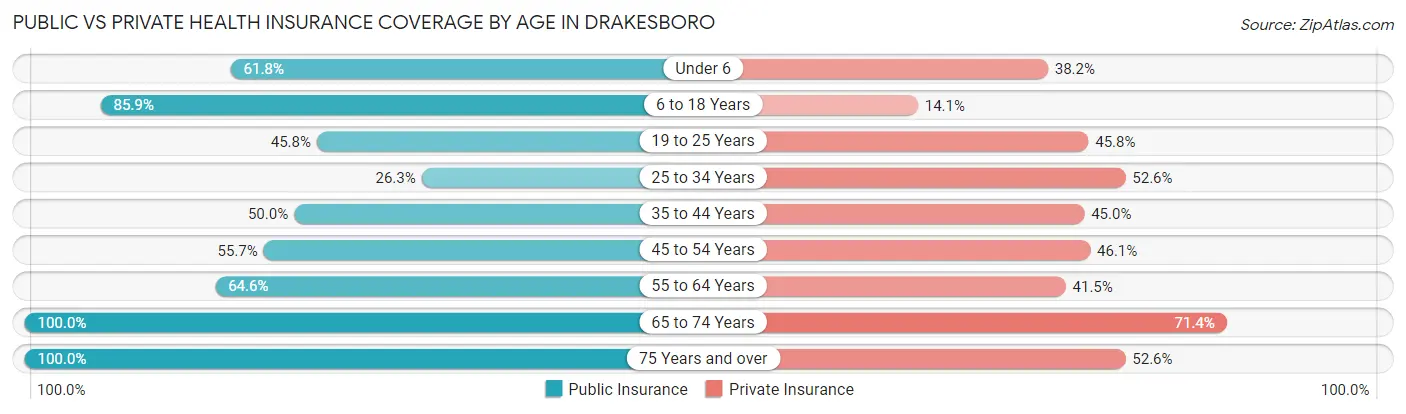
| Age Bracket | Public Insurance | Private Insurance |
| Under 6 | 21 (61.8%) | 13 (38.2%) |
| 6 to 18 Years | 67 (85.9%) | 11 (14.1%) |
| 19 to 25 Years | 27 (45.8%) | 27 (45.8%) |
| 25 to 34 Years | 5 (26.3%) | 10 (52.6%) |
| 35 to 44 Years | 30 (50.0%) | 27 (45.0%) |
| 45 to 54 Years | 64 (55.6%) | 53 (46.1%) |
| 55 to 64 Years | 42 (64.6%) | 27 (41.5%) |
| 65 to 74 Years | 42 (100.0%) | 30 (71.4%) |
| 75 Years and over | 19 (100.0%) | 10 (52.6%) |
| Total | 317 (64.6%) | 208 (42.4%) |
Disability Status by Sex by Age in Drakesboro
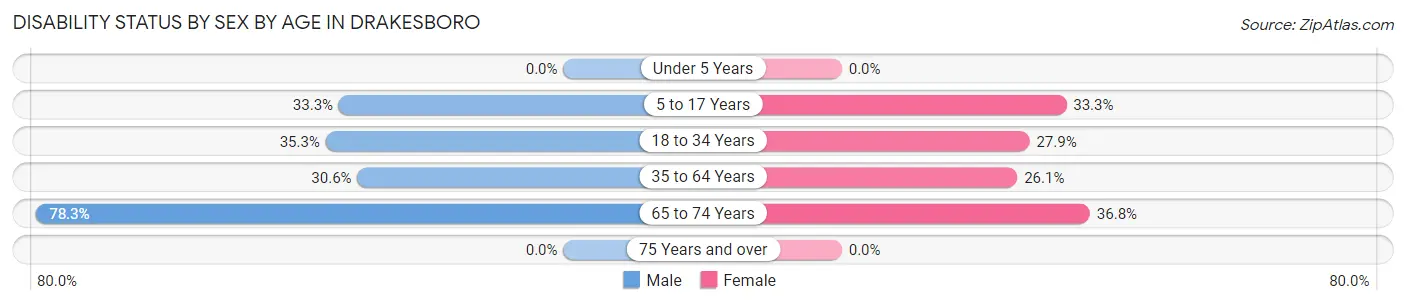
| Age Bracket | Male | Female |
| Under 5 Years | 0 (0.0%) | 0 (0.0%) |
| 5 to 17 Years | 9 (33.3%) | 17 (33.3%) |
| 18 to 34 Years | 6 (35.3%) | 17 (27.9%) |
| 35 to 64 Years | 37 (30.6%) | 31 (26.1%) |
| 65 to 74 Years | 18 (78.3%) | 7 (36.8%) |
| 75 Years and over | 0 (0.0%) | 0 (0.0%) |
Disability Class by Sex by Age in Drakesboro
Disability Class: Hearing Difficulty
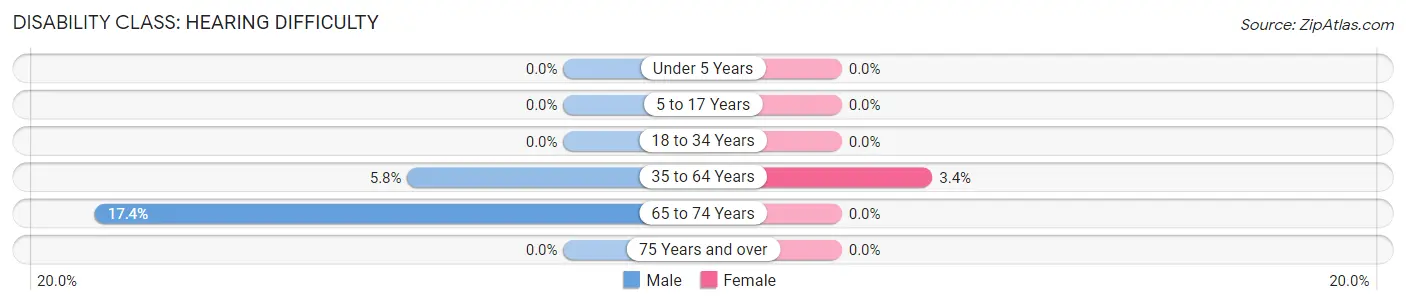
| Age Bracket | Male | Female |
| Under 5 Years | 0 (0.0%) | 0 (0.0%) |
| 5 to 17 Years | 0 (0.0%) | 0 (0.0%) |
| 18 to 34 Years | 0 (0.0%) | 0 (0.0%) |
| 35 to 64 Years | 7 (5.8%) | 4 (3.4%) |
| 65 to 74 Years | 4 (17.4%) | 0 (0.0%) |
| 75 Years and over | 0 (0.0%) | 0 (0.0%) |
Disability Class: Vision Difficulty
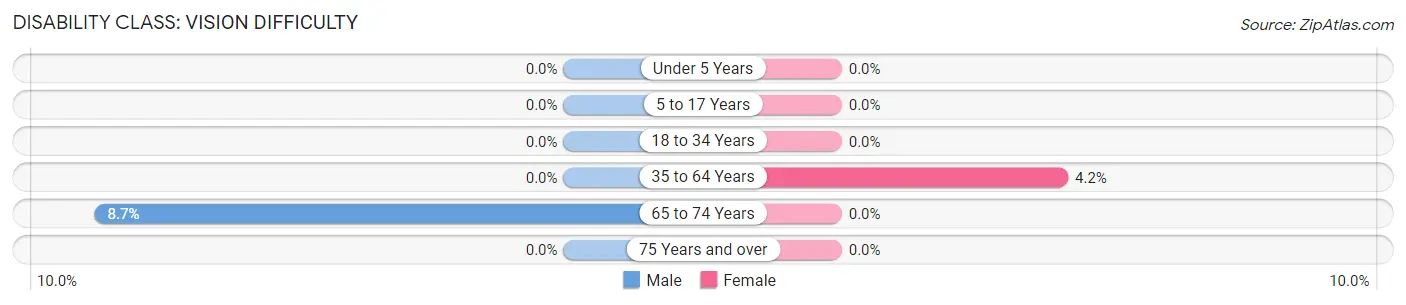
| Age Bracket | Male | Female |
| Under 5 Years | 0 (0.0%) | 0 (0.0%) |
| 5 to 17 Years | 0 (0.0%) | 0 (0.0%) |
| 18 to 34 Years | 0 (0.0%) | 0 (0.0%) |
| 35 to 64 Years | 0 (0.0%) | 5 (4.2%) |
| 65 to 74 Years | 2 (8.7%) | 0 (0.0%) |
| 75 Years and over | 0 (0.0%) | 0 (0.0%) |
Disability Class: Cognitive Difficulty
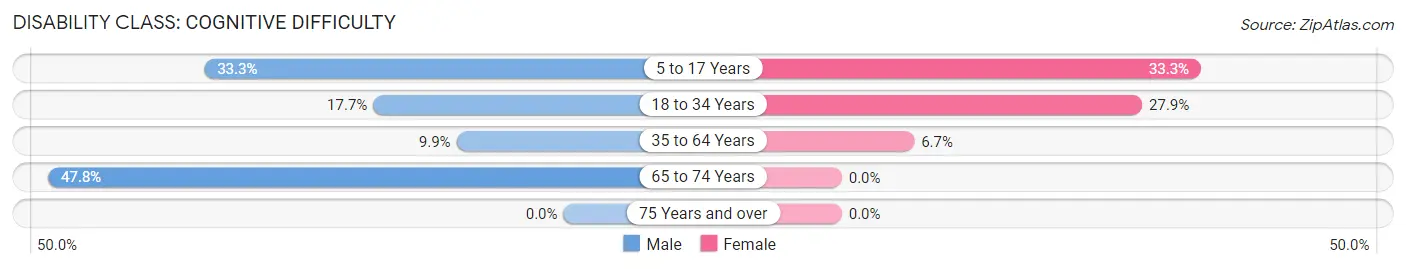
| Age Bracket | Male | Female |
| 5 to 17 Years | 9 (33.3%) | 17 (33.3%) |
| 18 to 34 Years | 3 (17.6%) | 17 (27.9%) |
| 35 to 64 Years | 12 (9.9%) | 8 (6.7%) |
| 65 to 74 Years | 11 (47.8%) | 0 (0.0%) |
| 75 Years and over | 0 (0.0%) | 0 (0.0%) |
Disability Class: Ambulatory Difficulty
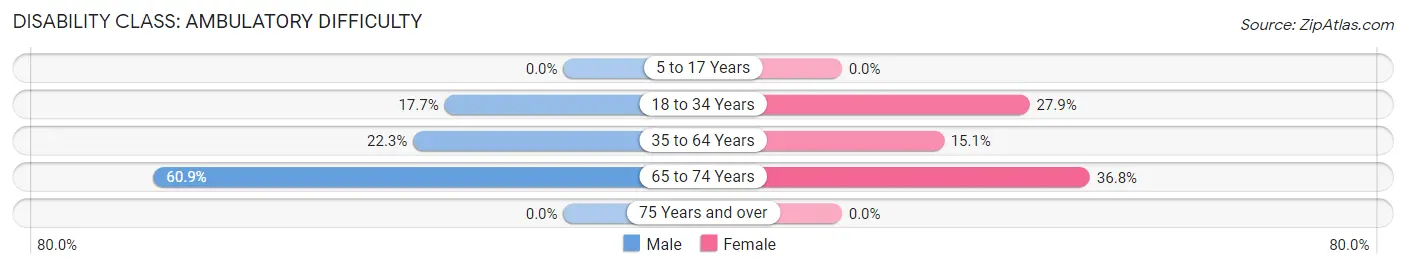
| Age Bracket | Male | Female |
| 5 to 17 Years | 0 (0.0%) | 0 (0.0%) |
| 18 to 34 Years | 3 (17.6%) | 17 (27.9%) |
| 35 to 64 Years | 27 (22.3%) | 18 (15.1%) |
| 65 to 74 Years | 14 (60.9%) | 7 (36.8%) |
| 75 Years and over | 0 (0.0%) | 0 (0.0%) |
Disability Class: Self-Care Difficulty
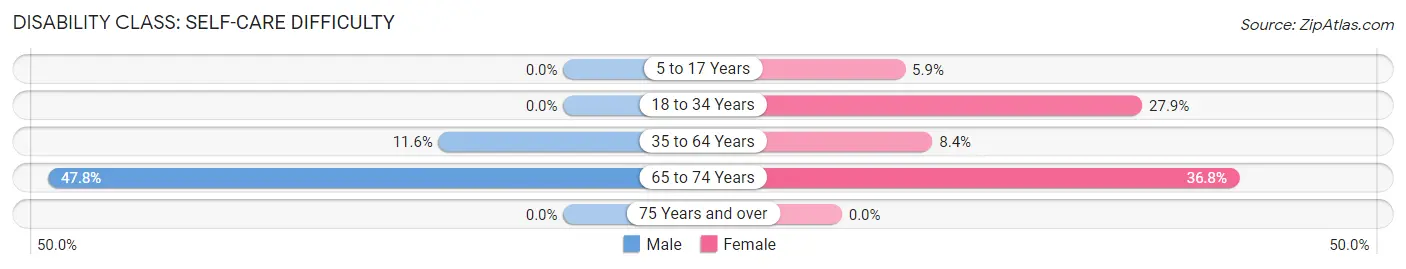
| Age Bracket | Male | Female |
| 5 to 17 Years | 0 (0.0%) | 3 (5.9%) |
| 18 to 34 Years | 0 (0.0%) | 17 (27.9%) |
| 35 to 64 Years | 14 (11.6%) | 10 (8.4%) |
| 65 to 74 Years | 11 (47.8%) | 7 (36.8%) |
| 75 Years and over | 0 (0.0%) | 0 (0.0%) |
Technology Access in Drakesboro
Computing Device Access in Drakesboro
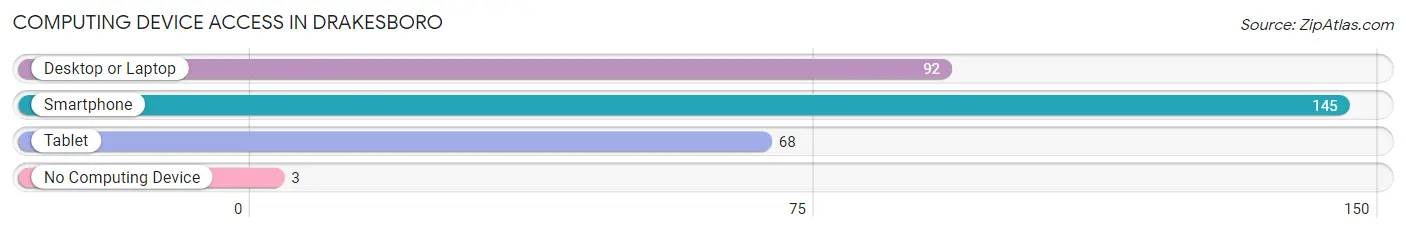
| Device Type | # Households | % Households |
| Desktop or Laptop | 92 | 56.4% |
| Smartphone | 145 | 89.0% |
| Tablet | 68 | 41.7% |
| No Computing Device | 3 | 1.8% |
| Total | 163 | 100.0% |
Internet Access in Drakesboro
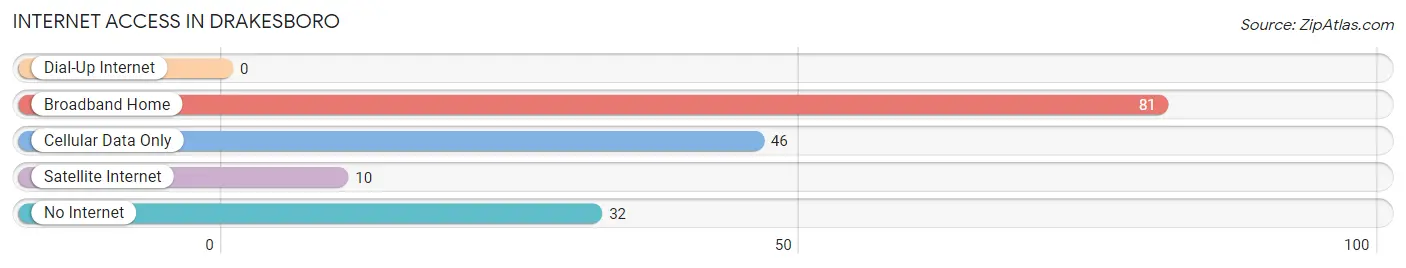
| Internet Type | # Households | % Households |
| Dial-Up Internet | 0 | 0.0% |
| Broadband Home | 81 | 49.7% |
| Cellular Data Only | 46 | 28.2% |
| Satellite Internet | 10 | 6.1% |
| No Internet | 32 | 19.6% |
| Total | 163 | 100.0% |
Drakesboro Summary
Drakesboro is a small city located in Muhlenberg County, Kentucky. It is situated on the banks of the Green River, and is part of the Western Coal Fields region of the state. The city has a population of approximately 1,000 people, and is known for its rich history and culture.
History
Drakesboro was founded in 1883 by William Drake, a local businessman. He named the town after his father, who had been a prominent figure in the area. The town was originally a small farming community, but soon grew to become a major coal mining center. The coal industry was the main source of employment for the town, and it was the largest coal producer in the county.
In the early 1900s, Drakesboro was a bustling town with a variety of businesses, including a bank, a hotel, a movie theater, and several stores. The town also had a school, a post office, and a library.
The coal industry began to decline in the 1950s, and the town’s population began to decline as well. In the 1970s, the town was hit hard by the recession, and many of the businesses closed. The town’s population continued to decline until the 1990s, when it began to stabilize.
Geography
Drakesboro is located in the Western Coal Fields region of Kentucky. It is situated on the banks of the Green River, and is surrounded by rolling hills and farmland. The city is located about 30 miles from the state capital of Frankfort.
The climate in Drakesboro is humid subtropical, with hot summers and mild winters. The average annual temperature is around 60 degrees Fahrenheit. The average annual precipitation is around 45 inches.
Economy
The economy of Drakesboro is largely based on agriculture and tourism. The town is home to several farms, and the surrounding area is known for its production of tobacco, corn, and soybeans.
The town is also a popular tourist destination, and is home to several attractions, including the Green River Museum, the Drakesboro Historical Society, and the Drakesboro Country Club.
Demographics
As of the 2010 census, the population of Drakesboro was 1,000 people. The racial makeup of the town was 97.2% White, 0.7% African American, 0.2% Native American, 0.2% Asian, 0.2% from other races, and 1.7% from two or more races.
The median household income in Drakesboro was $31,250, and the median family income was $37,500. The per capita income was $17,500. About 17.2% of the population was below the poverty line.
Conclusion
Drakesboro is a small city located in Muhlenberg County, Kentucky. It is situated on the banks of the Green River, and is part of the Western Coal Fields region of the state. The city has a population of approximately 1,000 people, and is known for its rich history and culture. The economy of Drakesboro is largely based on agriculture and tourism, and the town is home to several attractions. The population of Drakesboro is mostly White, with a small percentage of African American, Native American, and Asian residents. The median household income in Drakesboro is $31,250, and the per capita income is $17,500.
Common Questions
What is Per Capita Income in Drakesboro?
Per Capita income in Drakesboro is $18,525.
What is the Median Family Income in Drakesboro?
Median Family Income in Drakesboro is $65,000.
What is the Median Household income in Drakesboro?
Median Household Income in Drakesboro is $39,659.
What is Income or Wage Gap in Drakesboro?
Income or Wage Gap in Drakesboro is 66.8%.
Women in Drakesboro earn 33.2 cents for every dollar earned by a man.
What is Inequality or Gini Index in Drakesboro?
Inequality or Gini Index in Drakesboro is 0.41.
What is the Total Population of Drakesboro?
Total Population of Drakesboro is 491.
What is the Total Male Population of Drakesboro?
Total Male Population of Drakesboro is 209.
What is the Total Female Population of Drakesboro?
Total Female Population of Drakesboro is 282.
What is the Ratio of Males per 100 Females in Drakesboro?
There are 74.11 Males per 100 Females in Drakesboro.
What is the Ratio of Females per 100 Males in Drakesboro?
There are 134.93 Females per 100 Males in Drakesboro.
What is the Median Population Age in Drakesboro?
Median Population Age in Drakesboro is 42.7 Years.
What is the Average Family Size in Drakesboro
Average Family Size in Drakesboro is 3.7 People.
What is the Average Household Size in Drakesboro
Average Household Size in Drakesboro is 3.0 People.
How Large is the Labor Force in Drakesboro?
There are 166 People in the Labor Forcein in Drakesboro.
What is the Percentage of People in the Labor Force in Drakesboro?
43.0% of People are in the Labor Force in Drakesboro.
What is the Unemployment Rate in Drakesboro?
Unemployment Rate in Drakesboro is 4.8%.