Wendell, MN Map & Demographics
Wendell Map
Wendell Overview
$31,699
PER CAPITA INCOME
$45,000
AVG FAMILY INCOME
$62,500
AVG HOUSEHOLD INCOME
0.36
INEQUALITY / GINI INDEX
185
TOTAL POPULATION
100
MALE POPULATION
85
FEMALE POPULATION
117.65
MALES / 100 FEMALES
85.00
FEMALES / 100 MALES
42.2
MEDIAN AGE
2.4
AVG FAMILY SIZE
2.2
AVG HOUSEHOLD SIZE
105
LABOR FORCE [ PEOPLE ]
70.0%
PERCENT IN LABOR FORCE
Wendell Zip Codes
Wendell Area Codes
Income in Wendell
Income Overview in Wendell
Per Capita Income in Wendell is $31,699, while median incomes of families and households are $45,000 and $62,500 respectively.
| Characteristic | Number | Measure |
| Per Capita Income | 185 | $31,699 |
| Median Family Income | 56 | $45,000 |
| Mean Family Income | 56 | $51,654 |
| Median Household Income | 84 | $62,500 |
| Mean Household Income | 84 | $79,874 |
| Income Deficit | 56 | $0 |
| Wage / Income Gap (%) | 185 | 0.00% |
| Wage / Income Gap ($) | 185 | 100.00¢ per $1 |
| Gini / Inequality Index | 185 | 0.36 |
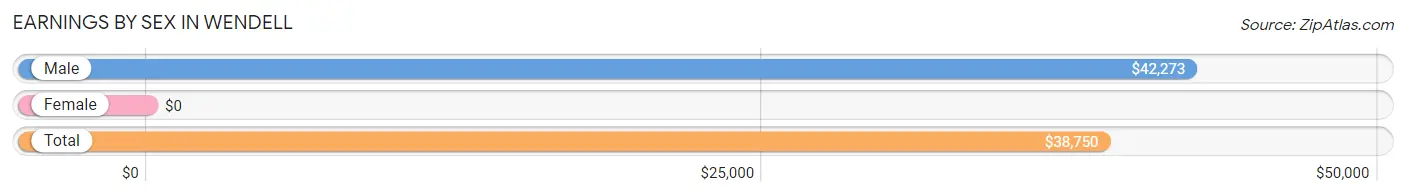
Earnings by Sex in Wendell
| Sex | Number | Average Earnings |
| Male | 68 (61.8%) | $42,273 |
| Female | 42 (38.2%) | $0 |
| Total | 110 (100.0%) | $38,750 |
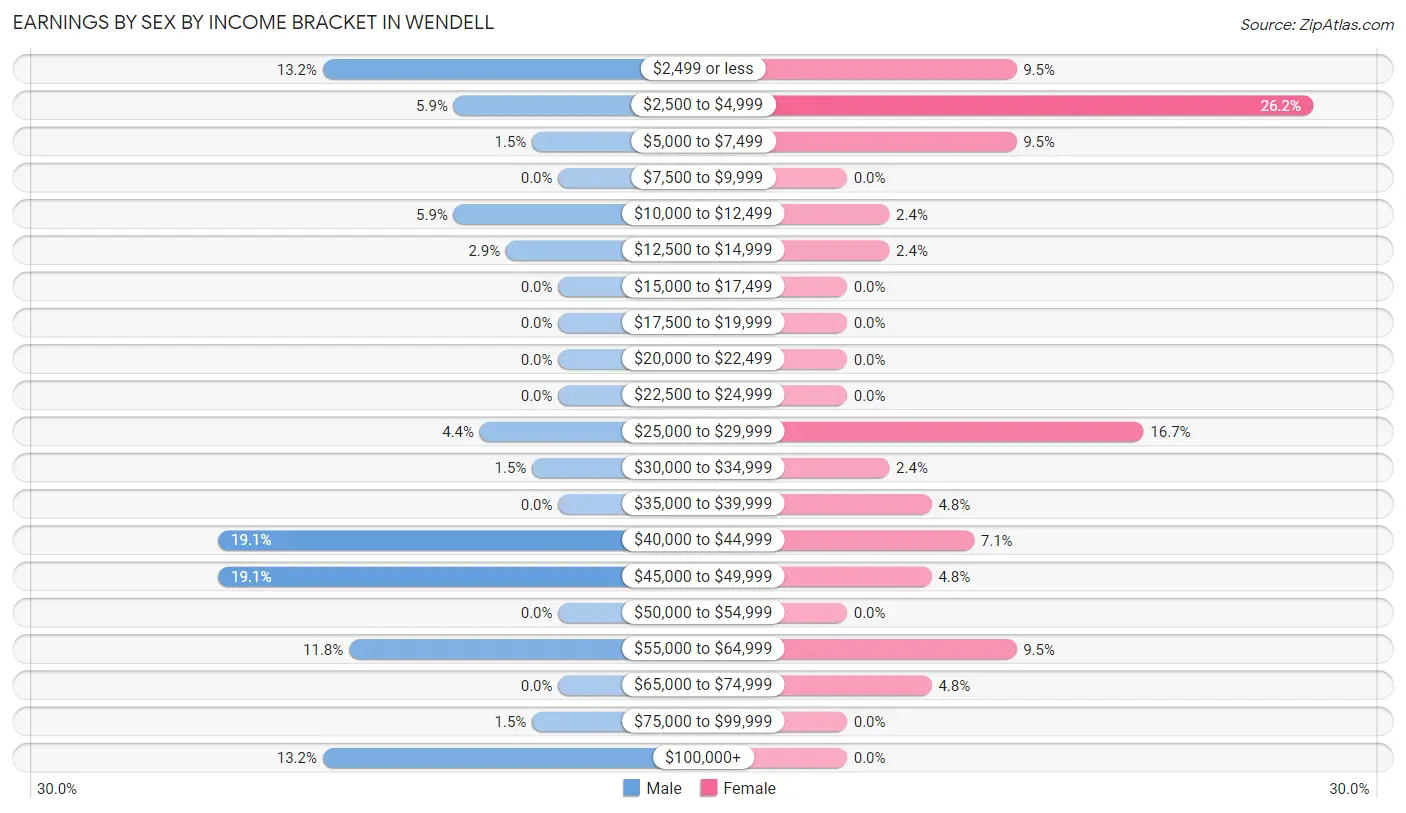
Earnings by Sex by Income Bracket in Wendell
The most common earnings brackets in Wendell are $40,000 to $44,999 for men (13 | 19.1%) and $2,500 to $4,999 for women (11 | 26.2%).
| Income | Male | Female |
| $2,499 or less | 9 (13.2%) | 4 (9.5%) |
| $2,500 to $4,999 | 4 (5.9%) | 11 (26.2%) |
| $5,000 to $7,499 | 1 (1.5%) | 4 (9.5%) |
| $7,500 to $9,999 | 0 (0.0%) | 0 (0.0%) |
| $10,000 to $12,499 | 4 (5.9%) | 1 (2.4%) |
| $12,500 to $14,999 | 2 (2.9%) | 1 (2.4%) |
| $15,000 to $17,499 | 0 (0.0%) | 0 (0.0%) |
| $17,500 to $19,999 | 0 (0.0%) | 0 (0.0%) |
| $20,000 to $22,499 | 0 (0.0%) | 0 (0.0%) |
| $22,500 to $24,999 | 0 (0.0%) | 0 (0.0%) |
| $25,000 to $29,999 | 3 (4.4%) | 7 (16.7%) |
| $30,000 to $34,999 | 1 (1.5%) | 1 (2.4%) |
| $35,000 to $39,999 | 0 (0.0%) | 2 (4.8%) |
| $40,000 to $44,999 | 13 (19.1%) | 3 (7.1%) |
| $45,000 to $49,999 | 13 (19.1%) | 2 (4.8%) |
| $50,000 to $54,999 | 0 (0.0%) | 0 (0.0%) |
| $55,000 to $64,999 | 8 (11.8%) | 4 (9.5%) |
| $65,000 to $74,999 | 0 (0.0%) | 2 (4.8%) |
| $75,000 to $99,999 | 1 (1.5%) | 0 (0.0%) |
| $100,000+ | 9 (13.2%) | 0 (0.0%) |
| Total | 68 (100.0%) | 42 (100.0%) |
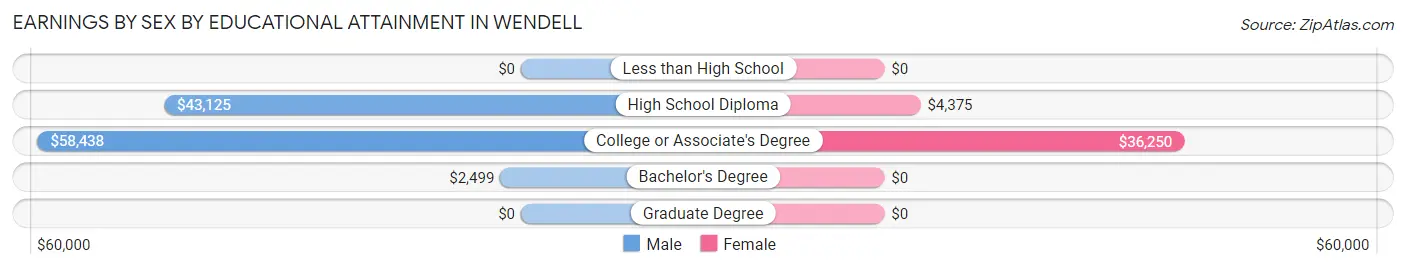
Earnings by Sex by Educational Attainment in Wendell
Average earnings in Wendell are $42,273 for men and $26,607 for women, a difference of 37.1%. Men with an educational attainment of college or associate's degree enjoy the highest average annual earnings of $58,438, while those with bachelor's degree education earn the least with $2,499. Women with an educational attainment of college or associate's degree earn the most with the average annual earnings of $36,250, while those with high school diploma education have the smallest earnings of $4,375.
| Educational Attainment | Male Income | Female Income |
| Less than High School | - | - |
| High School Diploma | $43,125 | $4,375 |
| College or Associate's Degree | $58,438 | $36,250 |
| Bachelor's Degree | $2,499 | $0 |
| Graduate Degree | - | - |
| Total | $42,273 | $26,607 |
Family Income in Wendell
Family Income Brackets in Wendell
According to the Wendell family income data, there are 13 families falling into the $75,000 to $99,999 income range, which is the most common income bracket and makes up 23.2% of all families.
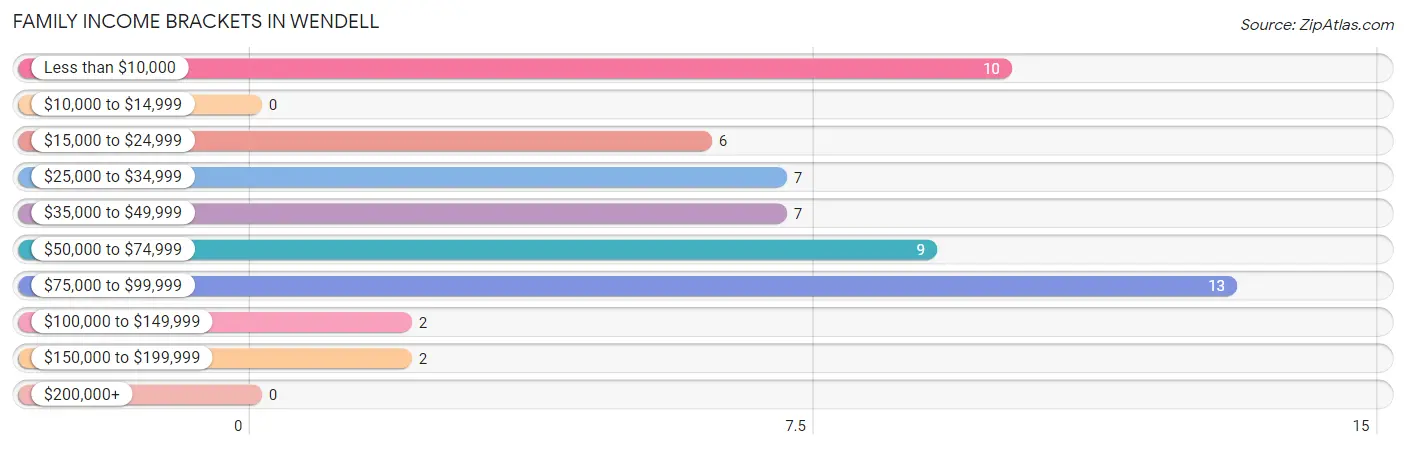
| Income Bracket | # Families | % Families |
| Less than $10,000 | 10 | 17.9% |
| $10,000 to $14,999 | 0 | 0.0% |
| $15,000 to $24,999 | 6 | 10.7% |
| $25,000 to $34,999 | 7 | 12.5% |
| $35,000 to $49,999 | 7 | 12.5% |
| $50,000 to $74,999 | 9 | 16.1% |
| $75,000 to $99,999 | 13 | 23.2% |
| $100,000 to $149,999 | 2 | 3.6% |
| $150,000 to $199,999 | 2 | 3.6% |
| $200,000+ | 0 | 0.0% |
Family Income by Famaliy Size in Wendell
2-person families (27 | 48.2%) account for the highest median family income in Wendell with $65,625 per family, while 2-person families (27 | 48.2%) have the highest median income of $32,812 per family member.
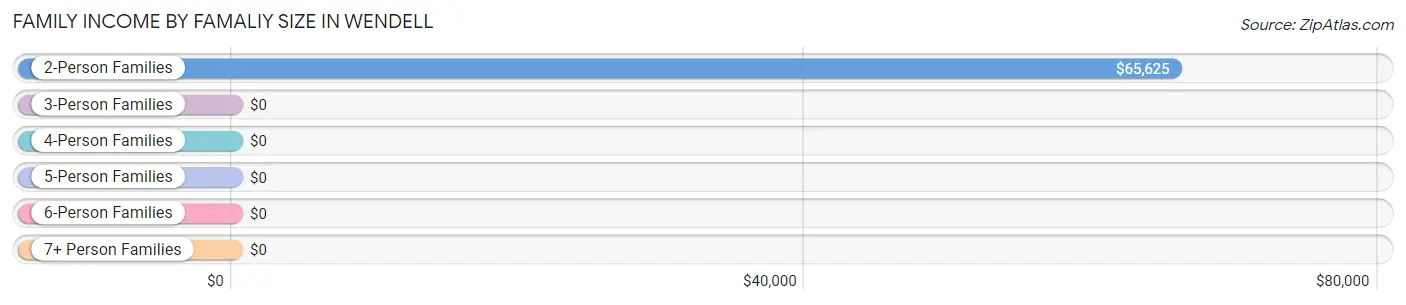
| Income Bracket | # Families | Median Income |
| 2-Person Families | 27 (48.2%) | $65,625 |
| 3-Person Families | 21 (37.5%) | $0 |
| 4-Person Families | 5 (8.9%) | $0 |
| 5-Person Families | 1 (1.8%) | $0 |
| 6-Person Families | 2 (3.6%) | $0 |
| 7+ Person Families | 0 (0.0%) | $0 |
| Total | 56 (100.0%) | $45,000 |
Family Income by Number of Earners in Wendell
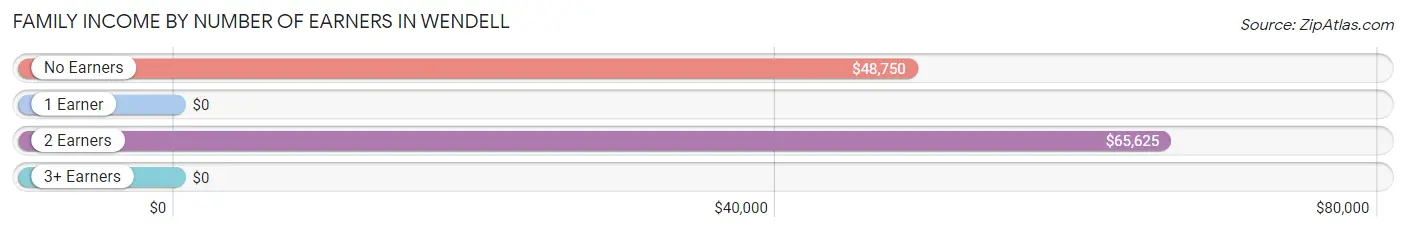
| Number of Earners | # Families | Median Income |
| No Earners | 7 (12.5%) | $48,750 |
| 1 Earner | 17 (30.4%) | $0 |
| 2 Earners | 32 (57.1%) | $65,625 |
| 3+ Earners | 0 (0.0%) | $0 |
| Total | 56 (100.0%) | $45,000 |
Household Income in Wendell
Household Income Brackets in Wendell
With 20 households falling in the category, the $50,000 to $74,999 income range is the most frequent in Wendell, accounting for 23.8% of all households. In contrast, only 1 households (1.2%) fall into the less than $10,000 income bracket, making it the least populous group.
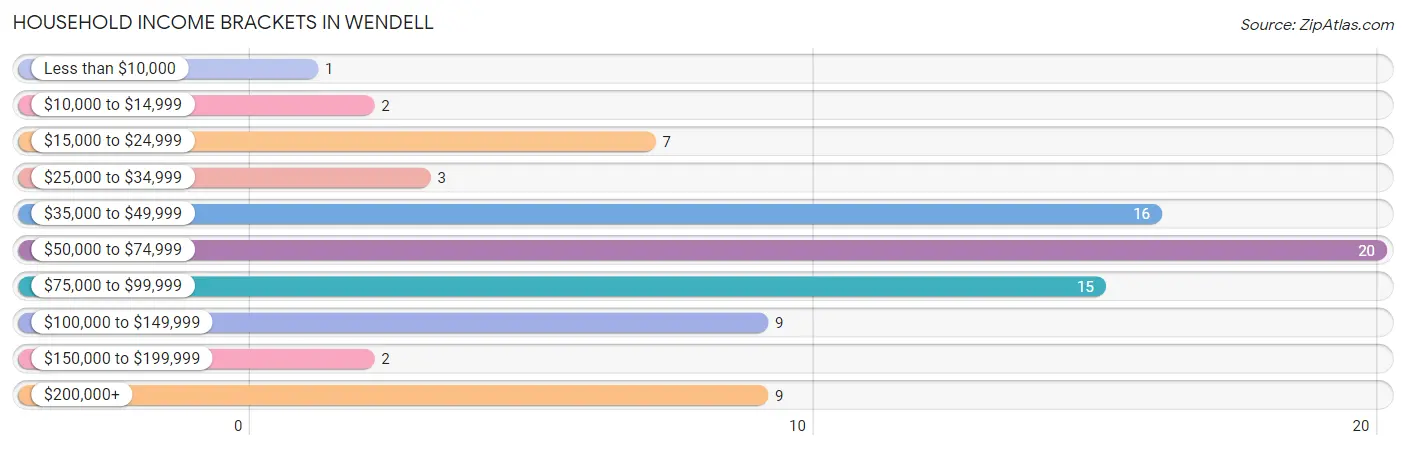
| Income Bracket | # Households | % Households |
| Less than $10,000 | 1 | 1.2% |
| $10,000 to $14,999 | 2 | 2.4% |
| $15,000 to $24,999 | 7 | 8.3% |
| $25,000 to $34,999 | 3 | 3.6% |
| $35,000 to $49,999 | 16 | 19.0% |
| $50,000 to $74,999 | 20 | 23.8% |
| $75,000 to $99,999 | 15 | 17.9% |
| $100,000 to $149,999 | 9 | 10.7% |
| $150,000 to $199,999 | 2 | 2.4% |
| $200,000+ | 9 | 10.7% |
Household Income by Householder Age in Wendell
The median household income in Wendell is $62,500, with the highest median household income of $84,250 found in the 25 to 44 years age bracket for the primary householder. A total of 31 households (36.9%) fall into this category. Meanwhile, the 15 to 24 years age bracket for the primary householder has the lowest median household income of $0, with 9 households (10.7%) in this group.
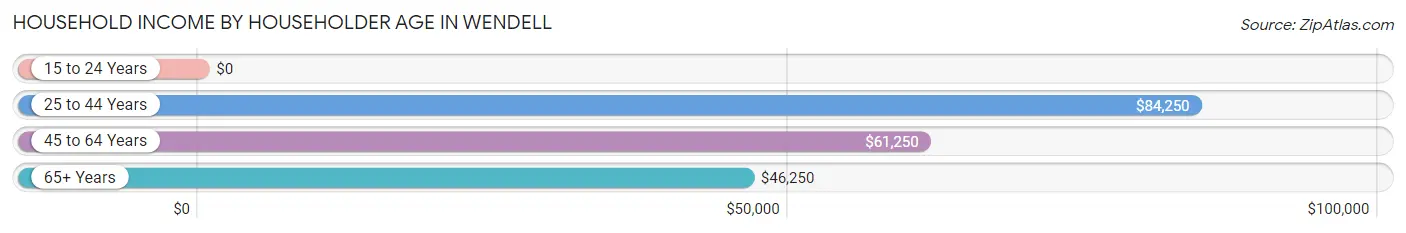
| Income Bracket | # Households | Median Income |
| 15 to 24 Years | 9 (10.7%) | $0 |
| 25 to 44 Years | 31 (36.9%) | $84,250 |
| 45 to 64 Years | 21 (25.0%) | $61,250 |
| 65+ Years | 23 (27.4%) | $46,250 |
| Total | 84 (100.0%) | $62,500 |
Poverty in Wendell
Income Below Poverty by Sex and Age in Wendell
With 13.0% poverty level for males and 29.4% for females among the residents of Wendell, under 5 year old males and 6 to 11 year old females are the most vulnerable to poverty, with 4 males (100.0%) and 1 females (100.0%) in their respective age groups living below the poverty level.
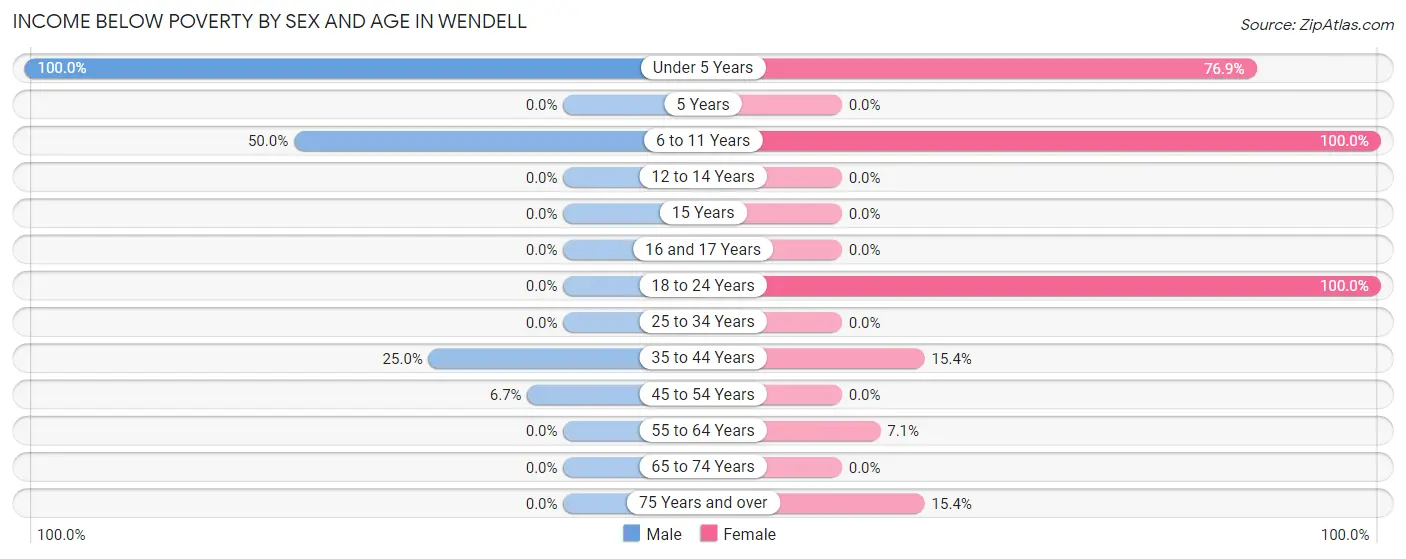
| Age Bracket | Male | Female |
| Under 5 Years | 4 (100.0%) | 10 (76.9%) |
| 5 Years | 0 (0.0%) | 0 (0.0%) |
| 6 to 11 Years | 4 (50.0%) | 1 (100.0%) |
| 12 to 14 Years | 0 (0.0%) | 0 (0.0%) |
| 15 Years | 0 (0.0%) | 0 (0.0%) |
| 16 and 17 Years | 0 (0.0%) | 0 (0.0%) |
| 18 to 24 Years | 0 (0.0%) | 9 (100.0%) |
| 25 to 34 Years | 0 (0.0%) | 0 (0.0%) |
| 35 to 44 Years | 4 (25.0%) | 2 (15.4%) |
| 45 to 54 Years | 1 (6.7%) | 0 (0.0%) |
| 55 to 64 Years | 0 (0.0%) | 1 (7.1%) |
| 65 to 74 Years | 0 (0.0%) | 0 (0.0%) |
| 75 Years and over | 0 (0.0%) | 2 (15.4%) |
| Total | 13 (13.0%) | 25 (29.4%) |
Income Above Poverty by Sex and Age in Wendell
According to the poverty statistics in Wendell, males aged 12 to 14 years and females aged 12 to 14 years are the age groups that are most secure financially, with 100.0% of males and 100.0% of females in these age groups living above the poverty line.
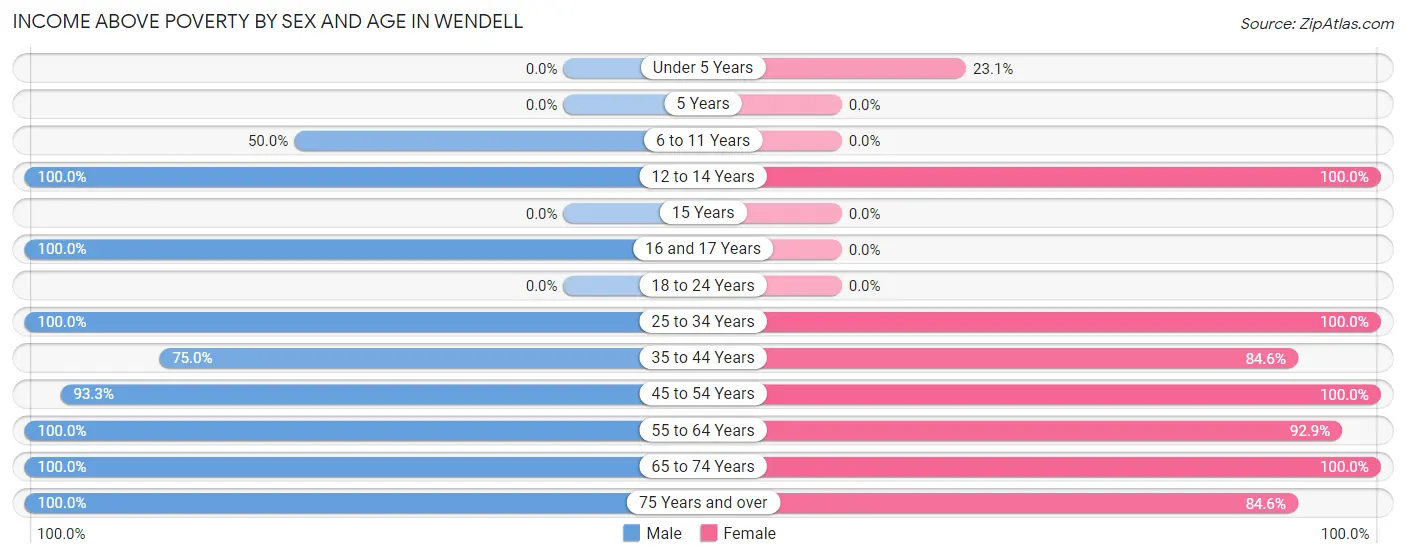
| Age Bracket | Male | Female |
| Under 5 Years | 0 (0.0%) | 3 (23.1%) |
| 5 Years | 0 (0.0%) | 0 (0.0%) |
| 6 to 11 Years | 4 (50.0%) | 0 (0.0%) |
| 12 to 14 Years | 5 (100.0%) | 4 (100.0%) |
| 15 Years | 0 (0.0%) | 0 (0.0%) |
| 16 and 17 Years | 4 (100.0%) | 0 (0.0%) |
| 18 to 24 Years | 0 (0.0%) | 0 (0.0%) |
| 25 to 34 Years | 23 (100.0%) | 4 (100.0%) |
| 35 to 44 Years | 12 (75.0%) | 11 (84.6%) |
| 45 to 54 Years | 14 (93.3%) | 2 (100.0%) |
| 55 to 64 Years | 10 (100.0%) | 13 (92.9%) |
| 65 to 74 Years | 8 (100.0%) | 12 (100.0%) |
| 75 Years and over | 7 (100.0%) | 11 (84.6%) |
| Total | 87 (87.0%) | 60 (70.6%) |
Income Below Poverty Among Married-Couple Families in Wendell
The poverty statistics for married-couple families in Wendell show that 10.8% or 4 of the total 37 families live below the poverty line. Families with 1 or 2 children have the highest poverty rate of 40.0%, comprising of 4 families. On the other hand, families with no children have the lowest poverty rate of 0.0%, which includes 0 families.
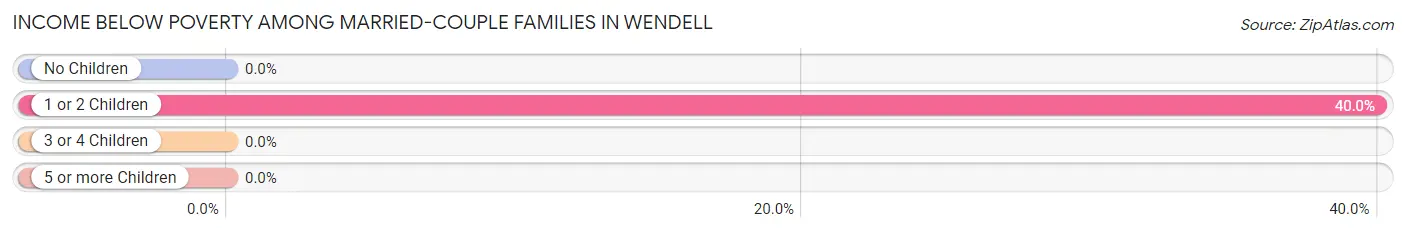
| Children | Above Poverty | Below Poverty |
| No Children | 24 (100.0%) | 0 (0.0%) |
| 1 or 2 Children | 6 (60.0%) | 4 (40.0%) |
| 3 or 4 Children | 3 (100.0%) | 0 (0.0%) |
| 5 or more Children | 0 (0.0%) | 0 (0.0%) |
| Total | 33 (89.2%) | 4 (10.8%) |
Income Below Poverty Among Single-Parent Households in Wendell
According to the poverty data in Wendell, 33.3% or 1 single-father households and 56.2% or 9 single-mother households are living below the poverty line. Among single-father households, those with 1 or 2 children have the highest poverty rate, with 1 households (100.0%) experiencing poverty. Likewise, among single-mother households, those with 1 or 2 children have the highest poverty rate, with 9 households (56.2%) falling below the poverty line.
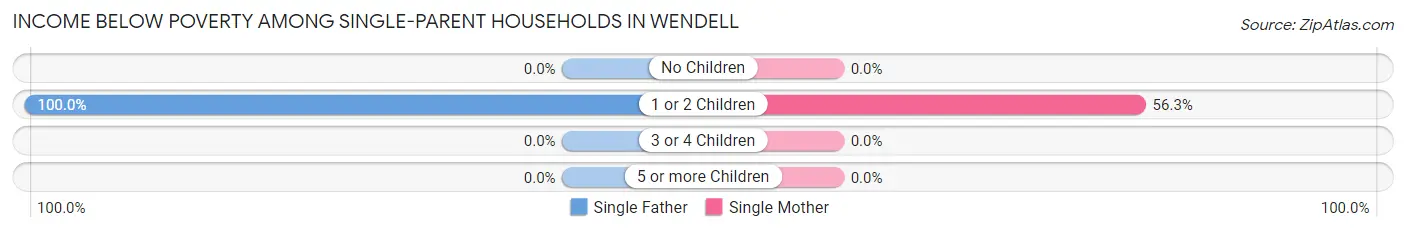
| Children | Single Father | Single Mother |
| No Children | 0 (0.0%) | 0 (0.0%) |
| 1 or 2 Children | 1 (100.0%) | 9 (56.2%) |
| 3 or 4 Children | 0 (0.0%) | 0 (0.0%) |
| 5 or more Children | 0 (0.0%) | 0 (0.0%) |
| Total | 1 (33.3%) | 9 (56.2%) |
Income Below Poverty Among Married-Couple vs Single-Parent Households in Wendell
The poverty data for Wendell shows that 4 of the married-couple family households (10.8%) and 10 of the single-parent households (52.6%) are living below the poverty level. Within the married-couple family households, those with 1 or 2 children have the highest poverty rate, with 4 households (40.0%) falling below the poverty line. Among the single-parent households, those with 1 or 2 children have the highest poverty rate, with 10 household (58.8%) living below poverty.
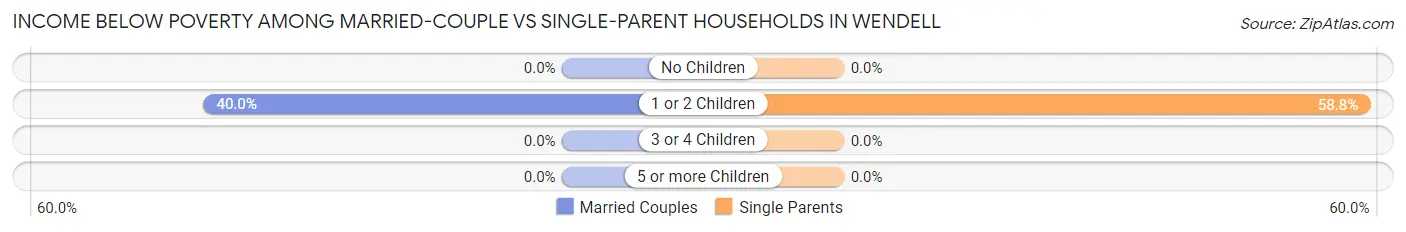
| Children | Married-Couple Families | Single-Parent Households |
| No Children | 0 (0.0%) | 0 (0.0%) |
| 1 or 2 Children | 4 (40.0%) | 10 (58.8%) |
| 3 or 4 Children | 0 (0.0%) | 0 (0.0%) |
| 5 or more Children | 0 (0.0%) | 0 (0.0%) |
| Total | 4 (10.8%) | 10 (52.6%) |
Race in Wendell
The most populous races in Wendell are White / Caucasian (167 | 90.3%), Hispanic or Latino (33 | 17.8%), and Some other Race (16 | 8.6%).
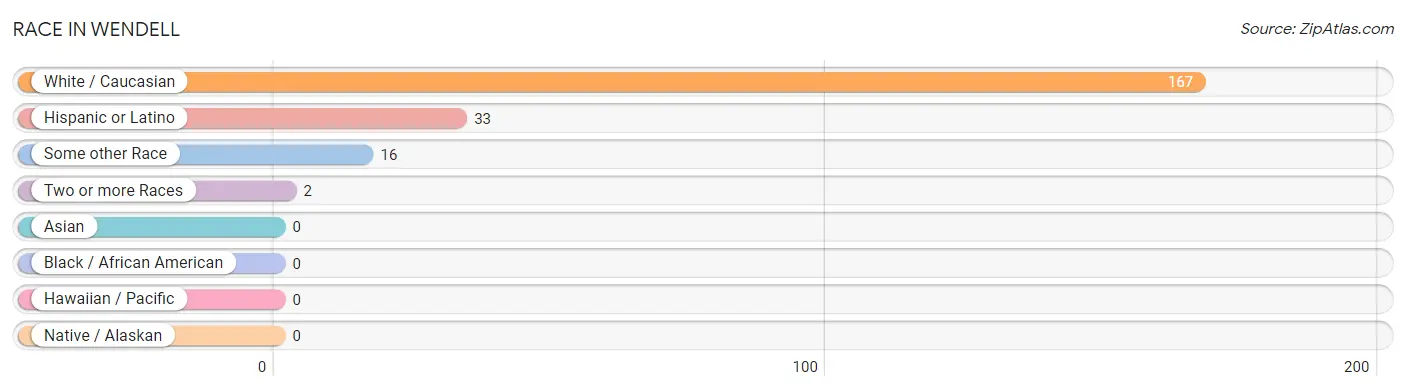
| Race | # Population | % Population |
| Asian | 0 | 0.0% |
| Black / African American | 0 | 0.0% |
| Hawaiian / Pacific | 0 | 0.0% |
| Hispanic or Latino | 33 | 17.8% |
| Native / Alaskan | 0 | 0.0% |
| White / Caucasian | 167 | 90.3% |
| Two or more Races | 2 | 1.1% |
| Some other Race | 16 | 8.6% |
| Total | 185 | 100.0% |
Ancestry in Wendell
The most populous ancestries reported in Wendell are German (85 | 46.0%), Norwegian (84 | 45.4%), Irish (23 | 12.4%), Mexican (21 | 11.4%), and Finnish (17 | 9.2%), together accounting for 124.3% of all Wendell residents.
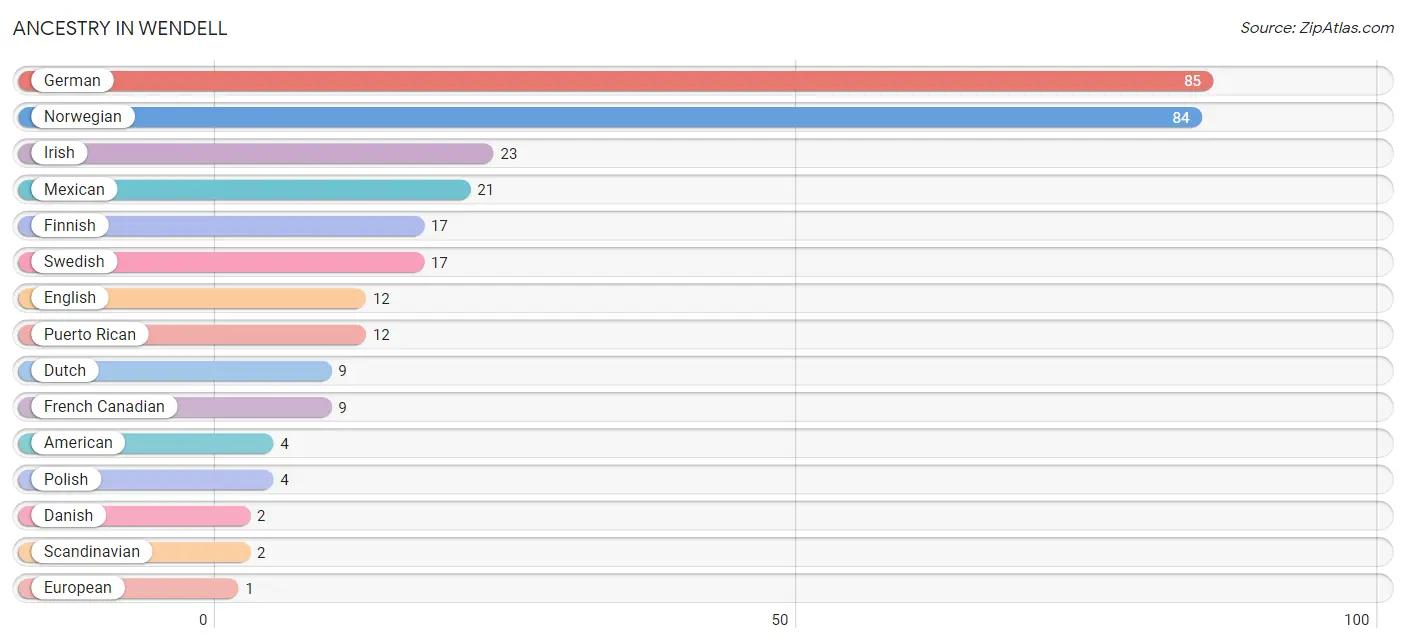
| Ancestry | # Population | % Population |
| American | 4 | 2.2% |
| Danish | 2 | 1.1% |
| Dutch | 9 | 4.9% |
| English | 12 | 6.5% |
| European | 1 | 0.5% |
| Finnish | 17 | 9.2% |
| French Canadian | 9 | 4.9% |
| German | 85 | 46.0% |
| Irish | 23 | 12.4% |
| Mexican | 21 | 11.4% |
| Norwegian | 84 | 45.4% |
| Polish | 4 | 2.2% |
| Puerto Rican | 12 | 6.5% |
| Scandinavian | 2 | 1.1% |
| Swedish | 17 | 9.2% | View All 15 Rows |
Immigrants in Wendell

| Immigration Origin | # Population | % Population | View All 0 Rows |
Sex and Age in Wendell
Sex and Age in Wendell
The most populous age groups in Wendell are 30 to 34 Years (17 | 17.0%) for men and Under 5 Years (13 | 15.3%) for women.
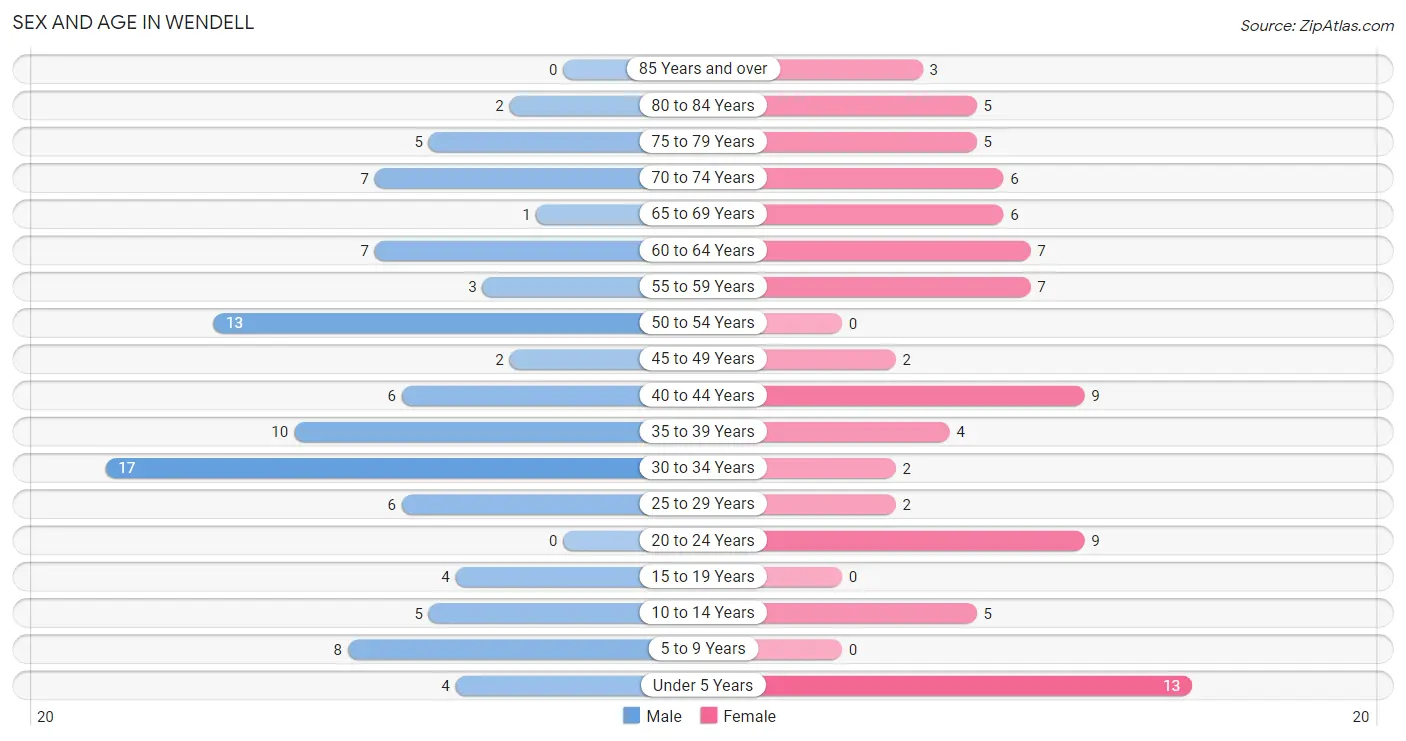
| Age Bracket | Male | Female |
| Under 5 Years | 4 (4.0%) | 13 (15.3%) |
| 5 to 9 Years | 8 (8.0%) | 0 (0.0%) |
| 10 to 14 Years | 5 (5.0%) | 5 (5.9%) |
| 15 to 19 Years | 4 (4.0%) | 0 (0.0%) |
| 20 to 24 Years | 0 (0.0%) | 9 (10.6%) |
| 25 to 29 Years | 6 (6.0%) | 2 (2.4%) |
| 30 to 34 Years | 17 (17.0%) | 2 (2.4%) |
| 35 to 39 Years | 10 (10.0%) | 4 (4.7%) |
| 40 to 44 Years | 6 (6.0%) | 9 (10.6%) |
| 45 to 49 Years | 2 (2.0%) | 2 (2.4%) |
| 50 to 54 Years | 13 (13.0%) | 0 (0.0%) |
| 55 to 59 Years | 3 (3.0%) | 7 (8.2%) |
| 60 to 64 Years | 7 (7.0%) | 7 (8.2%) |
| 65 to 69 Years | 1 (1.0%) | 6 (7.1%) |
| 70 to 74 Years | 7 (7.0%) | 6 (7.1%) |
| 75 to 79 Years | 5 (5.0%) | 5 (5.9%) |
| 80 to 84 Years | 2 (2.0%) | 5 (5.9%) |
| 85 Years and over | 0 (0.0%) | 3 (3.5%) |
| Total | 100 (100.0%) | 85 (100.0%) |
Families and Households in Wendell
Median Family Size in Wendell
The median family size in Wendell is 2.43 persons per family, with single male/father families (3 | 5.4%) accounting for the largest median family size of 3 persons per family. On the other hand, single female/mother families (16 | 28.6%) represent the smallest median family size with 2.25 persons per family.
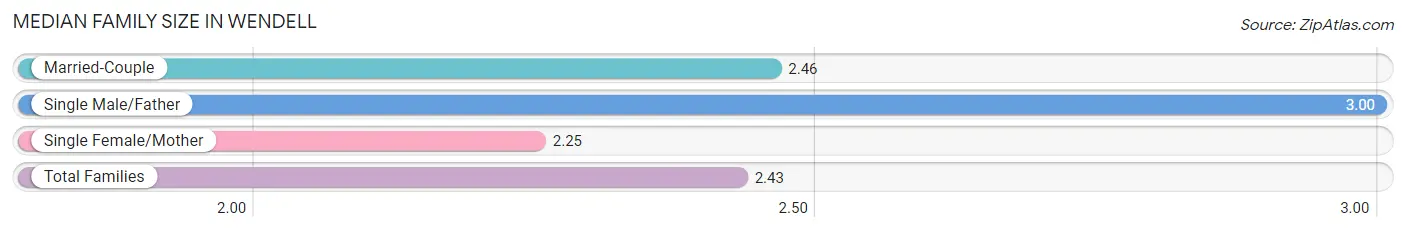
| Family Type | # Families | Family Size |
| Married-Couple | 37 (66.1%) | 2.46 |
| Single Male/Father | 3 (5.4%) | 3.00 |
| Single Female/Mother | 16 (28.6%) | 2.25 |
| Total Families | 56 (100.0%) | 2.43 |
Median Household Size in Wendell
The median household size in Wendell is 2.20 persons per household, with single female/mother households (16 | 19.1%) accounting for the largest median household size of 3.44 persons per household. non-family households (28 | 33.3%) represent the smallest median household size with 1.07 persons per household.
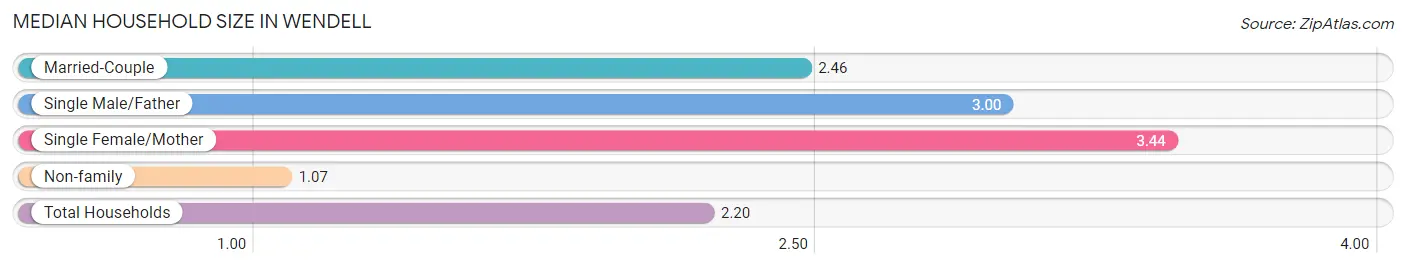
| Household Type | # Households | Household Size |
| Married-Couple | 37 (44.1%) | 2.46 |
| Single Male/Father | 3 (3.6%) | 3.00 |
| Single Female/Mother | 16 (19.1%) | 3.44 |
| Non-family | 28 (33.3%) | 1.07 |
| Total Households | 84 (100.0%) | 2.20 |
Household Size by Marriage Status in Wendell
Out of a total of 84 households in Wendell, 56 (66.7%) are family households, while 28 (33.3%) are nonfamily households. The most numerous type of family households are 2-person households, comprising 27, and the most common type of nonfamily households are 1-person households, comprising 25.
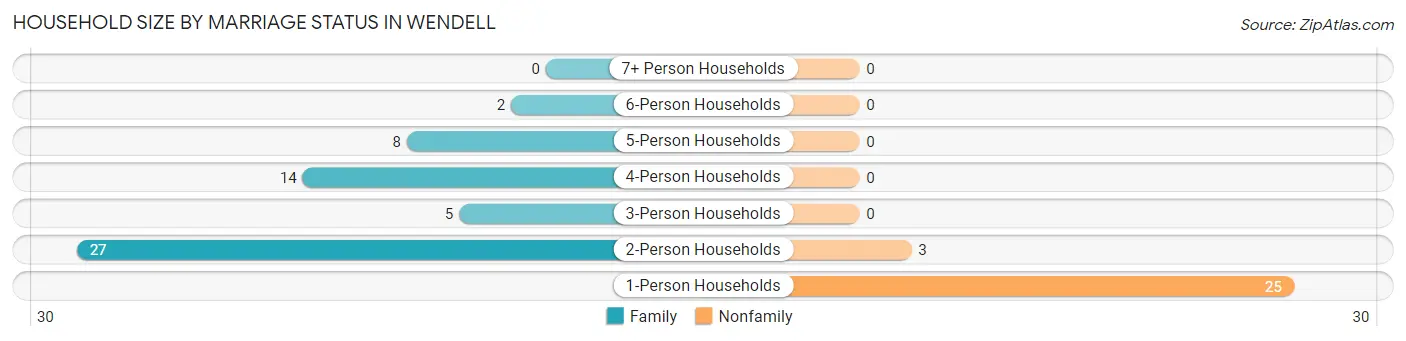
| Household Size | Family Households | Nonfamily Households |
| 1-Person Households | - | 25 (29.8%) |
| 2-Person Households | 27 (32.1%) | 3 (3.6%) |
| 3-Person Households | 5 (5.9%) | 0 (0.0%) |
| 4-Person Households | 14 (16.7%) | 0 (0.0%) |
| 5-Person Households | 8 (9.5%) | 0 (0.0%) |
| 6-Person Households | 2 (2.4%) | 0 (0.0%) |
| 7+ Person Households | 0 (0.0%) | 0 (0.0%) |
| Total | 56 (66.7%) | 28 (33.3%) |
Female Fertility in Wendell
Fertility by Age in Wendell
| Age Bracket | Women with Births | Births / 1,000 Women |
| 15 to 19 years | 0 (0.0%) | 0.0 |
| 20 to 34 years | 0 (0.0%) | 0.0 |
| 35 to 50 years | 0 (0.0%) | 0.0 |
| Total | 0 (0.0%) | 0.0 |
Fertility by Age by Marriage Status in Wendell
| Age Bracket | Married | Unmarried |
| 15 to 19 years | 0 (0.0%) | 0 (0.0%) |
| 20 to 34 years | 0 (0.0%) | 0 (0.0%) |
| 35 to 50 years | 0 (0.0%) | 0 (0.0%) |
| Total | 0 (0.0%) | 0 (0.0%) |
Fertility by Education in Wendell
| Educational Attainment | Women with Births | Births / 1,000 Women |
| Less than High School | 0 (0.0%) | 0.0 |
| High School Diploma | 0 (0.0%) | 0.0 |
| College or Associate's Degree | 0 (0.0%) | 0.0 |
| Bachelor's Degree | 0 (0.0%) | 0.0 |
| Graduate Degree | 0 (0.0%) | 0.0 |
| Total | 0 (0.0%) | 0.0 |
Fertility by Education by Marriage Status in Wendell
| Educational Attainment | Married | Unmarried |
| Less than High School | 0 (0.0%) | 0 (0.0%) |
| High School Diploma | 0 (0.0%) | 0 (0.0%) |
| College or Associate's Degree | 0 (0.0%) | 0 (0.0%) |
| Bachelor's Degree | 0 (0.0%) | 0 (0.0%) |
| Graduate Degree | 0 (0.0%) | 0 (0.0%) |
| Total | 0 (0.0%) | 0 (0.0%) |
Employment Characteristics in Wendell
Employment by Class of Employer in Wendell
Among the 103 employed individuals in Wendell, private company employees (69 | 67.0%), not-for-profit organizations (13 | 12.6%), and self-employed (not incorporated) (12 | 11.7%) make up the most common classes of employment.
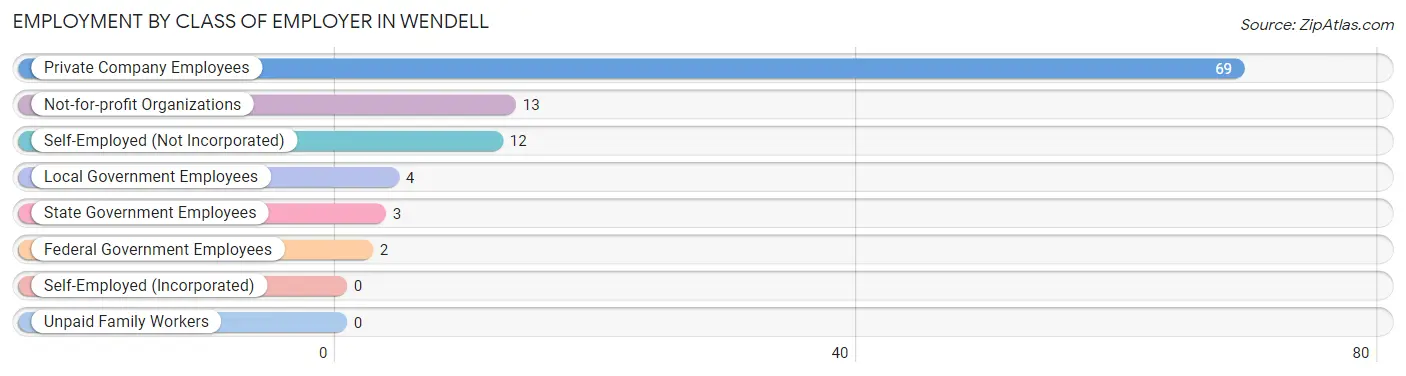
| Employer Class | # Employees | % Employees |
| Private Company Employees | 69 | 67.0% |
| Self-Employed (Incorporated) | 0 | 0.0% |
| Self-Employed (Not Incorporated) | 12 | 11.7% |
| Not-for-profit Organizations | 13 | 12.6% |
| Local Government Employees | 4 | 3.9% |
| State Government Employees | 3 | 2.9% |
| Federal Government Employees | 2 | 1.9% |
| Unpaid Family Workers | 0 | 0.0% |
| Total | 103 | 100.0% |
Employment Status by Age in Wendell
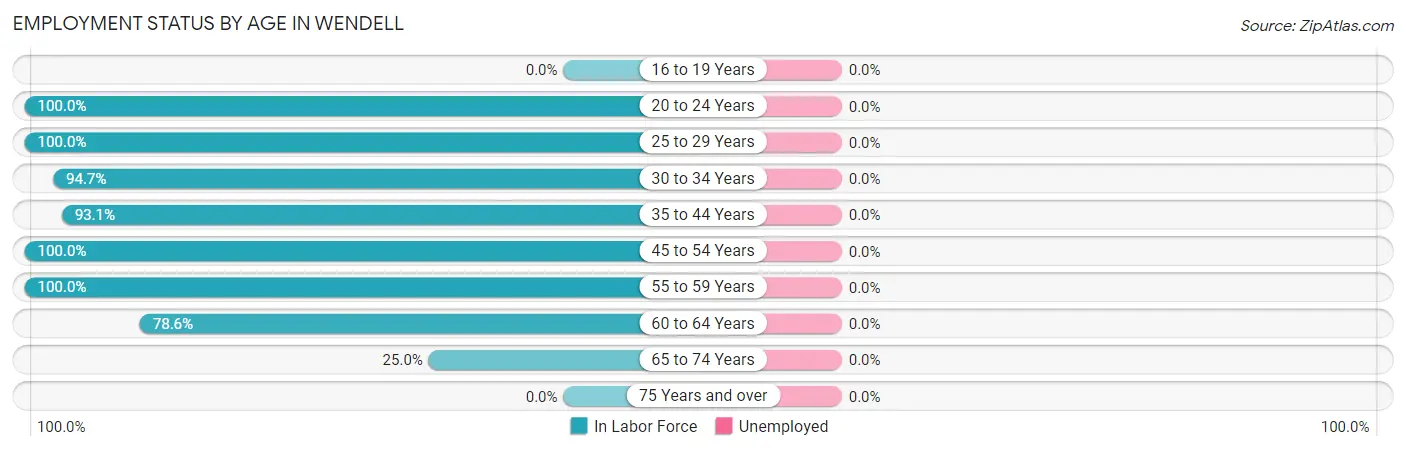
| Age Bracket | In Labor Force | Unemployed |
| 16 to 19 Years | 0 (0.0%) | 0 (0.0%) |
| 20 to 24 Years | 9 (100.0%) | 0 (0.0%) |
| 25 to 29 Years | 8 (100.0%) | 0 (0.0%) |
| 30 to 34 Years | 18 (94.7%) | 0 (0.0%) |
| 35 to 44 Years | 27 (93.1%) | 0 (0.0%) |
| 45 to 54 Years | 17 (100.0%) | 0 (0.0%) |
| 55 to 59 Years | 10 (100.0%) | 0 (0.0%) |
| 60 to 64 Years | 11 (78.6%) | 0 (0.0%) |
| 65 to 74 Years | 5 (25.0%) | 0 (0.0%) |
| 75 Years and over | 0 (0.0%) | 0 (0.0%) |
| Total | 105 (70.0%) | 0 (0.0%) |
Employment Status by Educational Attainment in Wendell
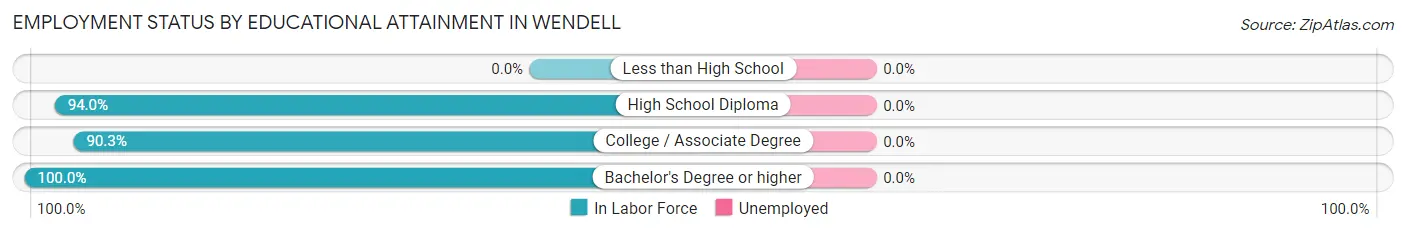
| Educational Attainment | In Labor Force | Unemployed |
| Less than High School | 0 (0.0%) | 0 (0.0%) |
| High School Diploma | 47 (94.0%) | 0 (0.0%) |
| College / Associate Degree | 28 (90.3%) | 0 (0.0%) |
| Bachelor's Degree or higher | 16 (100.0%) | 0 (0.0%) |
| Total | 91 (93.8%) | 0 (0.0%) |
Employment Occupations by Sex in Wendell
Management, Business, Science and Arts Occupations
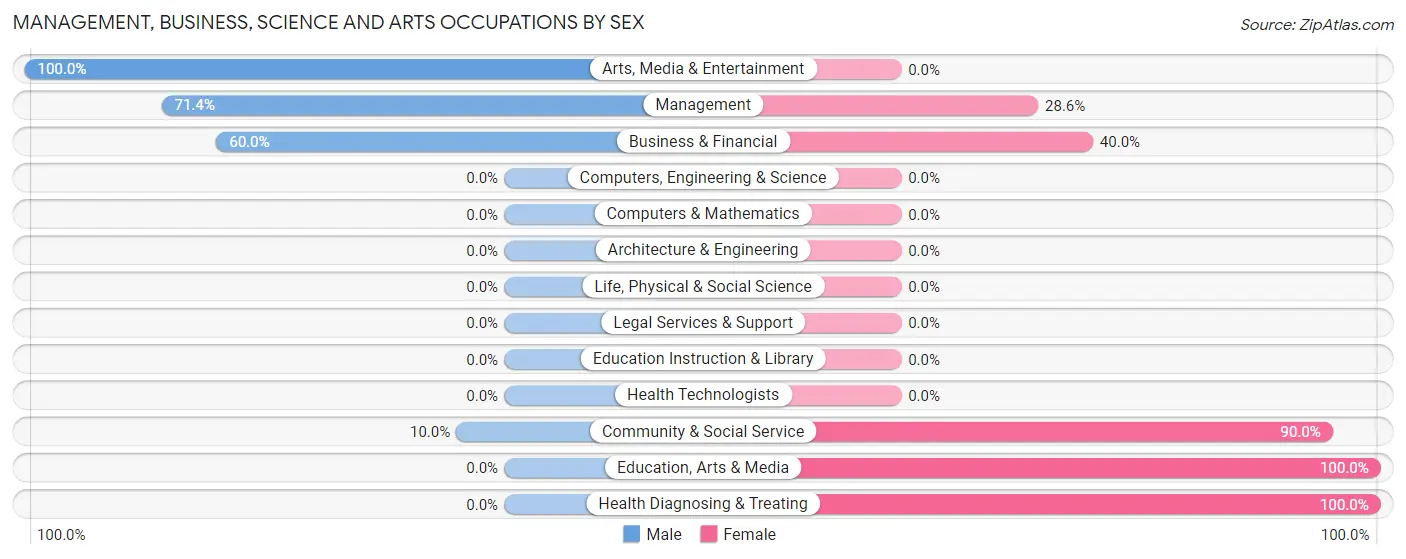
The most common Management, Business, Science and Arts occupations in Wendell are Community & Social Service (10 | 9.5%), Education, Arts & Media (9 | 8.6%), Management (7 | 6.7%), Business & Financial (5 | 4.8%), and Health Diagnosing & Treating (5 | 4.8%).
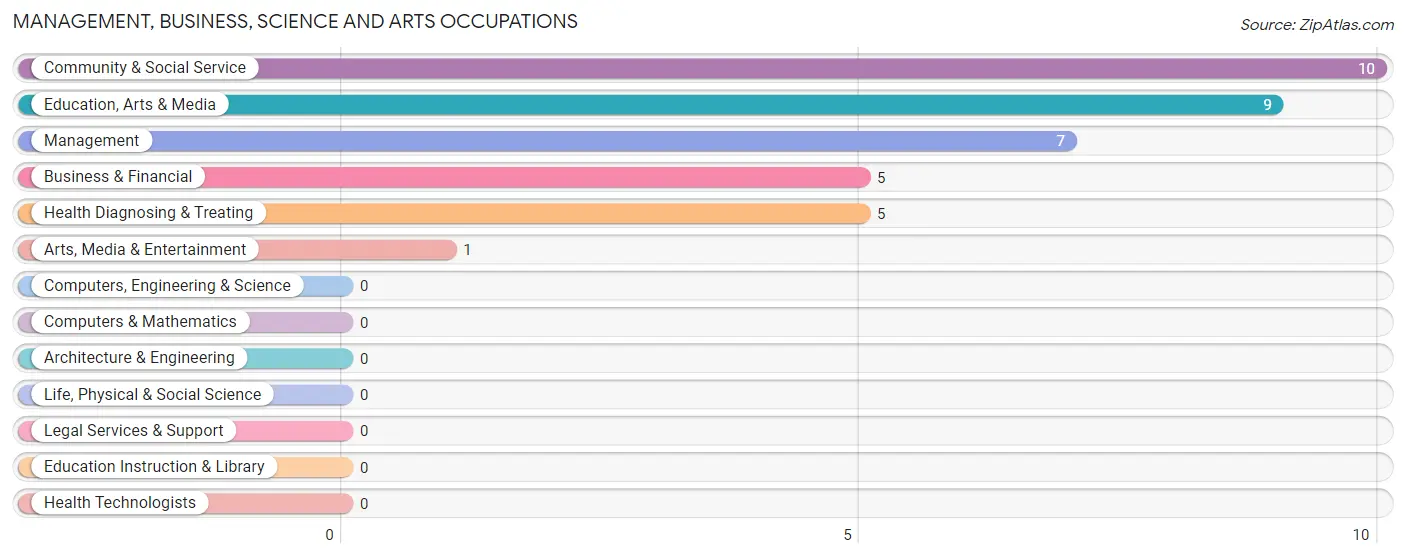
Management, Business, Science and Arts Occupations by Sex
Within the Management, Business, Science and Arts occupations in Wendell, the most male-oriented occupations are Arts, Media & Entertainment (100.0%), Management (71.4%), and Business & Financial (60.0%), while the most female-oriented occupations are Education, Arts & Media (100.0%), Health Diagnosing & Treating (100.0%), and Community & Social Service (90.0%).
| Occupation | Male | Female |
| Management | 5 (71.4%) | 2 (28.6%) |
| Business & Financial | 3 (60.0%) | 2 (40.0%) |
| Computers, Engineering & Science | 0 (0.0%) | 0 (0.0%) |
| Computers & Mathematics | 0 (0.0%) | 0 (0.0%) |
| Architecture & Engineering | 0 (0.0%) | 0 (0.0%) |
| Life, Physical & Social Science | 0 (0.0%) | 0 (0.0%) |
| Community & Social Service | 1 (10.0%) | 9 (90.0%) |
| Education, Arts & Media | 0 (0.0%) | 9 (100.0%) |
| Legal Services & Support | 0 (0.0%) | 0 (0.0%) |
| Education Instruction & Library | 0 (0.0%) | 0 (0.0%) |
| Arts, Media & Entertainment | 1 (100.0%) | 0 (0.0%) |
| Health Diagnosing & Treating | 0 (0.0%) | 5 (100.0%) |
| Health Technologists | 0 (0.0%) | 0 (0.0%) |
| Total (Category) | 9 (33.3%) | 18 (66.7%) |
| Total (Overall) | 67 (63.8%) | 38 (36.2%) |
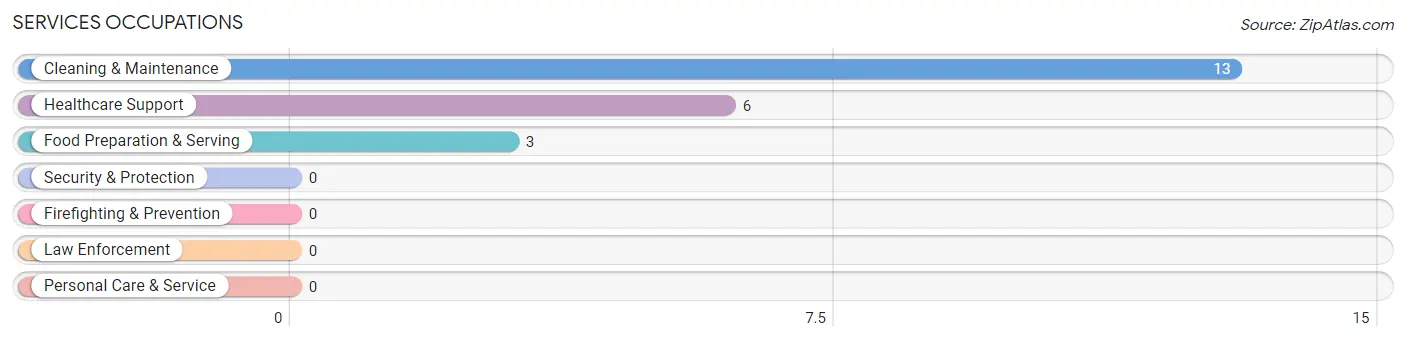
Services Occupations
The most common Services occupations in Wendell are Cleaning & Maintenance (13 | 12.4%), Healthcare Support (6 | 5.7%), and Food Preparation & Serving (3 | 2.9%).
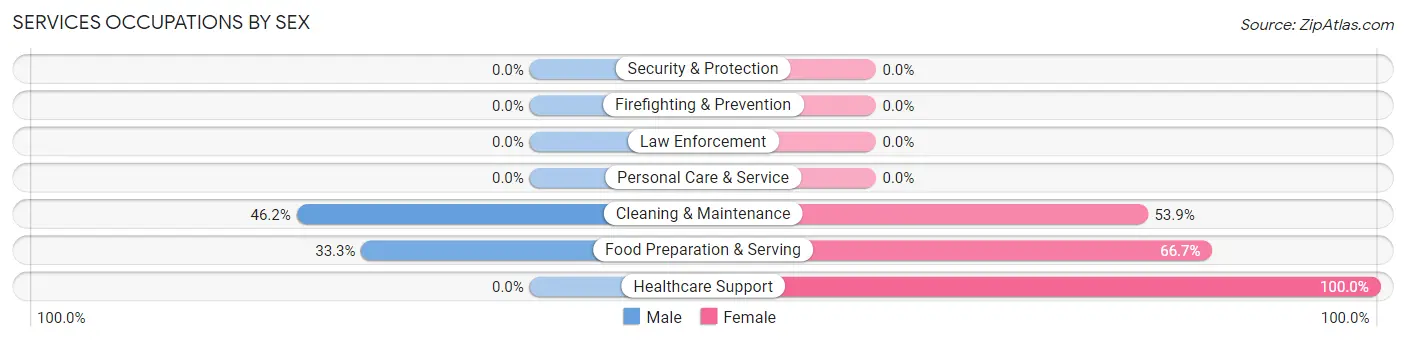
Services Occupations by Sex
Within the Services occupations in Wendell, the most male-oriented occupations are Cleaning & Maintenance (46.2%), and Food Preparation & Serving (33.3%), while the most female-oriented occupations are Healthcare Support (100.0%), Food Preparation & Serving (66.7%), and Cleaning & Maintenance (53.8%).
| Occupation | Male | Female |
| Healthcare Support | 0 (0.0%) | 6 (100.0%) |
| Security & Protection | 0 (0.0%) | 0 (0.0%) |
| Firefighting & Prevention | 0 (0.0%) | 0 (0.0%) |
| Law Enforcement | 0 (0.0%) | 0 (0.0%) |
| Food Preparation & Serving | 1 (33.3%) | 2 (66.7%) |
| Cleaning & Maintenance | 6 (46.2%) | 7 (53.8%) |
| Personal Care & Service | 0 (0.0%) | 0 (0.0%) |
| Total (Category) | 7 (31.8%) | 15 (68.2%) |
| Total (Overall) | 67 (63.8%) | 38 (36.2%) |
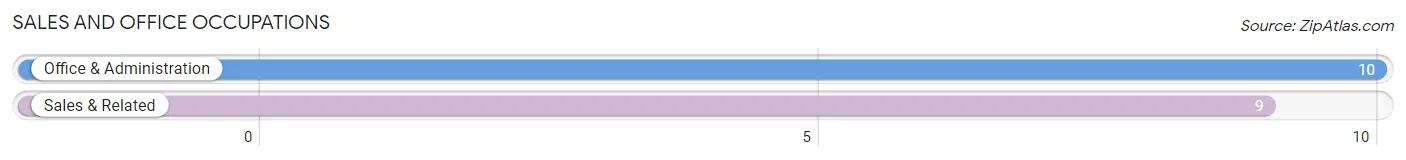
Sales and Office Occupations
The most common Sales and Office occupations in Wendell are Office & Administration (10 | 9.5%), and Sales & Related (9 | 8.6%).
Sales and Office Occupations by Sex
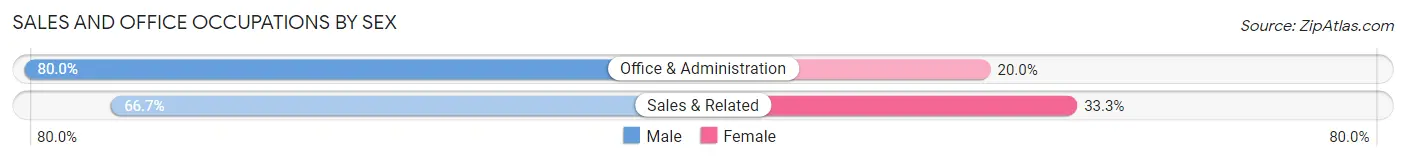
| Occupation | Male | Female |
| Sales & Related | 6 (66.7%) | 3 (33.3%) |
| Office & Administration | 8 (80.0%) | 2 (20.0%) |
| Total (Category) | 14 (73.7%) | 5 (26.3%) |
| Total (Overall) | 67 (63.8%) | 38 (36.2%) |
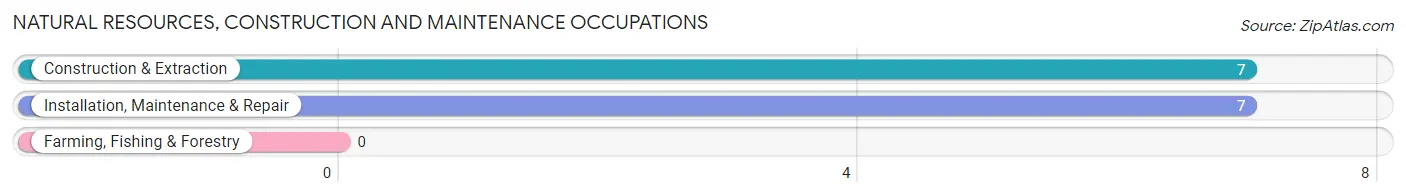
Natural Resources, Construction and Maintenance Occupations
The most common Natural Resources, Construction and Maintenance occupations in Wendell are Construction & Extraction (7 | 6.7%), and Installation, Maintenance & Repair (7 | 6.7%).
Natural Resources, Construction and Maintenance Occupations by Sex
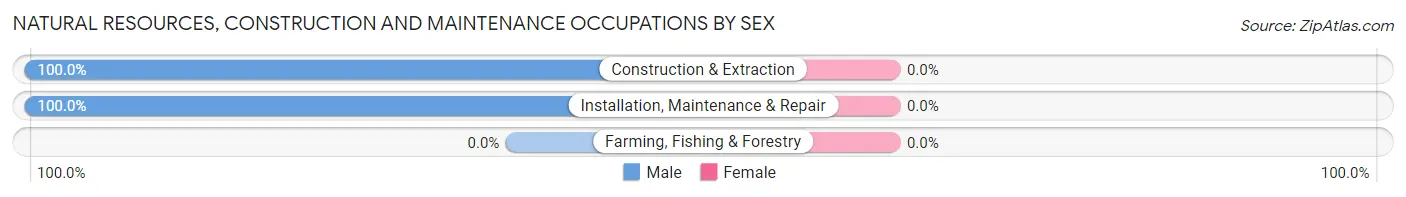
| Occupation | Male | Female |
| Farming, Fishing & Forestry | 0 (0.0%) | 0 (0.0%) |
| Construction & Extraction | 7 (100.0%) | 0 (0.0%) |
| Installation, Maintenance & Repair | 7 (100.0%) | 0 (0.0%) |
| Total (Category) | 14 (100.0%) | 0 (0.0%) |
| Total (Overall) | 67 (63.8%) | 38 (36.2%) |
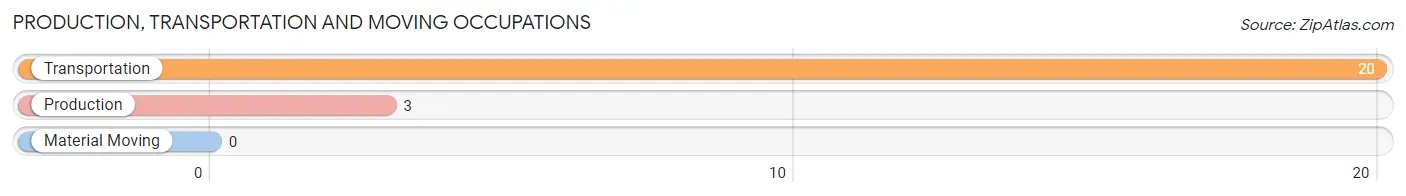
Production, Transportation and Moving Occupations
The most common Production, Transportation and Moving occupations in Wendell are Transportation (20 | 19.1%), and Production (3 | 2.9%).
Production, Transportation and Moving Occupations by Sex
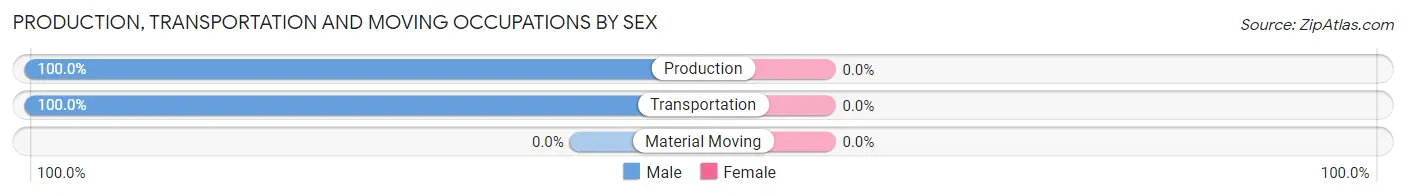
| Occupation | Male | Female |
| Production | 3 (100.0%) | 0 (0.0%) |
| Transportation | 20 (100.0%) | 0 (0.0%) |
| Material Moving | 0 (0.0%) | 0 (0.0%) |
| Total (Category) | 23 (100.0%) | 0 (0.0%) |
| Total (Overall) | 67 (63.8%) | 38 (36.2%) |
Employment Industries by Sex in Wendell
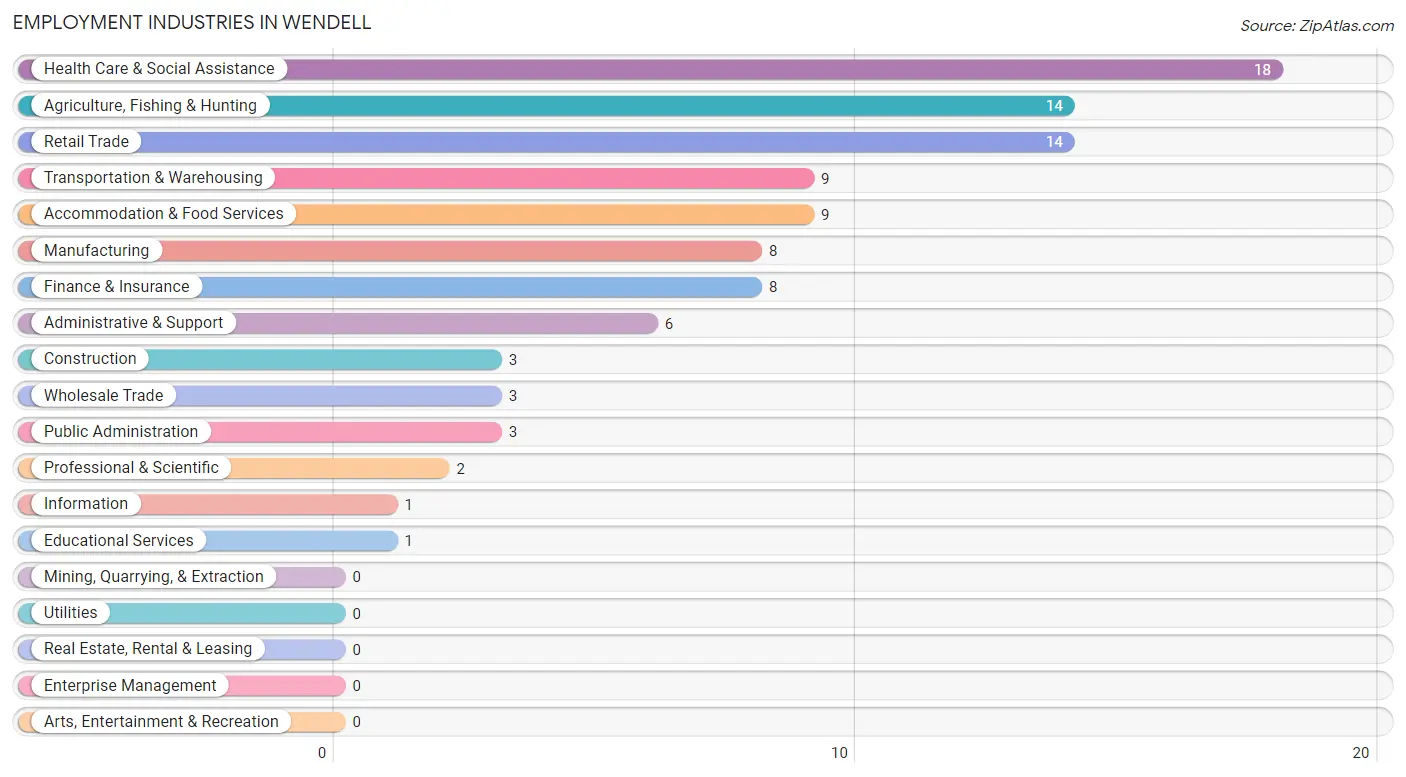
Employment Industries in Wendell
The major employment industries in Wendell include Health Care & Social Assistance (18 | 17.1%), Agriculture, Fishing & Hunting (14 | 13.3%), Retail Trade (14 | 13.3%), Transportation & Warehousing (9 | 8.6%), and Accommodation & Food Services (9 | 8.6%).
Employment Industries by Sex in Wendell
The Wendell industries that see more men than women are Agriculture, Fishing & Hunting (100.0%), Construction (100.0%), and Manufacturing (100.0%), whereas the industries that tend to have a higher number of women are Professional & Scientific (100.0%), Educational Services (100.0%), and Health Care & Social Assistance (100.0%).
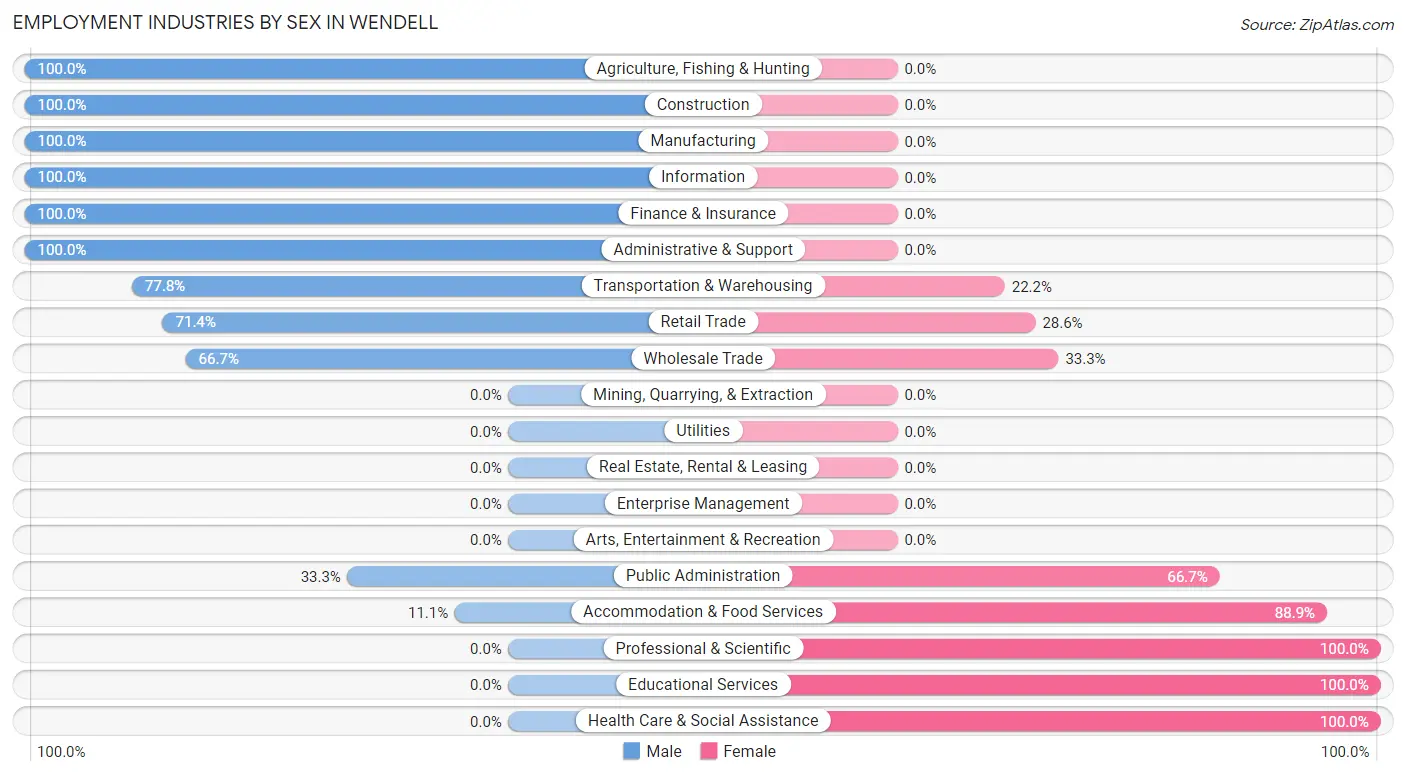
| Industry | Male | Female |
| Agriculture, Fishing & Hunting | 14 (100.0%) | 0 (0.0%) |
| Mining, Quarrying, & Extraction | 0 (0.0%) | 0 (0.0%) |
| Construction | 3 (100.0%) | 0 (0.0%) |
| Manufacturing | 8 (100.0%) | 0 (0.0%) |
| Wholesale Trade | 2 (66.7%) | 1 (33.3%) |
| Retail Trade | 10 (71.4%) | 4 (28.6%) |
| Transportation & Warehousing | 7 (77.8%) | 2 (22.2%) |
| Utilities | 0 (0.0%) | 0 (0.0%) |
| Information | 1 (100.0%) | 0 (0.0%) |
| Finance & Insurance | 8 (100.0%) | 0 (0.0%) |
| Real Estate, Rental & Leasing | 0 (0.0%) | 0 (0.0%) |
| Professional & Scientific | 0 (0.0%) | 2 (100.0%) |
| Enterprise Management | 0 (0.0%) | 0 (0.0%) |
| Administrative & Support | 6 (100.0%) | 0 (0.0%) |
| Educational Services | 0 (0.0%) | 1 (100.0%) |
| Health Care & Social Assistance | 0 (0.0%) | 18 (100.0%) |
| Arts, Entertainment & Recreation | 0 (0.0%) | 0 (0.0%) |
| Accommodation & Food Services | 1 (11.1%) | 8 (88.9%) |
| Public Administration | 1 (33.3%) | 2 (66.7%) |
| Total | 67 (63.8%) | 38 (36.2%) |
Education in Wendell
School Enrollment in Wendell
The most common levels of schooling among the 37 students in Wendell are middle school (10 | 27.0%), college / undergraduate (9 | 24.3%), and graduate / professional (8 | 21.6%).
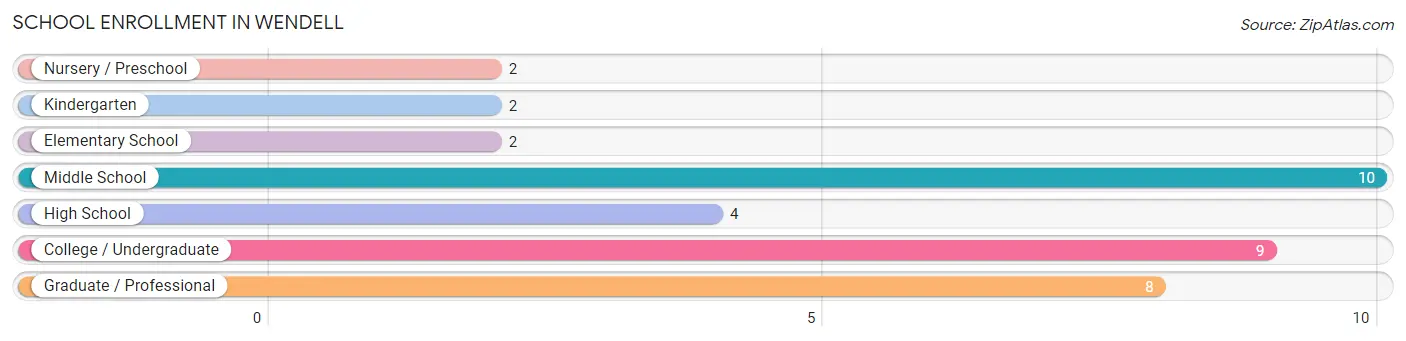
| School Level | # Students | % Students |
| Nursery / Preschool | 2 | 5.4% |
| Kindergarten | 2 | 5.4% |
| Elementary School | 2 | 5.4% |
| Middle School | 10 | 27.0% |
| High School | 4 | 10.8% |
| College / Undergraduate | 9 | 24.3% |
| Graduate / Professional | 8 | 21.6% |
| Total | 37 | 100.0% |
School Enrollment by Age by Funding Source in Wendell
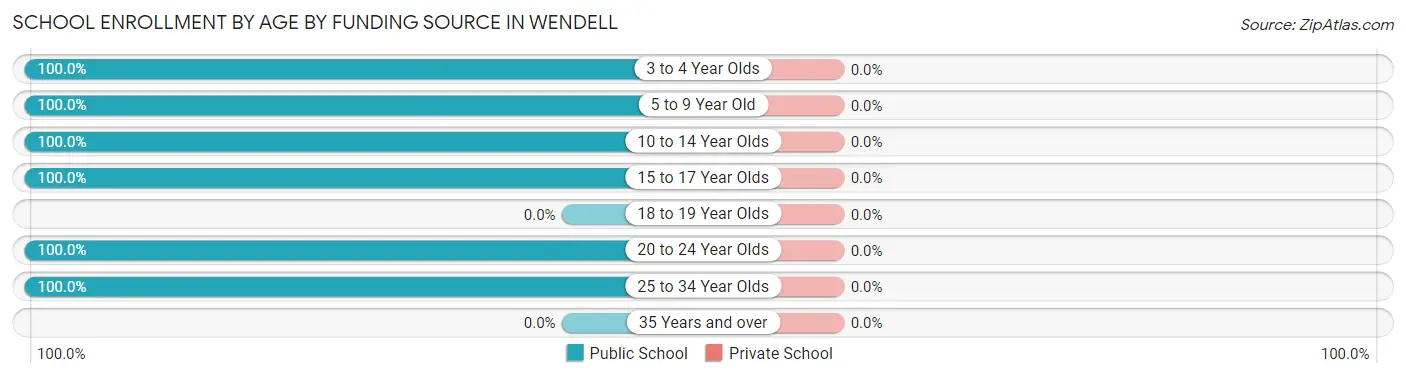
| Age Bracket | Public School | Private School |
| 3 to 4 Year Olds | 2 (100.0%) | 0 (0.0%) |
| 5 to 9 Year Old | 4 (100.0%) | 0 (0.0%) |
| 10 to 14 Year Olds | 10 (100.0%) | 0 (0.0%) |
| 15 to 17 Year Olds | 4 (100.0%) | 0 (0.0%) |
| 18 to 19 Year Olds | 0 (0.0%) | 0 (0.0%) |
| 20 to 24 Year Olds | 9 (100.0%) | 0 (0.0%) |
| 25 to 34 Year Olds | 8 (100.0%) | 0 (0.0%) |
| 35 Years and over | 0 (0.0%) | 0 (0.0%) |
| Total | 37 (100.0%) | 0 (0.0%) |
Educational Attainment by Field of Study in Wendell
Communications (9 | 50.0%), social sciences (2 | 11.1%), business (2 | 11.1%), visual & performing arts (2 | 11.1%), and bio, nature & agricultural (1 | 5.6%) are the most common fields of study among 18 individuals in Wendell who have obtained a bachelor's degree or higher.
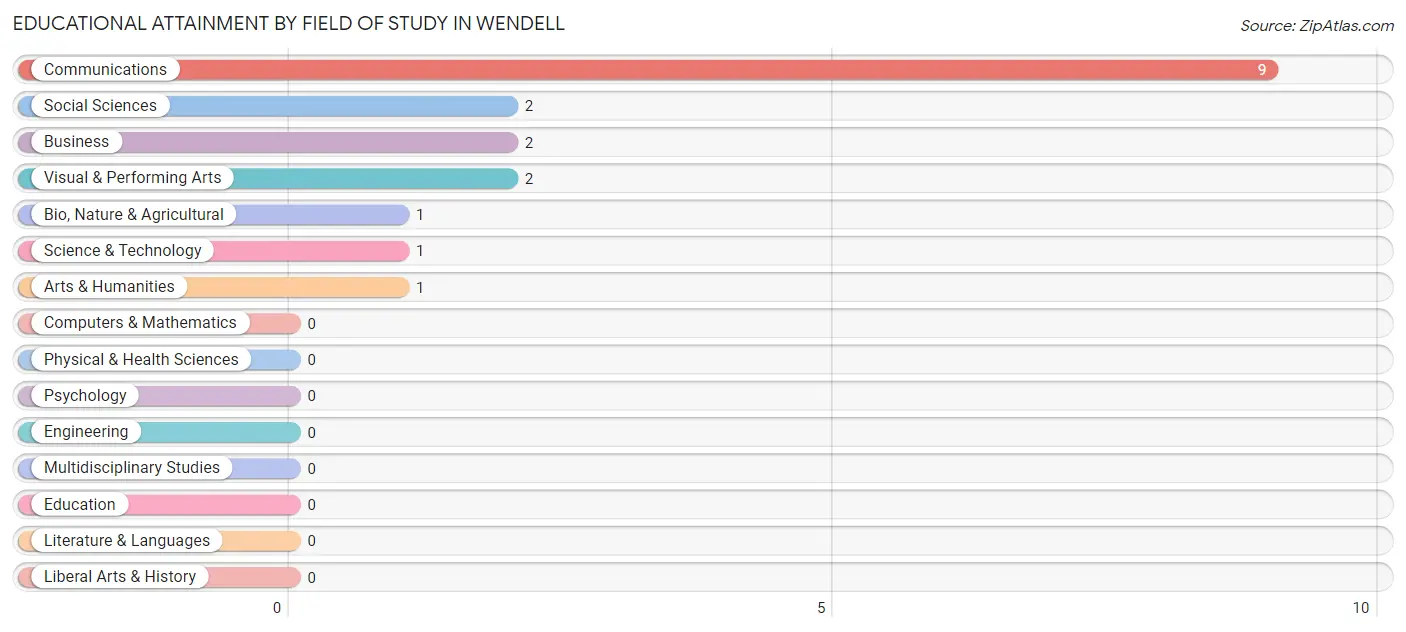
| Field of Study | # Graduates | % Graduates |
| Computers & Mathematics | 0 | 0.0% |
| Bio, Nature & Agricultural | 1 | 5.6% |
| Physical & Health Sciences | 0 | 0.0% |
| Psychology | 0 | 0.0% |
| Social Sciences | 2 | 11.1% |
| Engineering | 0 | 0.0% |
| Multidisciplinary Studies | 0 | 0.0% |
| Science & Technology | 1 | 5.6% |
| Business | 2 | 11.1% |
| Education | 0 | 0.0% |
| Literature & Languages | 0 | 0.0% |
| Liberal Arts & History | 0 | 0.0% |
| Visual & Performing Arts | 2 | 11.1% |
| Communications | 9 | 50.0% |
| Arts & Humanities | 1 | 5.6% |
| Total | 18 | 100.0% |
Transportation & Commute in Wendell
Vehicle Availability by Sex in Wendell
The most prevalent vehicle ownership categories in Wendell are males with 4 vehicles (21, accounting for 32.3%) and females with 4 vehicles (7, making up 55.3%).
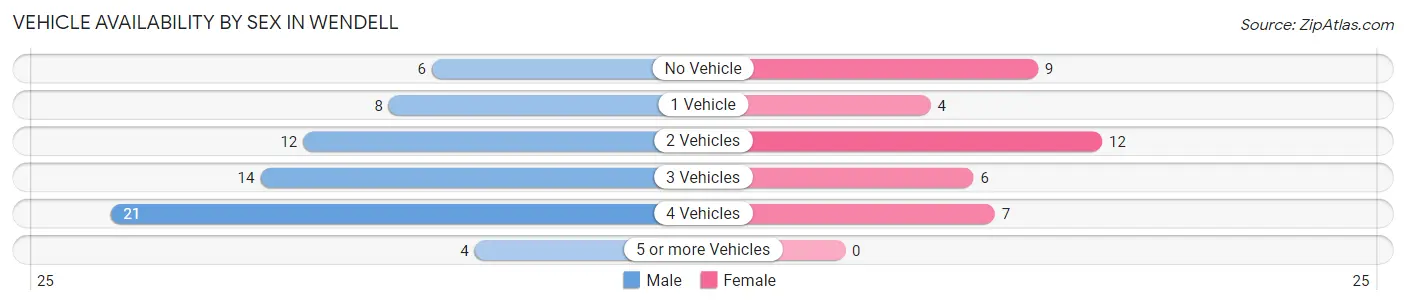
| Vehicles Available | Male | Female |
| No Vehicle | 6 (9.2%) | 9 (23.7%) |
| 1 Vehicle | 8 (12.3%) | 4 (10.5%) |
| 2 Vehicles | 12 (18.5%) | 12 (31.6%) |
| 3 Vehicles | 14 (21.5%) | 6 (15.8%) |
| 4 Vehicles | 21 (32.3%) | 7 (18.4%) |
| 5 or more Vehicles | 4 (6.1%) | 0 (0.0%) |
| Total | 65 (100.0%) | 38 (100.0%) |
Commute Time in Wendell
The most frequently occuring commute durations in Wendell are 20 to 24 minutes (24 commuters, 28.6%), 15 to 19 minutes (17 commuters, 20.2%), and 25 to 29 minutes (16 commuters, 19.1%).
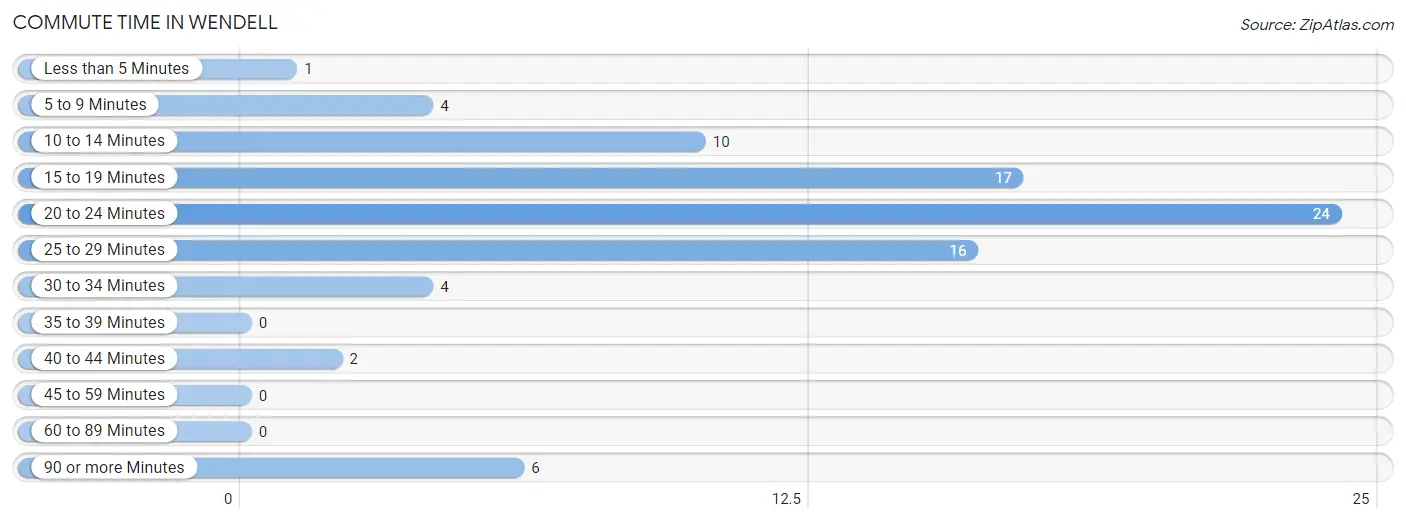
| Commute Time | # Commuters | % Commuters |
| Less than 5 Minutes | 1 | 1.2% |
| 5 to 9 Minutes | 4 | 4.8% |
| 10 to 14 Minutes | 10 | 11.9% |
| 15 to 19 Minutes | 17 | 20.2% |
| 20 to 24 Minutes | 24 | 28.6% |
| 25 to 29 Minutes | 16 | 19.1% |
| 30 to 34 Minutes | 4 | 4.8% |
| 35 to 39 Minutes | 0 | 0.0% |
| 40 to 44 Minutes | 2 | 2.4% |
| 45 to 59 Minutes | 0 | 0.0% |
| 60 to 89 Minutes | 0 | 0.0% |
| 90 or more Minutes | 6 | 7.1% |
Commute Time by Sex in Wendell
The most common commute times in Wendell are 15 to 19 minutes (11 commuters, 23.4%) for males and 20 to 24 minutes (13 commuters, 35.1%) for females.
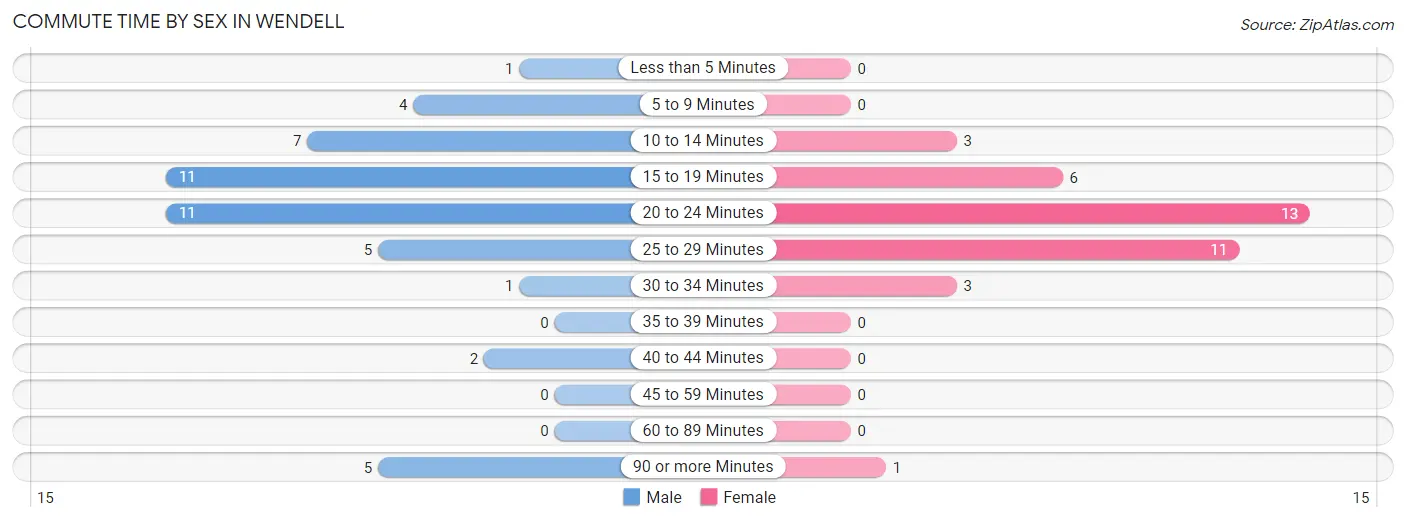
| Commute Time | Male | Female |
| Less than 5 Minutes | 1 (2.1%) | 0 (0.0%) |
| 5 to 9 Minutes | 4 (8.5%) | 0 (0.0%) |
| 10 to 14 Minutes | 7 (14.9%) | 3 (8.1%) |
| 15 to 19 Minutes | 11 (23.4%) | 6 (16.2%) |
| 20 to 24 Minutes | 11 (23.4%) | 13 (35.1%) |
| 25 to 29 Minutes | 5 (10.6%) | 11 (29.7%) |
| 30 to 34 Minutes | 1 (2.1%) | 3 (8.1%) |
| 35 to 39 Minutes | 0 (0.0%) | 0 (0.0%) |
| 40 to 44 Minutes | 2 (4.3%) | 0 (0.0%) |
| 45 to 59 Minutes | 0 (0.0%) | 0 (0.0%) |
| 60 to 89 Minutes | 0 (0.0%) | 0 (0.0%) |
| 90 or more Minutes | 5 (10.6%) | 1 (2.7%) |
Time of Departure to Work by Sex in Wendell
The most frequent times of departure to work in Wendell are 8:00 AM to 8:29 AM (13, 27.7%) for males and 7:30 AM to 7:59 AM (14, 37.8%) for females.
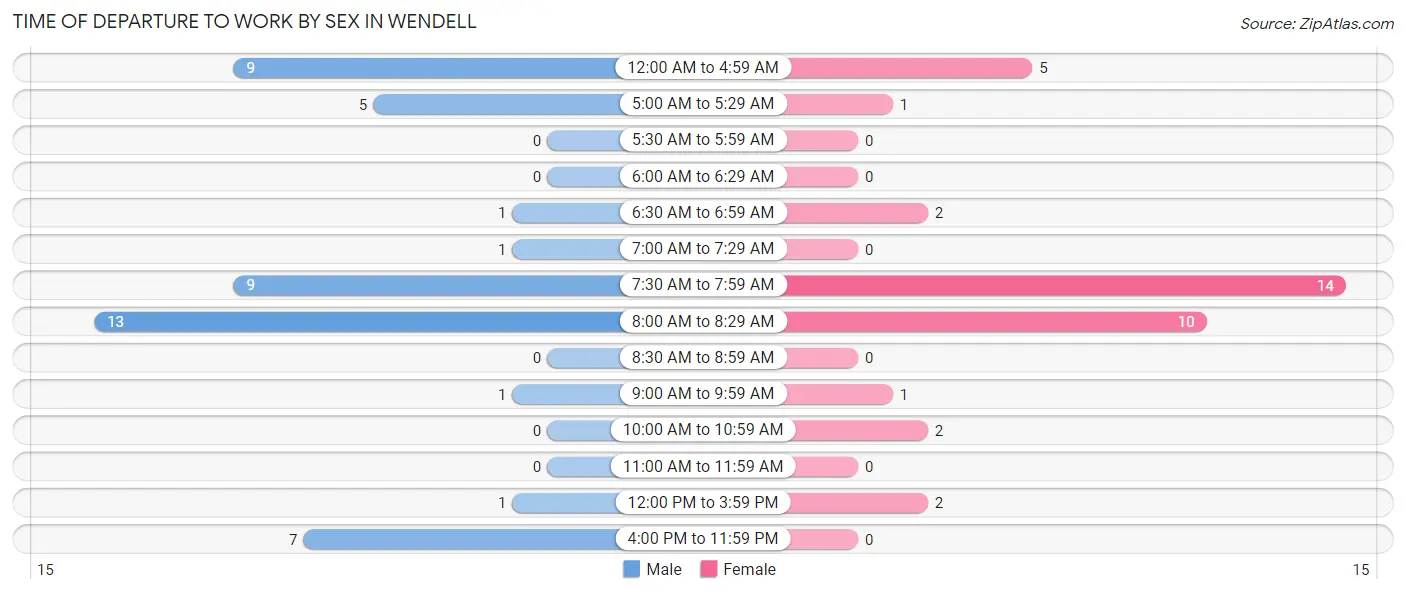
| Time of Departure | Male | Female |
| 12:00 AM to 4:59 AM | 9 (19.2%) | 5 (13.5%) |
| 5:00 AM to 5:29 AM | 5 (10.6%) | 1 (2.7%) |
| 5:30 AM to 5:59 AM | 0 (0.0%) | 0 (0.0%) |
| 6:00 AM to 6:29 AM | 0 (0.0%) | 0 (0.0%) |
| 6:30 AM to 6:59 AM | 1 (2.1%) | 2 (5.4%) |
| 7:00 AM to 7:29 AM | 1 (2.1%) | 0 (0.0%) |
| 7:30 AM to 7:59 AM | 9 (19.2%) | 14 (37.8%) |
| 8:00 AM to 8:29 AM | 13 (27.7%) | 10 (27.0%) |
| 8:30 AM to 8:59 AM | 0 (0.0%) | 0 (0.0%) |
| 9:00 AM to 9:59 AM | 1 (2.1%) | 1 (2.7%) |
| 10:00 AM to 10:59 AM | 0 (0.0%) | 2 (5.4%) |
| 11:00 AM to 11:59 AM | 0 (0.0%) | 0 (0.0%) |
| 12:00 PM to 3:59 PM | 1 (2.1%) | 2 (5.4%) |
| 4:00 PM to 11:59 PM | 7 (14.9%) | 0 (0.0%) |
| Total | 47 (100.0%) | 37 (100.0%) |
Housing Occupancy in Wendell
Occupancy by Ownership in Wendell
Of the total 84 dwellings in Wendell, owner-occupied units account for 70 (83.3%), while renter-occupied units make up 14 (16.7%).
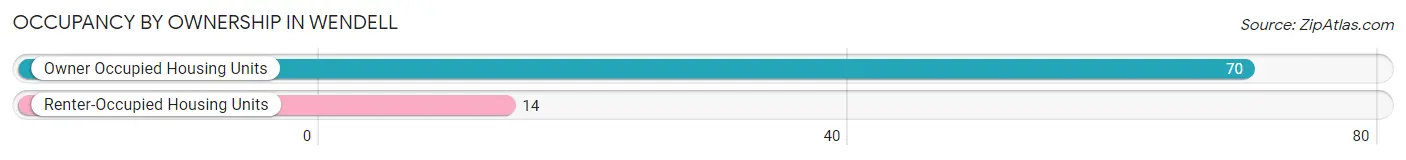
| Occupancy | # Housing Units | % Housing Units |
| Owner Occupied Housing Units | 70 | 83.3% |
| Renter-Occupied Housing Units | 14 | 16.7% |
| Total Occupied Housing Units | 84 | 100.0% |
Occupancy by Household Size in Wendell
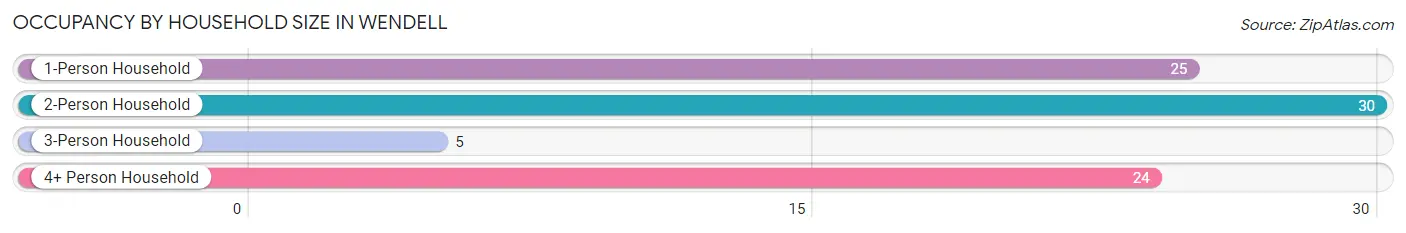
| Household Size | # Housing Units | % Housing Units |
| 1-Person Household | 25 | 29.8% |
| 2-Person Household | 30 | 35.7% |
| 3-Person Household | 5 | 5.9% |
| 4+ Person Household | 24 | 28.6% |
| Total Housing Units | 84 | 100.0% |
Occupancy by Ownership by Household Size in Wendell
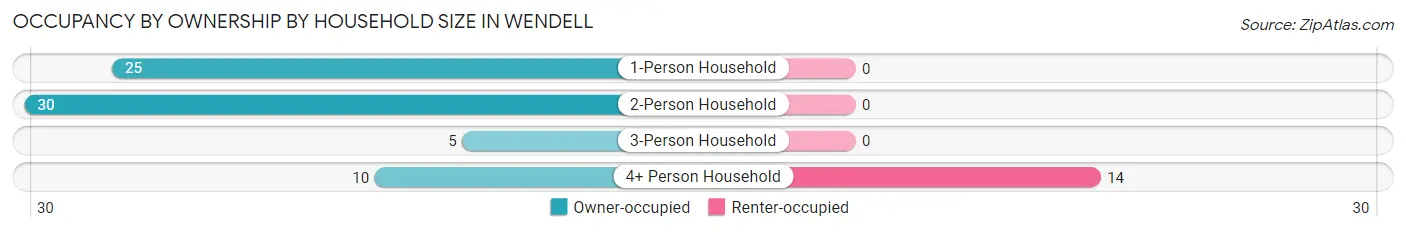
| Household Size | Owner-occupied | Renter-occupied |
| 1-Person Household | 25 (100.0%) | 0 (0.0%) |
| 2-Person Household | 30 (100.0%) | 0 (0.0%) |
| 3-Person Household | 5 (100.0%) | 0 (0.0%) |
| 4+ Person Household | 10 (41.7%) | 14 (58.3%) |
| Total Housing Units | 70 (83.3%) | 14 (16.7%) |
Occupancy by Educational Attainment in Wendell
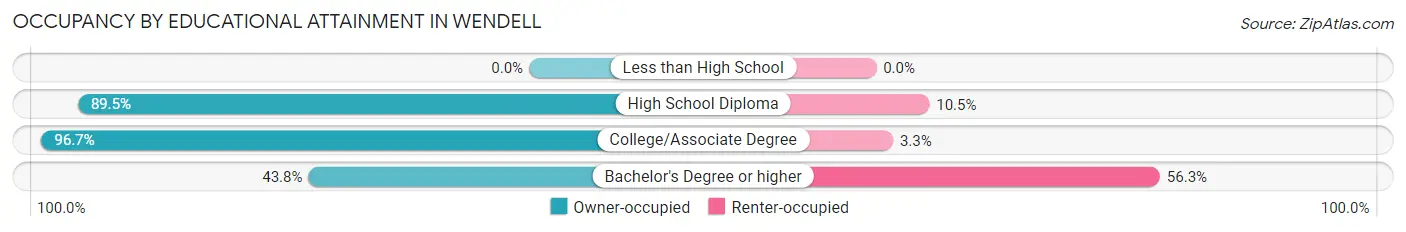
| Household Size | Owner-occupied | Renter-occupied |
| Less than High School | 0 (0.0%) | 0 (0.0%) |
| High School Diploma | 34 (89.5%) | 4 (10.5%) |
| College/Associate Degree | 29 (96.7%) | 1 (3.3%) |
| Bachelor's Degree or higher | 7 (43.8%) | 9 (56.2%) |
Occupancy by Age of Householder in Wendell
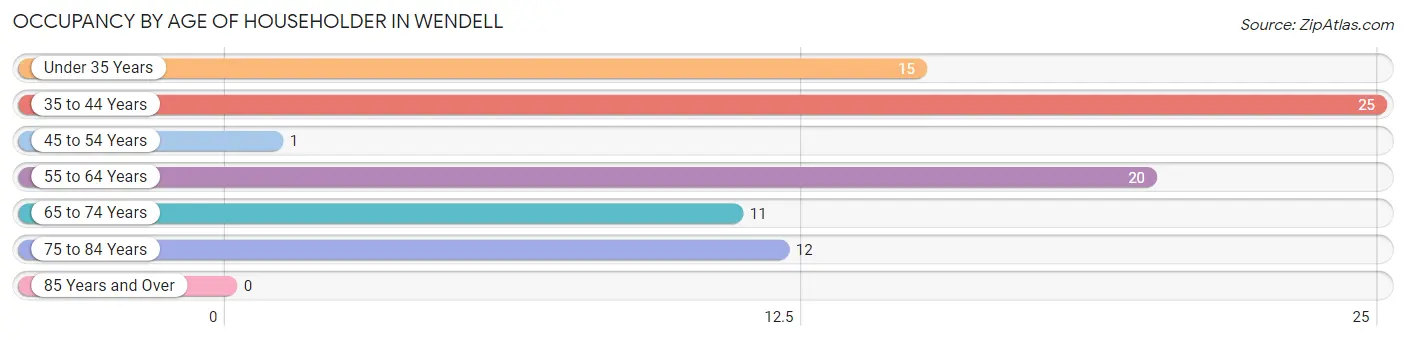
| Age Bracket | # Households | % Households |
| Under 35 Years | 15 | 17.9% |
| 35 to 44 Years | 25 | 29.8% |
| 45 to 54 Years | 1 | 1.2% |
| 55 to 64 Years | 20 | 23.8% |
| 65 to 74 Years | 11 | 13.1% |
| 75 to 84 Years | 12 | 14.3% |
| 85 Years and Over | 0 | 0.0% |
| Total | 84 | 100.0% |
Housing Finances in Wendell
Median Income by Occupancy in Wendell
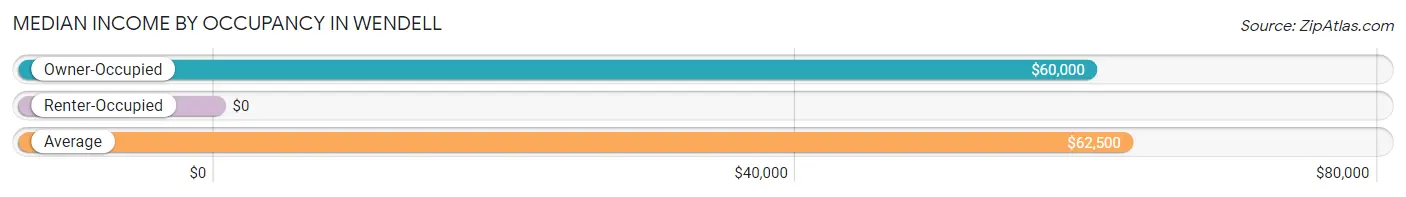
| Occupancy Type | # Households | Median Income |
| Owner-Occupied | 70 (83.3%) | $60,000 |
| Renter-Occupied | 14 (16.7%) | $0 |
| Average | 84 (100.0%) | $62,500 |
Occupancy by Householder Income Bracket in Wendell
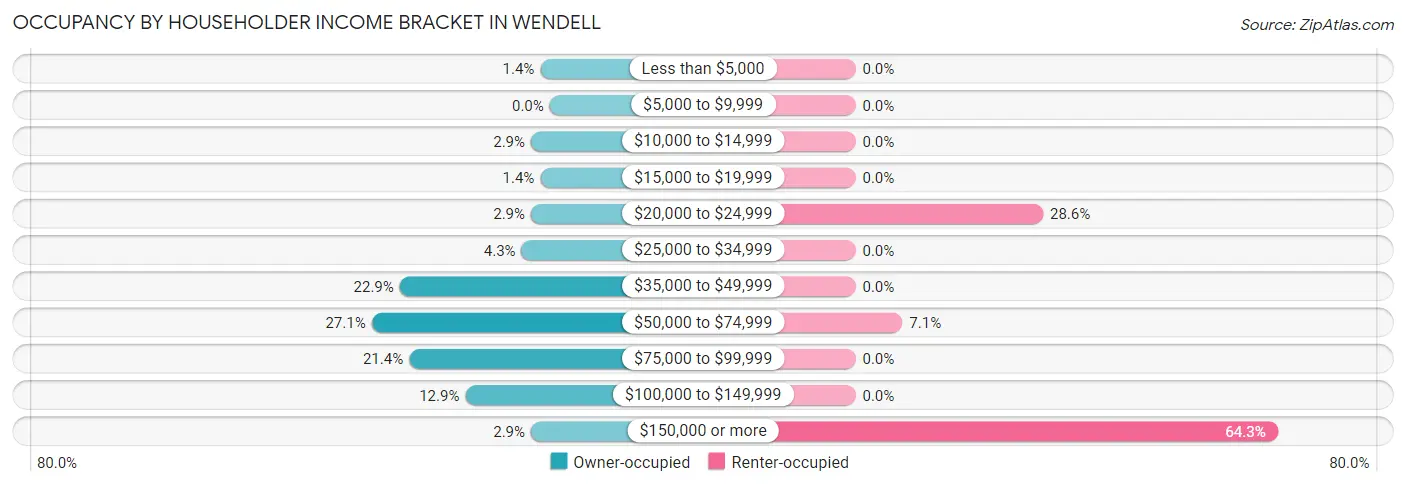
| Income Bracket | Owner-occupied | Renter-occupied |
| Less than $5,000 | 1 (1.4%) | 0 (0.0%) |
| $5,000 to $9,999 | 0 (0.0%) | 0 (0.0%) |
| $10,000 to $14,999 | 2 (2.9%) | 0 (0.0%) |
| $15,000 to $19,999 | 1 (1.4%) | 0 (0.0%) |
| $20,000 to $24,999 | 2 (2.9%) | 4 (28.6%) |
| $25,000 to $34,999 | 3 (4.3%) | 0 (0.0%) |
| $35,000 to $49,999 | 16 (22.9%) | 0 (0.0%) |
| $50,000 to $74,999 | 19 (27.1%) | 1 (7.1%) |
| $75,000 to $99,999 | 15 (21.4%) | 0 (0.0%) |
| $100,000 to $149,999 | 9 (12.9%) | 0 (0.0%) |
| $150,000 or more | 2 (2.9%) | 9 (64.3%) |
| Total | 70 (100.0%) | 14 (100.0%) |
Monthly Housing Cost Tiers in Wendell
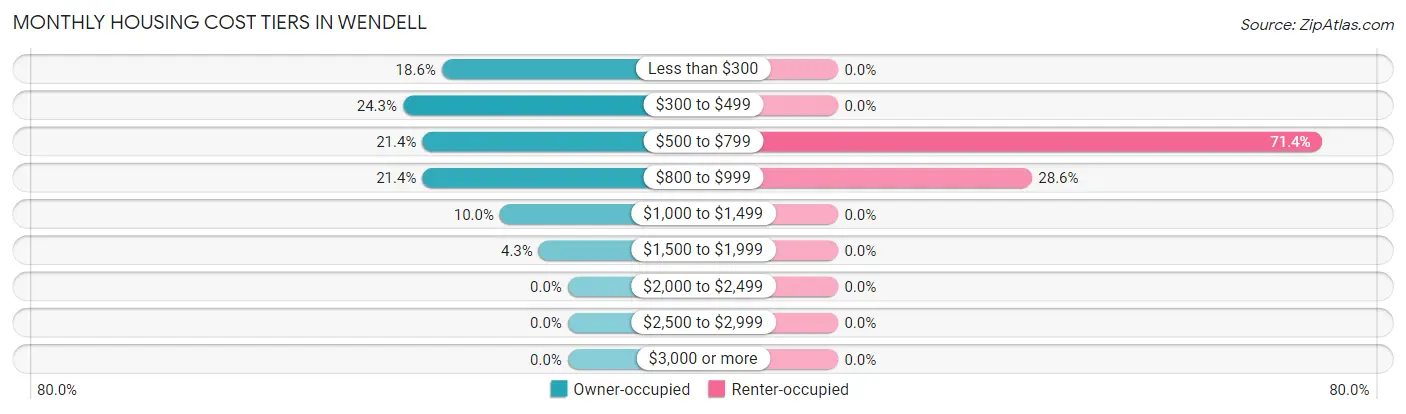
| Monthly Cost | Owner-occupied | Renter-occupied |
| Less than $300 | 13 (18.6%) | 0 (0.0%) |
| $300 to $499 | 17 (24.3%) | 0 (0.0%) |
| $500 to $799 | 15 (21.4%) | 10 (71.4%) |
| $800 to $999 | 15 (21.4%) | 4 (28.6%) |
| $1,000 to $1,499 | 7 (10.0%) | 0 (0.0%) |
| $1,500 to $1,999 | 3 (4.3%) | 0 (0.0%) |
| $2,000 to $2,499 | 0 (0.0%) | 0 (0.0%) |
| $2,500 to $2,999 | 0 (0.0%) | 0 (0.0%) |
| $3,000 or more | 0 (0.0%) | 0 (0.0%) |
| Total | 70 (100.0%) | 14 (100.0%) |
Physical Housing Characteristics in Wendell
Housing Structures in Wendell
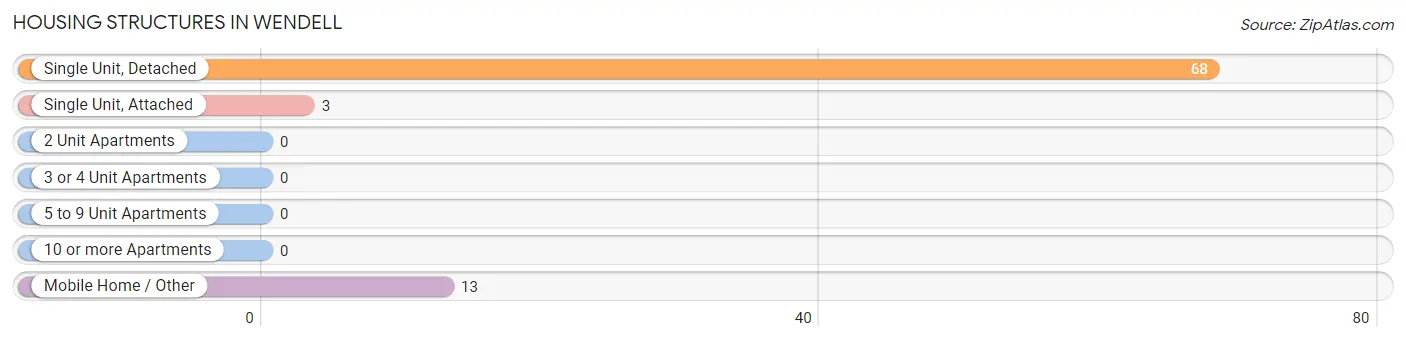
| Structure Type | # Housing Units | % Housing Units |
| Single Unit, Detached | 68 | 80.9% |
| Single Unit, Attached | 3 | 3.6% |
| 2 Unit Apartments | 0 | 0.0% |
| 3 or 4 Unit Apartments | 0 | 0.0% |
| 5 to 9 Unit Apartments | 0 | 0.0% |
| 10 or more Apartments | 0 | 0.0% |
| Mobile Home / Other | 13 | 15.5% |
| Total | 84 | 100.0% |
Housing Structures by Occupancy in Wendell
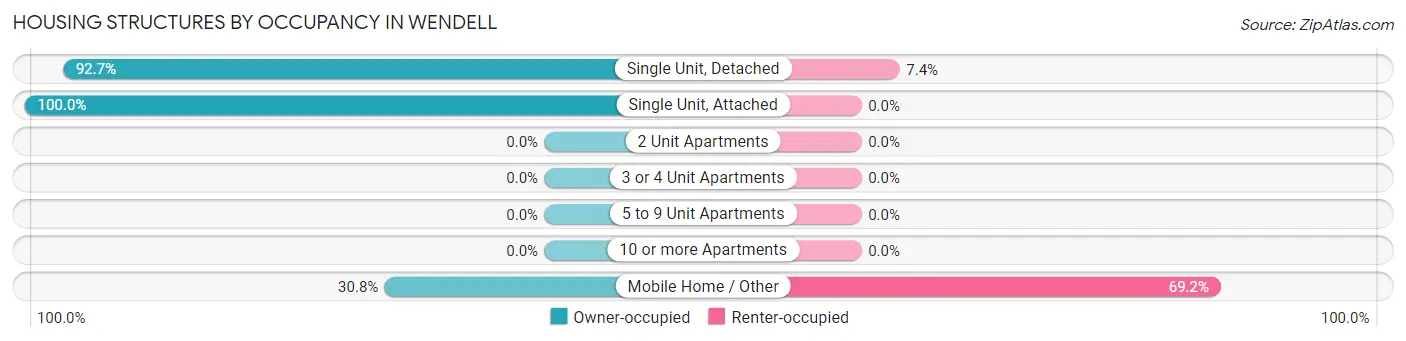
| Structure Type | Owner-occupied | Renter-occupied |
| Single Unit, Detached | 63 (92.6%) | 5 (7.3%) |
| Single Unit, Attached | 3 (100.0%) | 0 (0.0%) |
| 2 Unit Apartments | 0 (0.0%) | 0 (0.0%) |
| 3 or 4 Unit Apartments | 0 (0.0%) | 0 (0.0%) |
| 5 to 9 Unit Apartments | 0 (0.0%) | 0 (0.0%) |
| 10 or more Apartments | 0 (0.0%) | 0 (0.0%) |
| Mobile Home / Other | 4 (30.8%) | 9 (69.2%) |
| Total | 70 (83.3%) | 14 (16.7%) |
Housing Structures by Number of Rooms in Wendell
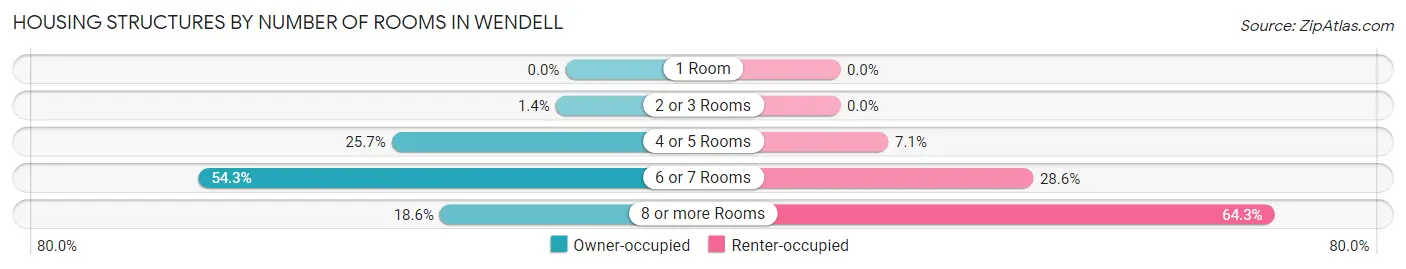
| Number of Rooms | Owner-occupied | Renter-occupied |
| 1 Room | 0 (0.0%) | 0 (0.0%) |
| 2 or 3 Rooms | 1 (1.4%) | 0 (0.0%) |
| 4 or 5 Rooms | 18 (25.7%) | 1 (7.1%) |
| 6 or 7 Rooms | 38 (54.3%) | 4 (28.6%) |
| 8 or more Rooms | 13 (18.6%) | 9 (64.3%) |
| Total | 70 (100.0%) | 14 (100.0%) |
Housing Structure by Heating Type in Wendell
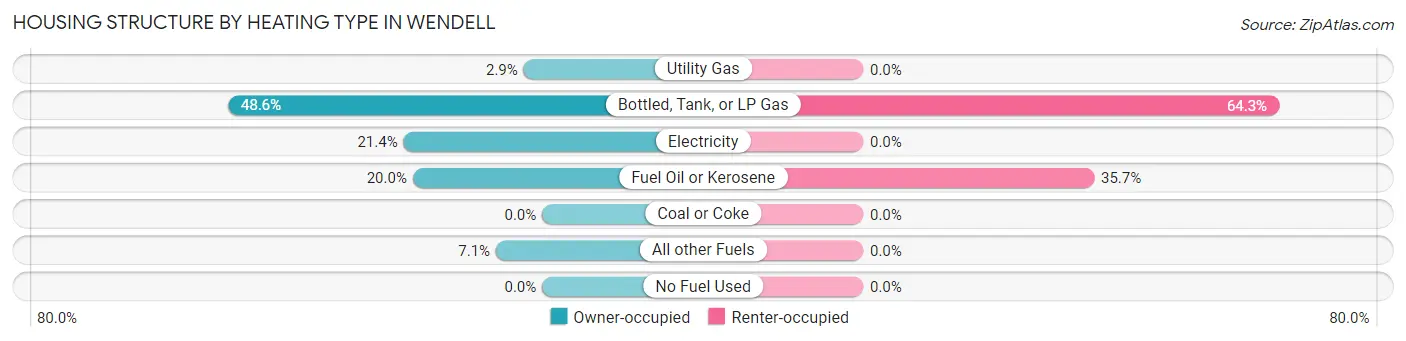
| Heating Type | Owner-occupied | Renter-occupied |
| Utility Gas | 2 (2.9%) | 0 (0.0%) |
| Bottled, Tank, or LP Gas | 34 (48.6%) | 9 (64.3%) |
| Electricity | 15 (21.4%) | 0 (0.0%) |
| Fuel Oil or Kerosene | 14 (20.0%) | 5 (35.7%) |
| Coal or Coke | 0 (0.0%) | 0 (0.0%) |
| All other Fuels | 5 (7.1%) | 0 (0.0%) |
| No Fuel Used | 0 (0.0%) | 0 (0.0%) |
| Total | 70 (100.0%) | 14 (100.0%) |
Household Vehicle Usage in Wendell
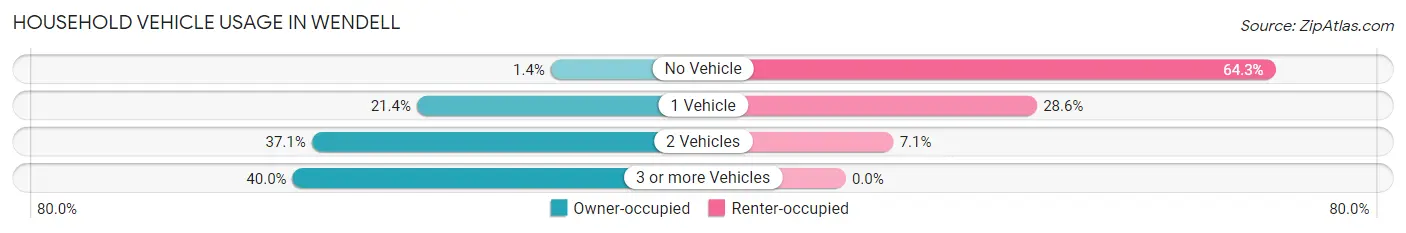
| Vehicles per Household | Owner-occupied | Renter-occupied |
| No Vehicle | 1 (1.4%) | 9 (64.3%) |
| 1 Vehicle | 15 (21.4%) | 4 (28.6%) |
| 2 Vehicles | 26 (37.1%) | 1 (7.1%) |
| 3 or more Vehicles | 28 (40.0%) | 0 (0.0%) |
| Total | 70 (100.0%) | 14 (100.0%) |
Real Estate & Mortgages in Wendell
Real Estate and Mortgage Overview in Wendell
| Characteristic | Without Mortgage | With Mortgage |
| Housing Units | 51 | 19 |
| Median Property Value | $47,500 | $104,200 |
| Median Household Income | $58,594 | $0 |
| Monthly Housing Costs | $455 | $0 |
| Real Estate Taxes | $529 | $0 |
Property Value by Mortgage Status in Wendell
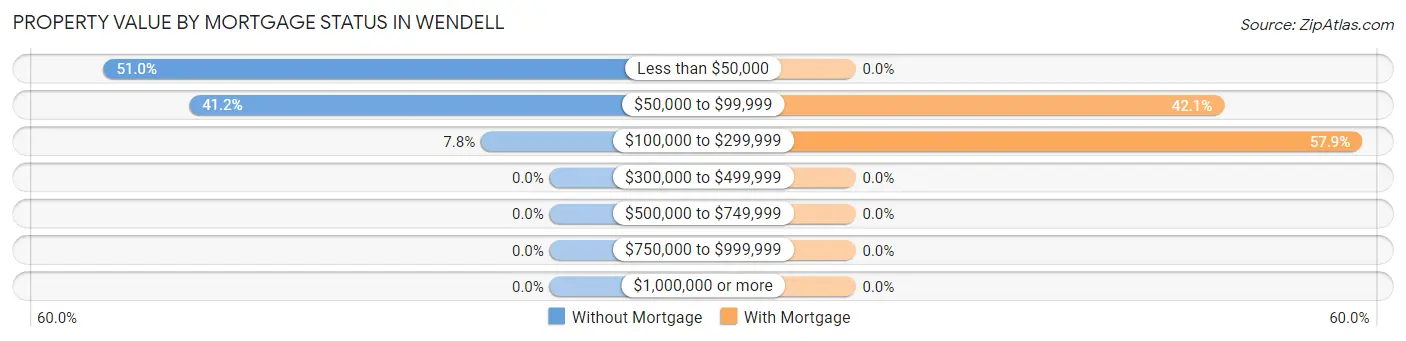
| Property Value | Without Mortgage | With Mortgage |
| Less than $50,000 | 26 (51.0%) | 0 (0.0%) |
| $50,000 to $99,999 | 21 (41.2%) | 8 (42.1%) |
| $100,000 to $299,999 | 4 (7.8%) | 11 (57.9%) |
| $300,000 to $499,999 | 0 (0.0%) | 0 (0.0%) |
| $500,000 to $749,999 | 0 (0.0%) | 0 (0.0%) |
| $750,000 to $999,999 | 0 (0.0%) | 0 (0.0%) |
| $1,000,000 or more | 0 (0.0%) | 0 (0.0%) |
| Total | 51 (100.0%) | 19 (100.0%) |
Household Income by Mortgage Status in Wendell
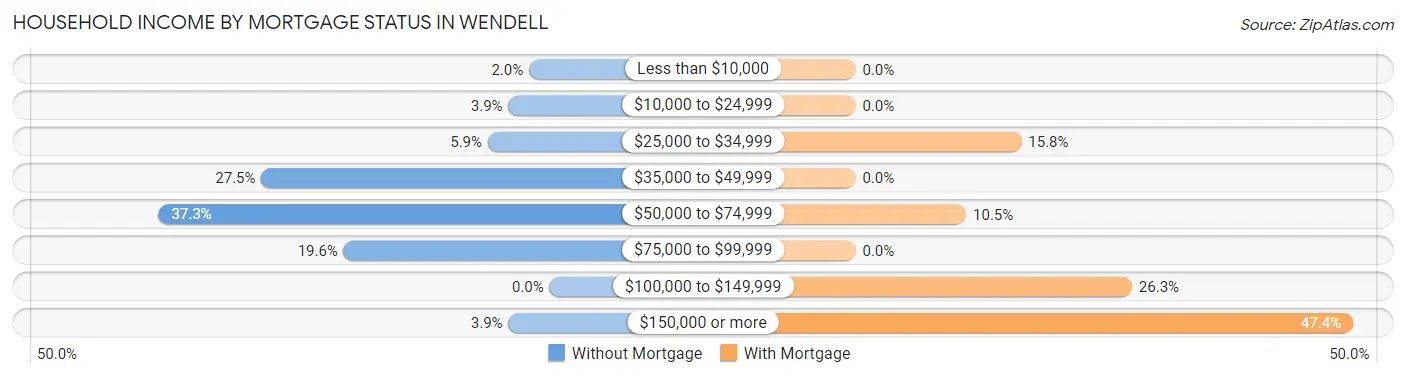
| Household Income | Without Mortgage | With Mortgage |
| Less than $10,000 | 1 (2.0%) | 0 (0.0%) |
| $10,000 to $24,999 | 2 (3.9%) | 0 (0.0%) |
| $25,000 to $34,999 | 3 (5.9%) | 3 (15.8%) |
| $35,000 to $49,999 | 14 (27.5%) | 0 (0.0%) |
| $50,000 to $74,999 | 19 (37.2%) | 2 (10.5%) |
| $75,000 to $99,999 | 10 (19.6%) | 0 (0.0%) |
| $100,000 to $149,999 | 0 (0.0%) | 5 (26.3%) |
| $150,000 or more | 2 (3.9%) | 9 (47.4%) |
| Total | 51 (100.0%) | 19 (100.0%) |
Property Value to Household Income Ratio in Wendell
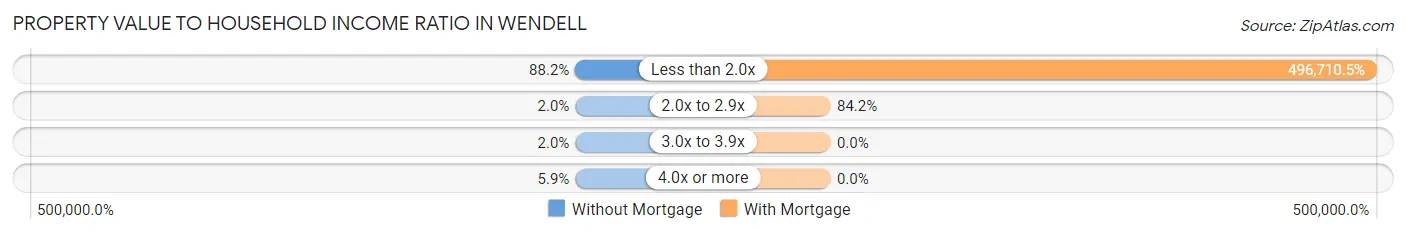
| Value-to-Income Ratio | Without Mortgage | With Mortgage |
| Less than 2.0x | 45 (88.2%) | 94,375 (496,710.5%) |
| 2.0x to 2.9x | 1 (2.0%) | 16 (84.2%) |
| 3.0x to 3.9x | 1 (2.0%) | 0 (0.0%) |
| 4.0x or more | 3 (5.9%) | 0 (0.0%) |
| Total | 51 (100.0%) | 19 (100.0%) |
Real Estate Taxes by Mortgage Status in Wendell
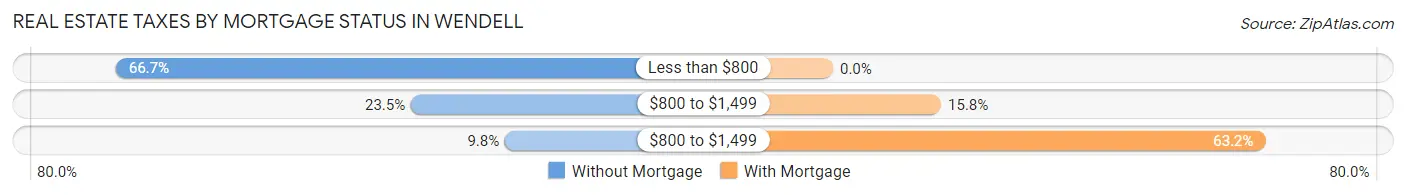
| Property Taxes | Without Mortgage | With Mortgage |
| Less than $800 | 34 (66.7%) | 0 (0.0%) |
| $800 to $1,499 | 12 (23.5%) | 3 (15.8%) |
| $800 to $1,499 | 5 (9.8%) | 12 (63.2%) |
| Total | 51 (100.0%) | 19 (100.0%) |
Health & Disability in Wendell
Health Insurance Coverage by Age in Wendell
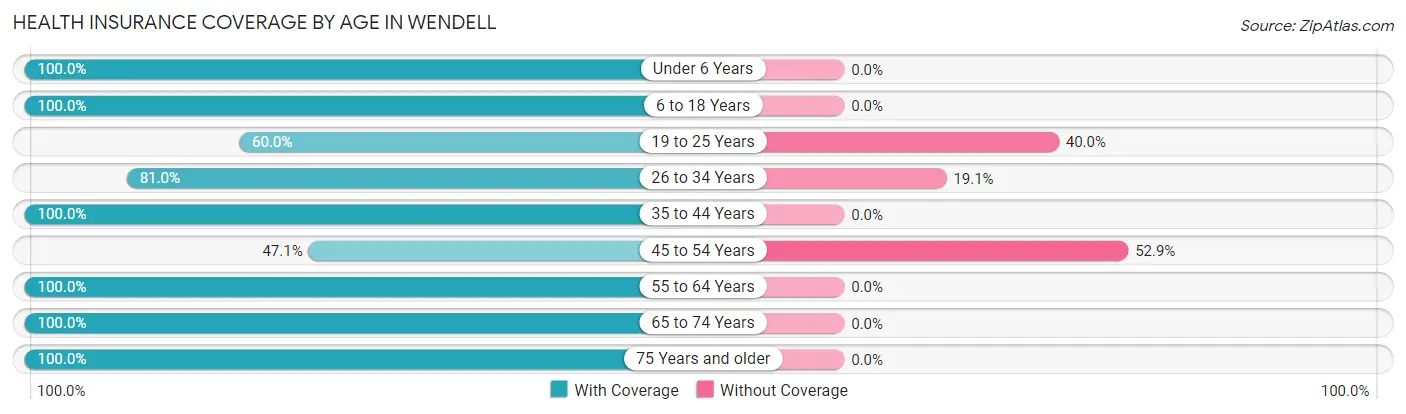
| Age Bracket | With Coverage | Without Coverage |
| Under 6 Years | 17 (100.0%) | 0 (0.0%) |
| 6 to 18 Years | 22 (100.0%) | 0 (0.0%) |
| 19 to 25 Years | 9 (60.0%) | 6 (40.0%) |
| 26 to 34 Years | 17 (80.9%) | 4 (19.1%) |
| 35 to 44 Years | 29 (100.0%) | 0 (0.0%) |
| 45 to 54 Years | 8 (47.1%) | 9 (52.9%) |
| 55 to 64 Years | 24 (100.0%) | 0 (0.0%) |
| 65 to 74 Years | 20 (100.0%) | 0 (0.0%) |
| 75 Years and older | 20 (100.0%) | 0 (0.0%) |
| Total | 166 (89.7%) | 19 (10.3%) |
Health Insurance Coverage by Citizenship Status in Wendell
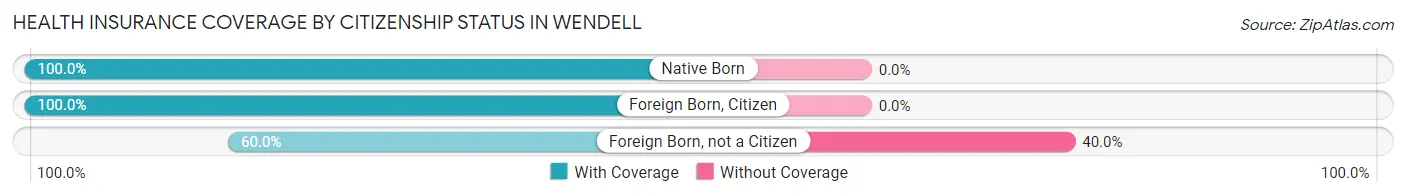
| Citizenship Status | With Coverage | Without Coverage |
| Native Born | 17 (100.0%) | 0 (0.0%) |
| Foreign Born, Citizen | 22 (100.0%) | 0 (0.0%) |
| Foreign Born, not a Citizen | 9 (60.0%) | 6 (40.0%) |
Health Insurance Coverage by Household Income in Wendell
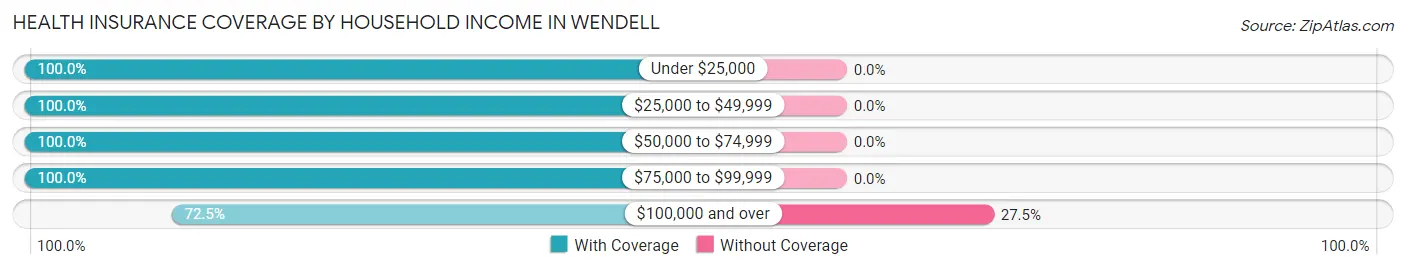
| Household Income | With Coverage | Without Coverage |
| Under $25,000 | 24 (100.0%) | 0 (0.0%) |
| $25,000 to $49,999 | 29 (100.0%) | 0 (0.0%) |
| $50,000 to $74,999 | 33 (100.0%) | 0 (0.0%) |
| $75,000 to $99,999 | 30 (100.0%) | 0 (0.0%) |
| $100,000 and over | 50 (72.5%) | 19 (27.5%) |
Public vs Private Health Insurance Coverage by Age in Wendell
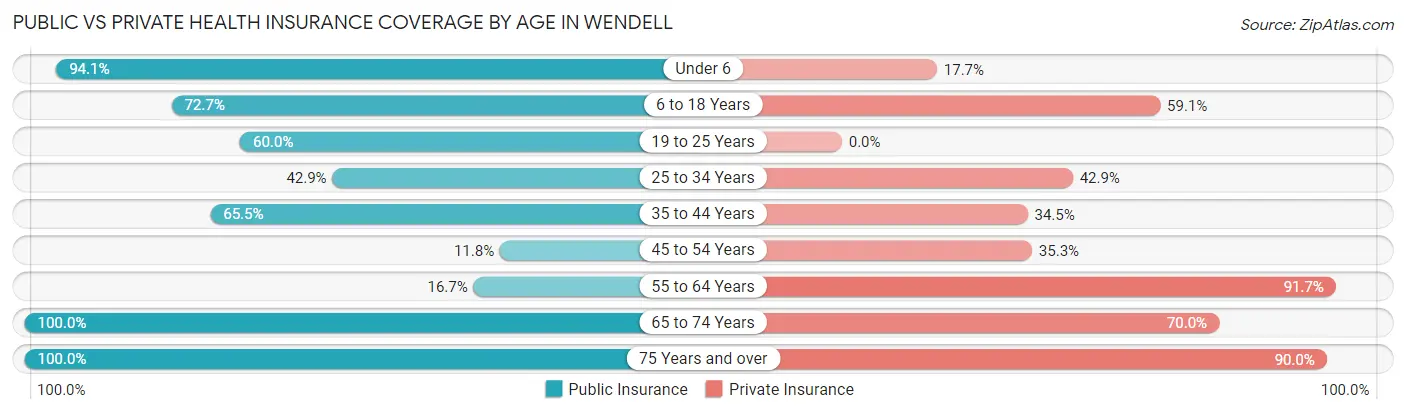
| Age Bracket | Public Insurance | Private Insurance |
| Under 6 | 16 (94.1%) | 3 (17.6%) |
| 6 to 18 Years | 16 (72.7%) | 13 (59.1%) |
| 19 to 25 Years | 9 (60.0%) | 0 (0.0%) |
| 25 to 34 Years | 9 (42.9%) | 9 (42.9%) |
| 35 to 44 Years | 19 (65.5%) | 10 (34.5%) |
| 45 to 54 Years | 2 (11.8%) | 6 (35.3%) |
| 55 to 64 Years | 4 (16.7%) | 22 (91.7%) |
| 65 to 74 Years | 20 (100.0%) | 14 (70.0%) |
| 75 Years and over | 20 (100.0%) | 18 (90.0%) |
| Total | 115 (62.2%) | 95 (51.3%) |
Disability Status by Sex by Age in Wendell
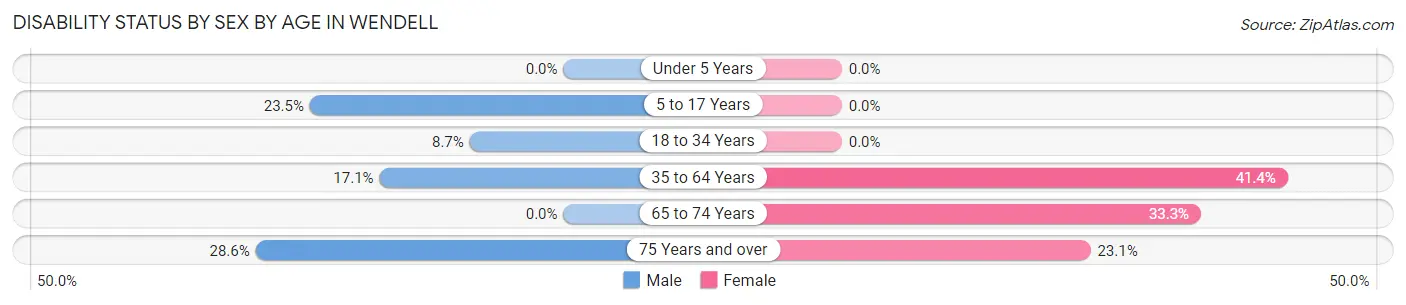
| Age Bracket | Male | Female |
| Under 5 Years | 0 (0.0%) | 0 (0.0%) |
| 5 to 17 Years | 4 (23.5%) | 0 (0.0%) |
| 18 to 34 Years | 2 (8.7%) | 0 (0.0%) |
| 35 to 64 Years | 7 (17.1%) | 12 (41.4%) |
| 65 to 74 Years | 0 (0.0%) | 4 (33.3%) |
| 75 Years and over | 2 (28.6%) | 3 (23.1%) |
Disability Class by Sex by Age in Wendell
Disability Class: Hearing Difficulty
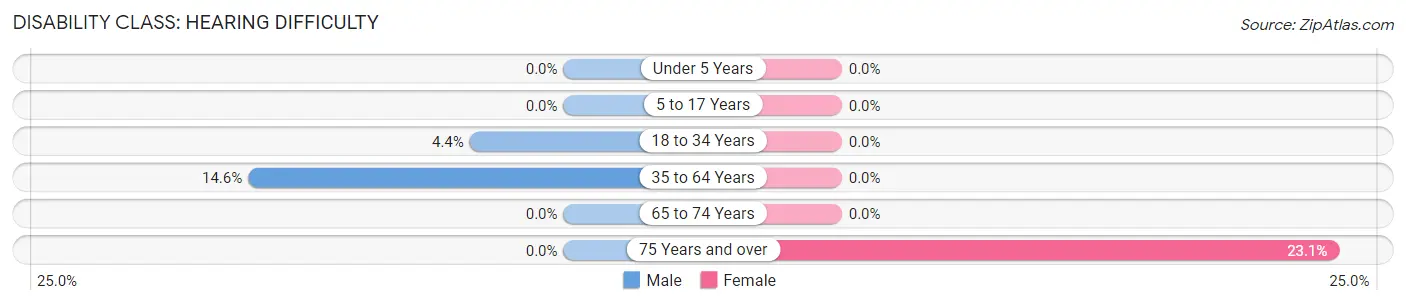
| Age Bracket | Male | Female |
| Under 5 Years | 0 (0.0%) | 0 (0.0%) |
| 5 to 17 Years | 0 (0.0%) | 0 (0.0%) |
| 18 to 34 Years | 1 (4.3%) | 0 (0.0%) |
| 35 to 64 Years | 6 (14.6%) | 0 (0.0%) |
| 65 to 74 Years | 0 (0.0%) | 0 (0.0%) |
| 75 Years and over | 0 (0.0%) | 3 (23.1%) |
Disability Class: Vision Difficulty
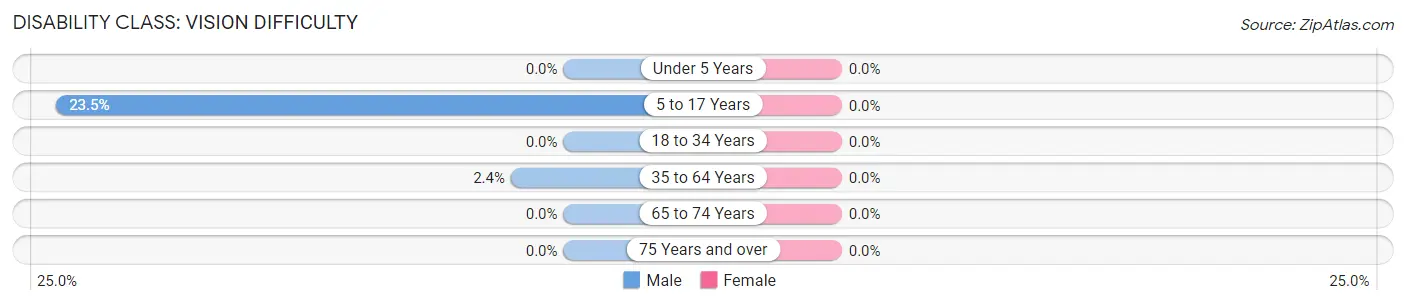
| Age Bracket | Male | Female |
| Under 5 Years | 0 (0.0%) | 0 (0.0%) |
| 5 to 17 Years | 4 (23.5%) | 0 (0.0%) |
| 18 to 34 Years | 0 (0.0%) | 0 (0.0%) |
| 35 to 64 Years | 1 (2.4%) | 0 (0.0%) |
| 65 to 74 Years | 0 (0.0%) | 0 (0.0%) |
| 75 Years and over | 0 (0.0%) | 0 (0.0%) |
Disability Class: Cognitive Difficulty
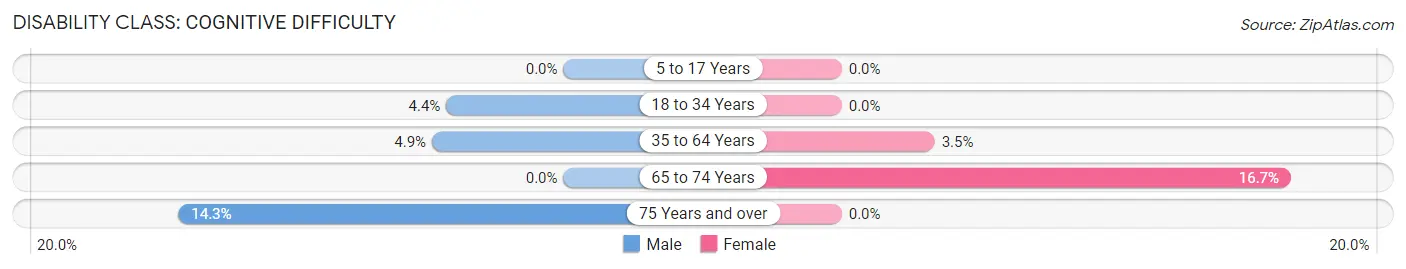
| Age Bracket | Male | Female |
| 5 to 17 Years | 0 (0.0%) | 0 (0.0%) |
| 18 to 34 Years | 1 (4.3%) | 0 (0.0%) |
| 35 to 64 Years | 2 (4.9%) | 1 (3.5%) |
| 65 to 74 Years | 0 (0.0%) | 2 (16.7%) |
| 75 Years and over | 1 (14.3%) | 0 (0.0%) |
Disability Class: Ambulatory Difficulty
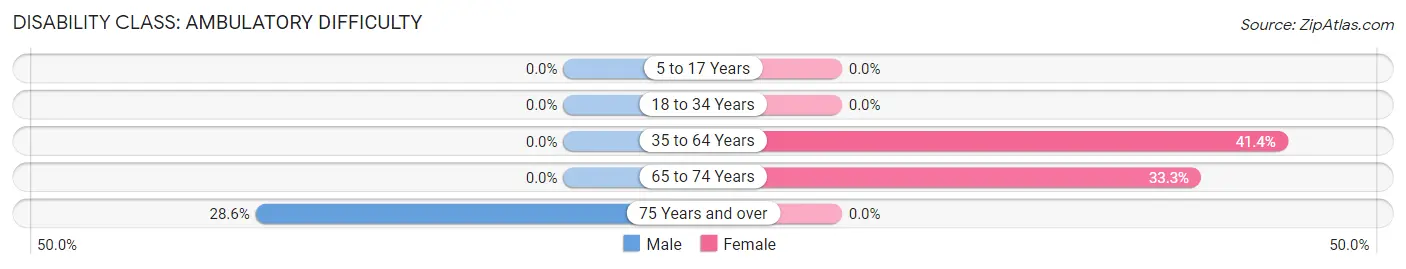
| Age Bracket | Male | Female |
| 5 to 17 Years | 0 (0.0%) | 0 (0.0%) |
| 18 to 34 Years | 0 (0.0%) | 0 (0.0%) |
| 35 to 64 Years | 0 (0.0%) | 12 (41.4%) |
| 65 to 74 Years | 0 (0.0%) | 4 (33.3%) |
| 75 Years and over | 2 (28.6%) | 0 (0.0%) |
Disability Class: Self-Care Difficulty
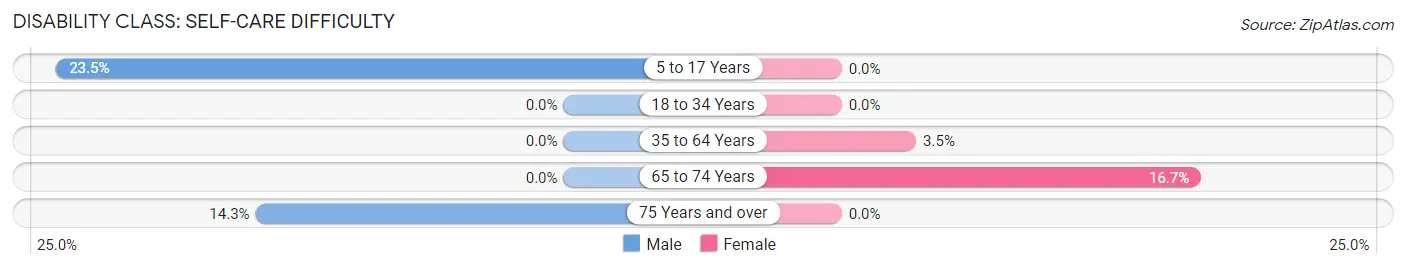
| Age Bracket | Male | Female |
| 5 to 17 Years | 4 (23.5%) | 0 (0.0%) |
| 18 to 34 Years | 0 (0.0%) | 0 (0.0%) |
| 35 to 64 Years | 0 (0.0%) | 1 (3.5%) |
| 65 to 74 Years | 0 (0.0%) | 2 (16.7%) |
| 75 Years and over | 1 (14.3%) | 0 (0.0%) |
Technology Access in Wendell
Computing Device Access in Wendell
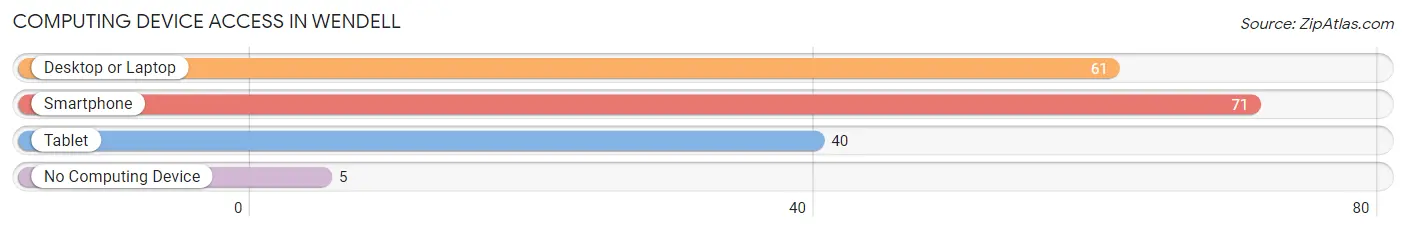
| Device Type | # Households | % Households |
| Desktop or Laptop | 61 | 72.6% |
| Smartphone | 71 | 84.5% |
| Tablet | 40 | 47.6% |
| No Computing Device | 5 | 5.9% |
| Total | 84 | 100.0% |
Internet Access in Wendell
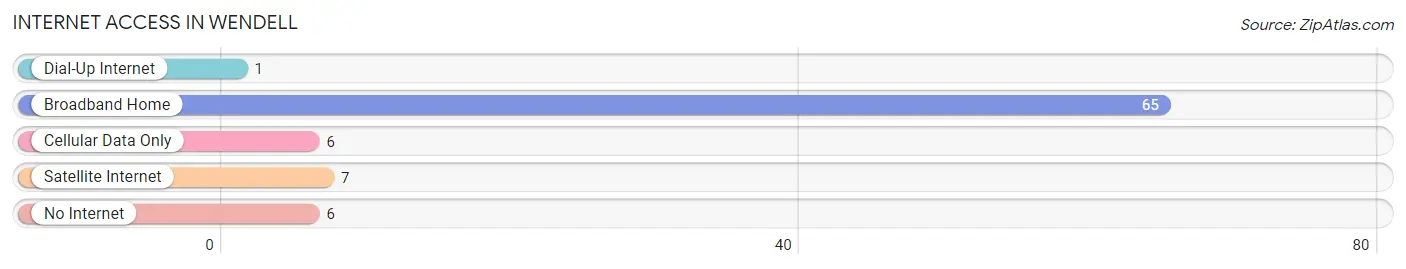
| Internet Type | # Households | % Households |
| Dial-Up Internet | 1 | 1.2% |
| Broadband Home | 65 | 77.4% |
| Cellular Data Only | 6 | 7.1% |
| Satellite Internet | 7 | 8.3% |
| No Internet | 6 | 7.1% |
| Total | 84 | 100.0% |
Wendell Summary
Wendell is a small city located in the western part of Minnesota, in the United States. It is situated in the Otter Tail County, and is part of the Fergus Falls Metropolitan Statistical Area. The city has a population of 1,845 people, according to the 2010 census.
History
The area that is now Wendell was first settled in 1871 by a group of Norwegian immigrants. The city was named after Wendell Phillips, a prominent abolitionist and orator. The city was officially incorporated in 1887.
In the early 1900s, Wendell was a thriving agricultural community. The city was home to a number of grain elevators, a creamery, and a flour mill. The city also had a number of businesses, including a bank, a hotel, a hardware store, and a lumberyard.
In the 1950s, the city began to experience a decline in population as people moved away to larger cities. However, in the late 1970s, the city began to experience a resurgence as people began to move back to the area.
Geography
Wendell is located in the western part of Minnesota, in the United States. It is situated in the Otter Tail County, and is part of the Fergus Falls Metropolitan Statistical Area. The city has a total area of 1.2 square miles, all of which is land.
The city is located on the banks of the Otter Tail River. The city is surrounded by rolling hills and farmland. The city is located about 30 miles east of the city of Fergus Falls.
Economy
The economy of Wendell is largely based on agriculture. The city is home to a number of grain elevators, a creamery, and a flour mill. The city also has a number of businesses, including a bank, a hotel, a hardware store, and a lumberyard.
The city is also home to a number of manufacturing companies, including a plastics manufacturer, a metal fabricator, and a printing company. The city is also home to a number of retail stores, including a grocery store, a hardware store, and a clothing store.
Demographics
According to the 2010 census, the population of Wendell was 1,845 people. The racial makeup of the city was 97.3% White, 0.3% African American, 0.2% Native American, 0.2% Asian, 0.1% Pacific Islander, 0.7% from other races, and 1.2% from two or more races. Hispanic or Latino of any race were 1.7% of the population.
The median household income in Wendell was $41,250, and the median family income was $50,000. The per capita income for the city was $20,845. About 8.3% of families and 10.2% of the population were below the poverty line, including 13.2% of those under age 18 and 8.3% of those age 65 or over.
Common Questions
What is Per Capita Income in Wendell?
Per Capita income in Wendell is $31,699.
What is the Median Family Income in Wendell?
Median Family Income in Wendell is $45,000.
What is the Median Household income in Wendell?
Median Household Income in Wendell is $62,500.
What is Inequality or Gini Index in Wendell?
Inequality or Gini Index in Wendell is 0.36.
What is the Total Population of Wendell?
Total Population of Wendell is 185.
What is the Total Male Population of Wendell?
Total Male Population of Wendell is 100.
What is the Total Female Population of Wendell?
Total Female Population of Wendell is 85.
What is the Ratio of Males per 100 Females in Wendell?
There are 117.65 Males per 100 Females in Wendell.
What is the Ratio of Females per 100 Males in Wendell?
There are 85.00 Females per 100 Males in Wendell.
What is the Median Population Age in Wendell?
Median Population Age in Wendell is 42.2 Years.
What is the Average Family Size in Wendell
Average Family Size in Wendell is 2.4 People.
What is the Average Household Size in Wendell
Average Household Size in Wendell is 2.2 People.
How Large is the Labor Force in Wendell?
There are 105 People in the Labor Forcein in Wendell.
What is the Percentage of People in the Labor Force in Wendell?
70.0% of People are in the Labor Force in Wendell.