Cities with the Highest Percentage of Population with a Degree in Communications in North Carolina
RELATED REPORTS & OPTIONS
Communications
North Carolina
Compare Cities
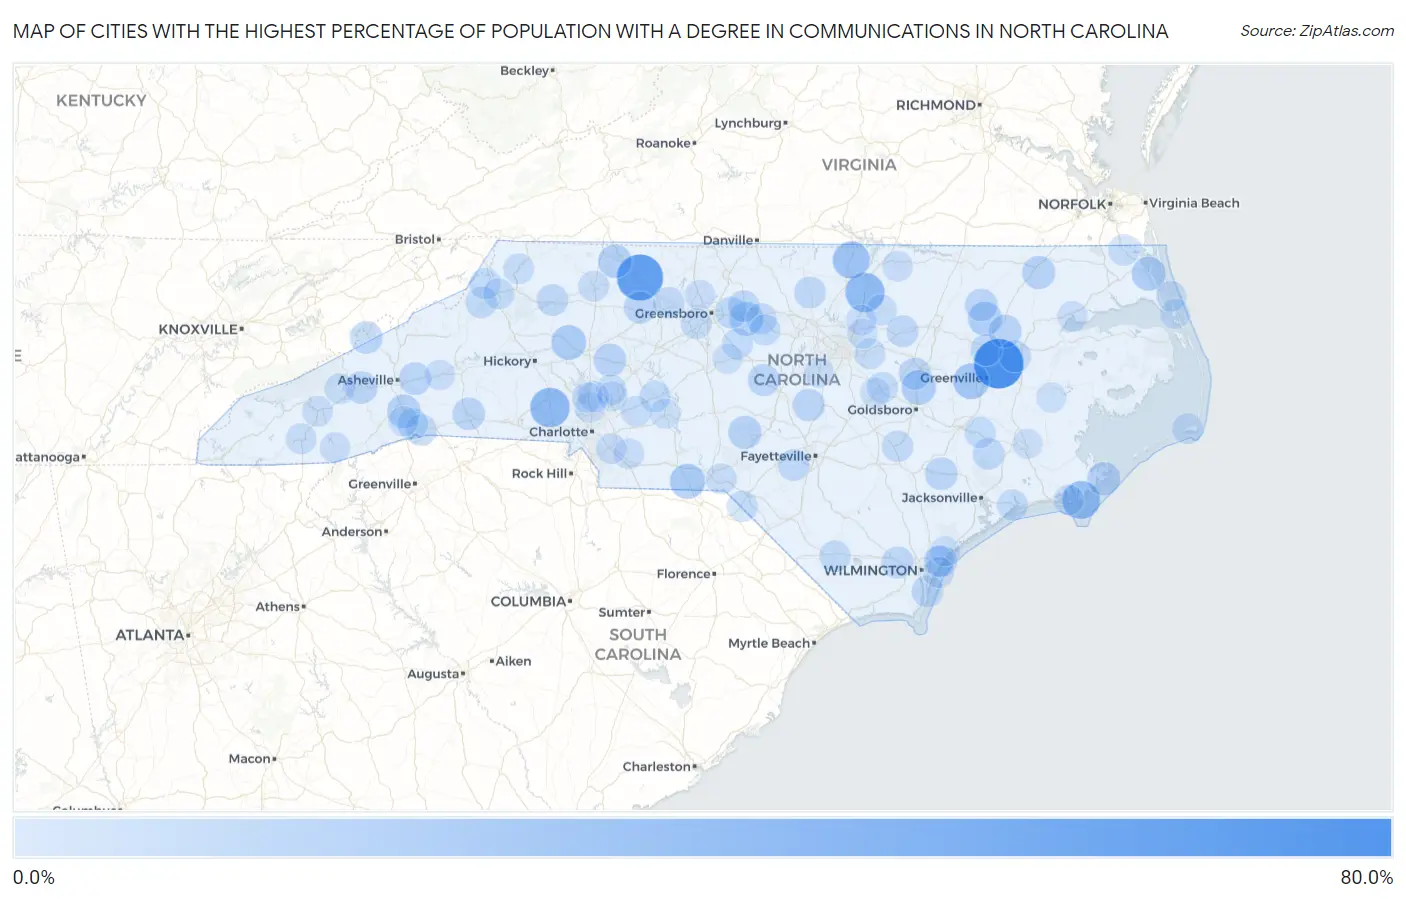
Map of Cities with the Highest Percentage of Population with a Degree in Communications in North Carolina
0.0%
80.0%
Cities with the Highest Percentage of Population with a Degree in Communications in North Carolina
| City | % Graduates | vs State | vs National | |
| 1. | Stokes | 61.3% | 4.1%(+57.2)#1 | 4.1%(+57.2)#51 |
| 2. | Pinnacle | 51.2% | 4.1%(+47.1)#2 | 4.1%(+47.1)#71 |
| 3. | High Shoals | 31.9% | 4.1%(+27.8)#3 | 4.1%(+27.8)#203 |
| 4. | Kittrell | 31.2% | 4.1%(+27.2)#4 | 4.1%(+27.1)#211 |
| 5. | Gloucester | 27.8% | 4.1%(+23.8)#5 | 4.1%(+23.7)#258 |
| 6. | Stovall | 25.0% | 4.1%(+20.9)#6 | 4.1%(+20.9)#308 |
| 7. | Bell Arthur | 22.0% | 4.1%(+17.9)#7 | 4.1%(+17.8)#385 |
| 8. | Morven | 19.5% | 4.1%(+15.4)#8 | 4.1%(+15.4)#486 |
| 9. | Stony Point | 18.6% | 4.1%(+14.5)#9 | 4.1%(+14.4)#521 |
| 10. | Fremont | 17.9% | 4.1%(+13.9)#10 | 4.1%(+13.8)#546 |
| 11. | Coinjock | 16.7% | 4.1%(+12.6)#11 | 4.1%(+12.5)#610 |
| 12. | Hobgood | 16.7% | 4.1%(+12.6)#12 | 4.1%(+12.5)#612 |
| 13. | Alamance | 16.5% | 4.1%(+12.4)#13 | 4.1%(+12.4)#634 |
| 14. | White Plains | 15.4% | 4.1%(+11.3)#14 | 4.1%(+11.2)#718 |
| 15. | Mountain Home | 15.1% | 4.1%(+11.1)#15 | 4.1%(+11.0)#741 |
| 16. | Atlantic | 14.3% | 4.1%(+10.2)#16 | 4.1%(+10.2)#817 |
| 17. | Cofield | 14.3% | 4.1%(+10.2)#17 | 4.1%(+10.2)#822 |
| 18. | Taylortown | 14.1% | 4.1%(+10.1)#18 | 4.1%(+10.0)#854 |
| 19. | Hamilton | 13.6% | 4.1%(+9.56)#19 | 4.1%(+9.50)#898 |
| 20. | Cleveland | 13.3% | 4.1%(+9.23)#20 | 4.1%(+9.17)#945 |
| 21. | Beulaville | 12.8% | 4.1%(+8.73)#21 | 4.1%(+8.66)#1,014 |
| 22. | Scotland Neck | 12.7% | 4.1%(+8.65)#22 | 4.1%(+8.59)#1,021 |
| 23. | Hot Springs | 12.7% | 4.1%(+8.65)#23 | 4.1%(+8.59)#1,022 |
| 24. | Swannanoa | 12.7% | 4.1%(+8.60)#24 | 4.1%(+8.54)#1,025 |
| 25. | Mamers | 12.7% | 4.1%(+8.59)#25 | 4.1%(+8.52)#1,028 |
| 26. | West Canton | 12.6% | 4.1%(+8.54)#26 | 4.1%(+8.48)#1,034 |
| 27. | Spindale | 12.4% | 4.1%(+8.34)#27 | 4.1%(+8.28)#1,078 |
| 28. | Lewisville | 11.6% | 4.1%(+7.50)#28 | 4.1%(+7.44)#1,216 |
| 29. | Lucama | 11.5% | 4.1%(+7.40)#29 | 4.1%(+7.34)#1,237 |
| 30. | Goldston | 11.4% | 4.1%(+7.29)#30 | 4.1%(+7.23)#1,253 |
| 31. | Sea Breeze | 11.1% | 4.1%(+7.04)#31 | 4.1%(+6.98)#1,289 |
| 32. | Sandy Creek | 11.1% | 4.1%(+7.04)#32 | 4.1%(+6.98)#1,301 |
| 33. | Bear Grass | 11.1% | 4.1%(+7.04)#33 | 4.1%(+6.98)#1,313 |
| 34. | Spring Hope | 10.9% | 4.1%(+6.80)#34 | 4.1%(+6.73)#1,367 |
| 35. | Sedalia | 10.8% | 4.1%(+6.71)#35 | 4.1%(+6.65)#1,386 |
| 36. | Porters Neck | 10.7% | 4.1%(+6.65)#36 | 4.1%(+6.59)#1,397 |
| 37. | Bethel | 10.6% | 4.1%(+6.52)#37 | 4.1%(+6.46)#1,426 |
| 38. | Rougemont | 10.5% | 4.1%(+6.42)#38 | 4.1%(+6.36)#1,457 |
| 39. | Elon | 10.5% | 4.1%(+6.39)#39 | 4.1%(+6.33)#1,463 |
| 40. | Rockfish | 10.3% | 4.1%(+6.21)#40 | 4.1%(+6.15)#1,502 |
| 41. | Cricket | 10.3% | 4.1%(+6.19)#41 | 4.1%(+6.13)#1,509 |
| 42. | Trenton | 10.3% | 4.1%(+6.18)#42 | 4.1%(+6.12)#1,517 |
| 43. | Governors Club | 10.1% | 4.1%(+6.06)#43 | 4.1%(+6.00)#1,550 |
| 44. | Whiteville | 10.0% | 4.1%(+5.89)#44 | 4.1%(+5.83)#1,605 |
| 45. | Walkertown | 9.6% | 4.1%(+5.51)#45 | 4.1%(+5.44)#1,718 |
| 46. | Seven Devils | 9.6% | 4.1%(+5.51)#46 | 4.1%(+5.44)#1,719 |
| 47. | Saluda | 9.5% | 4.1%(+5.42)#47 | 4.1%(+5.36)#1,748 |
| 48. | New Hope | 9.5% | 4.1%(+5.42)#48 | 4.1%(+5.35)#1,750 |
| 49. | Faison | 9.3% | 4.1%(+5.23)#49 | 4.1%(+5.17)#1,804 |
| 50. | Misenheimer | 9.3% | 4.1%(+5.23)#50 | 4.1%(+5.17)#1,807 |
| 51. | Moyock | 9.2% | 4.1%(+5.09)#51 | 4.1%(+5.03)#1,845 |
| 52. | Cove Creek | 9.0% | 4.1%(+4.96)#52 | 4.1%(+4.90)#1,903 |
| 53. | Swansboro | 9.0% | 4.1%(+4.92)#53 | 4.1%(+4.85)#1,922 |
| 54. | East Flat Rock | 9.0% | 4.1%(+4.90)#54 | 4.1%(+4.84)#1,926 |
| 55. | Scotch Meadows | 8.7% | 4.1%(+4.62)#55 | 4.1%(+4.56)#2,032 |
| 56. | Dover | 8.7% | 4.1%(+4.62)#56 | 4.1%(+4.56)#2,034 |
| 57. | Selma | 8.6% | 4.1%(+4.51)#57 | 4.1%(+4.45)#2,081 |
| 58. | Swepsonville | 8.5% | 4.1%(+4.46)#58 | 4.1%(+4.40)#2,106 |
| 59. | Boone | 8.5% | 4.1%(+4.46)#59 | 4.1%(+4.40)#2,109 |
| 60. | Saxapahaw | 8.5% | 4.1%(+4.46)#60 | 4.1%(+4.40)#2,110 |
| 61. | Liberty | 8.5% | 4.1%(+4.40)#61 | 4.1%(+4.34)#2,132 |
| 62. | Jamestown | 8.3% | 4.1%(+4.19)#62 | 4.1%(+4.12)#2,234 |
| 63. | Bayshore | 8.1% | 4.1%(+4.05)#63 | 4.1%(+3.99)#2,301 |
| 64. | Wendell | 8.1% | 4.1%(+4.03)#64 | 4.1%(+3.97)#2,310 |
| 65. | Elkin | 8.0% | 4.1%(+3.95)#65 | 4.1%(+3.89)#2,346 |
| 66. | Louisburg | 8.0% | 4.1%(+3.93)#66 | 4.1%(+3.86)#2,354 |
| 67. | Dillsboro | 8.0% | 4.1%(+3.93)#67 | 4.1%(+3.86)#2,361 |
| 68. | Wrightsville Beach | 7.9% | 4.1%(+3.82)#68 | 4.1%(+3.76)#2,410 |
| 69. | Frisco | 7.8% | 4.1%(+3.76)#69 | 4.1%(+3.70)#2,452 |
| 70. | Enochville | 7.8% | 4.1%(+3.74)#70 | 4.1%(+3.68)#2,459 |
| 71. | Mount Pleasant | 7.7% | 4.1%(+3.67)#71 | 4.1%(+3.61)#2,491 |
| 72. | West Jefferson | 7.7% | 4.1%(+3.58)#72 | 4.1%(+3.52)#2,566 |
| 73. | Franklin | 7.5% | 4.1%(+3.45)#73 | 4.1%(+3.39)#2,640 |
| 74. | Maggie Valley | 7.5% | 4.1%(+3.40)#74 | 4.1%(+3.34)#2,662 |
| 75. | Hamlet | 7.5% | 4.1%(+3.39)#75 | 4.1%(+3.33)#2,668 |
| 76. | Warrenton | 7.4% | 4.1%(+3.29)#76 | 4.1%(+3.23)#2,750 |
| 77. | Davidson | 7.3% | 4.1%(+3.27)#77 | 4.1%(+3.21)#2,761 |
| 78. | Duck | 7.3% | 4.1%(+3.20)#78 | 4.1%(+3.14)#2,816 |
| 79. | Unionville | 7.2% | 4.1%(+3.10)#79 | 4.1%(+3.04)#2,890 |
| 80. | Youngsville | 7.2% | 4.1%(+3.08)#80 | 4.1%(+3.02)#2,903 |
| 81. | Huntersville | 7.1% | 4.1%(+3.02)#81 | 4.1%(+2.96)#2,961 |
| 82. | Stallings | 7.1% | 4.1%(+2.98)#82 | 4.1%(+2.92)#2,989 |
| 83. | Old Fort | 7.0% | 4.1%(+2.90)#83 | 4.1%(+2.84)#3,061 |
| 84. | Summerfield | 6.9% | 4.1%(+2.87)#84 | 4.1%(+2.81)#3,085 |
| 85. | Edenton | 6.9% | 4.1%(+2.83)#85 | 4.1%(+2.76)#3,114 |
| 86. | Cashiers | 6.7% | 4.1%(+2.65)#86 | 4.1%(+2.59)#3,288 |
| 87. | Cornelius | 6.7% | 4.1%(+2.58)#87 | 4.1%(+2.52)#3,366 |
| 88. | Beaufort | 6.6% | 4.1%(+2.51)#88 | 4.1%(+2.44)#3,429 |
| 89. | Rolesville | 6.5% | 4.1%(+2.45)#89 | 4.1%(+2.39)#3,478 |
| 90. | Kitty Hawk | 6.5% | 4.1%(+2.42)#90 | 4.1%(+2.35)#3,511 |
| 91. | Smithfield | 6.4% | 4.1%(+2.35)#91 | 4.1%(+2.29)#3,580 |
| 92. | Ramseur | 6.3% | 4.1%(+2.28)#92 | 4.1%(+2.21)#3,638 |
| 93. | Valley Hill | 6.3% | 4.1%(+2.26)#93 | 4.1%(+2.20)#3,654 |
| 94. | Bath | 6.3% | 4.1%(+2.24)#94 | 4.1%(+2.18)#3,674 |
| 95. | Albemarle | 6.3% | 4.1%(+2.24)#95 | 4.1%(+2.18)#3,675 |
| 96. | Bridgeton | 6.3% | 4.1%(+2.23)#96 | 4.1%(+2.16)#3,689 |
| 97. | Kannapolis | 6.3% | 4.1%(+2.20)#97 | 4.1%(+2.14)#3,712 |
| 98. | Brandywine Bay | 6.2% | 4.1%(+2.10)#98 | 4.1%(+2.04)#3,841 |
| 99. | Hampstead | 6.1% | 4.1%(+2.07)#99 | 4.1%(+2.00)#3,876 |
| 100. | Holly Springs | 6.1% | 4.1%(+2.00)#100 | 4.1%(+1.94)#3,945 |
Common Questions
What are the Top 10 Cities with the Highest Percentage of Population with a Degree in Communications in North Carolina?
Top 10 Cities with the Highest Percentage of Population with a Degree in Communications in North Carolina are:
#1
61.3%
#2
51.2%
#3
31.9%
#4
31.2%
#5
27.8%
#6
25.0%
#7
22.0%
#8
19.5%
#9
18.6%
#10
17.9%
What city has the Highest Percentage of Population with a Degree in Communications in North Carolina?
Stokes has the Highest Percentage of Population with a Degree in Communications in North Carolina with 61.3%.
What is the Percentage of Population with a Degree in Communications in the State of North Carolina?
Percentage of Population with a Degree in Communications in North Carolina is 4.1%.
What is the Percentage of Population with a Degree in Communications in the United States?
Percentage of Population with a Degree in Communications in the United States is 4.1%.