Pinnacle, NC Map & Demographics
Pinnacle Map
Pinnacle Overview
$16,055
PER CAPITA INCOME
$56,078
AVG FAMILY INCOME
$32,200
AVG HOUSEHOLD INCOME
0.41
INEQUALITY / GINI INDEX
749
TOTAL POPULATION
327
MALE POPULATION
422
FEMALE POPULATION
77.49
MALES / 100 FEMALES
129.05
FEMALES / 100 MALES
47.7
MEDIAN AGE
3.5
AVG FAMILY SIZE
2.4
AVG HOUSEHOLD SIZE
230
LABOR FORCE [ PEOPLE ]
41.3%
PERCENT IN LABOR FORCE
Pinnacle Zip Codes
Pinnacle Area Codes
Income in Pinnacle
Income Overview in Pinnacle
Per Capita Income in Pinnacle is $16,055, while median incomes of families and households are $56,078 and $32,200 respectively.
| Characteristic | Number | Measure |
| Per Capita Income | 749 | $16,055 |
| Median Family Income | 160 | $56,078 |
| Mean Family Income | 160 | $51,468 |
| Median Household Income | 296 | $32,200 |
| Mean Household Income | 296 | $35,915 |
| Income Deficit | 160 | $0 |
| Wage / Income Gap (%) | 749 | 0.00% |
| Wage / Income Gap ($) | 749 | 100.00¢ per $1 |
| Gini / Inequality Index | 749 | 0.41 |
Earnings by Sex in Pinnacle
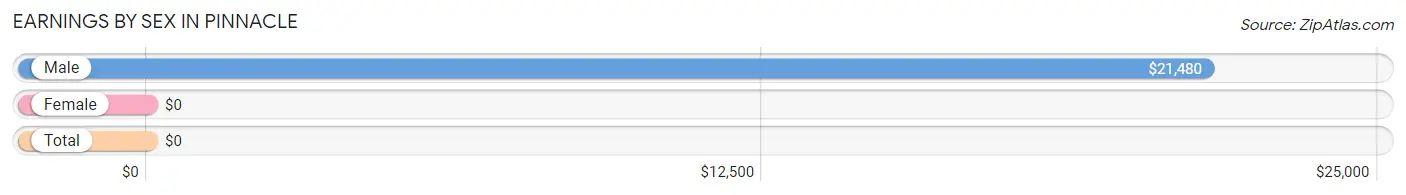
| Sex | Number | Average Earnings |
| Male | 129 (44.3%) | $21,480 |
| Female | 162 (55.7%) | $0 |
| Total | 291 (100.0%) | $0 |
Earnings by Sex by Income Bracket in Pinnacle
The most common earnings brackets in Pinnacle are $5,000 to $7,499 for men (42 | 32.6%) and $2,499 or less for women (44 | 27.2%).
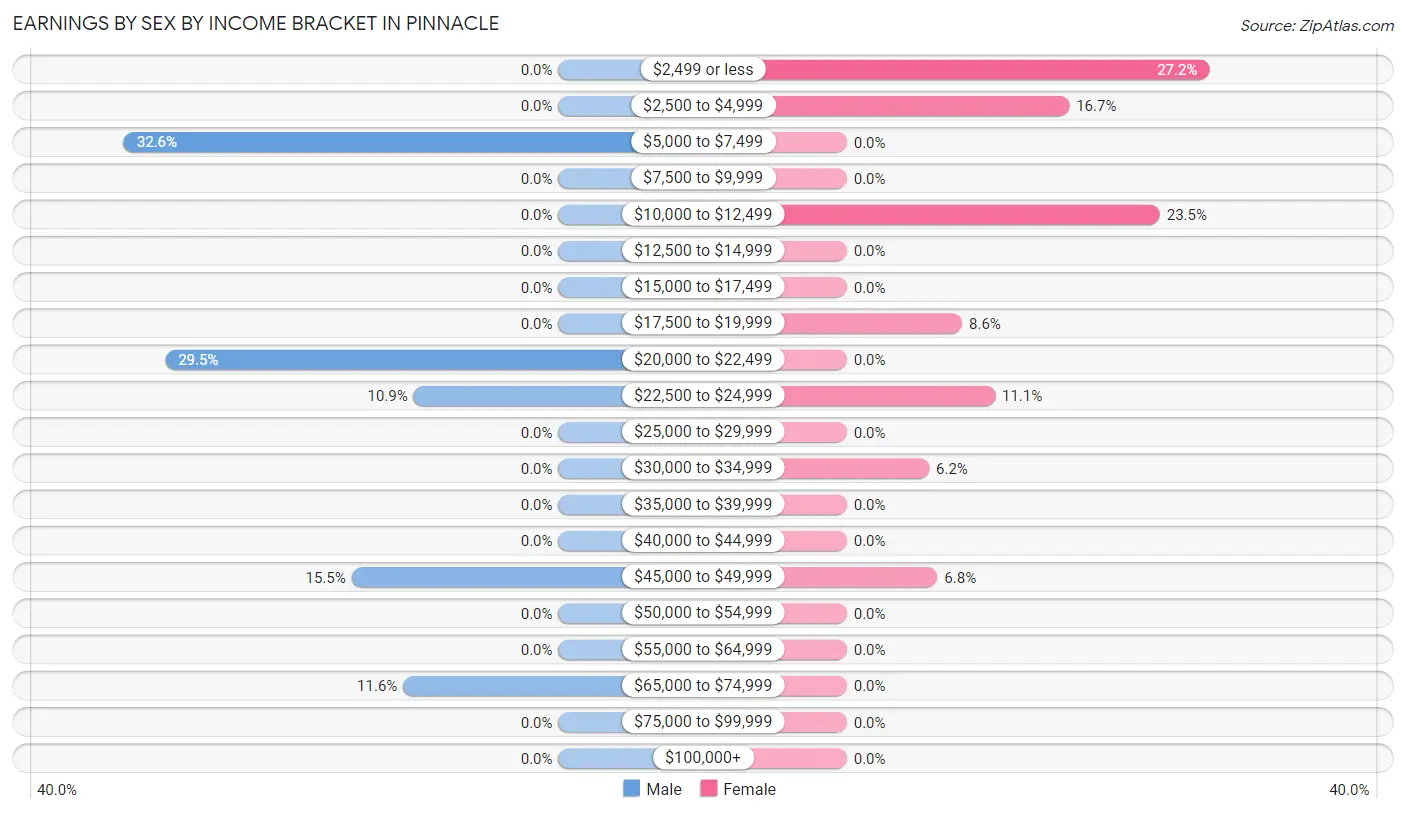
| Income | Male | Female |
| $2,499 or less | 0 (0.0%) | 44 (27.2%) |
| $2,500 to $4,999 | 0 (0.0%) | 27 (16.7%) |
| $5,000 to $7,499 | 42 (32.6%) | 0 (0.0%) |
| $7,500 to $9,999 | 0 (0.0%) | 0 (0.0%) |
| $10,000 to $12,499 | 0 (0.0%) | 38 (23.5%) |
| $12,500 to $14,999 | 0 (0.0%) | 0 (0.0%) |
| $15,000 to $17,499 | 0 (0.0%) | 0 (0.0%) |
| $17,500 to $19,999 | 0 (0.0%) | 14 (8.6%) |
| $20,000 to $22,499 | 38 (29.5%) | 0 (0.0%) |
| $22,500 to $24,999 | 14 (10.8%) | 18 (11.1%) |
| $25,000 to $29,999 | 0 (0.0%) | 0 (0.0%) |
| $30,000 to $34,999 | 0 (0.0%) | 10 (6.2%) |
| $35,000 to $39,999 | 0 (0.0%) | 0 (0.0%) |
| $40,000 to $44,999 | 0 (0.0%) | 0 (0.0%) |
| $45,000 to $49,999 | 20 (15.5%) | 11 (6.8%) |
| $50,000 to $54,999 | 0 (0.0%) | 0 (0.0%) |
| $55,000 to $64,999 | 0 (0.0%) | 0 (0.0%) |
| $65,000 to $74,999 | 15 (11.6%) | 0 (0.0%) |
| $75,000 to $99,999 | 0 (0.0%) | 0 (0.0%) |
| $100,000+ | 0 (0.0%) | 0 (0.0%) |
| Total | 129 (100.0%) | 162 (100.0%) |
Earnings by Sex by Educational Attainment in Pinnacle
| Educational Attainment | Male Income | Female Income |
| Less than High School | - | - |
| High School Diploma | - | - |
| College or Associate's Degree | - | - |
| Bachelor's Degree | - | - |
| Graduate Degree | - | - |
| Total | - | - |
Family Income in Pinnacle
Family Income Brackets in Pinnacle
According to the Pinnacle family income data, there are 76 families falling into the $50,000 to $74,999 income range, which is the most common income bracket and makes up 47.5% of all families.
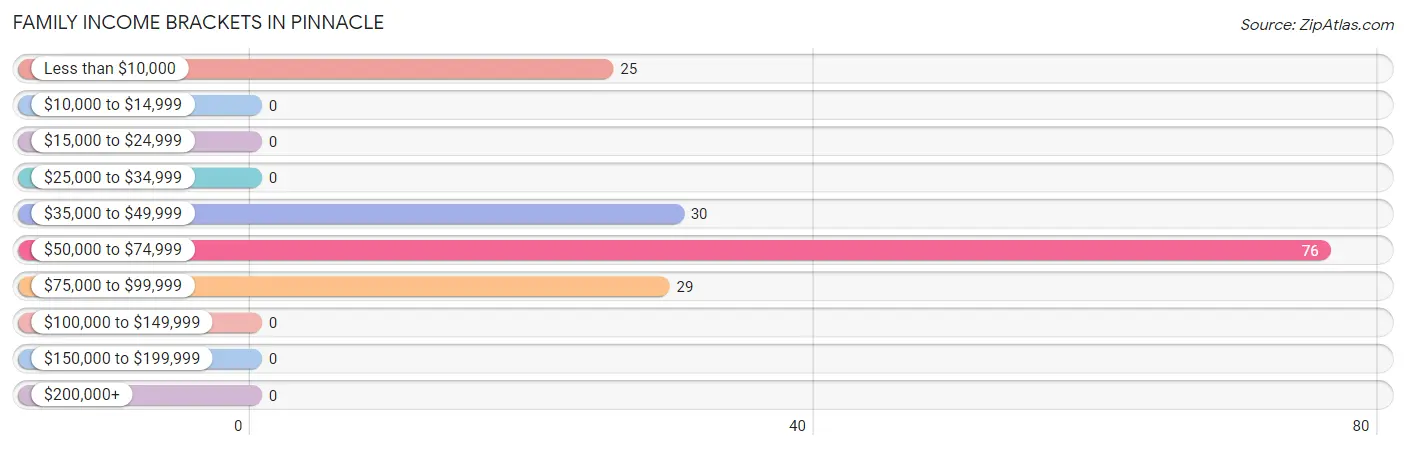
| Income Bracket | # Families | % Families |
| Less than $10,000 | 25 | 15.6% |
| $10,000 to $14,999 | 0 | 0.0% |
| $15,000 to $24,999 | 0 | 0.0% |
| $25,000 to $34,999 | 0 | 0.0% |
| $35,000 to $49,999 | 30 | 18.8% |
| $50,000 to $74,999 | 76 | 47.5% |
| $75,000 to $99,999 | 29 | 18.1% |
| $100,000 to $149,999 | 0 | 0.0% |
| $150,000 to $199,999 | 0 | 0.0% |
| $200,000+ | 0 | 0.0% |
Family Income by Famaliy Size in Pinnacle
2-person families (82 | 51.2%) account for the highest median family income in Pinnacle with $55,724 per family, while 2-person families (82 | 51.2%) have the highest median income of $27,862 per family member.
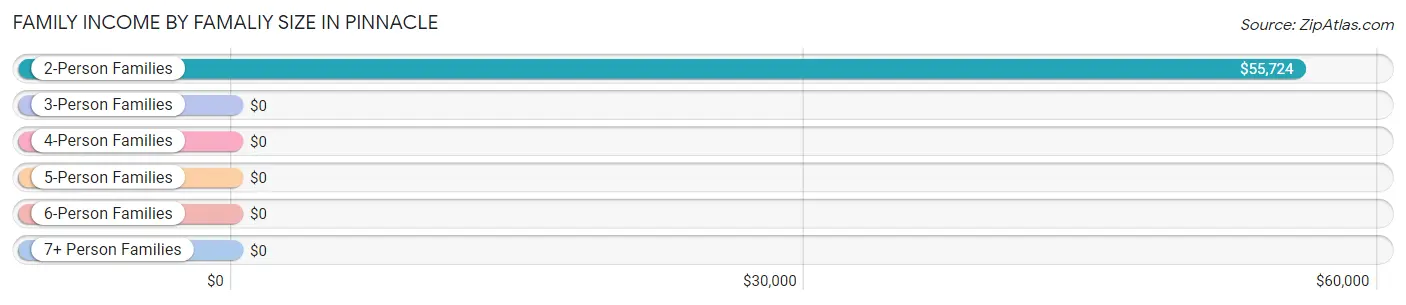
| Income Bracket | # Families | Median Income |
| 2-Person Families | 82 (51.2%) | $55,724 |
| 3-Person Families | 33 (20.6%) | $0 |
| 4-Person Families | 25 (15.6%) | $0 |
| 5-Person Families | 0 (0.0%) | $0 |
| 6-Person Families | 20 (12.5%) | $0 |
| 7+ Person Families | 0 (0.0%) | $0 |
| Total | 160 (100.0%) | $56,078 |
Family Income by Number of Earners in Pinnacle
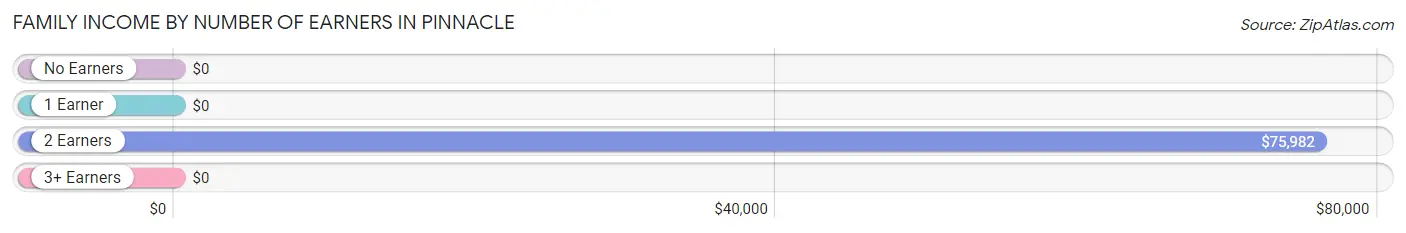
| Number of Earners | # Families | Median Income |
| No Earners | 30 (18.8%) | $0 |
| 1 Earner | 63 (39.4%) | $0 |
| 2 Earners | 47 (29.4%) | $75,982 |
| 3+ Earners | 20 (12.5%) | $0 |
| Total | 160 (100.0%) | $56,078 |
Household Income in Pinnacle
Household Income Brackets in Pinnacle
With 76 households falling in the category, the $50,000 to $74,999 income range is the most frequent in Pinnacle, accounting for 25.7% of all households.
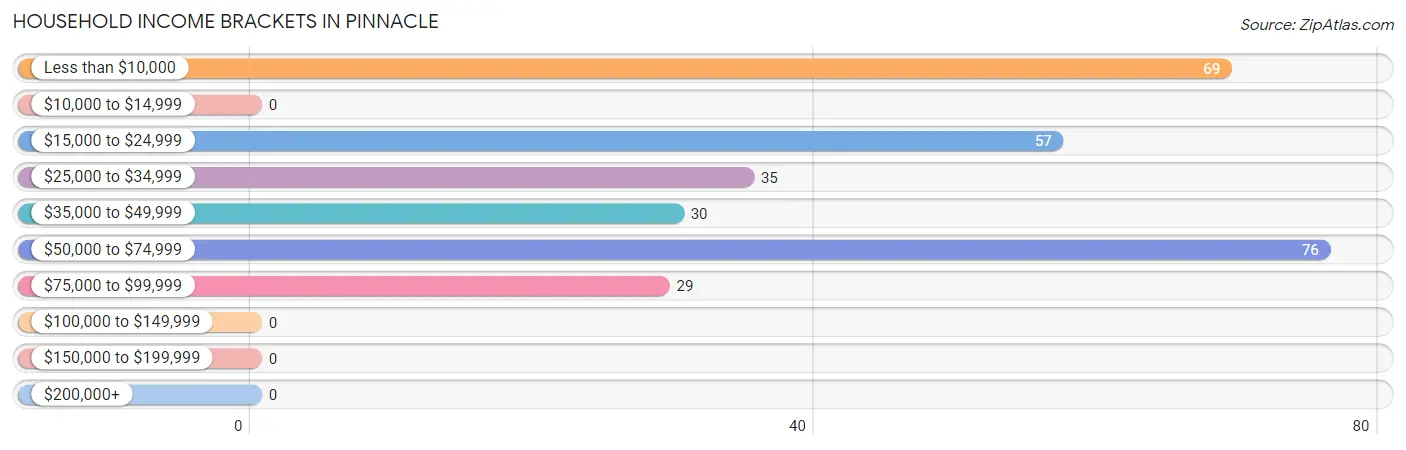
| Income Bracket | # Households | % Households |
| Less than $10,000 | 69 | 23.3% |
| $10,000 to $14,999 | 0 | 0.0% |
| $15,000 to $24,999 | 57 | 19.3% |
| $25,000 to $34,999 | 35 | 11.8% |
| $35,000 to $49,999 | 30 | 10.1% |
| $50,000 to $74,999 | 76 | 25.7% |
| $75,000 to $99,999 | 29 | 9.8% |
| $100,000 to $149,999 | 0 | 0.0% |
| $150,000 to $199,999 | 0 | 0.0% |
| $200,000+ | 0 | 0.0% |
Household Income by Householder Age in Pinnacle
The median household income in Pinnacle is $32,200, with the highest median household income of $55,263 found in the 65+ years age bracket for the primary householder. A total of 68 households (23.0%) fall into this category. Meanwhile, the 15 to 24 years age bracket for the primary householder has the lowest median household income of $0, with 20 households (6.8%) in this group.
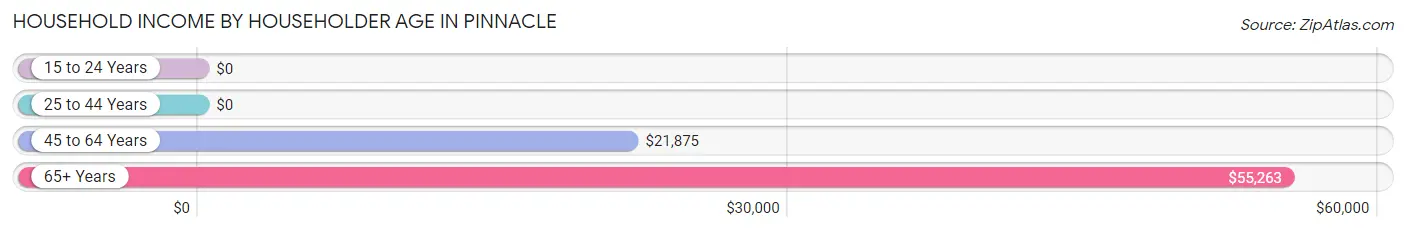
| Income Bracket | # Households | Median Income |
| 15 to 24 Years | 20 (6.8%) | $0 |
| 25 to 44 Years | 25 (8.5%) | $0 |
| 45 to 64 Years | 183 (61.8%) | $21,875 |
| 65+ Years | 68 (23.0%) | $55,263 |
| Total | 296 (100.0%) | $32,200 |
Poverty in Pinnacle
Income Below Poverty by Sex and Age in Pinnacle
With 16.8% poverty level for males and 38.2% for females among the residents of Pinnacle, 12 to 14 year old males and under 5 year old females are the most vulnerable to poverty, with 34 males (100.0%) and 34 females (100.0%) in their respective age groups living below the poverty level.
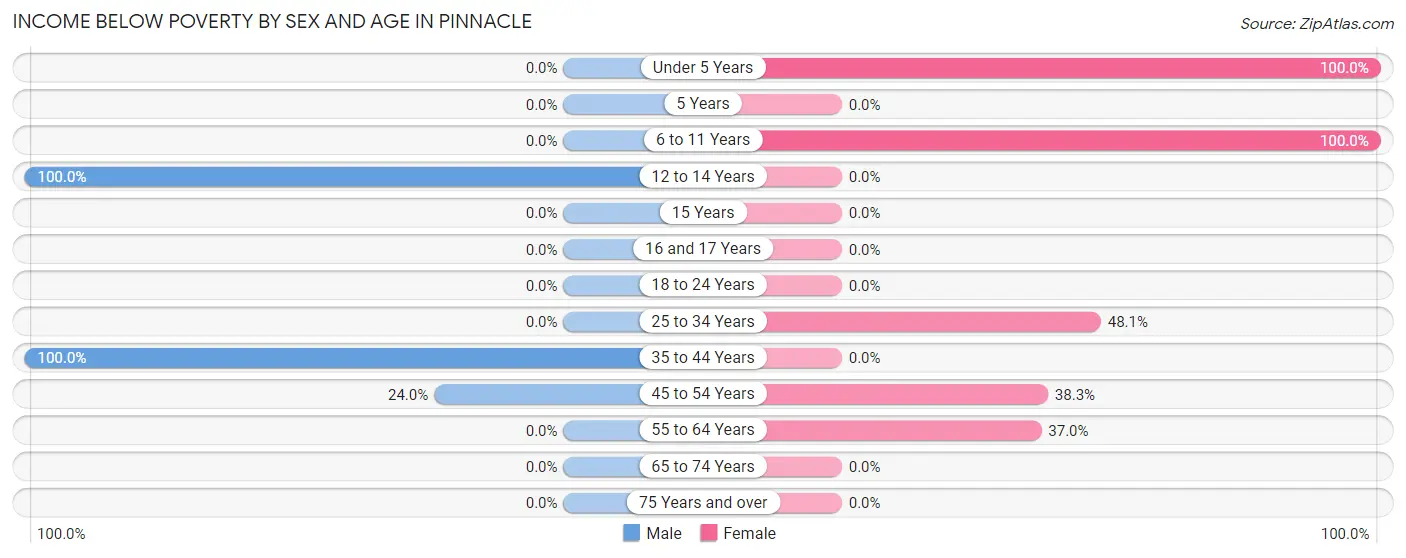
| Age Bracket | Male | Female |
| Under 5 Years | 0 (0.0%) | 34 (100.0%) |
| 5 Years | 0 (0.0%) | 0 (0.0%) |
| 6 to 11 Years | 0 (0.0%) | 28 (100.0%) |
| 12 to 14 Years | 34 (100.0%) | 0 (0.0%) |
| 15 Years | 0 (0.0%) | 0 (0.0%) |
| 16 and 17 Years | 0 (0.0%) | 0 (0.0%) |
| 18 to 24 Years | 0 (0.0%) | 0 (0.0%) |
| 25 to 34 Years | 0 (0.0%) | 25 (48.1%) |
| 35 to 44 Years | 9 (100.0%) | 0 (0.0%) |
| 45 to 54 Years | 12 (24.0%) | 44 (38.3%) |
| 55 to 64 Years | 0 (0.0%) | 30 (37.0%) |
| 65 to 74 Years | 0 (0.0%) | 0 (0.0%) |
| 75 Years and over | 0 (0.0%) | 0 (0.0%) |
| Total | 55 (16.8%) | 161 (38.2%) |
Income Above Poverty by Sex and Age in Pinnacle
According to the poverty statistics in Pinnacle, males aged under 5 years and females aged 16 and 17 years are the age groups that are most secure financially, with 100.0% of males and 100.0% of females in these age groups living above the poverty line.
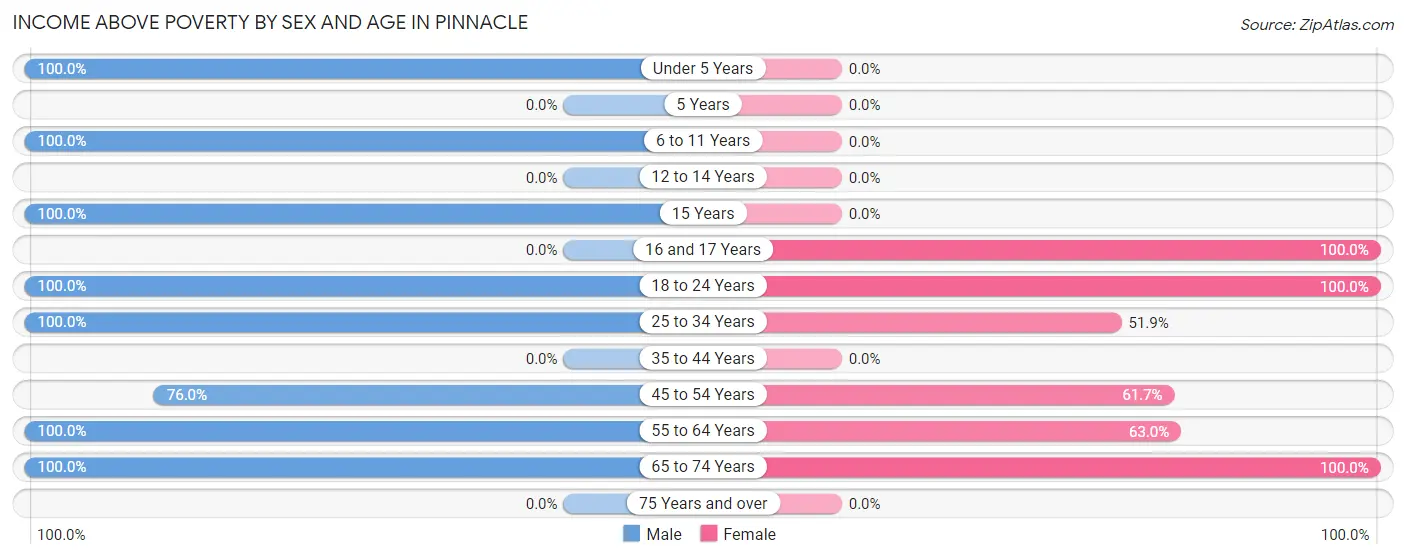
| Age Bracket | Male | Female |
| Under 5 Years | 37 (100.0%) | 0 (0.0%) |
| 5 Years | 0 (0.0%) | 0 (0.0%) |
| 6 to 11 Years | 21 (100.0%) | 0 (0.0%) |
| 12 to 14 Years | 0 (0.0%) | 0 (0.0%) |
| 15 Years | 38 (100.0%) | 0 (0.0%) |
| 16 and 17 Years | 0 (0.0%) | 33 (100.0%) |
| 18 to 24 Years | 20 (100.0%) | 26 (100.0%) |
| 25 to 34 Years | 17 (100.0%) | 27 (51.9%) |
| 35 to 44 Years | 0 (0.0%) | 0 (0.0%) |
| 45 to 54 Years | 38 (76.0%) | 71 (61.7%) |
| 55 to 64 Years | 71 (100.0%) | 51 (63.0%) |
| 65 to 74 Years | 30 (100.0%) | 53 (100.0%) |
| 75 Years and over | 0 (0.0%) | 0 (0.0%) |
| Total | 272 (83.2%) | 261 (61.9%) |
Income Below Poverty Among Married-Couple Families in Pinnacle
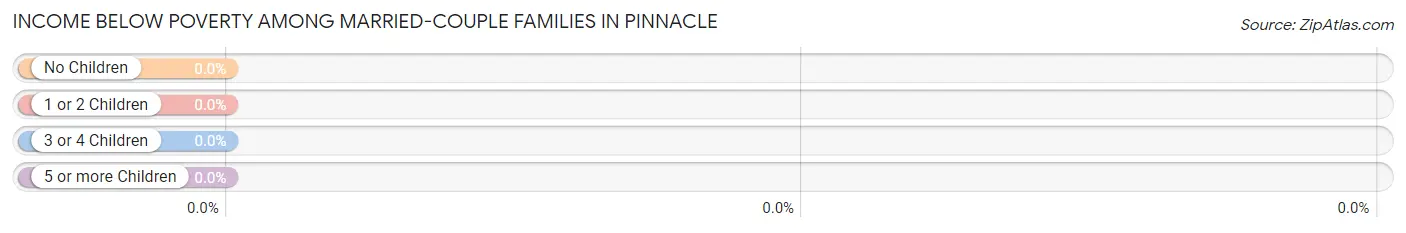
| Children | Above Poverty | Below Poverty |
| No Children | 62 (100.0%) | 0 (0.0%) |
| 1 or 2 Children | 15 (100.0%) | 0 (0.0%) |
| 3 or 4 Children | 20 (100.0%) | 0 (0.0%) |
| 5 or more Children | 0 (0.0%) | 0 (0.0%) |
| Total | 97 (100.0%) | 0 (0.0%) |
Income Below Poverty Among Single-Parent Households in Pinnacle
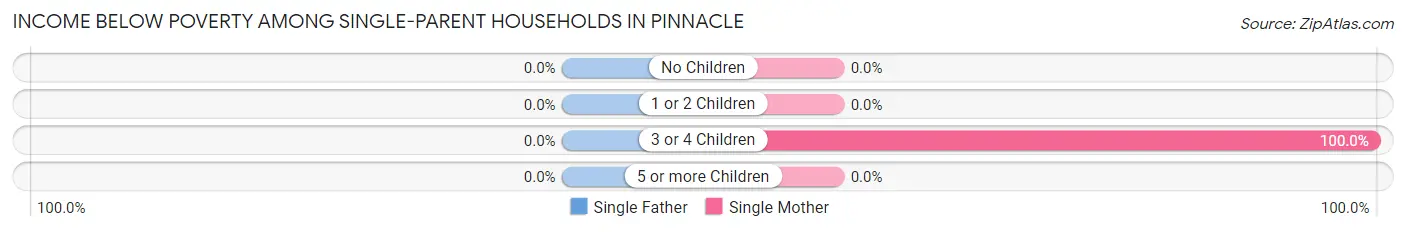
| Children | Single Father | Single Mother |
| No Children | 0 (0.0%) | 0 (0.0%) |
| 1 or 2 Children | 0 (0.0%) | 0 (0.0%) |
| 3 or 4 Children | 0 (0.0%) | 25 (100.0%) |
| 5 or more Children | 0 (0.0%) | 0 (0.0%) |
| Total | 0 (0.0%) | 25 (39.7%) |
Income Below Poverty Among Married-Couple vs Single-Parent Households in Pinnacle
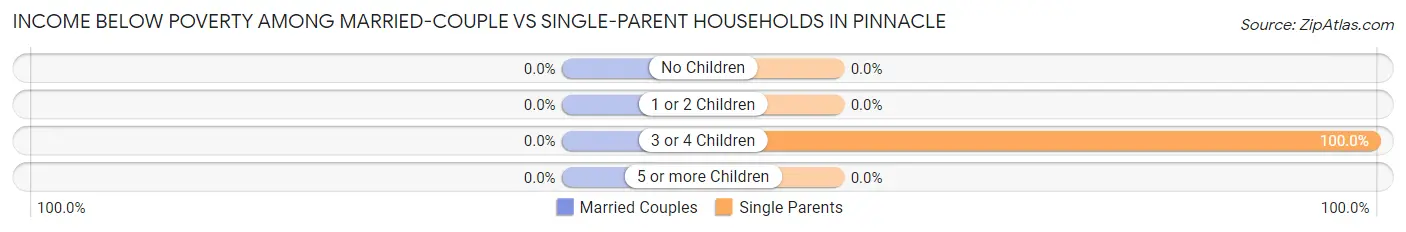
| Children | Married-Couple Families | Single-Parent Households |
| No Children | 0 (0.0%) | 0 (0.0%) |
| 1 or 2 Children | 0 (0.0%) | 0 (0.0%) |
| 3 or 4 Children | 0 (0.0%) | 25 (100.0%) |
| 5 or more Children | 0 (0.0%) | 0 (0.0%) |
| Total | 0 (0.0%) | 25 (39.7%) |
Race in Pinnacle
The most populous races in Pinnacle are White / Caucasian (527 | 70.4%), Black / African American (132 | 17.6%), and Two or more Races (90 | 12.0%).
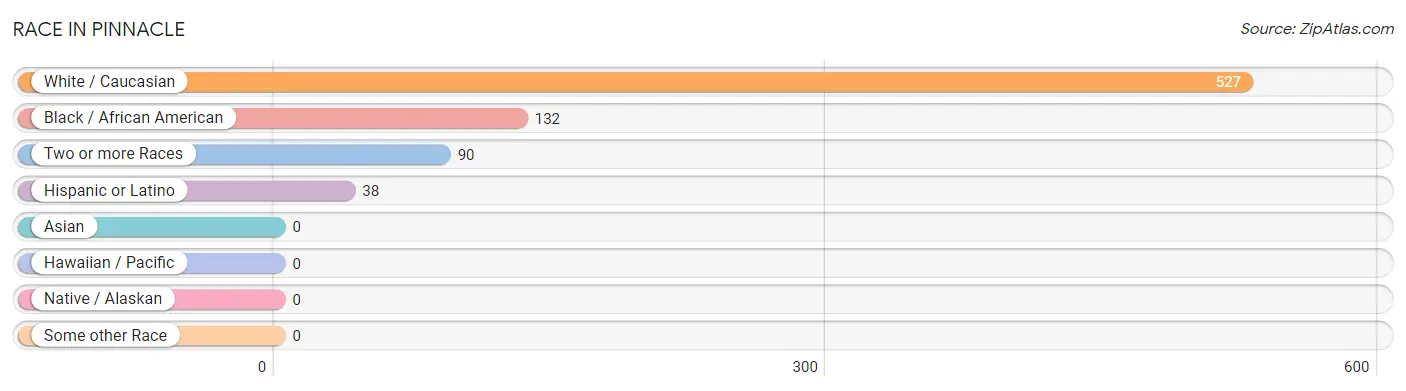
| Race | # Population | % Population |
| Asian | 0 | 0.0% |
| Black / African American | 132 | 17.6% |
| Hawaiian / Pacific | 0 | 0.0% |
| Hispanic or Latino | 38 | 5.1% |
| Native / Alaskan | 0 | 0.0% |
| White / Caucasian | 527 | 70.4% |
| Two or more Races | 90 | 12.0% |
| Some other Race | 0 | 0.0% |
| Total | 749 | 100.0% |
Ancestry in Pinnacle
The most populous ancestries reported in Pinnacle are American (220 | 29.4%), English (136 | 18.2%), German (80 | 10.7%), Mexican (38 | 5.1%), and Scottish (37 | 4.9%), together accounting for 68.2% of all Pinnacle residents.
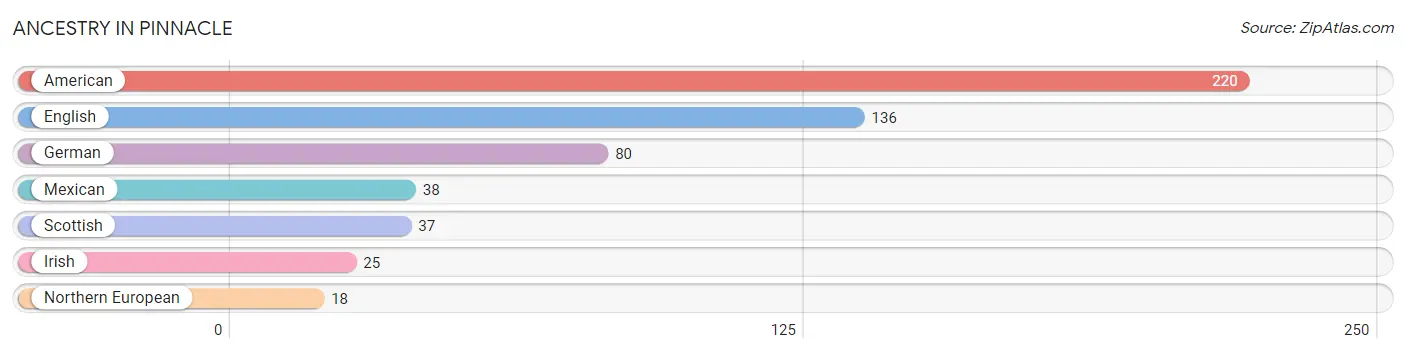
| Ancestry | # Population | % Population |
| American | 220 | 29.4% |
| English | 136 | 18.2% |
| German | 80 | 10.7% |
| Irish | 25 | 3.3% |
| Mexican | 38 | 5.1% |
| Northern European | 18 | 2.4% |
| Scottish | 37 | 4.9% | View All 7 Rows |
Immigrants in Pinnacle
The most numerous immigrant groups reported in Pinnacle came from Central America (38 | 5.1%), Latin America (38 | 5.1%), and Mexico (38 | 5.1%), together accounting for 15.2% of all Pinnacle residents.
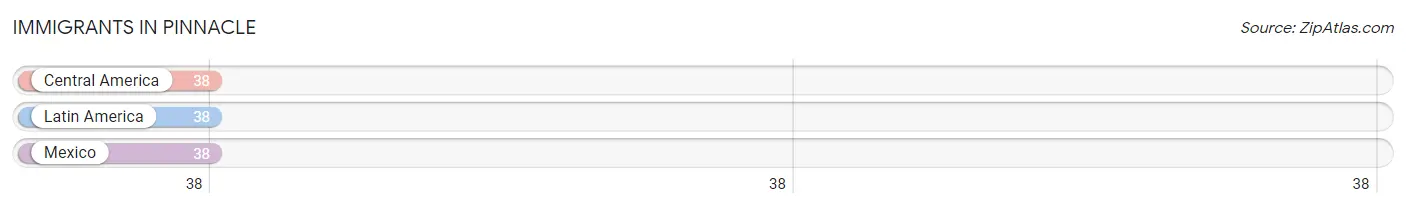
| Immigration Origin | # Population | % Population |
| Central America | 38 | 5.1% |
| Latin America | 38 | 5.1% |
| Mexico | 38 | 5.1% | View All 3 Rows |
Sex and Age in Pinnacle
Sex and Age in Pinnacle
The most populous age groups in Pinnacle are 45 to 49 Years (42 | 12.8%) for men and 50 to 54 Years (115 | 27.3%) for women.
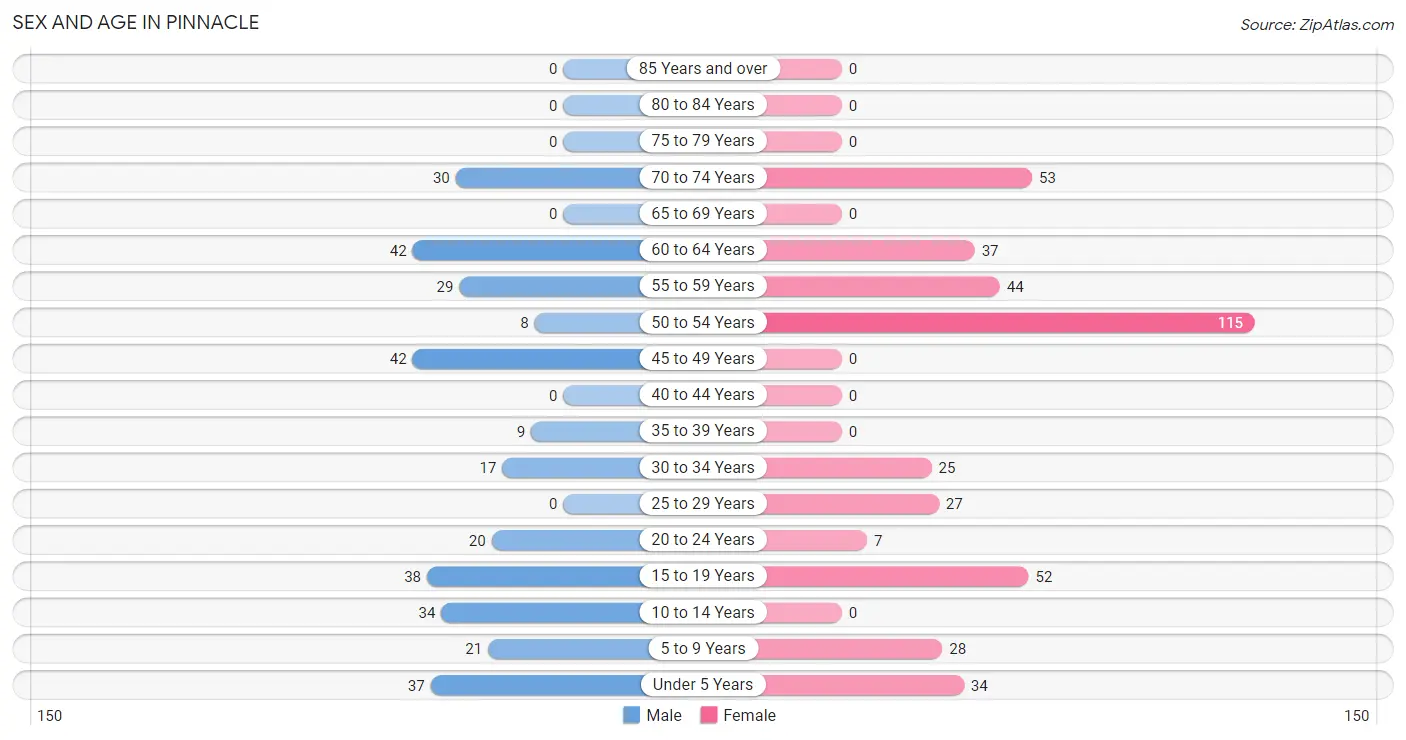
| Age Bracket | Male | Female |
| Under 5 Years | 37 (11.3%) | 34 (8.1%) |
| 5 to 9 Years | 21 (6.4%) | 28 (6.6%) |
| 10 to 14 Years | 34 (10.4%) | 0 (0.0%) |
| 15 to 19 Years | 38 (11.6%) | 52 (12.3%) |
| 20 to 24 Years | 20 (6.1%) | 7 (1.7%) |
| 25 to 29 Years | 0 (0.0%) | 27 (6.4%) |
| 30 to 34 Years | 17 (5.2%) | 25 (5.9%) |
| 35 to 39 Years | 9 (2.8%) | 0 (0.0%) |
| 40 to 44 Years | 0 (0.0%) | 0 (0.0%) |
| 45 to 49 Years | 42 (12.8%) | 0 (0.0%) |
| 50 to 54 Years | 8 (2.5%) | 115 (27.3%) |
| 55 to 59 Years | 29 (8.9%) | 44 (10.4%) |
| 60 to 64 Years | 42 (12.8%) | 37 (8.8%) |
| 65 to 69 Years | 0 (0.0%) | 0 (0.0%) |
| 70 to 74 Years | 30 (9.2%) | 53 (12.6%) |
| 75 to 79 Years | 0 (0.0%) | 0 (0.0%) |
| 80 to 84 Years | 0 (0.0%) | 0 (0.0%) |
| 85 Years and over | 0 (0.0%) | 0 (0.0%) |
| Total | 327 (100.0%) | 422 (100.0%) |
Families and Households in Pinnacle
Median Family Size in Pinnacle
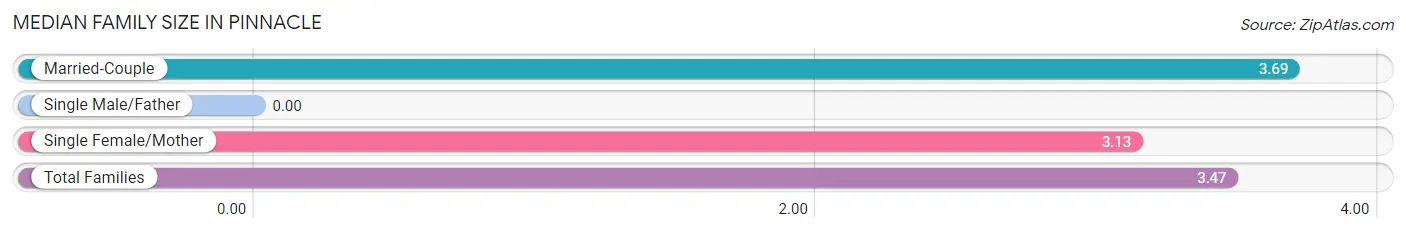
| Family Type | # Families | Family Size |
| Married-Couple | 97 (60.6%) | 3.69 |
| Single Male/Father | 0 (0.0%) | - |
| Single Female/Mother | 63 (39.4%) | 3.13 |
| Total Families | 160 (100.0%) | 3.47 |
Median Household Size in Pinnacle
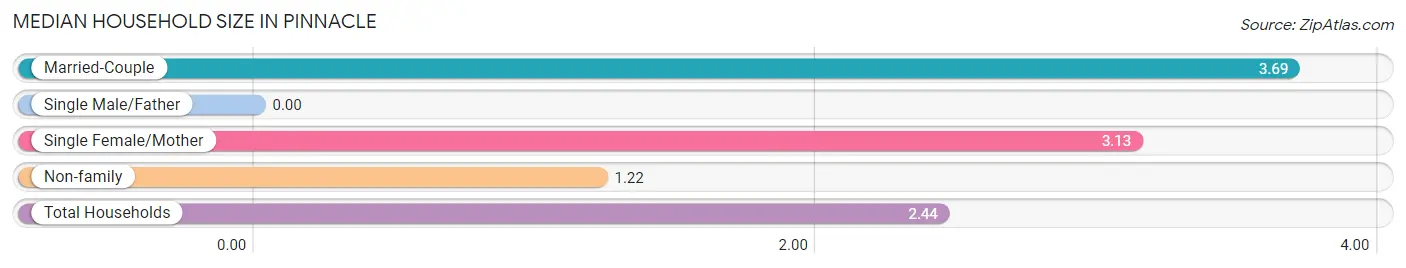
| Household Type | # Households | Household Size |
| Married-Couple | 97 (32.8%) | 3.69 |
| Single Male/Father | 0 (0.0%) | - |
| Single Female/Mother | 63 (21.3%) | 3.13 |
| Non-family | 136 (46.0%) | 1.22 |
| Total Households | 296 (100.0%) | 2.44 |
Household Size by Marriage Status in Pinnacle
Out of a total of 296 households in Pinnacle, 160 (54.0%) are family households, while 136 (46.0%) are nonfamily households. The most numerous type of family households are 2-person households, comprising 82, and the most common type of nonfamily households are 1-person households, comprising 111.
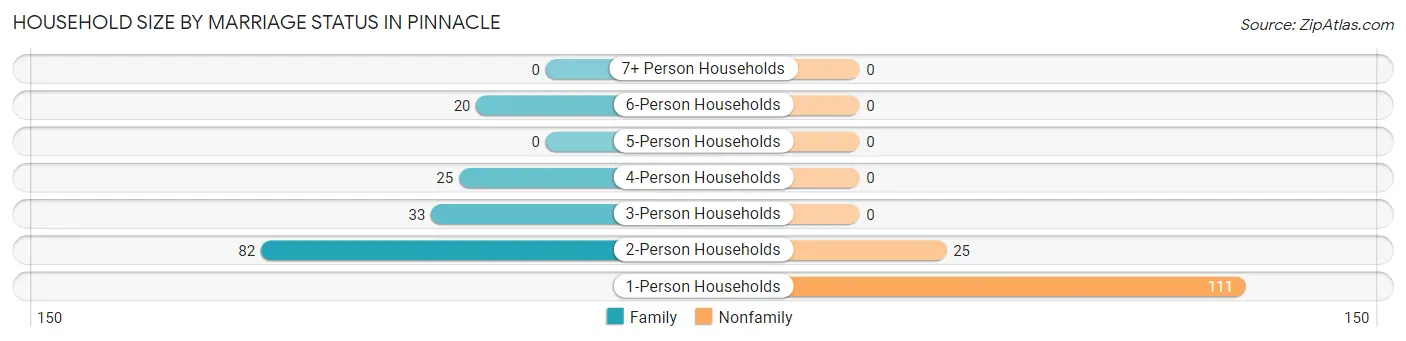
| Household Size | Family Households | Nonfamily Households |
| 1-Person Households | - | 111 (37.5%) |
| 2-Person Households | 82 (27.7%) | 25 (8.5%) |
| 3-Person Households | 33 (11.2%) | 0 (0.0%) |
| 4-Person Households | 25 (8.5%) | 0 (0.0%) |
| 5-Person Households | 0 (0.0%) | 0 (0.0%) |
| 6-Person Households | 20 (6.8%) | 0 (0.0%) |
| 7+ Person Households | 0 (0.0%) | 0 (0.0%) |
| Total | 160 (54.0%) | 136 (46.0%) |
Female Fertility in Pinnacle
Fertility by Age in Pinnacle
| Age Bracket | Women with Births | Births / 1,000 Women |
| 15 to 19 years | 0 (0.0%) | 0.0 |
| 20 to 34 years | 0 (0.0%) | 0.0 |
| 35 to 50 years | 0 (0.0%) | 0.0 |
| Total | 0 (0.0%) | 0.0 |
Fertility by Age by Marriage Status in Pinnacle
| Age Bracket | Married | Unmarried |
| 15 to 19 years | 0 (0.0%) | 0 (0.0%) |
| 20 to 34 years | 0 (0.0%) | 0 (0.0%) |
| 35 to 50 years | 0 (0.0%) | 0 (0.0%) |
| Total | 0 (0.0%) | 0 (0.0%) |
Fertility by Education in Pinnacle
| Educational Attainment | Women with Births | Births / 1,000 Women |
| Less than High School | 0 (0.0%) | 0.0 |
| High School Diploma | 0 (0.0%) | 0.0 |
| College or Associate's Degree | 0 (0.0%) | 0.0 |
| Bachelor's Degree | 0 (0.0%) | 0.0 |
| Graduate Degree | 0 (0.0%) | 0.0 |
| Total | 0 (0.0%) | 0.0 |
Fertility by Education by Marriage Status in Pinnacle
| Educational Attainment | Married | Unmarried |
| Less than High School | 0 (0.0%) | 0 (0.0%) |
| High School Diploma | 0 (0.0%) | 0 (0.0%) |
| College or Associate's Degree | 0 (0.0%) | 0 (0.0%) |
| Bachelor's Degree | 0 (0.0%) | 0 (0.0%) |
| Graduate Degree | 0 (0.0%) | 0 (0.0%) |
| Total | 0 (0.0%) | 0 (0.0%) |
Employment Characteristics in Pinnacle
Employment by Class of Employer in Pinnacle
Among the 230 employed individuals in Pinnacle, private company employees (162 | 70.4%), not-for-profit organizations (40 | 17.4%), and self-employed (not incorporated) (28 | 12.2%) make up the most common classes of employment.
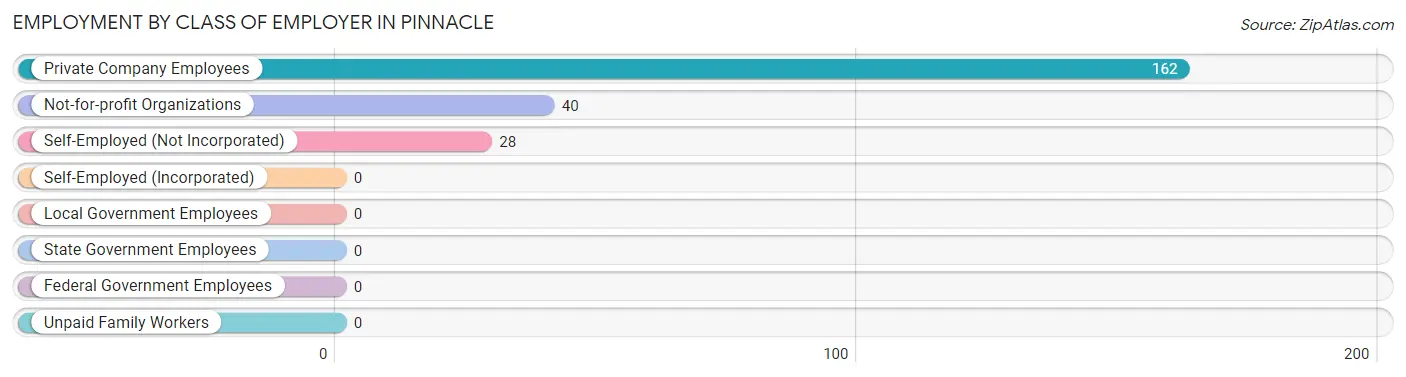
| Employer Class | # Employees | % Employees |
| Private Company Employees | 162 | 70.4% |
| Self-Employed (Incorporated) | 0 | 0.0% |
| Self-Employed (Not Incorporated) | 28 | 12.2% |
| Not-for-profit Organizations | 40 | 17.4% |
| Local Government Employees | 0 | 0.0% |
| State Government Employees | 0 | 0.0% |
| Federal Government Employees | 0 | 0.0% |
| Unpaid Family Workers | 0 | 0.0% |
| Total | 230 | 100.0% |
Employment Status by Age in Pinnacle
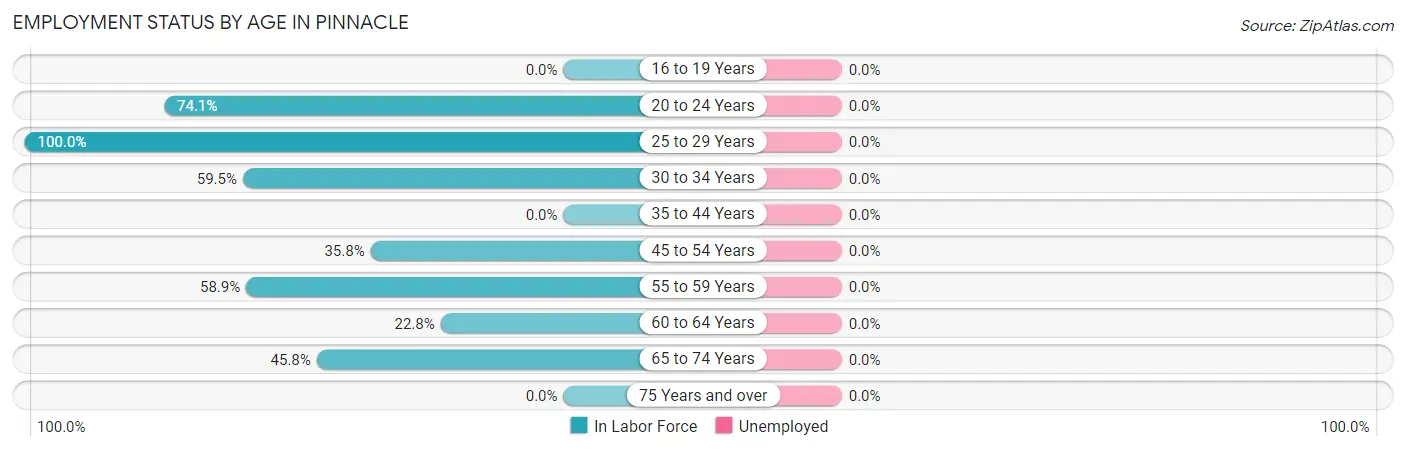
| Age Bracket | In Labor Force | Unemployed |
| 16 to 19 Years | 0 (0.0%) | 0 (0.0%) |
| 20 to 24 Years | 20 (74.1%) | 0 (0.0%) |
| 25 to 29 Years | 27 (100.0%) | 0 (0.0%) |
| 30 to 34 Years | 25 (59.5%) | 0 (0.0%) |
| 35 to 44 Years | 0 (0.0%) | 0 (0.0%) |
| 45 to 54 Years | 59 (35.8%) | 0 (0.0%) |
| 55 to 59 Years | 43 (58.9%) | 0 (0.0%) |
| 60 to 64 Years | 18 (22.8%) | 0 (0.0%) |
| 65 to 74 Years | 38 (45.8%) | 0 (0.0%) |
| 75 Years and over | 0 (0.0%) | 0 (0.0%) |
| Total | 230 (41.3%) | 0 (0.0%) |
Employment Status by Educational Attainment in Pinnacle
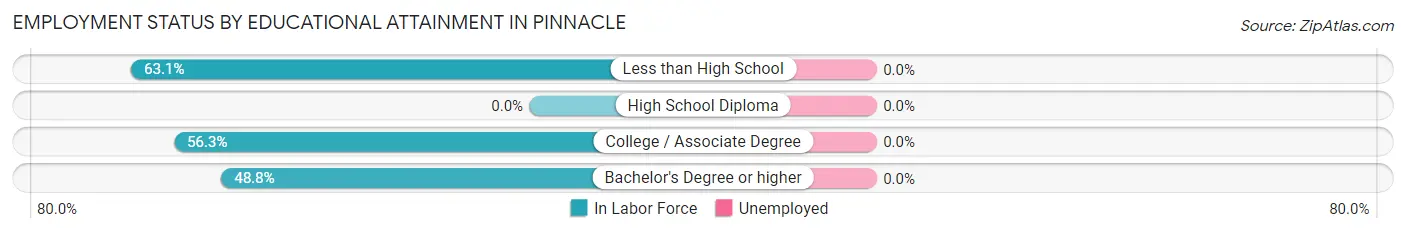
| Educational Attainment | In Labor Force | Unemployed |
| Less than High School | 65 (63.1%) | 0 (0.0%) |
| High School Diploma | 0 (0.0%) | 0 (0.0%) |
| College / Associate Degree | 67 (56.3%) | 0 (0.0%) |
| Bachelor's Degree or higher | 40 (48.8%) | 0 (0.0%) |
| Total | 172 (43.5%) | 0 (0.0%) |
Employment Occupations by Sex in Pinnacle
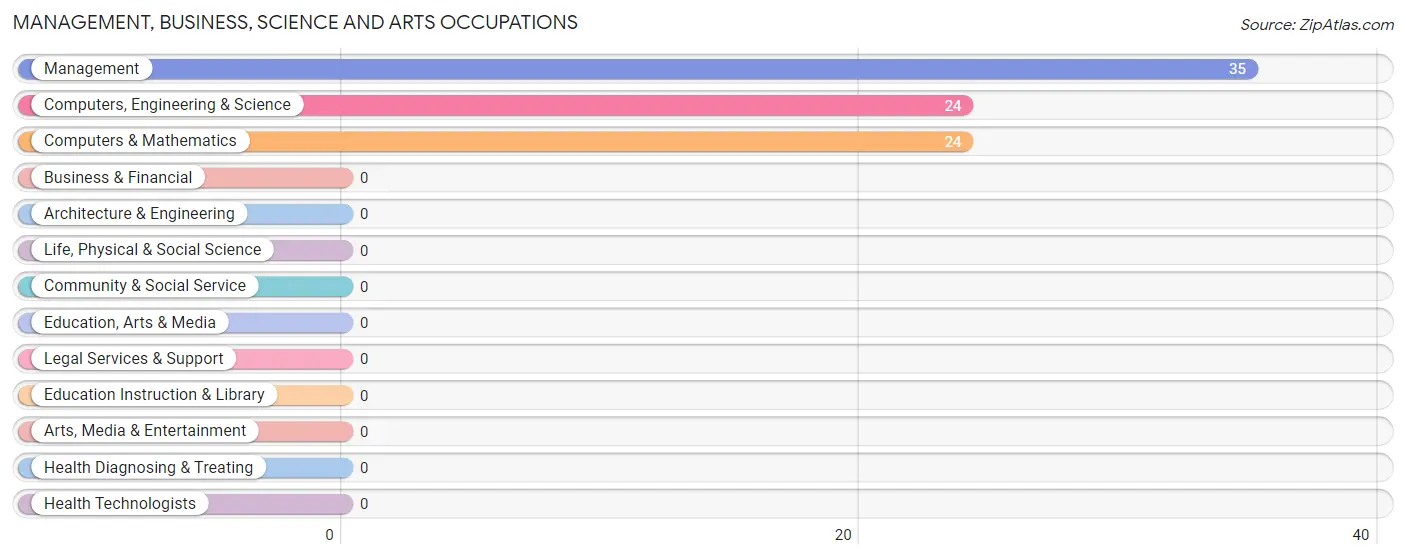
Management, Business, Science and Arts Occupations
The most common Management, Business, Science and Arts occupations in Pinnacle are Management (35 | 15.2%), Computers, Engineering & Science (24 | 10.4%), and Computers & Mathematics (24 | 10.4%).
Management, Business, Science and Arts Occupations by Sex
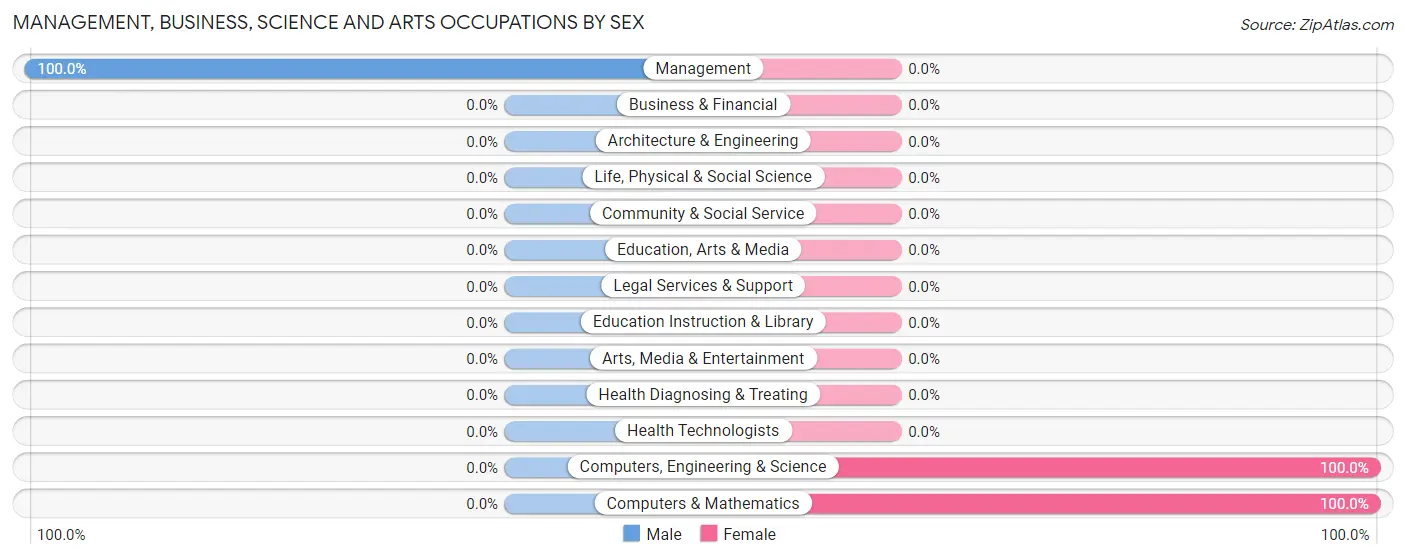
| Occupation | Male | Female |
| Management | 35 (100.0%) | 0 (0.0%) |
| Business & Financial | 0 (0.0%) | 0 (0.0%) |
| Computers, Engineering & Science | 0 (0.0%) | 24 (100.0%) |
| Computers & Mathematics | 0 (0.0%) | 24 (100.0%) |
| Architecture & Engineering | 0 (0.0%) | 0 (0.0%) |
| Life, Physical & Social Science | 0 (0.0%) | 0 (0.0%) |
| Community & Social Service | 0 (0.0%) | 0 (0.0%) |
| Education, Arts & Media | 0 (0.0%) | 0 (0.0%) |
| Legal Services & Support | 0 (0.0%) | 0 (0.0%) |
| Education Instruction & Library | 0 (0.0%) | 0 (0.0%) |
| Arts, Media & Entertainment | 0 (0.0%) | 0 (0.0%) |
| Health Diagnosing & Treating | 0 (0.0%) | 0 (0.0%) |
| Health Technologists | 0 (0.0%) | 0 (0.0%) |
| Total (Category) | 35 (59.3%) | 24 (40.7%) |
| Total (Overall) | 87 (37.8%) | 143 (62.2%) |
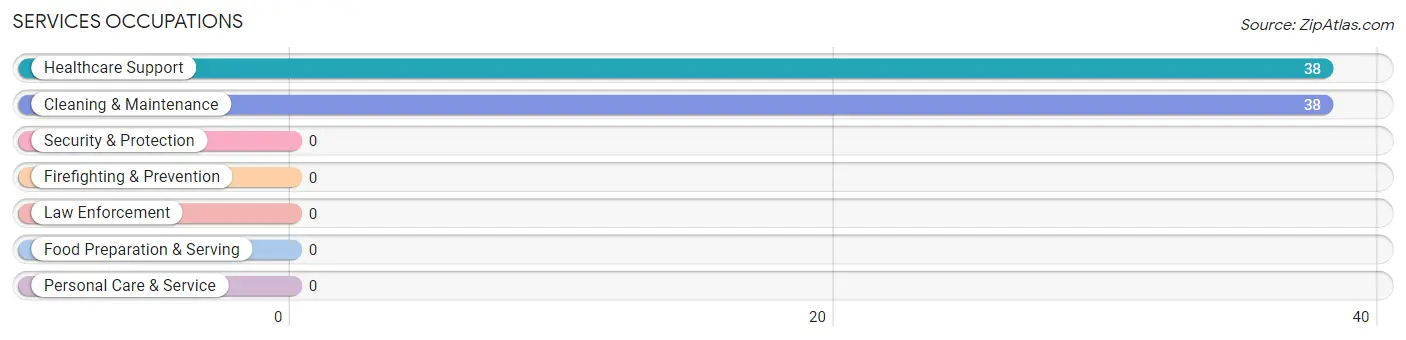
Services Occupations
The most common Services occupations in Pinnacle are Healthcare Support (38 | 16.5%), and Cleaning & Maintenance (38 | 16.5%).
Services Occupations by Sex
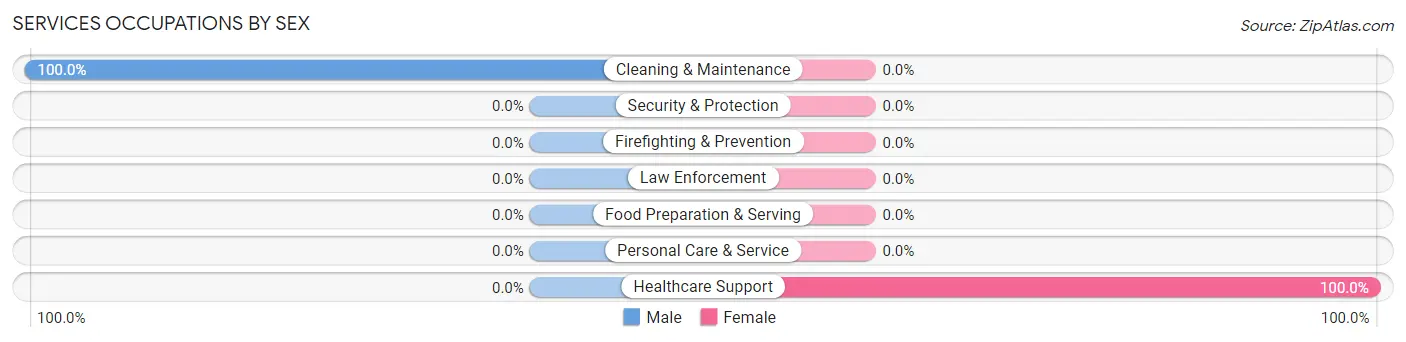
| Occupation | Male | Female |
| Healthcare Support | 0 (0.0%) | 38 (100.0%) |
| Security & Protection | 0 (0.0%) | 0 (0.0%) |
| Firefighting & Prevention | 0 (0.0%) | 0 (0.0%) |
| Law Enforcement | 0 (0.0%) | 0 (0.0%) |
| Food Preparation & Serving | 0 (0.0%) | 0 (0.0%) |
| Cleaning & Maintenance | 38 (100.0%) | 0 (0.0%) |
| Personal Care & Service | 0 (0.0%) | 0 (0.0%) |
| Total (Category) | 38 (50.0%) | 38 (50.0%) |
| Total (Overall) | 87 (37.8%) | 143 (62.2%) |
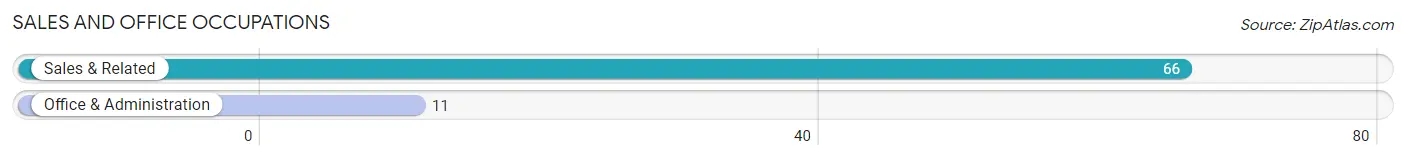
Sales and Office Occupations
The most common Sales and Office occupations in Pinnacle are Sales & Related (66 | 28.7%), and Office & Administration (11 | 4.8%).
Sales and Office Occupations by Sex
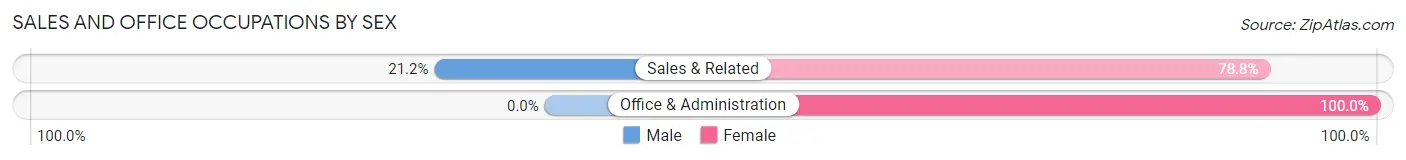
| Occupation | Male | Female |
| Sales & Related | 14 (21.2%) | 52 (78.8%) |
| Office & Administration | 0 (0.0%) | 11 (100.0%) |
| Total (Category) | 14 (18.2%) | 63 (81.8%) |
| Total (Overall) | 87 (37.8%) | 143 (62.2%) |
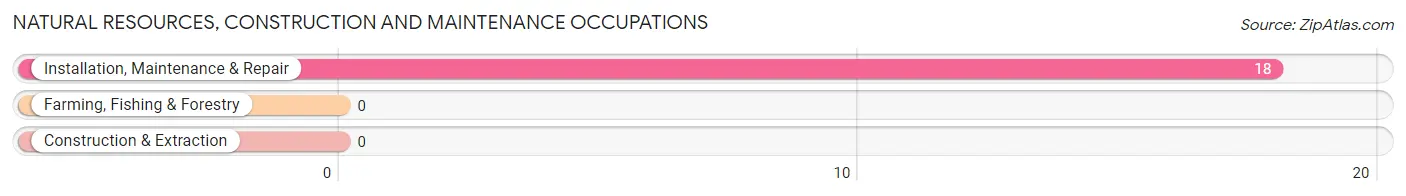
Natural Resources, Construction and Maintenance Occupations
The most common Natural Resources, Construction and Maintenance occupations in Pinnacle are , and Installation, Maintenance & Repair (18 | 7.8%).
Natural Resources, Construction and Maintenance Occupations by Sex
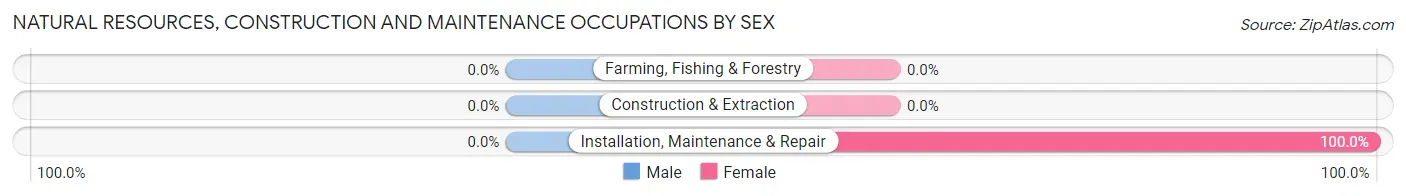
| Occupation | Male | Female |
| Farming, Fishing & Forestry | 0 (0.0%) | 0 (0.0%) |
| Construction & Extraction | 0 (0.0%) | 0 (0.0%) |
| Installation, Maintenance & Repair | 0 (0.0%) | 18 (100.0%) |
| Total (Category) | 0 (0.0%) | 18 (100.0%) |
| Total (Overall) | 87 (37.8%) | 143 (62.2%) |
Production, Transportation and Moving Occupations
Production, Transportation and Moving Occupations by Sex
| Occupation | Male | Female |
| Production | 0 (0.0%) | 0 (0.0%) |
| Transportation | 0 (0.0%) | 0 (0.0%) |
| Material Moving | 0 (0.0%) | 0 (0.0%) |
| Total (Category) | 0 (0.0%) | 0 (0.0%) |
| Total (Overall) | 87 (37.8%) | 143 (62.2%) |
Employment Industries by Sex in Pinnacle
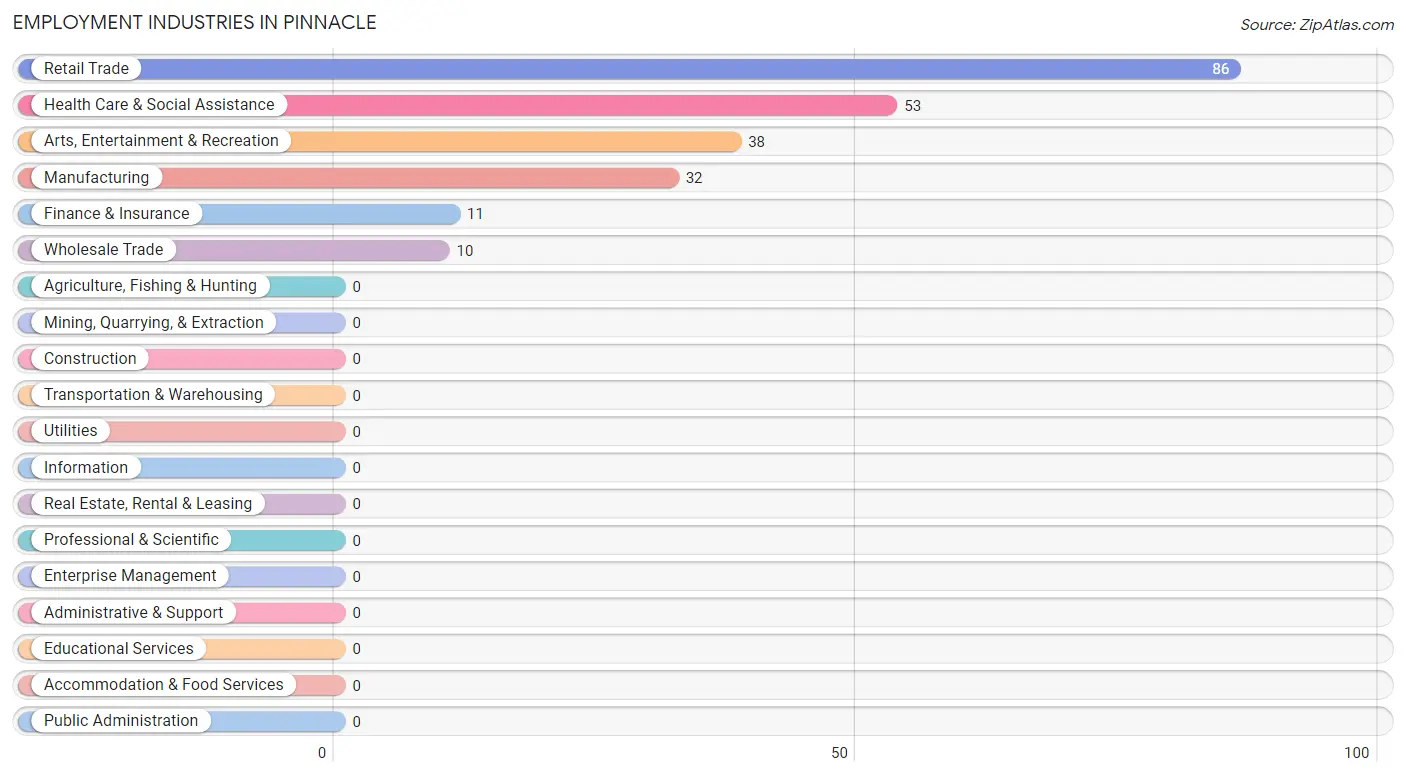
Employment Industries in Pinnacle
The major employment industries in Pinnacle include Retail Trade (86 | 37.4%), Health Care & Social Assistance (53 | 23.0%), Arts, Entertainment & Recreation (38 | 16.5%), Manufacturing (32 | 13.9%), and Finance & Insurance (11 | 4.8%).
Employment Industries by Sex in Pinnacle
The Pinnacle industries that see more men than women are Arts, Entertainment & Recreation (100.0%), Retail Trade (39.5%), and Health Care & Social Assistance (28.3%), whereas the industries that tend to have a higher number of women are Manufacturing (100.0%), Wholesale Trade (100.0%), and Finance & Insurance (100.0%).
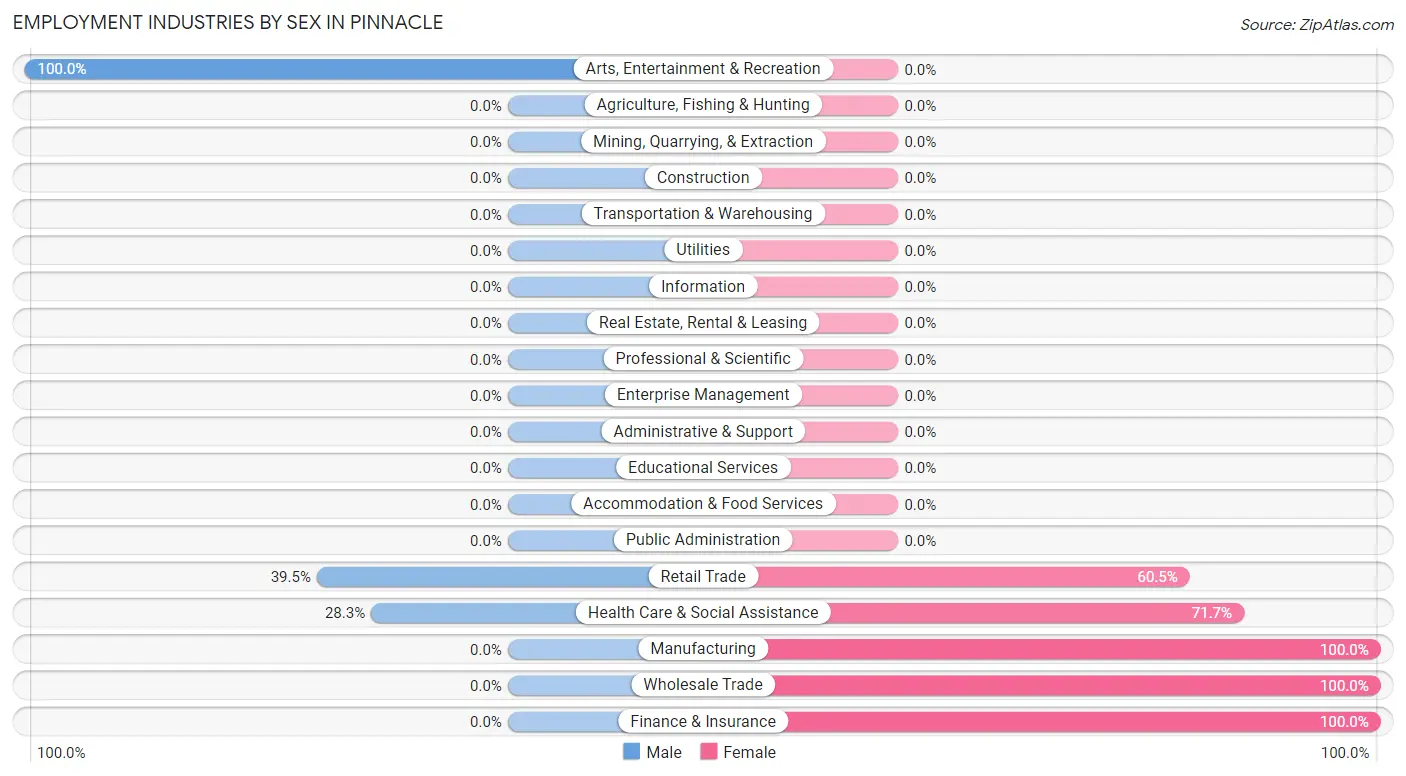
| Industry | Male | Female |
| Agriculture, Fishing & Hunting | 0 (0.0%) | 0 (0.0%) |
| Mining, Quarrying, & Extraction | 0 (0.0%) | 0 (0.0%) |
| Construction | 0 (0.0%) | 0 (0.0%) |
| Manufacturing | 0 (0.0%) | 32 (100.0%) |
| Wholesale Trade | 0 (0.0%) | 10 (100.0%) |
| Retail Trade | 34 (39.5%) | 52 (60.5%) |
| Transportation & Warehousing | 0 (0.0%) | 0 (0.0%) |
| Utilities | 0 (0.0%) | 0 (0.0%) |
| Information | 0 (0.0%) | 0 (0.0%) |
| Finance & Insurance | 0 (0.0%) | 11 (100.0%) |
| Real Estate, Rental & Leasing | 0 (0.0%) | 0 (0.0%) |
| Professional & Scientific | 0 (0.0%) | 0 (0.0%) |
| Enterprise Management | 0 (0.0%) | 0 (0.0%) |
| Administrative & Support | 0 (0.0%) | 0 (0.0%) |
| Educational Services | 0 (0.0%) | 0 (0.0%) |
| Health Care & Social Assistance | 15 (28.3%) | 38 (71.7%) |
| Arts, Entertainment & Recreation | 38 (100.0%) | 0 (0.0%) |
| Accommodation & Food Services | 0 (0.0%) | 0 (0.0%) |
| Public Administration | 0 (0.0%) | 0 (0.0%) |
| Total | 87 (37.8%) | 143 (62.2%) |
Education in Pinnacle
School Enrollment in Pinnacle
The most common levels of schooling among the 188 students in Pinnacle are high school (71 | 37.8%), elementary school (49 | 26.1%), and nursery / preschool (34 | 18.1%).
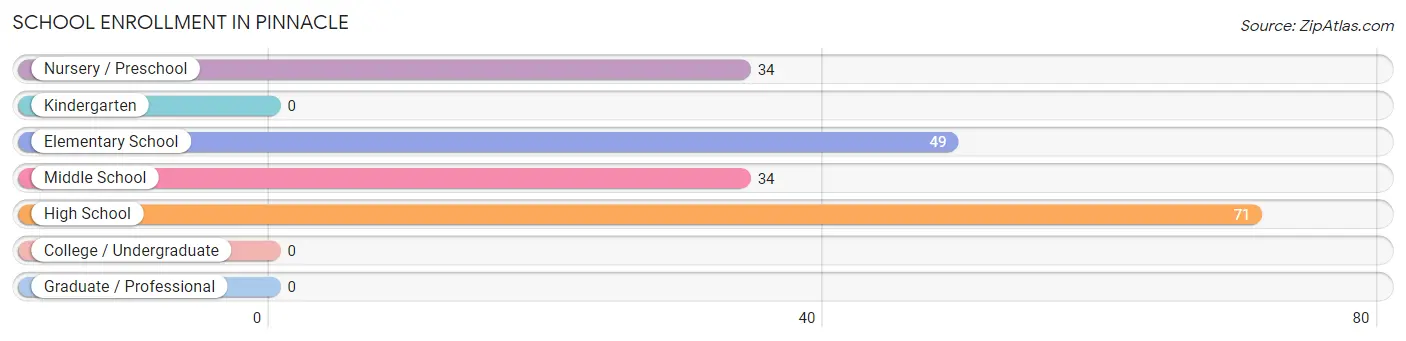
| School Level | # Students | % Students |
| Nursery / Preschool | 34 | 18.1% |
| Kindergarten | 0 | 0.0% |
| Elementary School | 49 | 26.1% |
| Middle School | 34 | 18.1% |
| High School | 71 | 37.8% |
| College / Undergraduate | 0 | 0.0% |
| Graduate / Professional | 0 | 0.0% |
| Total | 188 | 100.0% |
School Enrollment by Age by Funding Source in Pinnacle
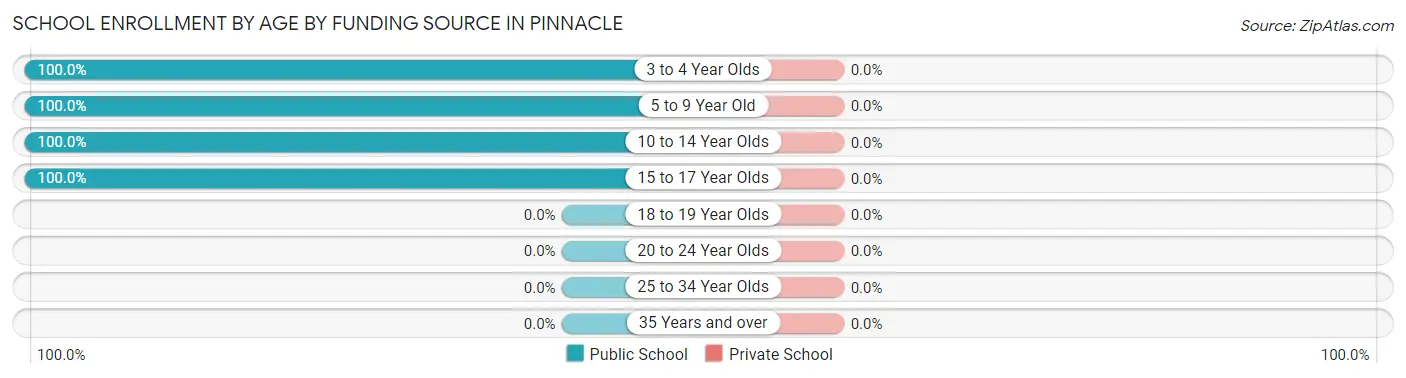
| Age Bracket | Public School | Private School |
| 3 to 4 Year Olds | 34 (100.0%) | 0 (0.0%) |
| 5 to 9 Year Old | 49 (100.0%) | 0 (0.0%) |
| 10 to 14 Year Olds | 34 (100.0%) | 0 (0.0%) |
| 15 to 17 Year Olds | 71 (100.0%) | 0 (0.0%) |
| 18 to 19 Year Olds | 0 (0.0%) | 0 (0.0%) |
| 20 to 24 Year Olds | 0 (0.0%) | 0 (0.0%) |
| 25 to 34 Year Olds | 0 (0.0%) | 0 (0.0%) |
| 35 Years and over | 0 (0.0%) | 0 (0.0%) |
| Total | 188 (100.0%) | 0 (0.0%) |
Educational Attainment by Field of Study in Pinnacle
Communications (42 | 51.2%), bio, nature & agricultural (15 | 18.3%), arts & humanities (14 | 17.1%), and computers & mathematics (11 | 13.4%) are the most common fields of study among 82 individuals in Pinnacle who have obtained a bachelor's degree or higher.
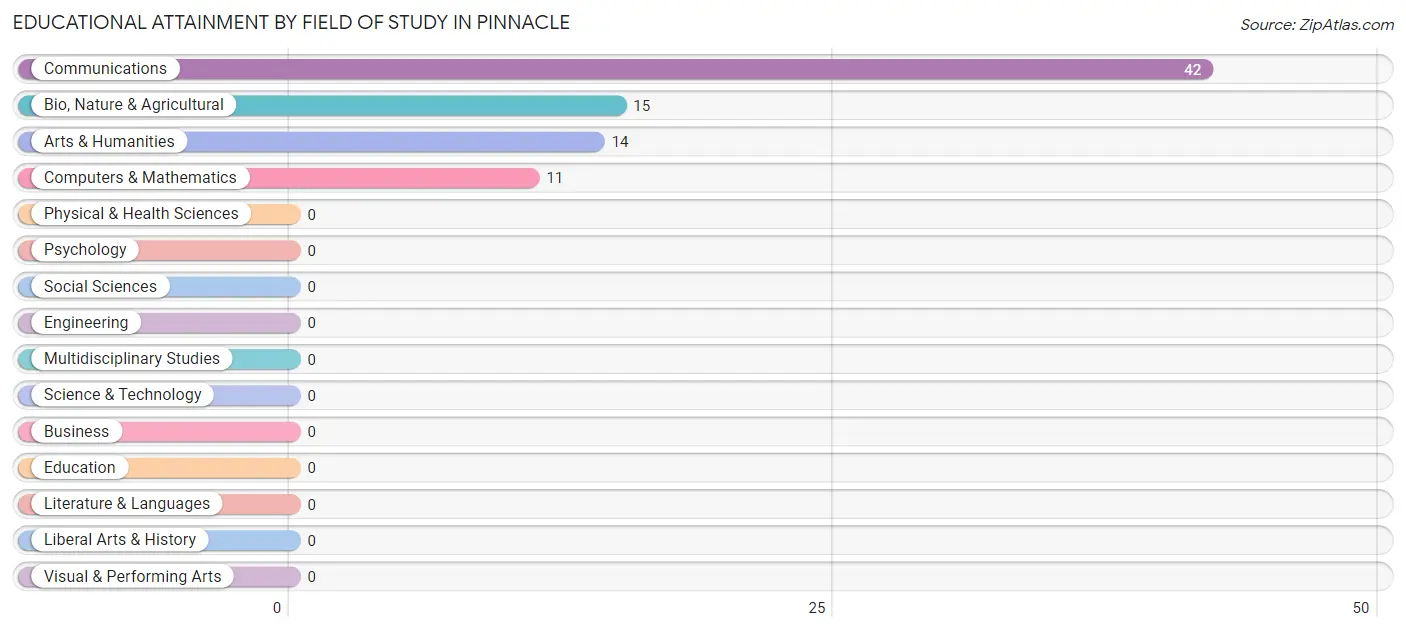
| Field of Study | # Graduates | % Graduates |
| Computers & Mathematics | 11 | 13.4% |
| Bio, Nature & Agricultural | 15 | 18.3% |
| Physical & Health Sciences | 0 | 0.0% |
| Psychology | 0 | 0.0% |
| Social Sciences | 0 | 0.0% |
| Engineering | 0 | 0.0% |
| Multidisciplinary Studies | 0 | 0.0% |
| Science & Technology | 0 | 0.0% |
| Business | 0 | 0.0% |
| Education | 0 | 0.0% |
| Literature & Languages | 0 | 0.0% |
| Liberal Arts & History | 0 | 0.0% |
| Visual & Performing Arts | 0 | 0.0% |
| Communications | 42 | 51.2% |
| Arts & Humanities | 14 | 17.1% |
| Total | 82 | 100.0% |
Transportation & Commute in Pinnacle
Vehicle Availability by Sex in Pinnacle
The most prevalent vehicle ownership categories in Pinnacle are males with 2 vehicles (38, accounting for 43.7%) and females with 2 vehicles (18, making up 26.6%).
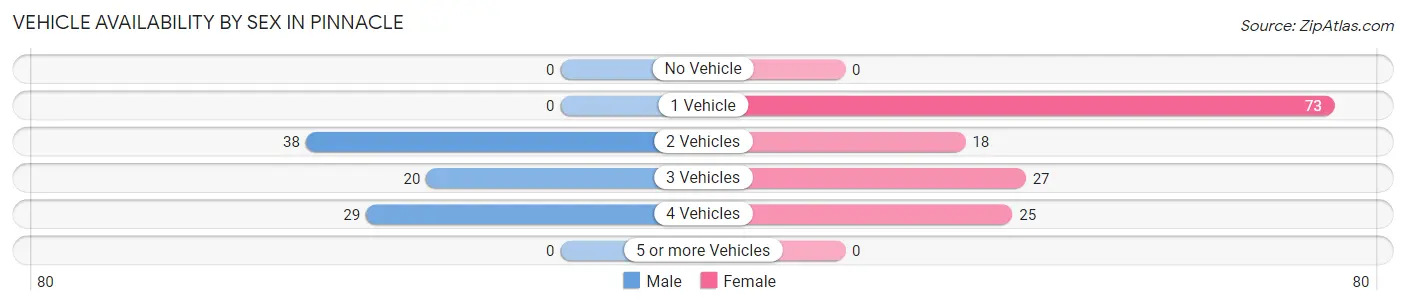
| Vehicles Available | Male | Female |
| No Vehicle | 0 (0.0%) | 0 (0.0%) |
| 1 Vehicle | 0 (0.0%) | 73 (51.0%) |
| 2 Vehicles | 38 (43.7%) | 18 (12.6%) |
| 3 Vehicles | 20 (23.0%) | 27 (18.9%) |
| 4 Vehicles | 29 (33.3%) | 25 (17.5%) |
| 5 or more Vehicles | 0 (0.0%) | 0 (0.0%) |
| Total | 87 (100.0%) | 143 (100.0%) |
Commute Time in Pinnacle
The most frequently occuring commute durations in Pinnacle are 30 to 34 minutes (121 commuters, 52.6%), less than 5 minutes (25 commuters, 10.9%), and 45 to 59 minutes (25 commuters, 10.9%).
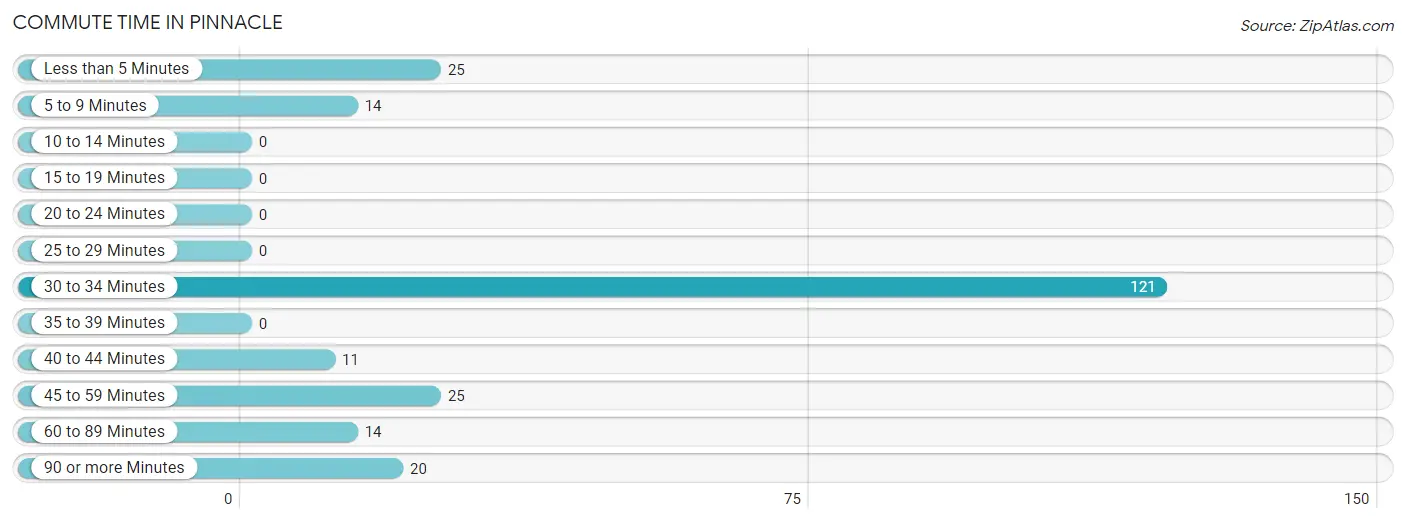
| Commute Time | # Commuters | % Commuters |
| Less than 5 Minutes | 25 | 10.9% |
| 5 to 9 Minutes | 14 | 6.1% |
| 10 to 14 Minutes | 0 | 0.0% |
| 15 to 19 Minutes | 0 | 0.0% |
| 20 to 24 Minutes | 0 | 0.0% |
| 25 to 29 Minutes | 0 | 0.0% |
| 30 to 34 Minutes | 121 | 52.6% |
| 35 to 39 Minutes | 0 | 0.0% |
| 40 to 44 Minutes | 11 | 4.8% |
| 45 to 59 Minutes | 25 | 10.9% |
| 60 to 89 Minutes | 14 | 6.1% |
| 90 or more Minutes | 20 | 8.7% |
Commute Time by Sex in Pinnacle
The most common commute times in Pinnacle are 30 to 34 minutes (38 commuters, 43.7%) for males and 30 to 34 minutes (83 commuters, 58.0%) for females.
| Commute Time | Male | Female |
| Less than 5 Minutes | 0 (0.0%) | 25 (17.5%) |
| 5 to 9 Minutes | 14 (16.1%) | 0 (0.0%) |
| 10 to 14 Minutes | 0 (0.0%) | 0 (0.0%) |
| 15 to 19 Minutes | 0 (0.0%) | 0 (0.0%) |
| 20 to 24 Minutes | 0 (0.0%) | 0 (0.0%) |
| 25 to 29 Minutes | 0 (0.0%) | 0 (0.0%) |
| 30 to 34 Minutes | 38 (43.7%) | 83 (58.0%) |
| 35 to 39 Minutes | 0 (0.0%) | 0 (0.0%) |
| 40 to 44 Minutes | 0 (0.0%) | 11 (7.7%) |
| 45 to 59 Minutes | 15 (17.2%) | 10 (7.0%) |
| 60 to 89 Minutes | 0 (0.0%) | 14 (9.8%) |
| 90 or more Minutes | 20 (23.0%) | 0 (0.0%) |
Time of Departure to Work by Sex in Pinnacle
The most frequent times of departure to work in Pinnacle are 5:30 AM to 5:59 AM (38, 43.7%) for males and 9:00 AM to 9:59 AM (63, 44.1%) for females.
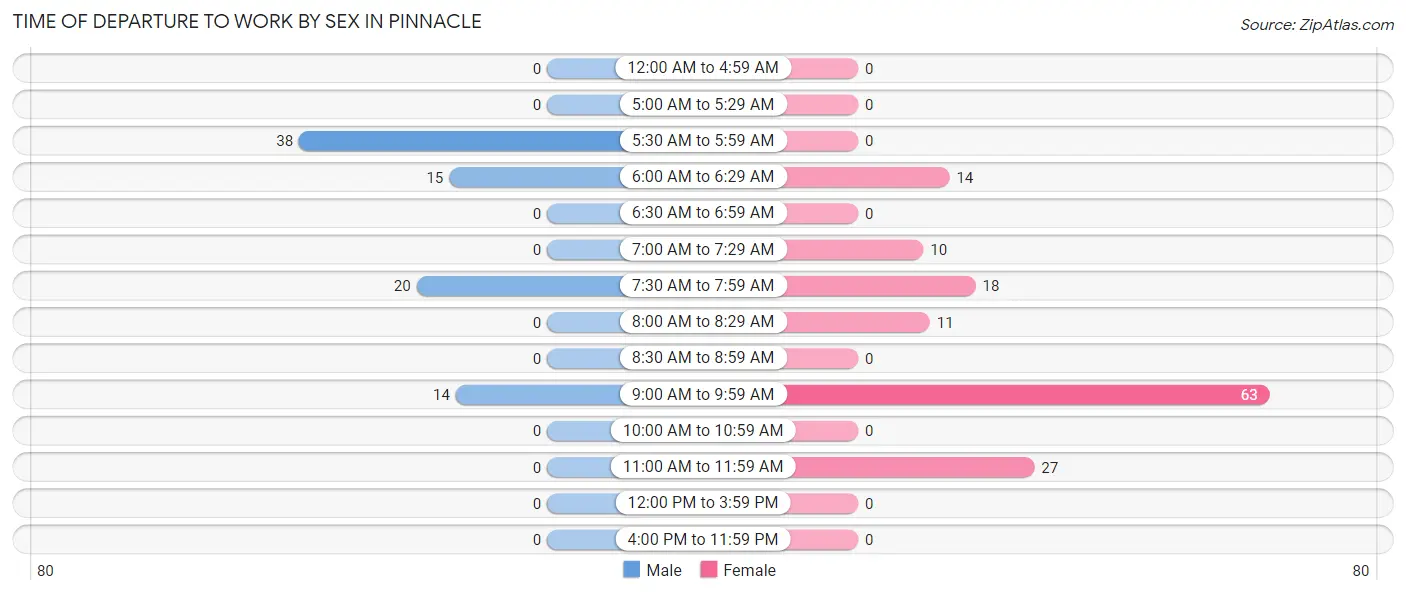
| Time of Departure | Male | Female |
| 12:00 AM to 4:59 AM | 0 (0.0%) | 0 (0.0%) |
| 5:00 AM to 5:29 AM | 0 (0.0%) | 0 (0.0%) |
| 5:30 AM to 5:59 AM | 38 (43.7%) | 0 (0.0%) |
| 6:00 AM to 6:29 AM | 15 (17.2%) | 14 (9.8%) |
| 6:30 AM to 6:59 AM | 0 (0.0%) | 0 (0.0%) |
| 7:00 AM to 7:29 AM | 0 (0.0%) | 10 (7.0%) |
| 7:30 AM to 7:59 AM | 20 (23.0%) | 18 (12.6%) |
| 8:00 AM to 8:29 AM | 0 (0.0%) | 11 (7.7%) |
| 8:30 AM to 8:59 AM | 0 (0.0%) | 0 (0.0%) |
| 9:00 AM to 9:59 AM | 14 (16.1%) | 63 (44.1%) |
| 10:00 AM to 10:59 AM | 0 (0.0%) | 0 (0.0%) |
| 11:00 AM to 11:59 AM | 0 (0.0%) | 27 (18.9%) |
| 12:00 PM to 3:59 PM | 0 (0.0%) | 0 (0.0%) |
| 4:00 PM to 11:59 PM | 0 (0.0%) | 0 (0.0%) |
| Total | 87 (100.0%) | 143 (100.0%) |
Housing Occupancy in Pinnacle
Occupancy by Ownership in Pinnacle
Of the total 296 dwellings in Pinnacle, owner-occupied units account for 170 (57.4%), while renter-occupied units make up 126 (42.6%).
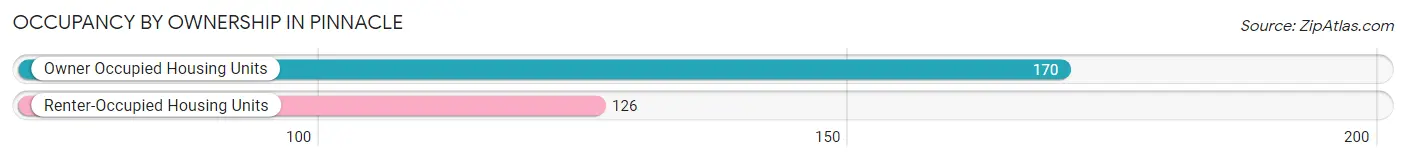
| Occupancy | # Housing Units | % Housing Units |
| Owner Occupied Housing Units | 170 | 57.4% |
| Renter-Occupied Housing Units | 126 | 42.6% |
| Total Occupied Housing Units | 296 | 100.0% |
Occupancy by Household Size in Pinnacle
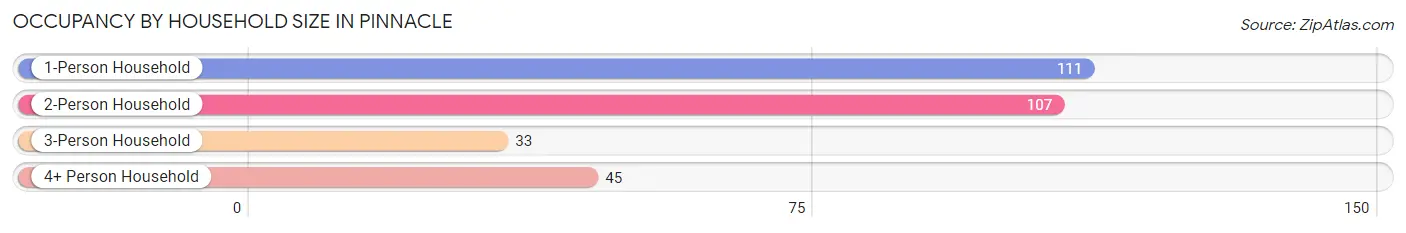
| Household Size | # Housing Units | % Housing Units |
| 1-Person Household | 111 | 37.5% |
| 2-Person Household | 107 | 36.1% |
| 3-Person Household | 33 | 11.2% |
| 4+ Person Household | 45 | 15.2% |
| Total Housing Units | 296 | 100.0% |
Occupancy by Ownership by Household Size in Pinnacle
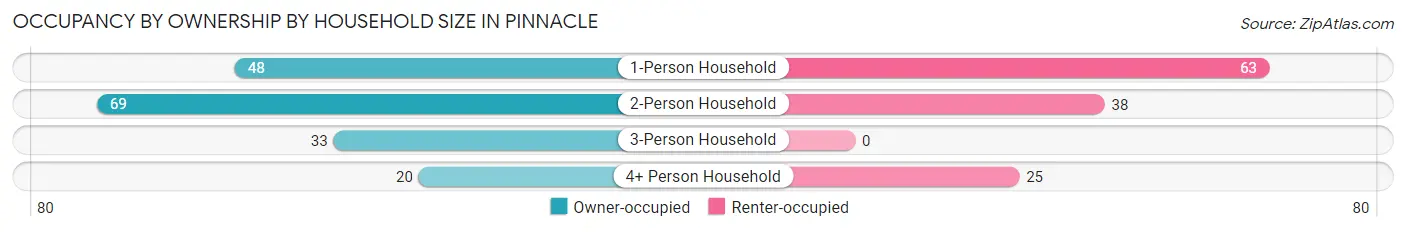
| Household Size | Owner-occupied | Renter-occupied |
| 1-Person Household | 48 (43.2%) | 63 (56.8%) |
| 2-Person Household | 69 (64.5%) | 38 (35.5%) |
| 3-Person Household | 33 (100.0%) | 0 (0.0%) |
| 4+ Person Household | 20 (44.4%) | 25 (55.6%) |
| Total Housing Units | 170 (57.4%) | 126 (42.6%) |
Occupancy by Educational Attainment in Pinnacle
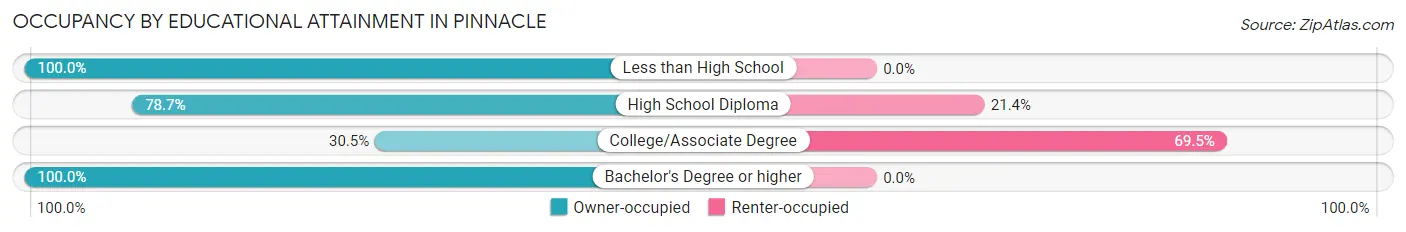
| Household Size | Owner-occupied | Renter-occupied |
| Less than High School | 38 (100.0%) | 0 (0.0%) |
| High School Diploma | 70 (78.6%) | 19 (21.3%) |
| College/Associate Degree | 47 (30.5%) | 107 (69.5%) |
| Bachelor's Degree or higher | 15 (100.0%) | 0 (0.0%) |
Occupancy by Age of Householder in Pinnacle
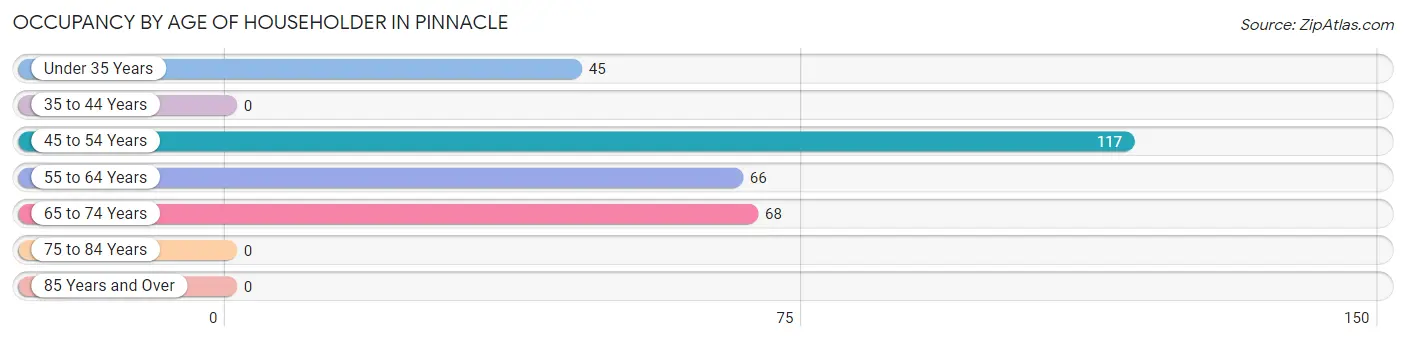
| Age Bracket | # Households | % Households |
| Under 35 Years | 45 | 15.2% |
| 35 to 44 Years | 0 | 0.0% |
| 45 to 54 Years | 117 | 39.5% |
| 55 to 64 Years | 66 | 22.3% |
| 65 to 74 Years | 68 | 23.0% |
| 75 to 84 Years | 0 | 0.0% |
| 85 Years and Over | 0 | 0.0% |
| Total | 296 | 100.0% |
Housing Finances in Pinnacle
Median Income by Occupancy in Pinnacle
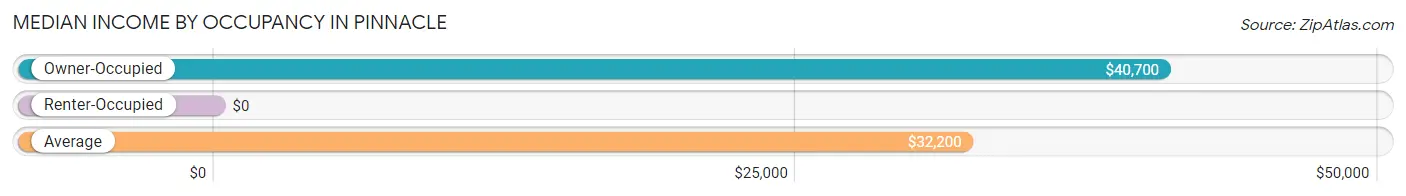
| Occupancy Type | # Households | Median Income |
| Owner-Occupied | 170 (57.4%) | $40,700 |
| Renter-Occupied | 126 (42.6%) | $0 |
| Average | 296 (100.0%) | $32,200 |
Occupancy by Householder Income Bracket in Pinnacle
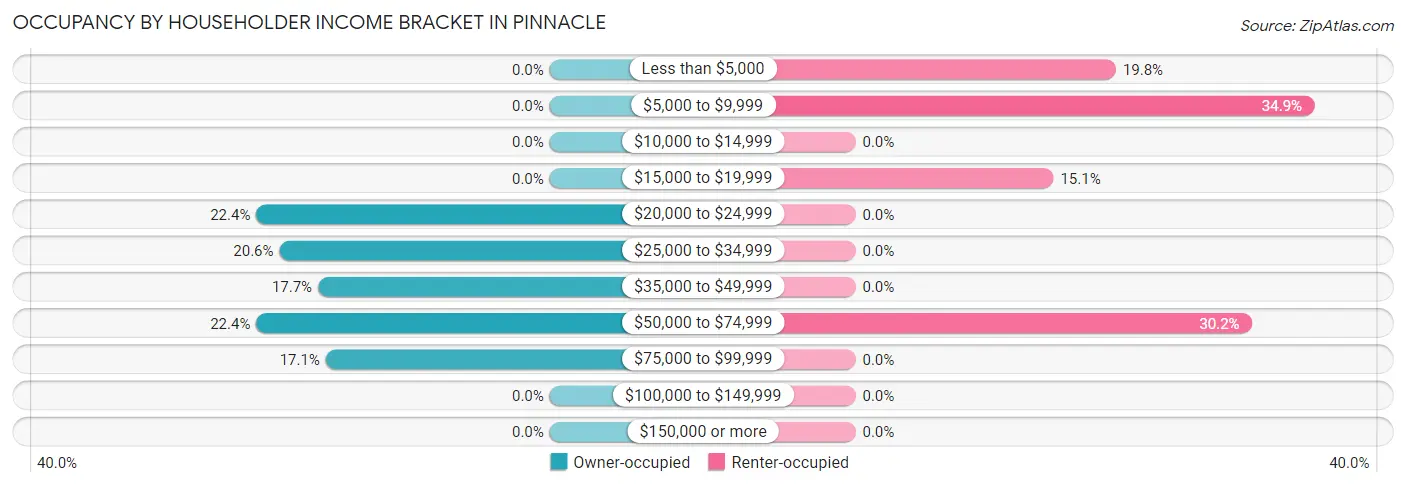
| Income Bracket | Owner-occupied | Renter-occupied |
| Less than $5,000 | 0 (0.0%) | 25 (19.8%) |
| $5,000 to $9,999 | 0 (0.0%) | 44 (34.9%) |
| $10,000 to $14,999 | 0 (0.0%) | 0 (0.0%) |
| $15,000 to $19,999 | 0 (0.0%) | 19 (15.1%) |
| $20,000 to $24,999 | 38 (22.4%) | 0 (0.0%) |
| $25,000 to $34,999 | 35 (20.6%) | 0 (0.0%) |
| $35,000 to $49,999 | 30 (17.6%) | 0 (0.0%) |
| $50,000 to $74,999 | 38 (22.4%) | 38 (30.2%) |
| $75,000 to $99,999 | 29 (17.1%) | 0 (0.0%) |
| $100,000 to $149,999 | 0 (0.0%) | 0 (0.0%) |
| $150,000 or more | 0 (0.0%) | 0 (0.0%) |
| Total | 170 (100.0%) | 126 (100.0%) |
Monthly Housing Cost Tiers in Pinnacle
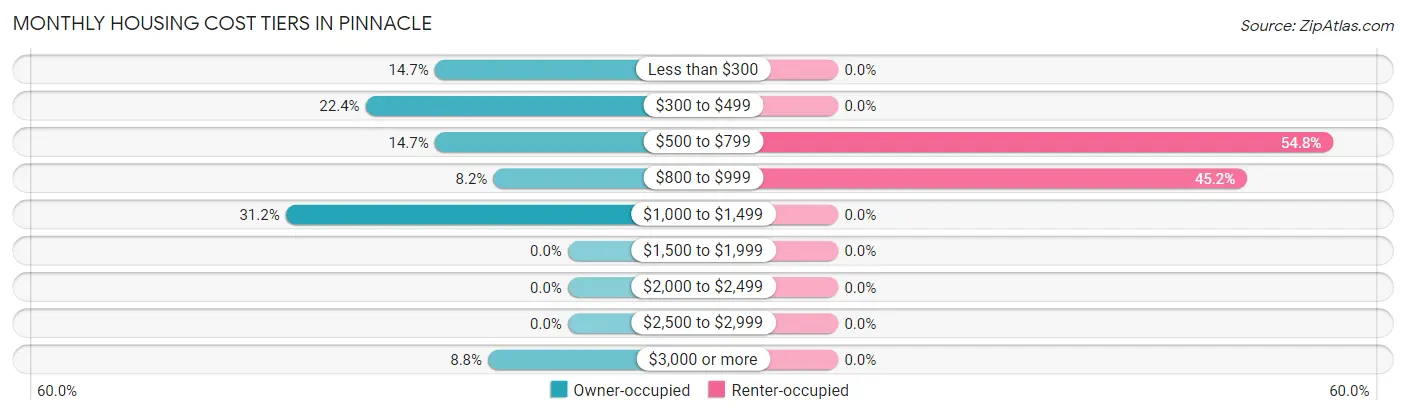
| Monthly Cost | Owner-occupied | Renter-occupied |
| Less than $300 | 25 (14.7%) | 0 (0.0%) |
| $300 to $499 | 38 (22.4%) | 0 (0.0%) |
| $500 to $799 | 25 (14.7%) | 69 (54.8%) |
| $800 to $999 | 14 (8.2%) | 57 (45.2%) |
| $1,000 to $1,499 | 53 (31.2%) | 0 (0.0%) |
| $1,500 to $1,999 | 0 (0.0%) | 0 (0.0%) |
| $2,000 to $2,499 | 0 (0.0%) | 0 (0.0%) |
| $2,500 to $2,999 | 0 (0.0%) | 0 (0.0%) |
| $3,000 or more | 15 (8.8%) | 0 (0.0%) |
| Total | 170 (100.0%) | 126 (100.0%) |
Physical Housing Characteristics in Pinnacle
Housing Structures in Pinnacle
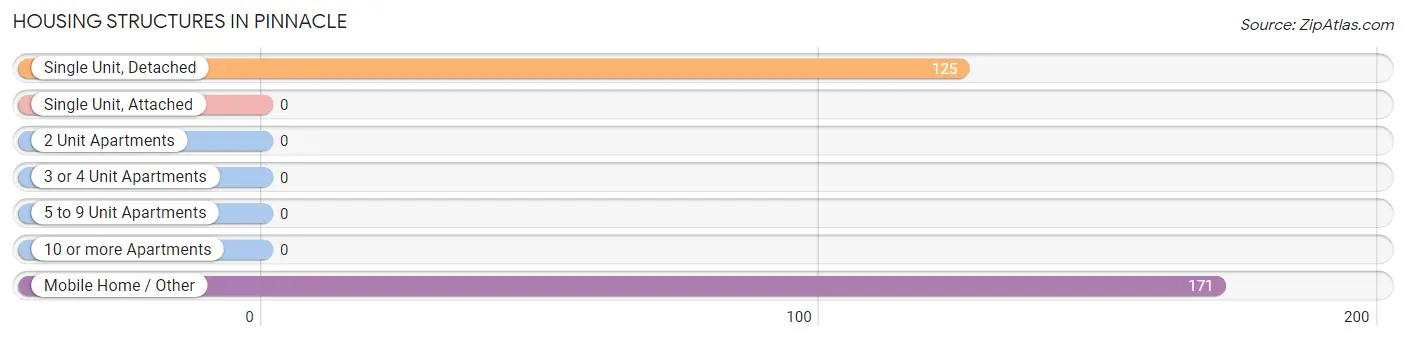
| Structure Type | # Housing Units | % Housing Units |
| Single Unit, Detached | 125 | 42.2% |
| Single Unit, Attached | 0 | 0.0% |
| 2 Unit Apartments | 0 | 0.0% |
| 3 or 4 Unit Apartments | 0 | 0.0% |
| 5 to 9 Unit Apartments | 0 | 0.0% |
| 10 or more Apartments | 0 | 0.0% |
| Mobile Home / Other | 171 | 57.8% |
| Total | 296 | 100.0% |
Housing Structures by Occupancy in Pinnacle
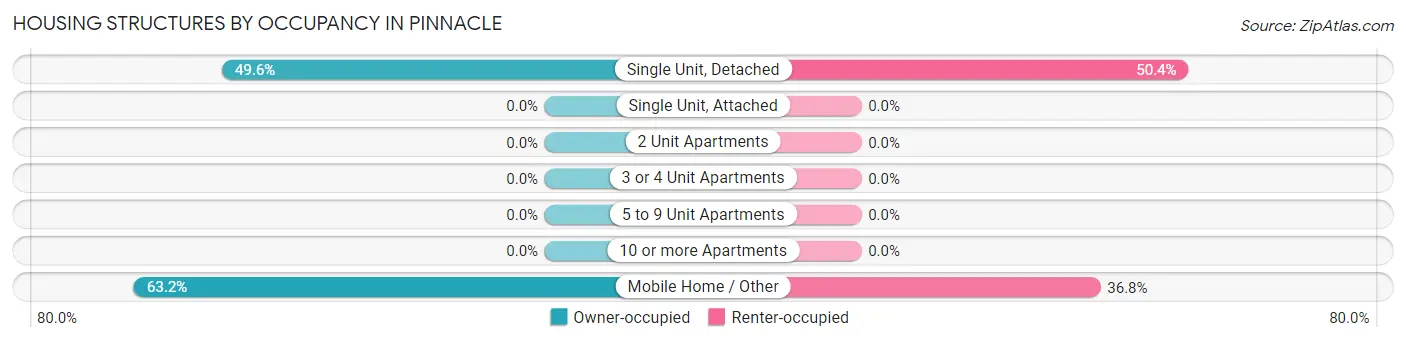
| Structure Type | Owner-occupied | Renter-occupied |
| Single Unit, Detached | 62 (49.6%) | 63 (50.4%) |
| Single Unit, Attached | 0 (0.0%) | 0 (0.0%) |
| 2 Unit Apartments | 0 (0.0%) | 0 (0.0%) |
| 3 or 4 Unit Apartments | 0 (0.0%) | 0 (0.0%) |
| 5 to 9 Unit Apartments | 0 (0.0%) | 0 (0.0%) |
| 10 or more Apartments | 0 (0.0%) | 0 (0.0%) |
| Mobile Home / Other | 108 (63.2%) | 63 (36.8%) |
| Total | 170 (57.4%) | 126 (42.6%) |
Housing Structures by Number of Rooms in Pinnacle
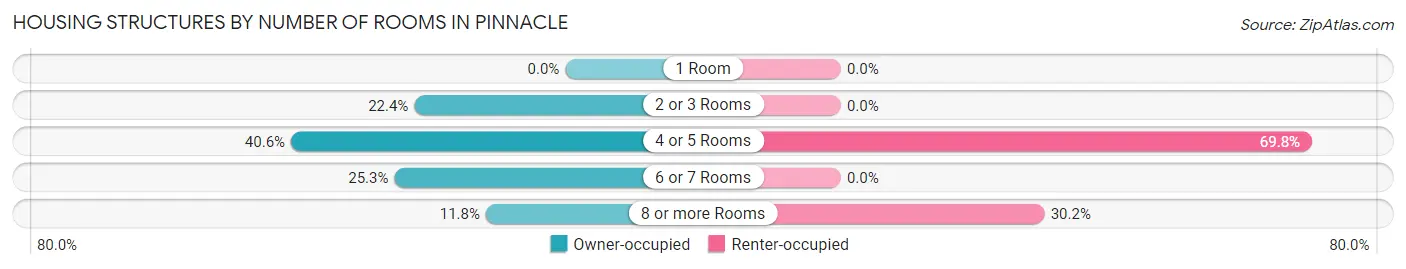
| Number of Rooms | Owner-occupied | Renter-occupied |
| 1 Room | 0 (0.0%) | 0 (0.0%) |
| 2 or 3 Rooms | 38 (22.4%) | 0 (0.0%) |
| 4 or 5 Rooms | 69 (40.6%) | 88 (69.8%) |
| 6 or 7 Rooms | 43 (25.3%) | 0 (0.0%) |
| 8 or more Rooms | 20 (11.8%) | 38 (30.2%) |
| Total | 170 (100.0%) | 126 (100.0%) |
Housing Structure by Heating Type in Pinnacle
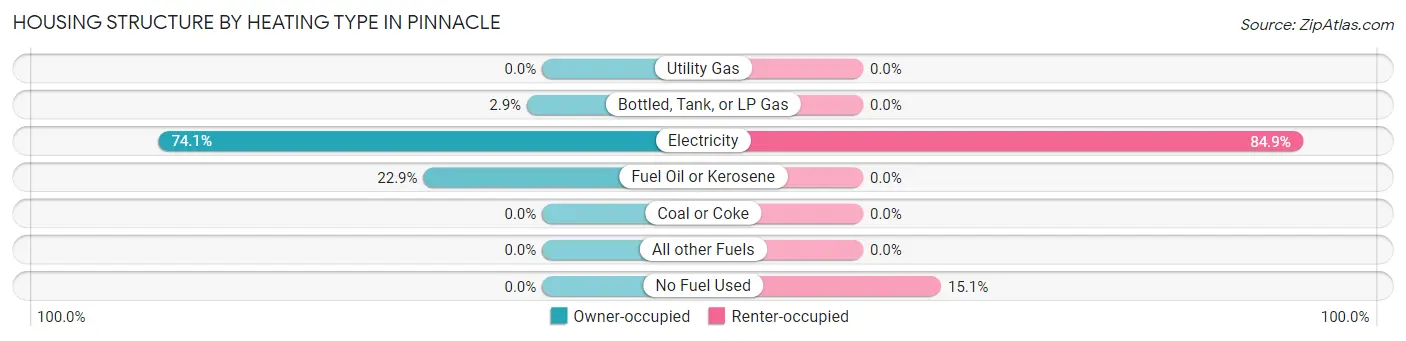
| Heating Type | Owner-occupied | Renter-occupied |
| Utility Gas | 0 (0.0%) | 0 (0.0%) |
| Bottled, Tank, or LP Gas | 5 (2.9%) | 0 (0.0%) |
| Electricity | 126 (74.1%) | 107 (84.9%) |
| Fuel Oil or Kerosene | 39 (22.9%) | 0 (0.0%) |
| Coal or Coke | 0 (0.0%) | 0 (0.0%) |
| All other Fuels | 0 (0.0%) | 0 (0.0%) |
| No Fuel Used | 0 (0.0%) | 19 (15.1%) |
| Total | 170 (100.0%) | 126 (100.0%) |
Household Vehicle Usage in Pinnacle
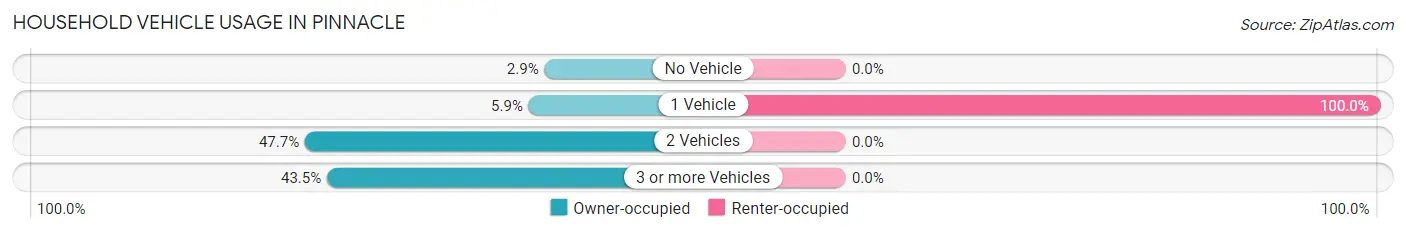
| Vehicles per Household | Owner-occupied | Renter-occupied |
| No Vehicle | 5 (2.9%) | 0 (0.0%) |
| 1 Vehicle | 10 (5.9%) | 126 (100.0%) |
| 2 Vehicles | 81 (47.6%) | 0 (0.0%) |
| 3 or more Vehicles | 74 (43.5%) | 0 (0.0%) |
| Total | 170 (100.0%) | 126 (100.0%) |
Real Estate & Mortgages in Pinnacle
Real Estate and Mortgage Overview in Pinnacle
| Characteristic | Without Mortgage | With Mortgage |
| Housing Units | 82 | 88 |
| Median Property Value | - | - |
| Median Household Income | $30,300 | $0 |
| Monthly Housing Costs | $321 | $15 |
| Real Estate Taxes | - | - |
Property Value by Mortgage Status in Pinnacle
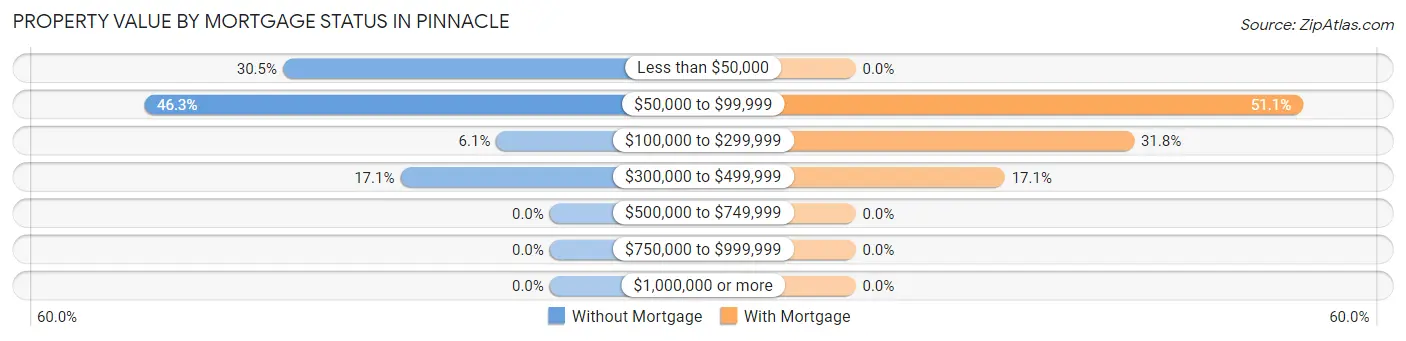
| Property Value | Without Mortgage | With Mortgage |
| Less than $50,000 | 25 (30.5%) | 0 (0.0%) |
| $50,000 to $99,999 | 38 (46.3%) | 45 (51.1%) |
| $100,000 to $299,999 | 5 (6.1%) | 28 (31.8%) |
| $300,000 to $499,999 | 14 (17.1%) | 15 (17.1%) |
| $500,000 to $749,999 | 0 (0.0%) | 0 (0.0%) |
| $750,000 to $999,999 | 0 (0.0%) | 0 (0.0%) |
| $1,000,000 or more | 0 (0.0%) | 0 (0.0%) |
| Total | 82 (100.0%) | 88 (100.0%) |
Household Income by Mortgage Status in Pinnacle
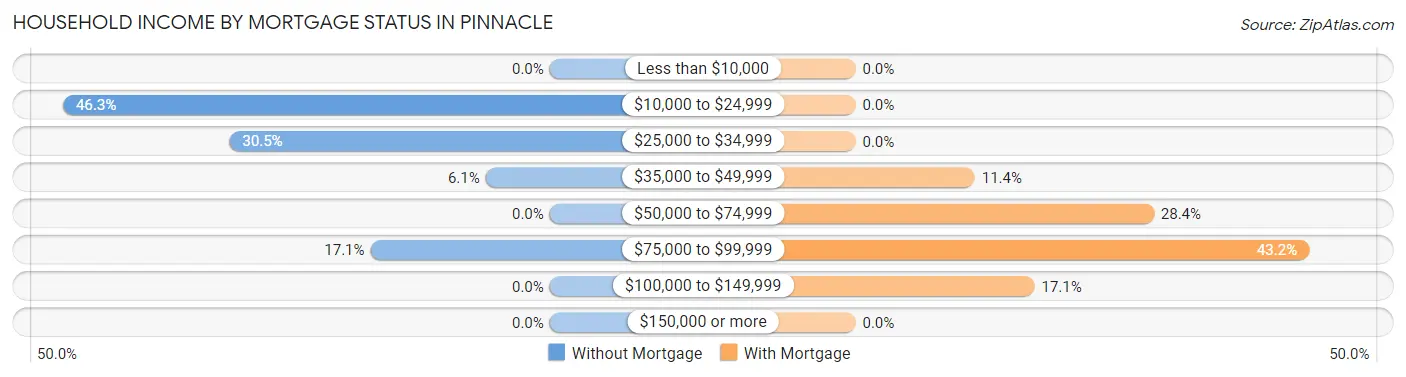
| Household Income | Without Mortgage | With Mortgage |
| Less than $10,000 | 0 (0.0%) | 0 (0.0%) |
| $10,000 to $24,999 | 38 (46.3%) | 0 (0.0%) |
| $25,000 to $34,999 | 25 (30.5%) | 0 (0.0%) |
| $35,000 to $49,999 | 5 (6.1%) | 10 (11.4%) |
| $50,000 to $74,999 | 0 (0.0%) | 25 (28.4%) |
| $75,000 to $99,999 | 14 (17.1%) | 38 (43.2%) |
| $100,000 to $149,999 | 0 (0.0%) | 15 (17.1%) |
| $150,000 or more | 0 (0.0%) | 0 (0.0%) |
| Total | 82 (100.0%) | 88 (100.0%) |
Property Value to Household Income Ratio in Pinnacle
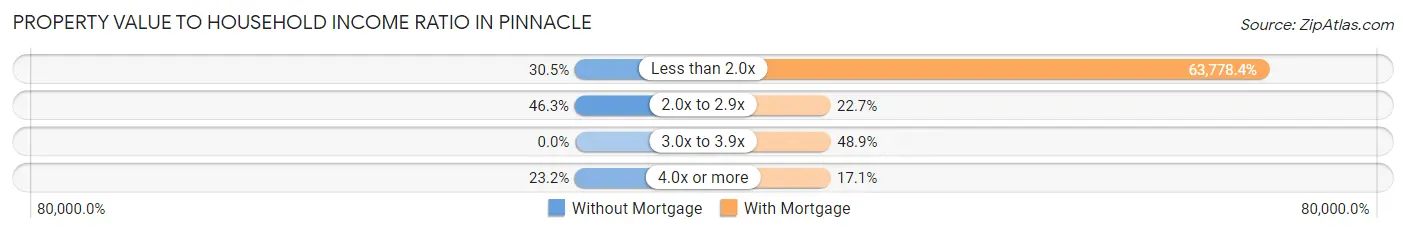
| Value-to-Income Ratio | Without Mortgage | With Mortgage |
| Less than 2.0x | 25 (30.5%) | 56,125 (63,778.4%) |
| 2.0x to 2.9x | 38 (46.3%) | 20 (22.7%) |
| 3.0x to 3.9x | 0 (0.0%) | 43 (48.9%) |
| 4.0x or more | 19 (23.2%) | 15 (17.1%) |
| Total | 82 (100.0%) | 88 (100.0%) |
Real Estate Taxes by Mortgage Status in Pinnacle
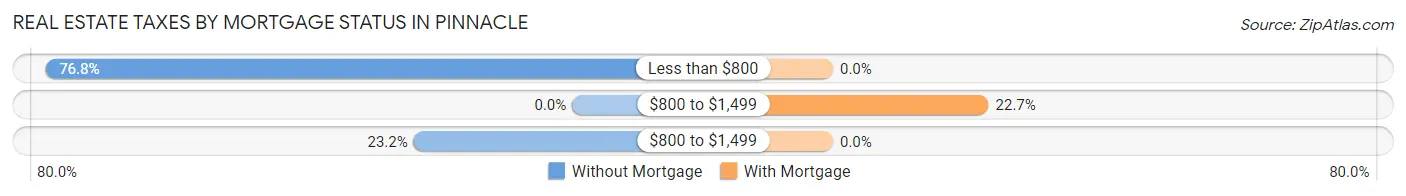
| Property Taxes | Without Mortgage | With Mortgage |
| Less than $800 | 63 (76.8%) | 0 (0.0%) |
| $800 to $1,499 | 0 (0.0%) | 20 (22.7%) |
| $800 to $1,499 | 19 (23.2%) | 0 (0.0%) |
| Total | 82 (100.0%) | 88 (100.0%) |
Health & Disability in Pinnacle
Health Insurance Coverage by Age in Pinnacle
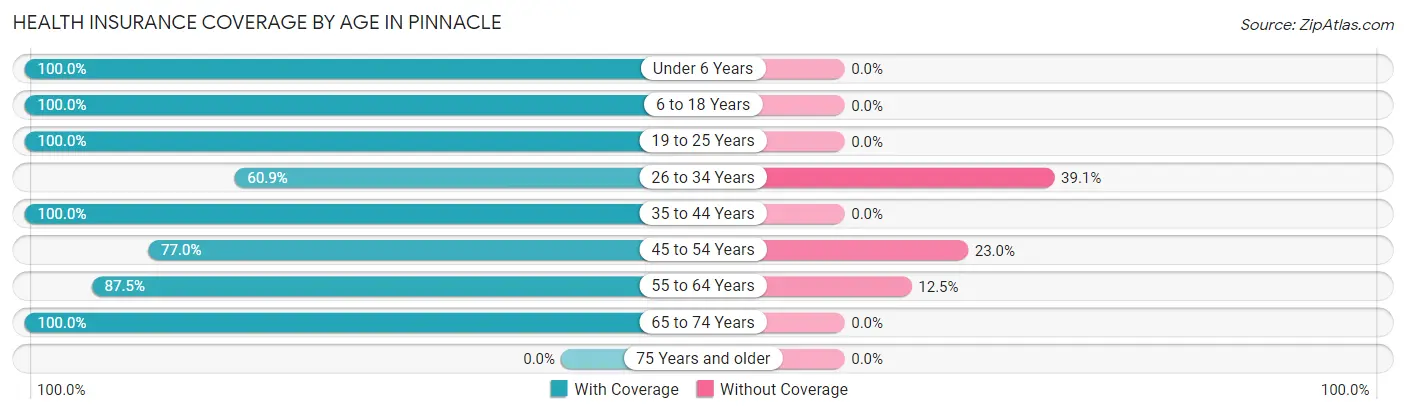
| Age Bracket | With Coverage | Without Coverage |
| Under 6 Years | 71 (100.0%) | 0 (0.0%) |
| 6 to 18 Years | 173 (100.0%) | 0 (0.0%) |
| 19 to 25 Years | 27 (100.0%) | 0 (0.0%) |
| 26 to 34 Years | 42 (60.9%) | 27 (39.1%) |
| 35 to 44 Years | 9 (100.0%) | 0 (0.0%) |
| 45 to 54 Years | 127 (77.0%) | 38 (23.0%) |
| 55 to 64 Years | 133 (87.5%) | 19 (12.5%) |
| 65 to 74 Years | 83 (100.0%) | 0 (0.0%) |
| 75 Years and older | 0 (0.0%) | 0 (0.0%) |
| Total | 665 (88.8%) | 84 (11.2%) |
Health Insurance Coverage by Citizenship Status in Pinnacle
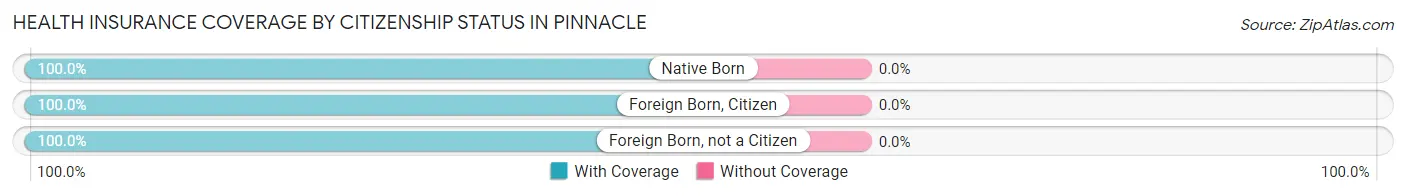
| Citizenship Status | With Coverage | Without Coverage |
| Native Born | 71 (100.0%) | 0 (0.0%) |
| Foreign Born, Citizen | 173 (100.0%) | 0 (0.0%) |
| Foreign Born, not a Citizen | 27 (100.0%) | 0 (0.0%) |
Health Insurance Coverage by Household Income in Pinnacle
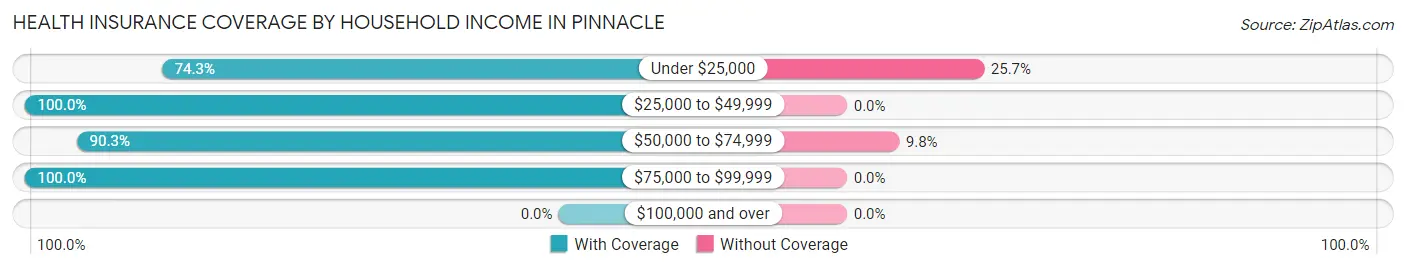
| Household Income | With Coverage | Without Coverage |
| Under $25,000 | 165 (74.3%) | 57 (25.7%) |
| $25,000 to $49,999 | 135 (100.0%) | 0 (0.0%) |
| $50,000 to $74,999 | 250 (90.2%) | 27 (9.8%) |
| $75,000 to $99,999 | 87 (100.0%) | 0 (0.0%) |
| $100,000 and over | 0 (0.0%) | 0 (0.0%) |
Public vs Private Health Insurance Coverage by Age in Pinnacle
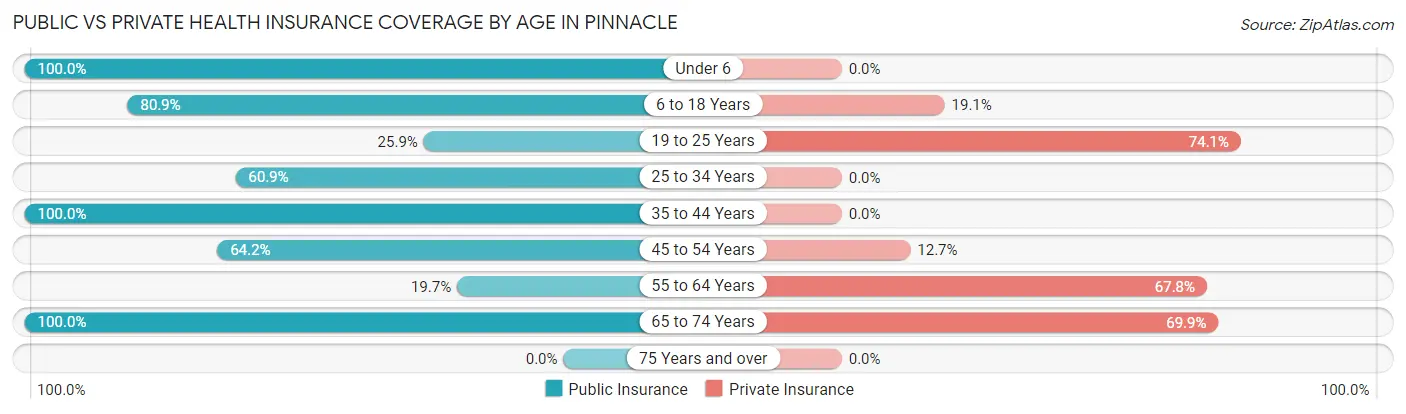
| Age Bracket | Public Insurance | Private Insurance |
| Under 6 | 71 (100.0%) | 0 (0.0%) |
| 6 to 18 Years | 140 (80.9%) | 33 (19.1%) |
| 19 to 25 Years | 7 (25.9%) | 20 (74.1%) |
| 25 to 34 Years | 42 (60.9%) | 0 (0.0%) |
| 35 to 44 Years | 9 (100.0%) | 0 (0.0%) |
| 45 to 54 Years | 106 (64.2%) | 21 (12.7%) |
| 55 to 64 Years | 30 (19.7%) | 103 (67.8%) |
| 65 to 74 Years | 83 (100.0%) | 58 (69.9%) |
| 75 Years and over | 0 (0.0%) | 0 (0.0%) |
| Total | 488 (65.1%) | 235 (31.4%) |
Disability Status by Sex by Age in Pinnacle
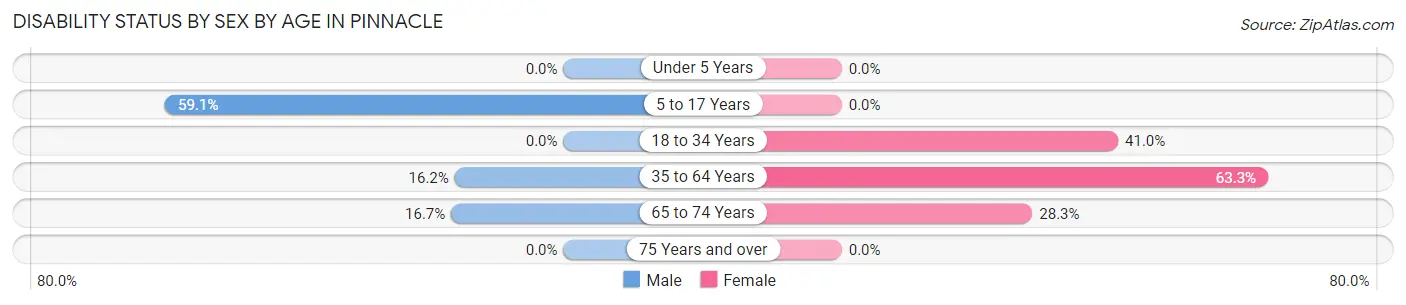
| Age Bracket | Male | Female |
| Under 5 Years | 0 (0.0%) | 0 (0.0%) |
| 5 to 17 Years | 55 (59.1%) | 0 (0.0%) |
| 18 to 34 Years | 0 (0.0%) | 32 (41.0%) |
| 35 to 64 Years | 21 (16.2%) | 124 (63.3%) |
| 65 to 74 Years | 5 (16.7%) | 15 (28.3%) |
| 75 Years and over | 0 (0.0%) | 0 (0.0%) |
Disability Class by Sex by Age in Pinnacle
Disability Class: Hearing Difficulty
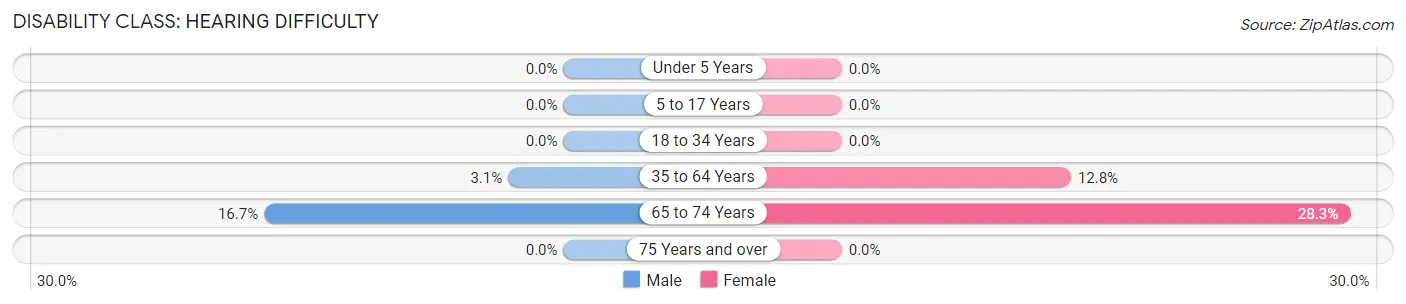
| Age Bracket | Male | Female |
| Under 5 Years | 0 (0.0%) | 0 (0.0%) |
| 5 to 17 Years | 0 (0.0%) | 0 (0.0%) |
| 18 to 34 Years | 0 (0.0%) | 0 (0.0%) |
| 35 to 64 Years | 4 (3.1%) | 25 (12.8%) |
| 65 to 74 Years | 5 (16.7%) | 15 (28.3%) |
| 75 Years and over | 0 (0.0%) | 0 (0.0%) |
Disability Class: Vision Difficulty
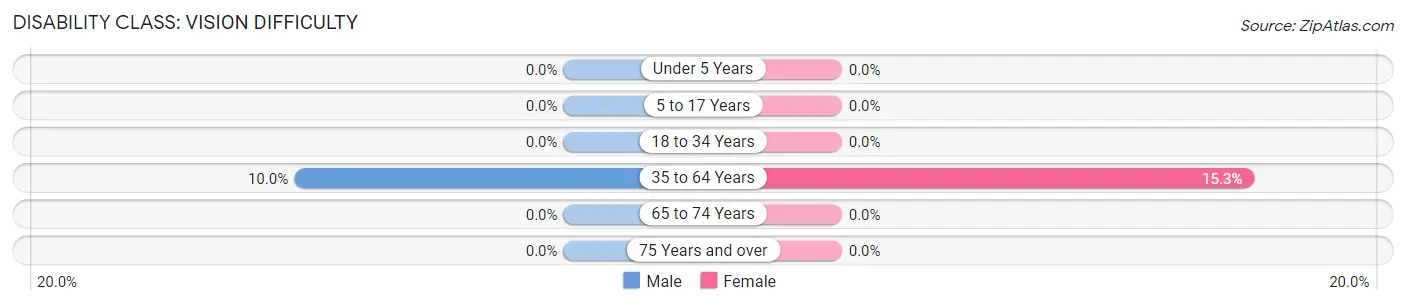
| Age Bracket | Male | Female |
| Under 5 Years | 0 (0.0%) | 0 (0.0%) |
| 5 to 17 Years | 0 (0.0%) | 0 (0.0%) |
| 18 to 34 Years | 0 (0.0%) | 0 (0.0%) |
| 35 to 64 Years | 13 (10.0%) | 30 (15.3%) |
| 65 to 74 Years | 0 (0.0%) | 0 (0.0%) |
| 75 Years and over | 0 (0.0%) | 0 (0.0%) |
Disability Class: Cognitive Difficulty
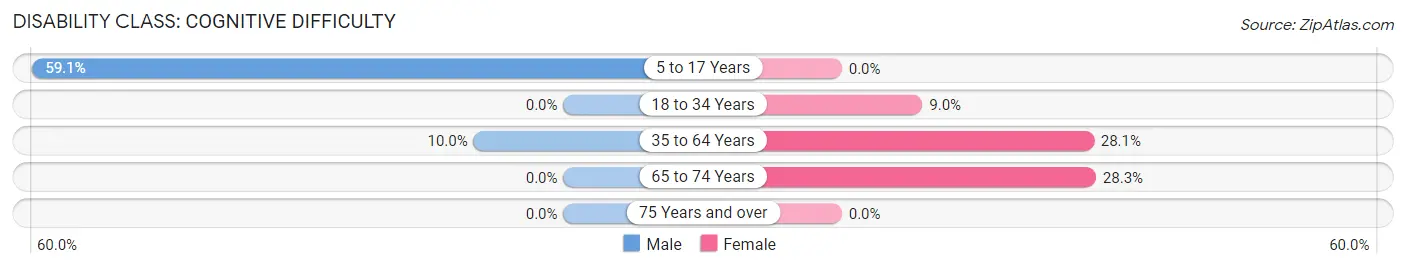
| Age Bracket | Male | Female |
| 5 to 17 Years | 55 (59.1%) | 0 (0.0%) |
| 18 to 34 Years | 0 (0.0%) | 7 (9.0%) |
| 35 to 64 Years | 13 (10.0%) | 55 (28.1%) |
| 65 to 74 Years | 0 (0.0%) | 15 (28.3%) |
| 75 Years and over | 0 (0.0%) | 0 (0.0%) |
Disability Class: Ambulatory Difficulty
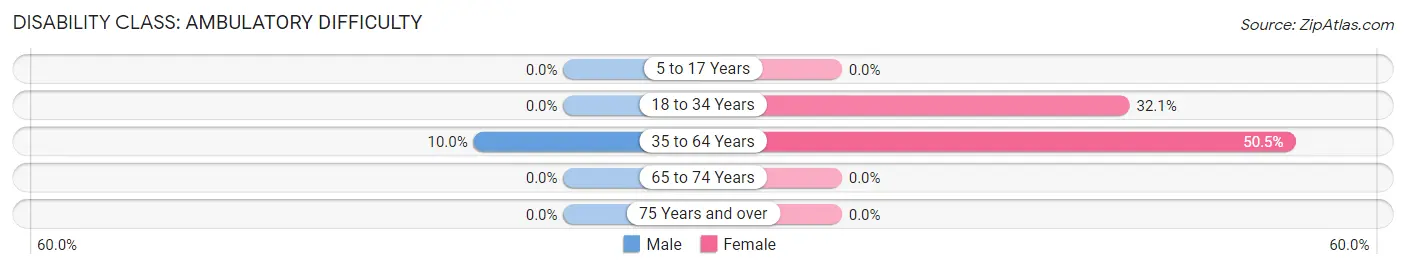
| Age Bracket | Male | Female |
| 5 to 17 Years | 0 (0.0%) | 0 (0.0%) |
| 18 to 34 Years | 0 (0.0%) | 25 (32.1%) |
| 35 to 64 Years | 13 (10.0%) | 99 (50.5%) |
| 65 to 74 Years | 0 (0.0%) | 0 (0.0%) |
| 75 Years and over | 0 (0.0%) | 0 (0.0%) |
Disability Class: Self-Care Difficulty
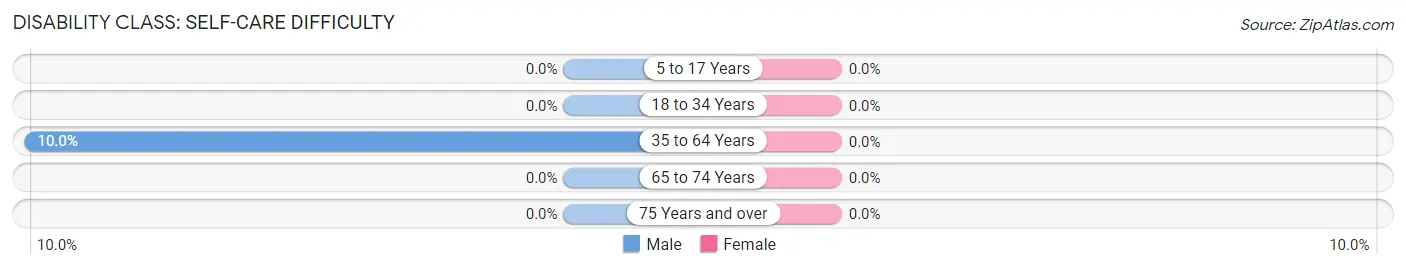
| Age Bracket | Male | Female |
| 5 to 17 Years | 0 (0.0%) | 0 (0.0%) |
| 18 to 34 Years | 0 (0.0%) | 0 (0.0%) |
| 35 to 64 Years | 13 (10.0%) | 0 (0.0%) |
| 65 to 74 Years | 0 (0.0%) | 0 (0.0%) |
| 75 Years and over | 0 (0.0%) | 0 (0.0%) |
Technology Access in Pinnacle
Computing Device Access in Pinnacle
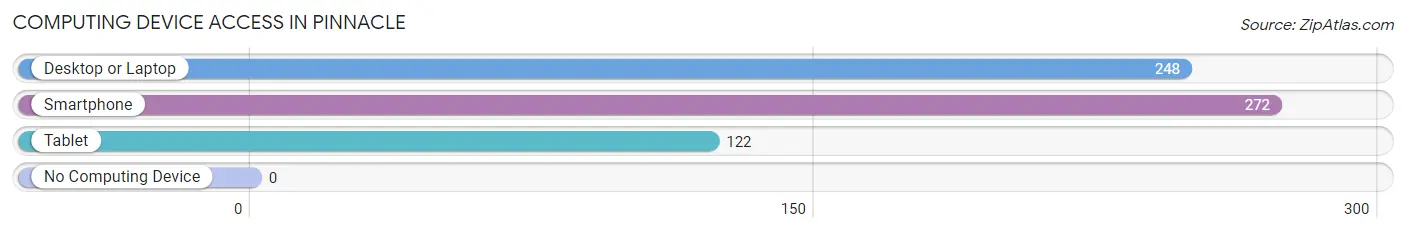
| Device Type | # Households | % Households |
| Desktop or Laptop | 248 | 83.8% |
| Smartphone | 272 | 91.9% |
| Tablet | 122 | 41.2% |
| No Computing Device | 0 | 0.0% |
| Total | 296 | 100.0% |
Internet Access in Pinnacle
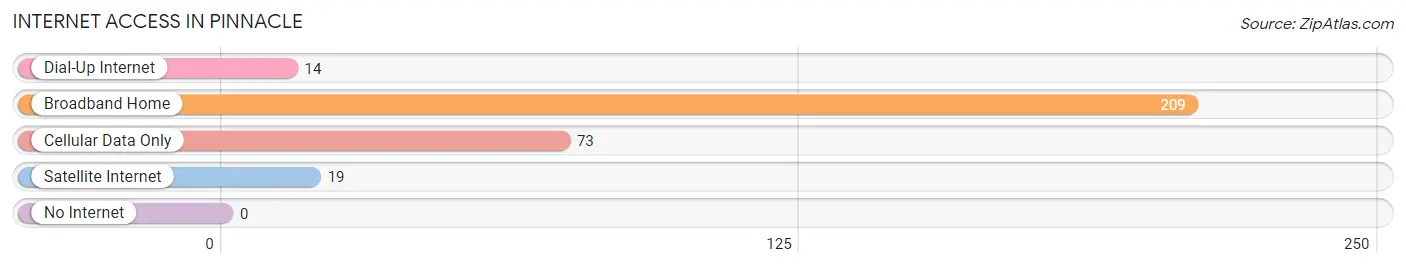
| Internet Type | # Households | % Households |
| Dial-Up Internet | 14 | 4.7% |
| Broadband Home | 209 | 70.6% |
| Cellular Data Only | 73 | 24.7% |
| Satellite Internet | 19 | 6.4% |
| No Internet | 0 | 0.0% |
| Total | 296 | 100.0% |
Pinnacle Summary
Pinnacle, North Carolina is a small town located in the foothills of the Blue Ridge Mountains in Stokes County. It is situated in the northwest corner of the state, about 25 miles northeast of Winston-Salem. The town was founded in 1845 and has a population of approximately 1,000 people.
Geography
Pinnacle is located in the foothills of the Blue Ridge Mountains, which are part of the Appalachian Mountains. The town is situated in the Yadkin Valley, which is a region of rolling hills and valleys. The town is located at an elevation of 1,000 feet above sea level. The town is surrounded by the Sauratown Mountains to the east and the Pilot Mountain to the west. The town is located in a temperate climate, with mild winters and hot summers.
Economy
The economy of Pinnacle is largely based on agriculture. The town is home to several farms, which produce a variety of crops, including corn, soybeans, wheat, and hay. The town also has a few small businesses, including a grocery store, a hardware store, and a few restaurants.
Demographics
As of the 2010 census, the population of Pinnacle was 1,000 people. The racial makeup of the town was 97.2% White, 0.7% African American, 0.3% Native American, 0.3% Asian, and 1.5% from other races. The median household income was $35,000, and the median family income was $41,000. The per capita income was $17,000.
History
Pinnacle was founded in 1845 by a group of settlers from Pennsylvania. The town was named after the nearby Pinnacle Mountain, which is the highest peak in the Sauratown Mountains. The town was originally a farming community, and the main crops were corn, wheat, and hay. In the late 19th century, the town began to grow as a result of the railroad, which connected the town to Winston-Salem. The town was incorporated in 1891.
In the early 20th century, the town began to decline as a result of the Great Depression. The town was revitalized in the 1950s with the construction of a new highway, which connected the town to Winston-Salem. The town has since become a popular tourist destination, with several wineries, antique shops, and restaurants.
Conclusion
Pinnacle, North Carolina is a small town located in the foothills of the Blue Ridge Mountains in Stokes County. The town was founded in 1845 and has a population of approximately 1,000 people. The economy of Pinnacle is largely based on agriculture, and the town is home to several farms, which produce a variety of crops. The racial makeup of the town is 97.2% White, 0.7% African American, 0.3% Native American, 0.3% Asian, and 1.5% from other races. The median household income was $35,000, and the median family income was $41,000. The town has become a popular tourist destination, with several wineries, antique shops, and restaurants.
Common Questions
What is Per Capita Income in Pinnacle?
Per Capita income in Pinnacle is $16,055.
What is the Median Family Income in Pinnacle?
Median Family Income in Pinnacle is $56,078.
What is the Median Household income in Pinnacle?
Median Household Income in Pinnacle is $32,200.
What is Inequality or Gini Index in Pinnacle?
Inequality or Gini Index in Pinnacle is 0.41.
What is the Total Population of Pinnacle?
Total Population of Pinnacle is 749.
What is the Total Male Population of Pinnacle?
Total Male Population of Pinnacle is 327.
What is the Total Female Population of Pinnacle?
Total Female Population of Pinnacle is 422.
What is the Ratio of Males per 100 Females in Pinnacle?
There are 77.49 Males per 100 Females in Pinnacle.
What is the Ratio of Females per 100 Males in Pinnacle?
There are 129.05 Females per 100 Males in Pinnacle.
What is the Median Population Age in Pinnacle?
Median Population Age in Pinnacle is 47.7 Years.
What is the Average Family Size in Pinnacle
Average Family Size in Pinnacle is 3.5 People.
What is the Average Household Size in Pinnacle
Average Household Size in Pinnacle is 2.4 People.
How Large is the Labor Force in Pinnacle?
There are 230 People in the Labor Forcein in Pinnacle.
What is the Percentage of People in the Labor Force in Pinnacle?
41.3% of People are in the Labor Force in Pinnacle.