Fordyce, NE Map & Demographics
Fordyce Map
Fordyce Overview
$25,928
PER CAPITA INCOME
$81,000
AVG FAMILY INCOME
$55,625
AVG HOUSEHOLD INCOME
32.9%
WAGE / INCOME GAP [ % ]
67.1¢/ $1
WAGE / INCOME GAP [ $ ]
0.37
INEQUALITY / GINI INDEX
237
TOTAL POPULATION
121
MALE POPULATION
116
FEMALE POPULATION
104.31
MALES / 100 FEMALES
95.87
FEMALES / 100 MALES
29.3
MEDIAN AGE
3.5
AVG FAMILY SIZE
2.9
AVG HOUSEHOLD SIZE
128
LABOR FORCE [ PEOPLE ]
79.5%
PERCENT IN LABOR FORCE
14.1%
UNEMPLOYMENT RATE
Fordyce Zip Codes
Fordyce Area Codes
Income in Fordyce
Income Overview in Fordyce
Per Capita Income in Fordyce is $25,928, while median incomes of families and households are $81,000 and $55,625 respectively.
| Characteristic | Number | Measure |
| Per Capita Income | 237 | $25,928 |
| Median Family Income | 60 | $81,000 |
| Mean Family Income | 60 | $78,047 |
| Median Household Income | 81 | $55,625 |
| Mean Household Income | 81 | $68,643 |
| Income Deficit | 60 | $0 |
| Wage / Income Gap (%) | 237 | 32.93% |
| Wage / Income Gap ($) | 237 | 67.07¢ per $1 |
| Gini / Inequality Index | 237 | 0.37 |
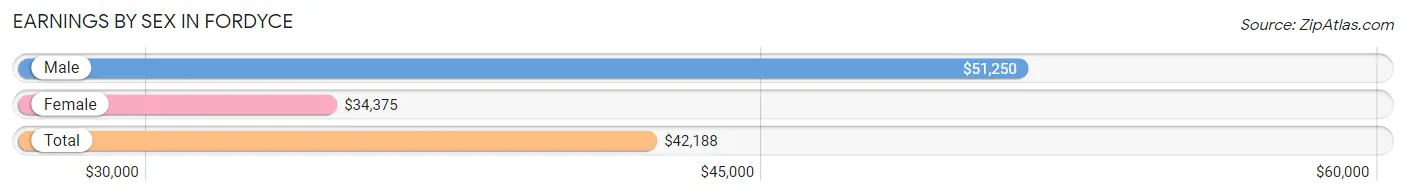
Earnings by Sex in Fordyce
Average Earnings in Fordyce are $42,188, $51,250 for men and $34,375 for women, a difference of 32.9%.
| Sex | Number | Average Earnings |
| Male | 70 (53.0%) | $51,250 |
| Female | 62 (47.0%) | $34,375 |
| Total | 132 (100.0%) | $42,188 |
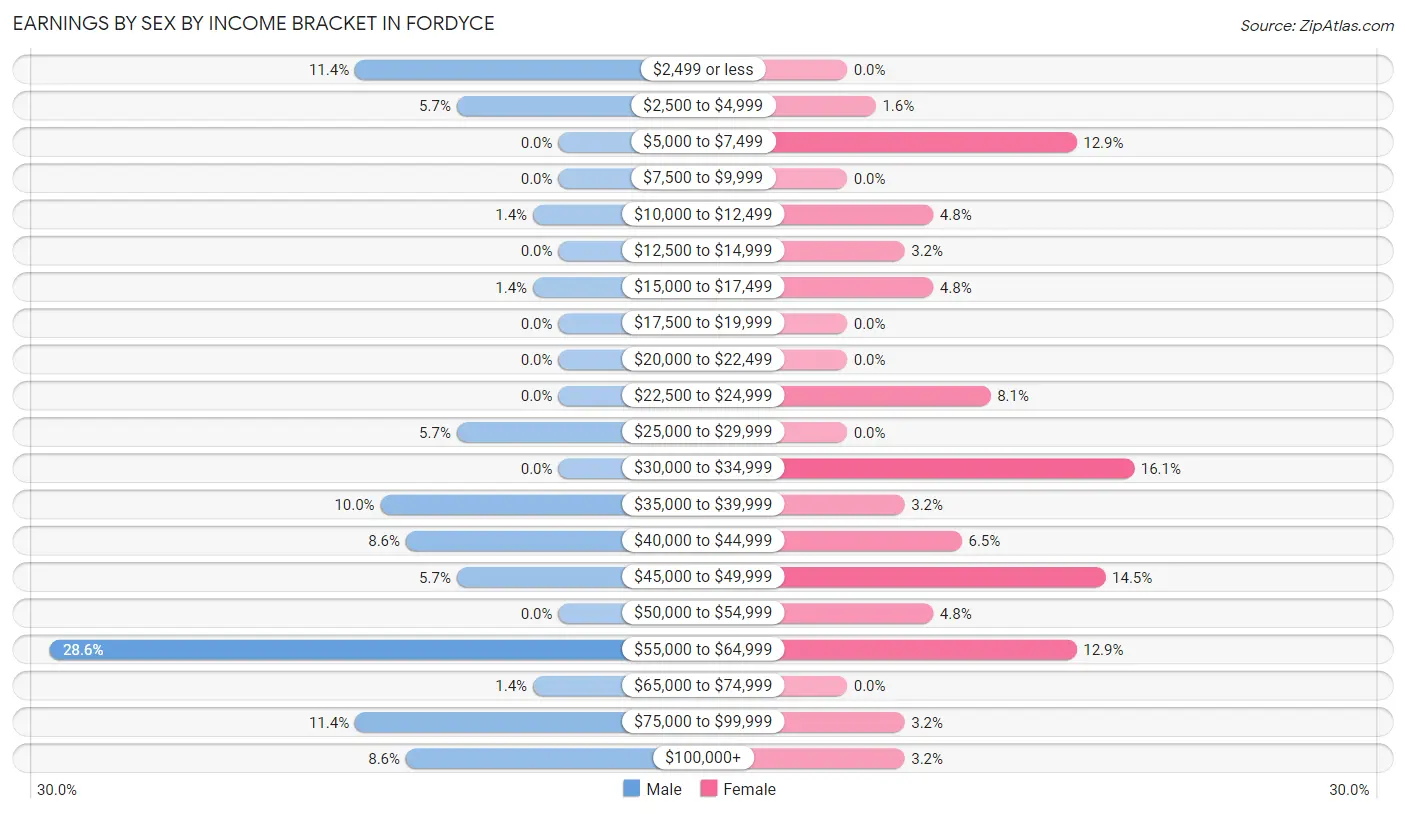
Earnings by Sex by Income Bracket in Fordyce
The most common earnings brackets in Fordyce are $55,000 to $64,999 for men (20 | 28.6%) and $30,000 to $34,999 for women (10 | 16.1%).
| Income | Male | Female |
| $2,499 or less | 8 (11.4%) | 0 (0.0%) |
| $2,500 to $4,999 | 4 (5.7%) | 1 (1.6%) |
| $5,000 to $7,499 | 0 (0.0%) | 8 (12.9%) |
| $7,500 to $9,999 | 0 (0.0%) | 0 (0.0%) |
| $10,000 to $12,499 | 1 (1.4%) | 3 (4.8%) |
| $12,500 to $14,999 | 0 (0.0%) | 2 (3.2%) |
| $15,000 to $17,499 | 1 (1.4%) | 3 (4.8%) |
| $17,500 to $19,999 | 0 (0.0%) | 0 (0.0%) |
| $20,000 to $22,499 | 0 (0.0%) | 0 (0.0%) |
| $22,500 to $24,999 | 0 (0.0%) | 5 (8.1%) |
| $25,000 to $29,999 | 4 (5.7%) | 0 (0.0%) |
| $30,000 to $34,999 | 0 (0.0%) | 10 (16.1%) |
| $35,000 to $39,999 | 7 (10.0%) | 2 (3.2%) |
| $40,000 to $44,999 | 6 (8.6%) | 4 (6.5%) |
| $45,000 to $49,999 | 4 (5.7%) | 9 (14.5%) |
| $50,000 to $54,999 | 0 (0.0%) | 3 (4.8%) |
| $55,000 to $64,999 | 20 (28.6%) | 8 (12.9%) |
| $65,000 to $74,999 | 1 (1.4%) | 0 (0.0%) |
| $75,000 to $99,999 | 8 (11.4%) | 2 (3.2%) |
| $100,000+ | 6 (8.6%) | 2 (3.2%) |
| Total | 70 (100.0%) | 62 (100.0%) |
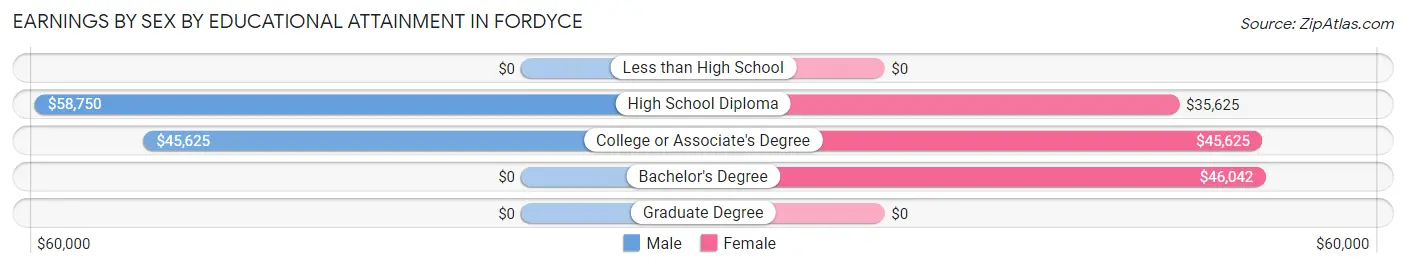
Earnings by Sex by Educational Attainment in Fordyce
Average earnings in Fordyce are $56,442 for men and $45,469 for women, a difference of 19.4%. Men with an educational attainment of high school diploma enjoy the highest average annual earnings of $58,750, while those with college or associate's degree education earn the least with $45,625. Women with an educational attainment of bachelor's degree earn the most with the average annual earnings of $46,042, while those with high school diploma education have the smallest earnings of $35,625.
| Educational Attainment | Male Income | Female Income |
| Less than High School | - | - |
| High School Diploma | $58,750 | $35,625 |
| College or Associate's Degree | $45,625 | $45,625 |
| Bachelor's Degree | - | - |
| Graduate Degree | - | - |
| Total | $56,442 | $45,469 |
Family Income in Fordyce
Family Income Brackets in Fordyce
According to the Fordyce family income data, there are 18 families falling into the $75,000 to $99,999 income range, which is the most common income bracket and makes up 30.0% of all families.
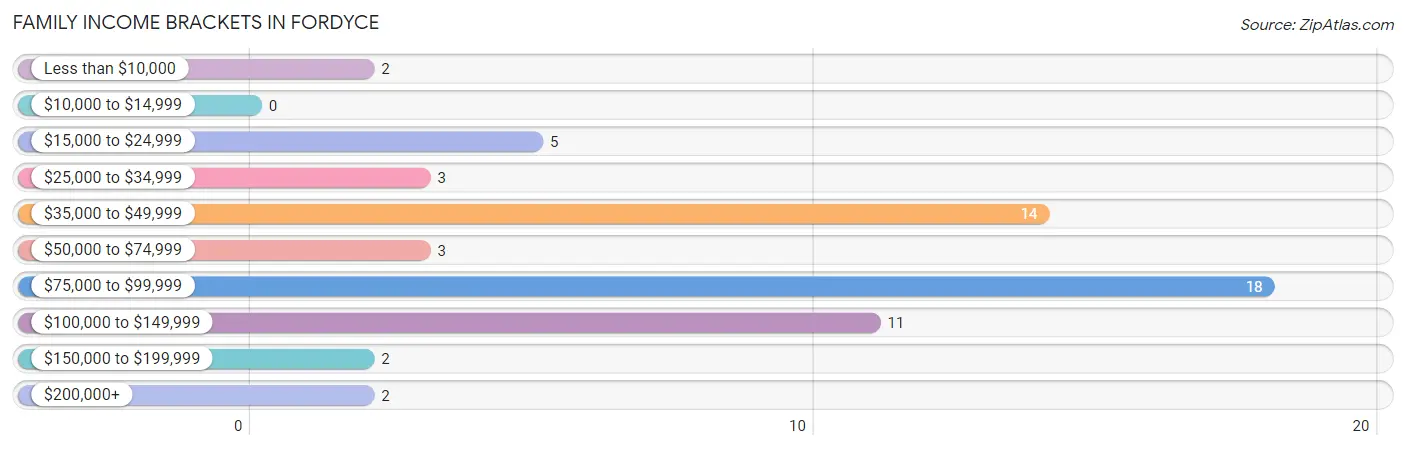
| Income Bracket | # Families | % Families |
| Less than $10,000 | 2 | 3.3% |
| $10,000 to $14,999 | 0 | 0.0% |
| $15,000 to $24,999 | 5 | 8.3% |
| $25,000 to $34,999 | 3 | 5.0% |
| $35,000 to $49,999 | 14 | 23.3% |
| $50,000 to $74,999 | 3 | 5.0% |
| $75,000 to $99,999 | 18 | 30.0% |
| $100,000 to $149,999 | 11 | 18.3% |
| $150,000 to $199,999 | 2 | 3.3% |
| $200,000+ | 2 | 3.3% |
Family Income by Famaliy Size in Fordyce
3-person families (12 | 20.0%) account for the highest median family income in Fordyce with $106,667 per family, while 3-person families (12 | 20.0%) have the highest median income of $35,556 per family member.
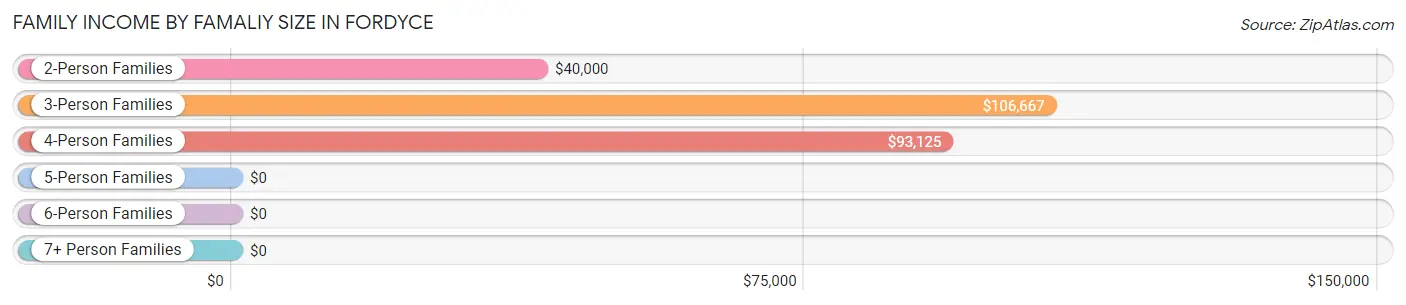
| Income Bracket | # Families | Median Income |
| 2-Person Families | 26 (43.3%) | $40,000 |
| 3-Person Families | 12 (20.0%) | $106,667 |
| 4-Person Families | 14 (23.3%) | $93,125 |
| 5-Person Families | 0 (0.0%) | $0 |
| 6-Person Families | 2 (3.3%) | $0 |
| 7+ Person Families | 6 (10.0%) | $0 |
| Total | 60 (100.0%) | $81,000 |
Family Income by Number of Earners in Fordyce
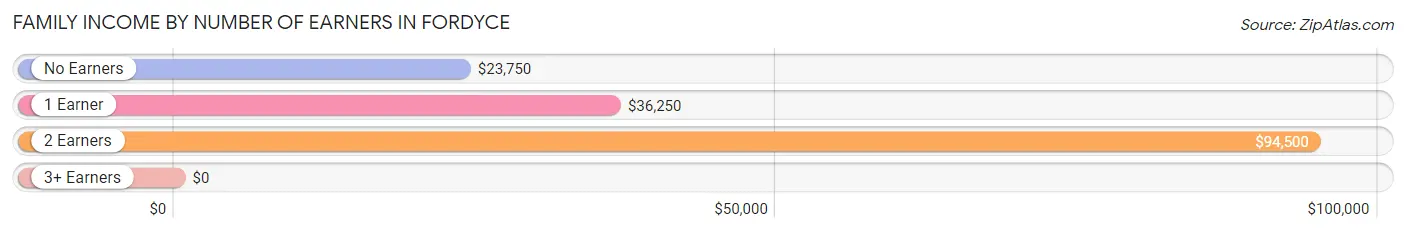
| Number of Earners | # Families | Median Income |
| No Earners | 6 (10.0%) | $23,750 |
| 1 Earner | 12 (20.0%) | $36,250 |
| 2 Earners | 32 (53.3%) | $94,500 |
| 3+ Earners | 10 (16.7%) | $0 |
| Total | 60 (100.0%) | $81,000 |
Household Income in Fordyce
Household Income Brackets in Fordyce
With 18 households falling in the category, the $75,000 to $99,999 income range is the most frequent in Fordyce, accounting for 22.2% of all households. In contrast, only 1 households (1.2%) fall into the $10,000 to $14,999 income bracket, making it the least populous group.
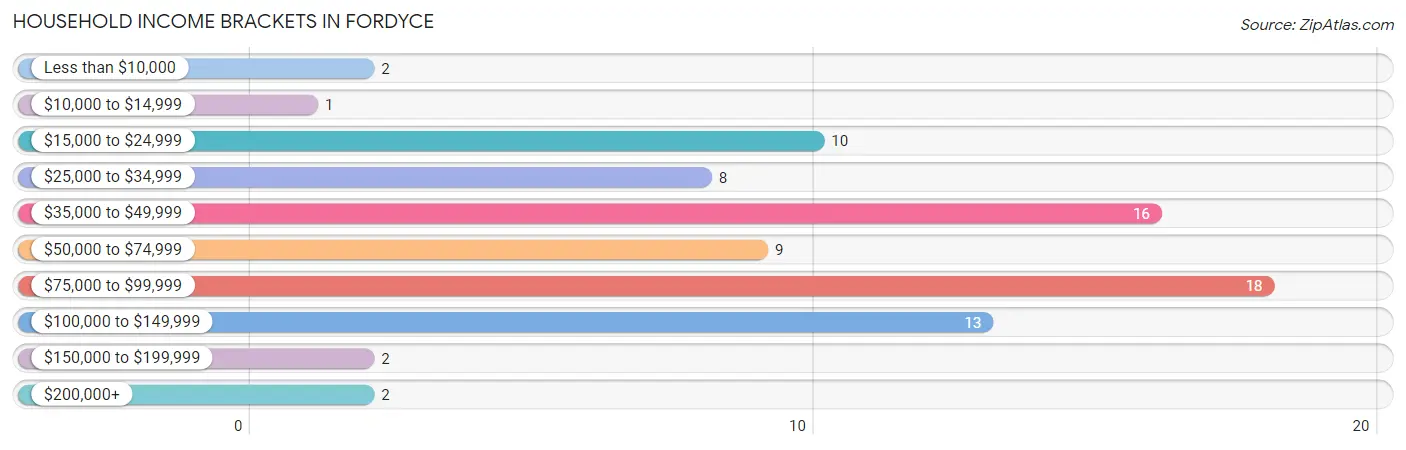
| Income Bracket | # Households | % Households |
| Less than $10,000 | 2 | 2.5% |
| $10,000 to $14,999 | 1 | 1.2% |
| $15,000 to $24,999 | 10 | 12.3% |
| $25,000 to $34,999 | 8 | 9.9% |
| $35,000 to $49,999 | 16 | 19.8% |
| $50,000 to $74,999 | 9 | 11.1% |
| $75,000 to $99,999 | 18 | 22.2% |
| $100,000 to $149,999 | 13 | 16.0% |
| $150,000 to $199,999 | 2 | 2.5% |
| $200,000+ | 2 | 2.5% |
Household Income by Householder Age in Fordyce
The median household income in Fordyce is $55,625, with the highest median household income of $91,250 found in the 25 to 44 years age bracket for the primary householder. A total of 33 households (40.7%) fall into this category. Meanwhile, the 15 to 24 years age bracket for the primary householder has the lowest median household income of $20,417, with 7 households (8.6%) in this group.
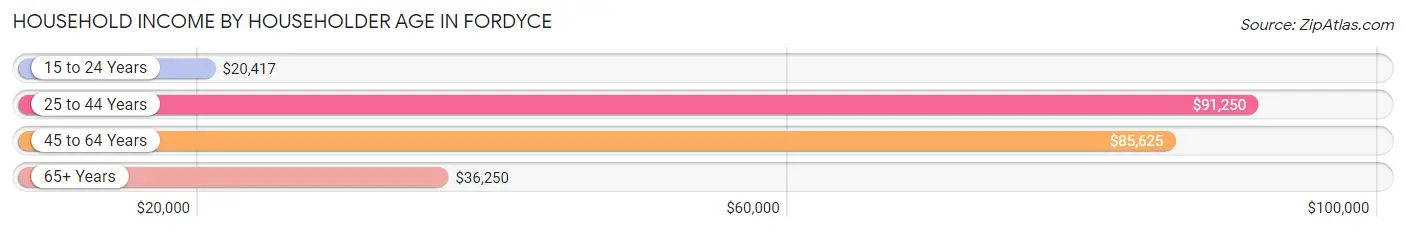
| Income Bracket | # Households | Median Income |
| 15 to 24 Years | 7 (8.6%) | $20,417 |
| 25 to 44 Years | 33 (40.7%) | $91,250 |
| 45 to 64 Years | 17 (21.0%) | $85,625 |
| 65+ Years | 24 (29.6%) | $36,250 |
| Total | 81 (100.0%) | $55,625 |
Poverty in Fordyce
Income Below Poverty by Sex and Age in Fordyce
With 11.6% poverty level for males and 27.6% for females among the residents of Fordyce, 16 and 17 year old males and 12 to 14 year old females are the most vulnerable to poverty, with 4 males (100.0%) and 6 females (100.0%) in their respective age groups living below the poverty level.
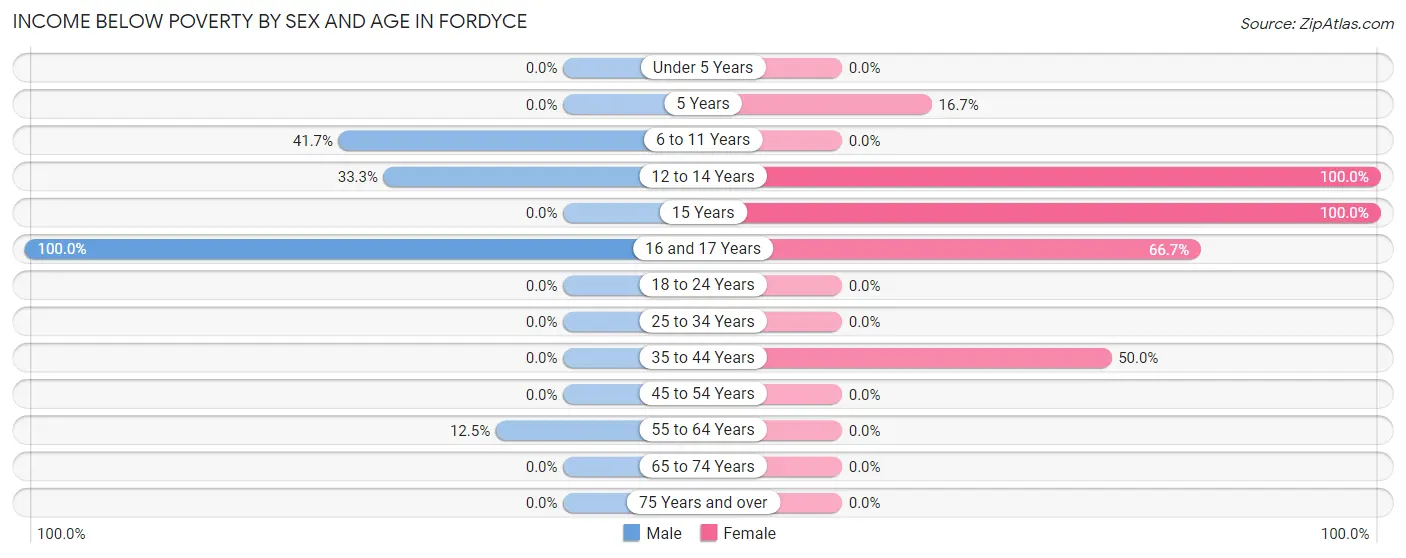
| Age Bracket | Male | Female |
| Under 5 Years | 0 (0.0%) | 0 (0.0%) |
| 5 Years | 0 (0.0%) | 1 (16.7%) |
| 6 to 11 Years | 5 (41.7%) | 0 (0.0%) |
| 12 to 14 Years | 3 (33.3%) | 6 (100.0%) |
| 15 Years | 0 (0.0%) | 9 (100.0%) |
| 16 and 17 Years | 4 (100.0%) | 8 (66.7%) |
| 18 to 24 Years | 0 (0.0%) | 0 (0.0%) |
| 25 to 34 Years | 0 (0.0%) | 0 (0.0%) |
| 35 to 44 Years | 0 (0.0%) | 8 (50.0%) |
| 45 to 54 Years | 0 (0.0%) | 0 (0.0%) |
| 55 to 64 Years | 2 (12.5%) | 0 (0.0%) |
| 65 to 74 Years | 0 (0.0%) | 0 (0.0%) |
| 75 Years and over | 0 (0.0%) | 0 (0.0%) |
| Total | 14 (11.6%) | 32 (27.6%) |
Income Above Poverty by Sex and Age in Fordyce
According to the poverty statistics in Fordyce, males aged under 5 years and females aged under 5 years are the age groups that are most secure financially, with 100.0% of males and 100.0% of females in these age groups living above the poverty line.
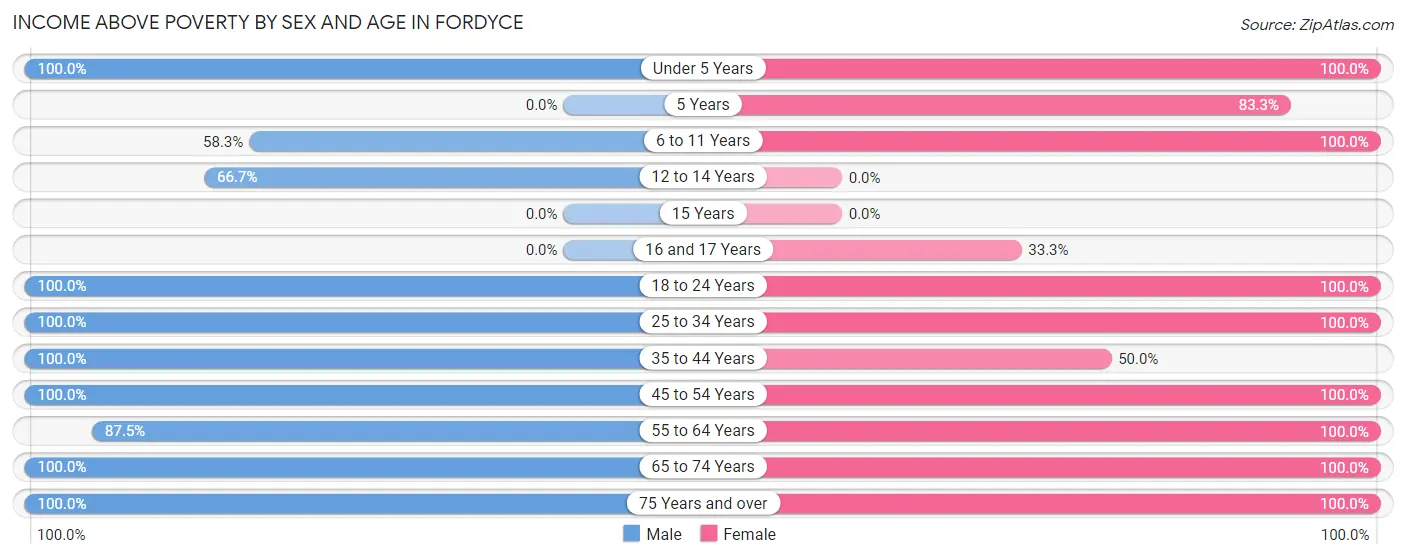
| Age Bracket | Male | Female |
| Under 5 Years | 17 (100.0%) | 15 (100.0%) |
| 5 Years | 0 (0.0%) | 5 (83.3%) |
| 6 to 11 Years | 7 (58.3%) | 2 (100.0%) |
| 12 to 14 Years | 6 (66.7%) | 0 (0.0%) |
| 15 Years | 0 (0.0%) | 0 (0.0%) |
| 16 and 17 Years | 0 (0.0%) | 4 (33.3%) |
| 18 to 24 Years | 11 (100.0%) | 9 (100.0%) |
| 25 to 34 Years | 17 (100.0%) | 13 (100.0%) |
| 35 to 44 Years | 18 (100.0%) | 8 (50.0%) |
| 45 to 54 Years | 1 (100.0%) | 2 (100.0%) |
| 55 to 64 Years | 14 (87.5%) | 12 (100.0%) |
| 65 to 74 Years | 13 (100.0%) | 9 (100.0%) |
| 75 Years and over | 3 (100.0%) | 5 (100.0%) |
| Total | 107 (88.4%) | 84 (72.4%) |
Income Below Poverty Among Married-Couple Families in Fordyce
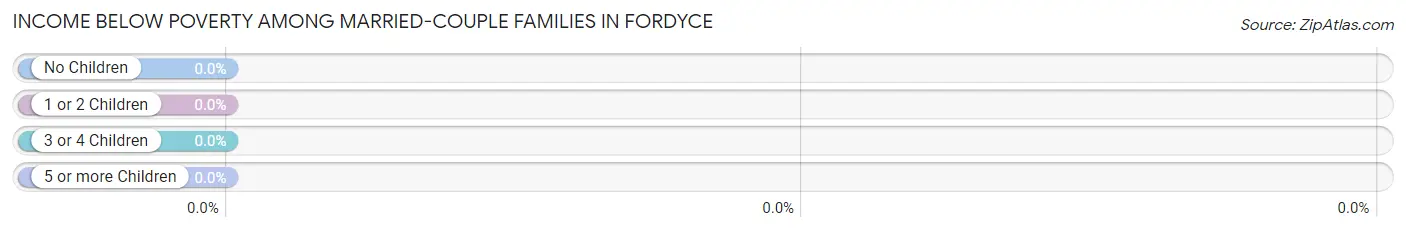
| Children | Above Poverty | Below Poverty |
| No Children | 26 (100.0%) | 0 (0.0%) |
| 1 or 2 Children | 18 (100.0%) | 0 (0.0%) |
| 3 or 4 Children | 2 (100.0%) | 0 (0.0%) |
| 5 or more Children | 0 (0.0%) | 0 (0.0%) |
| Total | 46 (100.0%) | 0 (0.0%) |
Income Below Poverty Among Single-Parent Households in Fordyce
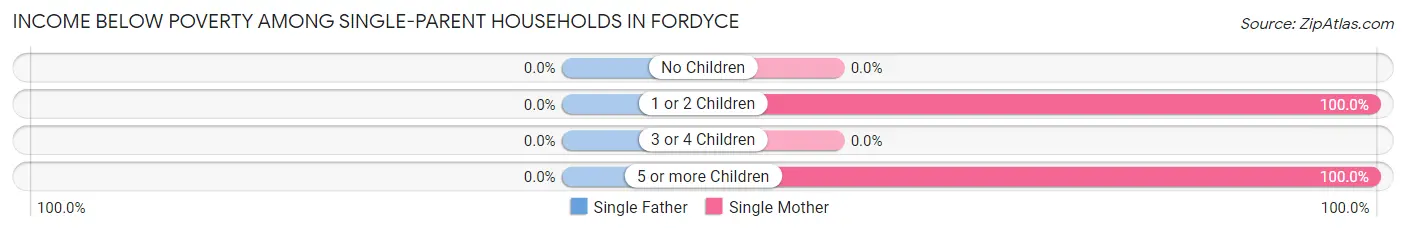
| Children | Single Father | Single Mother |
| No Children | 0 (0.0%) | 0 (0.0%) |
| 1 or 2 Children | 0 (0.0%) | 2 (100.0%) |
| 3 or 4 Children | 0 (0.0%) | 0 (0.0%) |
| 5 or more Children | 0 (0.0%) | 6 (100.0%) |
| Total | 0 (0.0%) | 8 (100.0%) |
Income Below Poverty Among Married-Couple vs Single-Parent Households in Fordyce
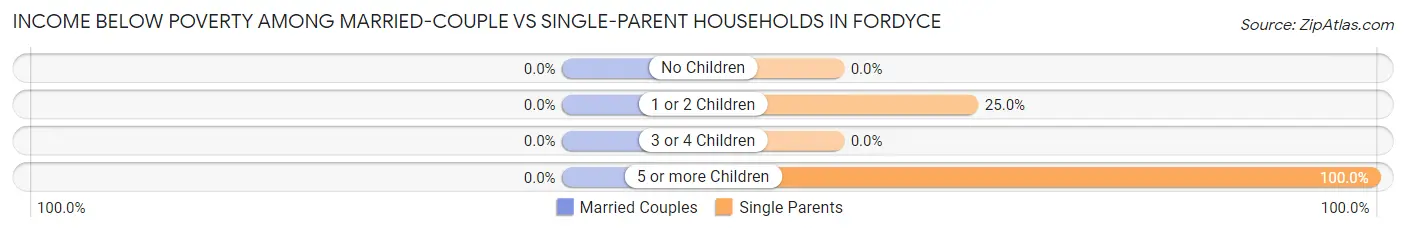
| Children | Married-Couple Families | Single-Parent Households |
| No Children | 0 (0.0%) | 0 (0.0%) |
| 1 or 2 Children | 0 (0.0%) | 2 (25.0%) |
| 3 or 4 Children | 0 (0.0%) | 0 (0.0%) |
| 5 or more Children | 0 (0.0%) | 6 (100.0%) |
| Total | 0 (0.0%) | 8 (57.1%) |
Race in Fordyce
The most populous races in Fordyce are White / Caucasian (219 | 92.4%), Hispanic or Latino (34 | 14.3%), and Two or more Races (11 | 4.6%).
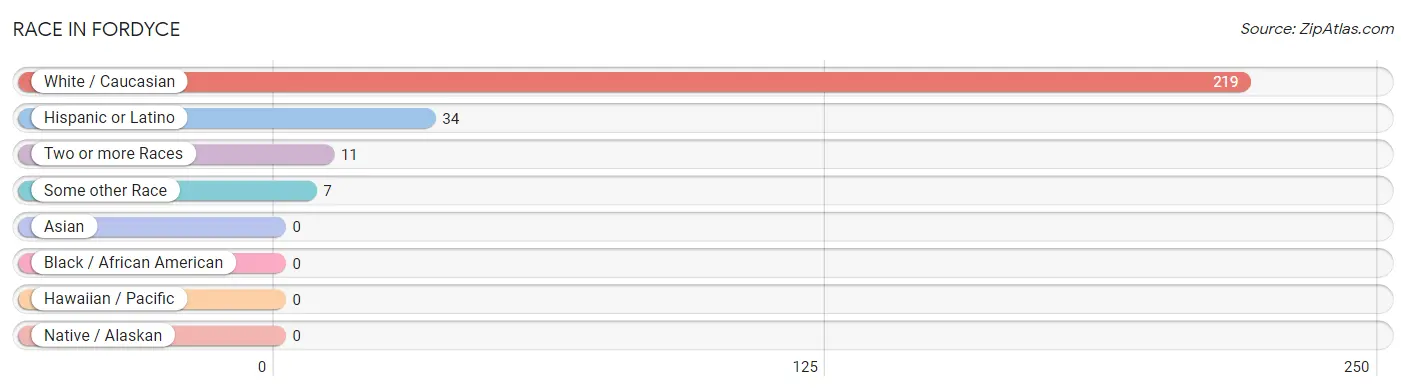
| Race | # Population | % Population |
| Asian | 0 | 0.0% |
| Black / African American | 0 | 0.0% |
| Hawaiian / Pacific | 0 | 0.0% |
| Hispanic or Latino | 34 | 14.3% |
| Native / Alaskan | 0 | 0.0% |
| White / Caucasian | 219 | 92.4% |
| Two or more Races | 11 | 4.6% |
| Some other Race | 7 | 2.9% |
| Total | 237 | 100.0% |
Ancestry in Fordyce
The most populous ancestries reported in Fordyce are German (139 | 58.7%), Dutch (31 | 13.1%), French (19 | 8.0%), Irish (19 | 8.0%), and Mexican (19 | 8.0%), together accounting for 95.8% of all Fordyce residents.
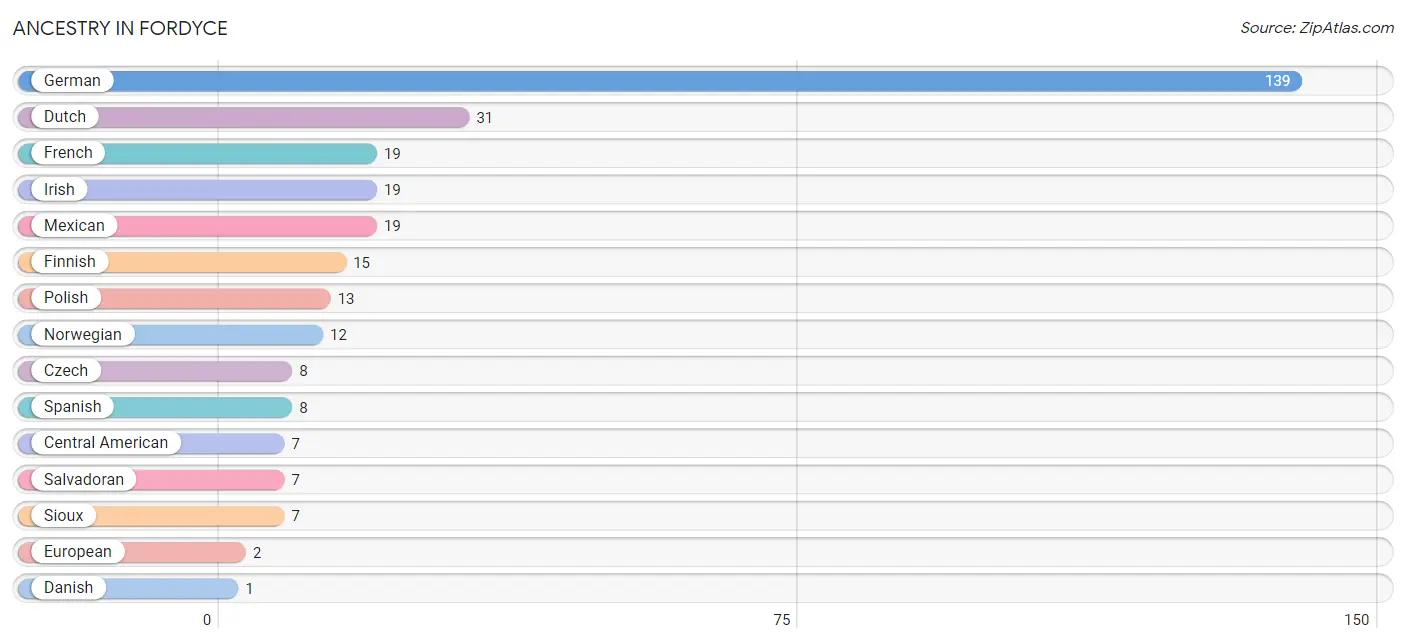
| Ancestry | # Population | % Population |
| Central American | 7 | 2.9% |
| Czech | 8 | 3.4% |
| Danish | 1 | 0.4% |
| Dutch | 31 | 13.1% |
| European | 2 | 0.8% |
| Finnish | 15 | 6.3% |
| French | 19 | 8.0% |
| German | 139 | 58.7% |
| Irish | 19 | 8.0% |
| Mexican | 19 | 8.0% |
| Norwegian | 12 | 5.1% |
| Polish | 13 | 5.5% |
| Salvadoran | 7 | 2.9% |
| Sioux | 7 | 2.9% |
| Spanish | 8 | 3.4% | View All 15 Rows |
Immigrants in Fordyce
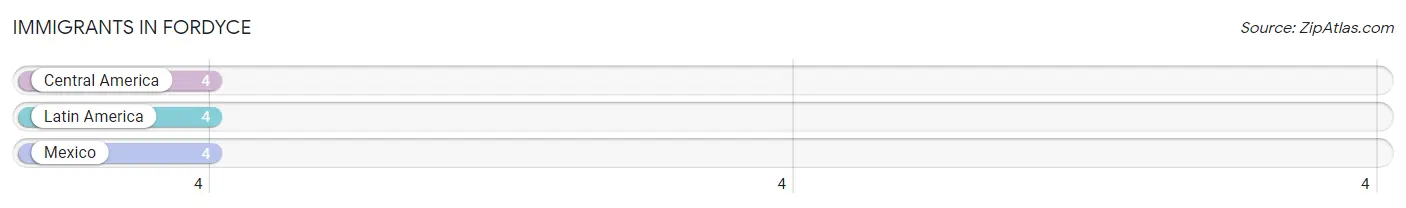
The most numerous immigrant groups reported in Fordyce came from Central America (4 | 1.7%), Latin America (4 | 1.7%), and Mexico (4 | 1.7%), together accounting for 5.1% of all Fordyce residents.
| Immigration Origin | # Population | % Population |
| Central America | 4 | 1.7% |
| Latin America | 4 | 1.7% |
| Mexico | 4 | 1.7% | View All 3 Rows |
Sex and Age in Fordyce
Sex and Age in Fordyce
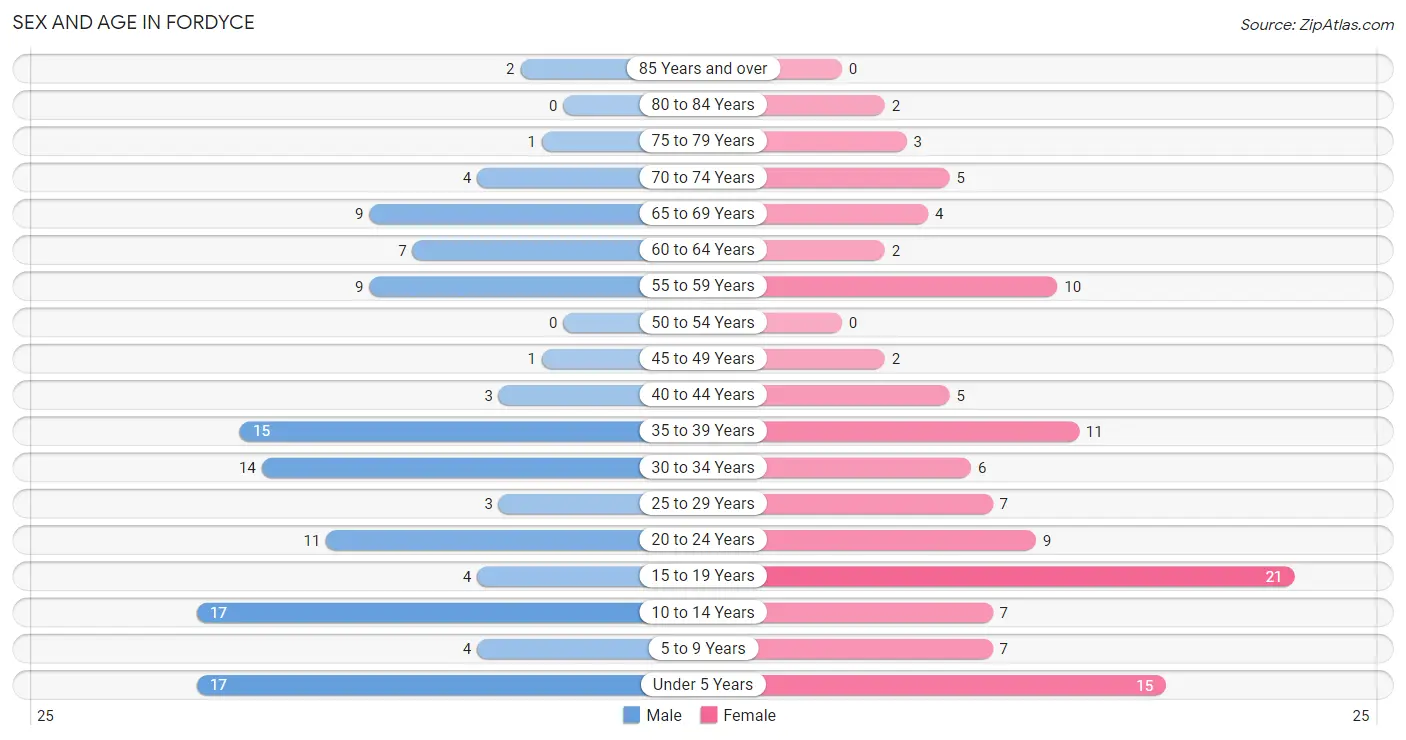
The most populous age groups in Fordyce are Under 5 Years (17 | 14.1%) for men and 15 to 19 Years (21 | 18.1%) for women.
| Age Bracket | Male | Female |
| Under 5 Years | 17 (14.1%) | 15 (12.9%) |
| 5 to 9 Years | 4 (3.3%) | 7 (6.0%) |
| 10 to 14 Years | 17 (14.1%) | 7 (6.0%) |
| 15 to 19 Years | 4 (3.3%) | 21 (18.1%) |
| 20 to 24 Years | 11 (9.1%) | 9 (7.8%) |
| 25 to 29 Years | 3 (2.5%) | 7 (6.0%) |
| 30 to 34 Years | 14 (11.6%) | 6 (5.2%) |
| 35 to 39 Years | 15 (12.4%) | 11 (9.5%) |
| 40 to 44 Years | 3 (2.5%) | 5 (4.3%) |
| 45 to 49 Years | 1 (0.8%) | 2 (1.7%) |
| 50 to 54 Years | 0 (0.0%) | 0 (0.0%) |
| 55 to 59 Years | 9 (7.4%) | 10 (8.6%) |
| 60 to 64 Years | 7 (5.8%) | 2 (1.7%) |
| 65 to 69 Years | 9 (7.4%) | 4 (3.5%) |
| 70 to 74 Years | 4 (3.3%) | 5 (4.3%) |
| 75 to 79 Years | 1 (0.8%) | 3 (2.6%) |
| 80 to 84 Years | 0 (0.0%) | 2 (1.7%) |
| 85 Years and over | 2 (1.7%) | 0 (0.0%) |
| Total | 121 (100.0%) | 116 (100.0%) |
Families and Households in Fordyce
Median Family Size in Fordyce
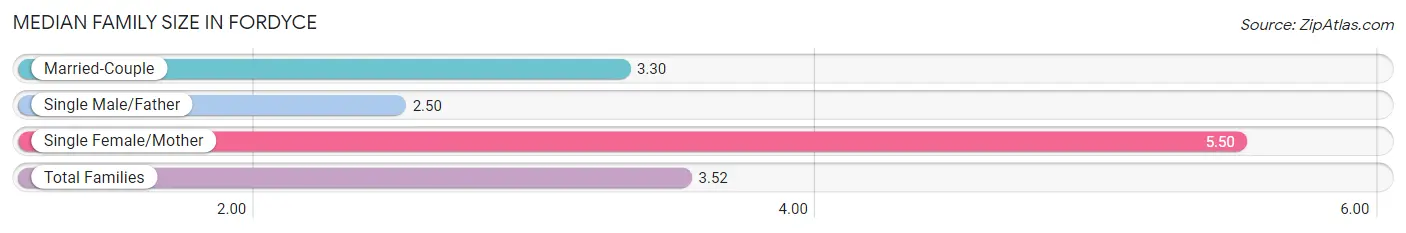
The median family size in Fordyce is 3.52 persons per family, with single female/mother families (8 | 13.3%) accounting for the largest median family size of 5.5 persons per family. On the other hand, single male/father families (6 | 10.0%) represent the smallest median family size with 2.50 persons per family.
| Family Type | # Families | Family Size |
| Married-Couple | 46 (76.7%) | 3.30 |
| Single Male/Father | 6 (10.0%) | 2.50 |
| Single Female/Mother | 8 (13.3%) | 5.50 |
| Total Families | 60 (100.0%) | 3.52 |
Median Household Size in Fordyce
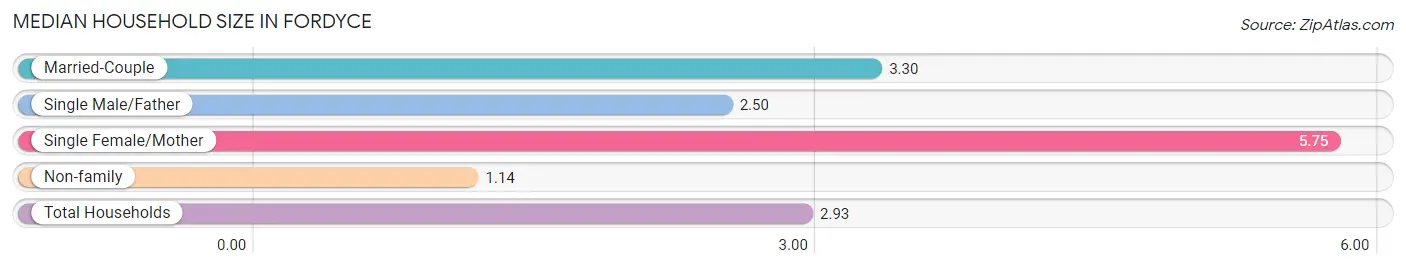
The median household size in Fordyce is 2.93 persons per household, with single female/mother households (8 | 9.9%) accounting for the largest median household size of 5.75 persons per household. non-family households (21 | 25.9%) represent the smallest median household size with 1.14 persons per household.
| Household Type | # Households | Household Size |
| Married-Couple | 46 (56.8%) | 3.30 |
| Single Male/Father | 6 (7.4%) | 2.50 |
| Single Female/Mother | 8 (9.9%) | 5.75 |
| Non-family | 21 (25.9%) | 1.14 |
| Total Households | 81 (100.0%) | 2.93 |
Household Size by Marriage Status in Fordyce
Out of a total of 81 households in Fordyce, 60 (74.1%) are family households, while 21 (25.9%) are nonfamily households. The most numerous type of family households are 2-person households, comprising 26, and the most common type of nonfamily households are 1-person households, comprising 17.
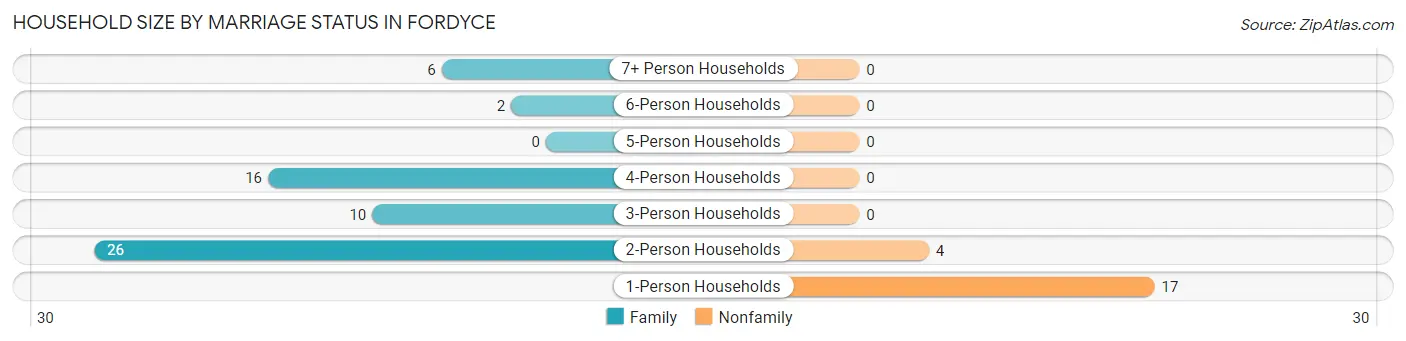
| Household Size | Family Households | Nonfamily Households |
| 1-Person Households | - | 17 (21.0%) |
| 2-Person Households | 26 (32.1%) | 4 (4.9%) |
| 3-Person Households | 10 (12.3%) | 0 (0.0%) |
| 4-Person Households | 16 (19.8%) | 0 (0.0%) |
| 5-Person Households | 0 (0.0%) | 0 (0.0%) |
| 6-Person Households | 2 (2.5%) | 0 (0.0%) |
| 7+ Person Households | 6 (7.4%) | 0 (0.0%) |
| Total | 60 (74.1%) | 21 (25.9%) |
Female Fertility in Fordyce
Fertility by Age in Fordyce
Average fertility rate in Fordyce is 98.0 births per 1,000 women. Women in the age bracket of 20 to 34 years have the highest fertility rate with 273.0 births per 1,000 women. Women in the age bracket of 20 to 34 years acount for 100.0% of all women with births.
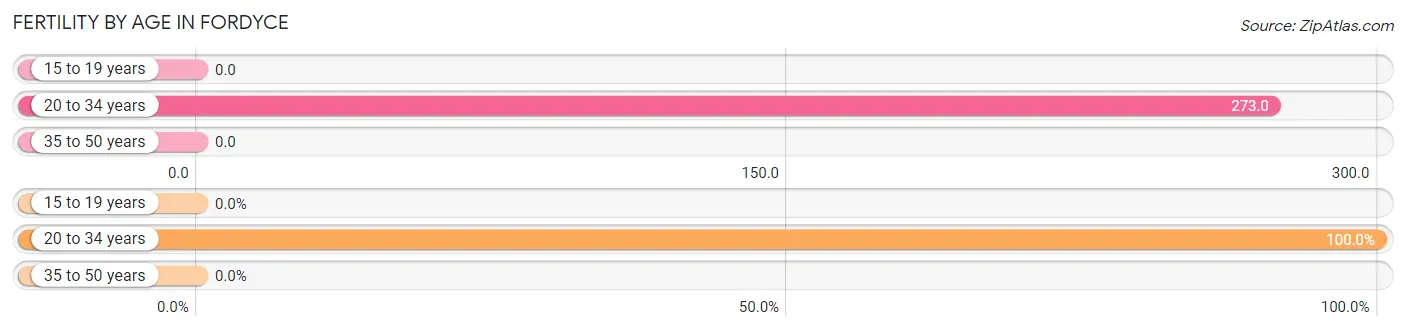
| Age Bracket | Women with Births | Births / 1,000 Women |
| 15 to 19 years | 0 (0.0%) | 0.0 |
| 20 to 34 years | 6 (100.0%) | 273.0 |
| 35 to 50 years | 0 (0.0%) | 0.0 |
| Total | 6 (100.0%) | 98.0 |
Fertility by Age by Marriage Status in Fordyce
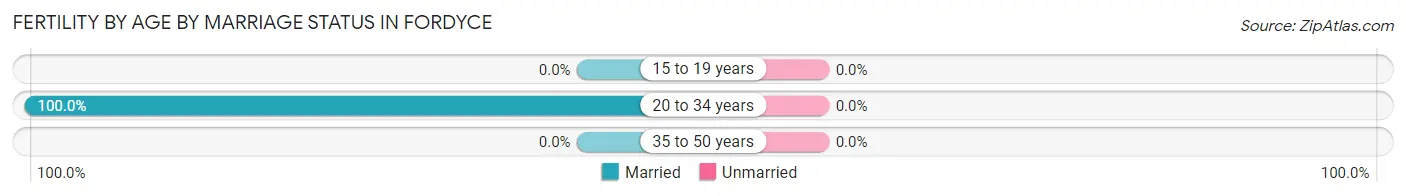
| Age Bracket | Married | Unmarried |
| 15 to 19 years | 0 (0.0%) | 0 (0.0%) |
| 20 to 34 years | 6 (100.0%) | 0 (0.0%) |
| 35 to 50 years | 0 (0.0%) | 0 (0.0%) |
| Total | 6 (100.0%) | 0 (0.0%) |
Fertility by Education in Fordyce
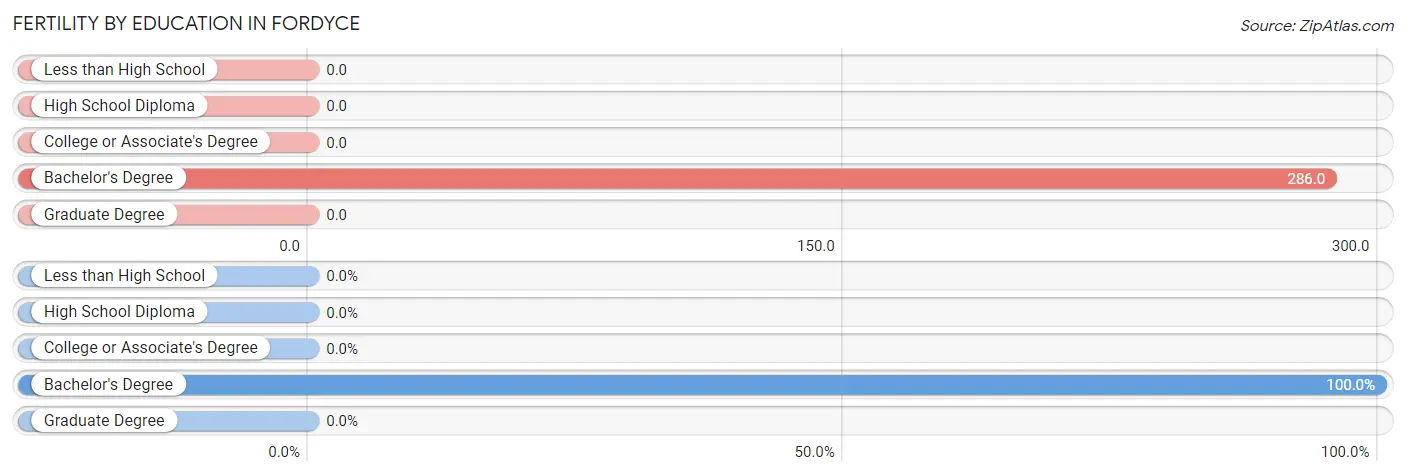
| Educational Attainment | Women with Births | Births / 1,000 Women |
| Less than High School | 0 (0.0%) | 0.0 |
| High School Diploma | 0 (0.0%) | 0.0 |
| College or Associate's Degree | 0 (0.0%) | 0.0 |
| Bachelor's Degree | 6 (100.0%) | 286.0 |
| Graduate Degree | 0 (0.0%) | 0.0 |
| Total | 6 (100.0%) | 98.0 |
Fertility by Education by Marriage Status in Fordyce
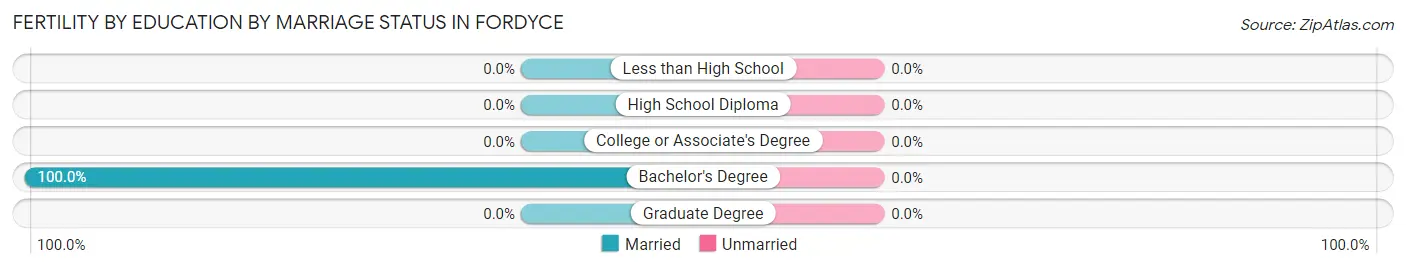
| Educational Attainment | Married | Unmarried |
| Less than High School | 0 (0.0%) | 0 (0.0%) |
| High School Diploma | 0 (0.0%) | 0 (0.0%) |
| College or Associate's Degree | 0 (0.0%) | 0 (0.0%) |
| Bachelor's Degree | 6 (100.0%) | 0 (0.0%) |
| Graduate Degree | 0 (0.0%) | 0 (0.0%) |
| Total | 6 (100.0%) | 0 (0.0%) |
Employment Characteristics in Fordyce
Employment by Class of Employer in Fordyce
Among the 109 employed individuals in Fordyce, private company employees (71 | 65.1%), not-for-profit organizations (12 | 11.0%), and self-employed (not incorporated) (10 | 9.2%) make up the most common classes of employment.
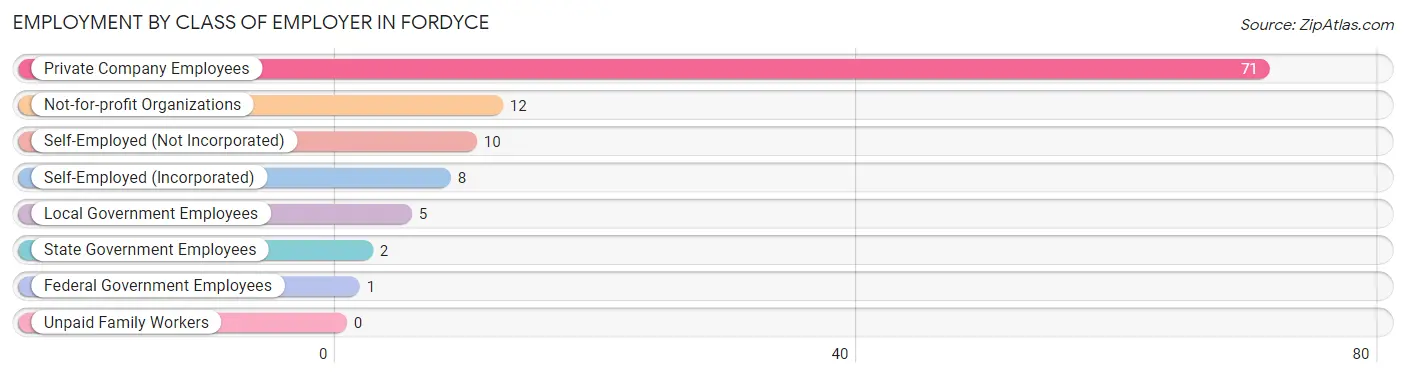
| Employer Class | # Employees | % Employees |
| Private Company Employees | 71 | 65.1% |
| Self-Employed (Incorporated) | 8 | 7.3% |
| Self-Employed (Not Incorporated) | 10 | 9.2% |
| Not-for-profit Organizations | 12 | 11.0% |
| Local Government Employees | 5 | 4.6% |
| State Government Employees | 2 | 1.8% |
| Federal Government Employees | 1 | 0.9% |
| Unpaid Family Workers | 0 | 0.0% |
| Total | 109 | 100.0% |
Employment Status by Age in Fordyce
According to the labor force statistics for Fordyce, out of the total population over 16 years of age (161), 79.5% or 128 individuals are in the labor force, with 14.1% or 18 of them unemployed. The age group with the highest labor force participation rate is 20 to 24 years, with 100.0% or 20 individuals in the labor force. Within the labor force, the 16 to 19 years age range has the highest percentage of unemployed individuals, with 66.7% or 8 of them being unemployed.
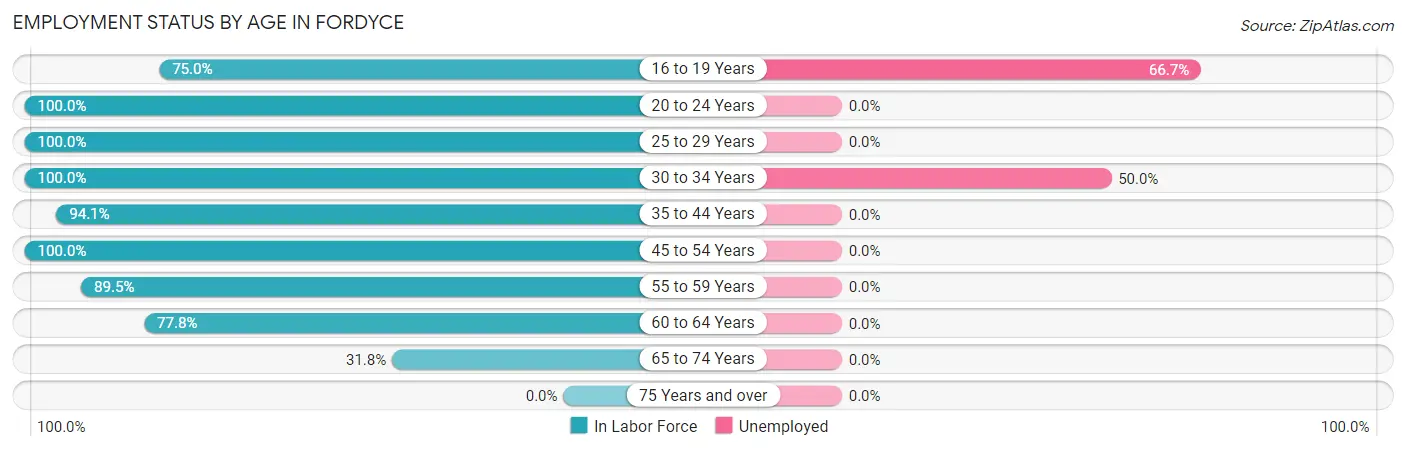
| Age Bracket | In Labor Force | Unemployed |
| 16 to 19 Years | 12 (75.0%) | 8 (66.7%) |
| 20 to 24 Years | 20 (100.0%) | 0 (0.0%) |
| 25 to 29 Years | 10 (100.0%) | 0 (0.0%) |
| 30 to 34 Years | 20 (100.0%) | 10 (50.0%) |
| 35 to 44 Years | 32 (94.1%) | 0 (0.0%) |
| 45 to 54 Years | 3 (100.0%) | 0 (0.0%) |
| 55 to 59 Years | 17 (89.5%) | 0 (0.0%) |
| 60 to 64 Years | 7 (77.8%) | 0 (0.0%) |
| 65 to 74 Years | 7 (31.8%) | 0 (0.0%) |
| 75 Years and over | 0 (0.0%) | 0 (0.0%) |
| Total | 128 (79.5%) | 18 (14.1%) |
Employment Status by Educational Attainment in Fordyce
According to labor force statistics for Fordyce, 93.7% of individuals (89) out of the total population between 25 and 64 years of age (95) are in the labor force, with 11.2% or 10 of them being unemployed. The group with the highest labor force participation rate are those with the educational attainment of less than high school, with 100.0% or 6 individuals in the labor force. Within the labor force, individuals with bachelor's degree or higher education have the highest percentage of unemployment, with 31.3% or 10 of them being unemployed.
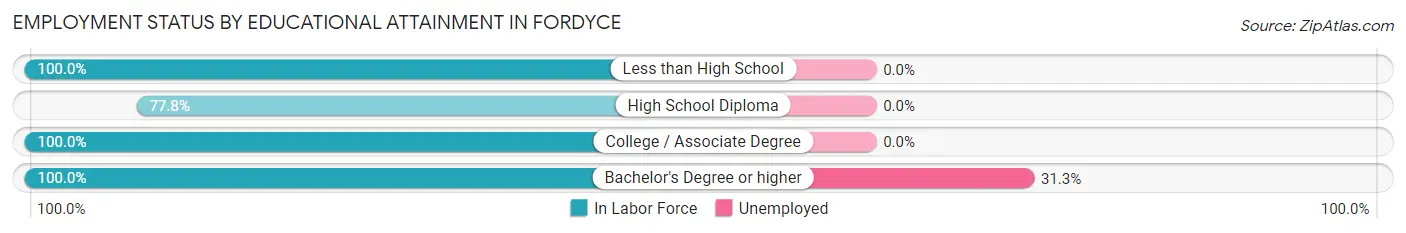
| Educational Attainment | In Labor Force | Unemployed |
| Less than High School | 6 (100.0%) | 0 (0.0%) |
| High School Diploma | 21 (77.8%) | 0 (0.0%) |
| College / Associate Degree | 30 (100.0%) | 0 (0.0%) |
| Bachelor's Degree or higher | 32 (100.0%) | 10 (31.3%) |
| Total | 89 (93.7%) | 11 (11.2%) |
Employment Occupations by Sex in Fordyce
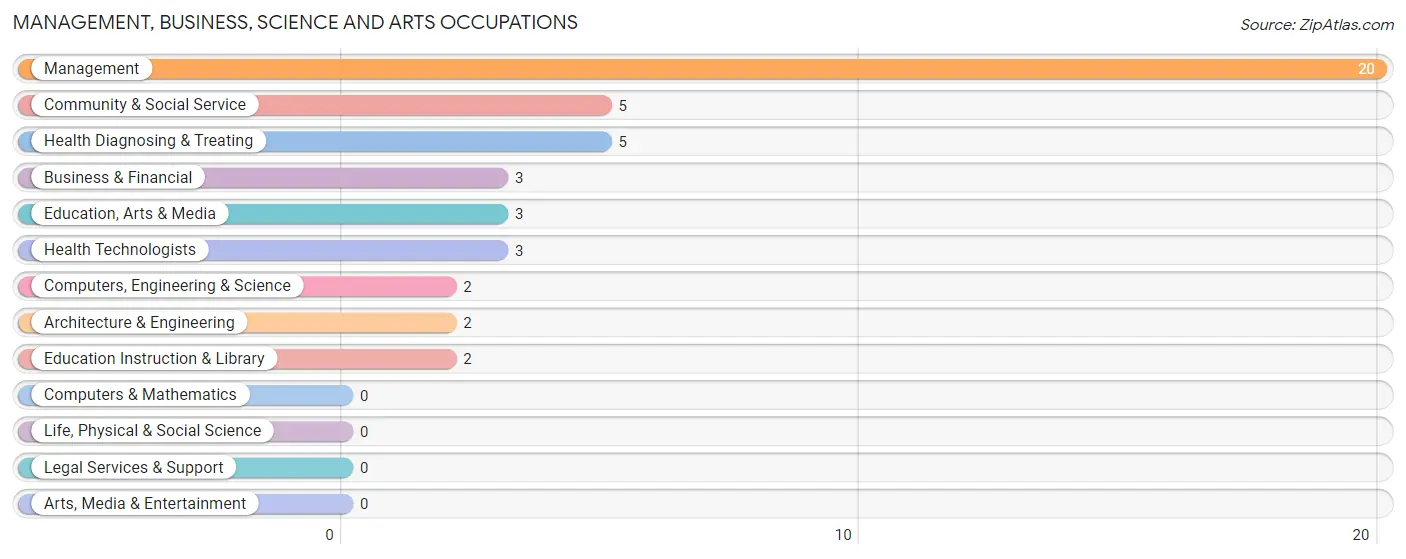
Management, Business, Science and Arts Occupations
The most common Management, Business, Science and Arts occupations in Fordyce are Management (20 | 18.2%), Community & Social Service (5 | 4.5%), Health Diagnosing & Treating (5 | 4.5%), Business & Financial (3 | 2.7%), and Education, Arts & Media (3 | 2.7%).
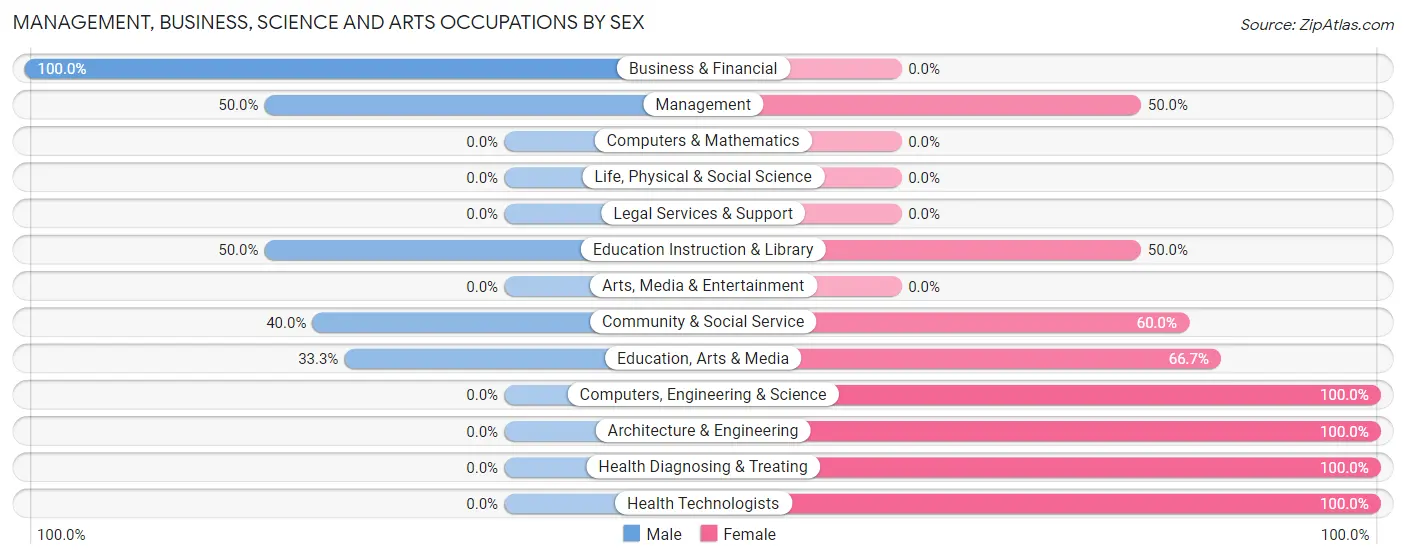
Management, Business, Science and Arts Occupations by Sex
Within the Management, Business, Science and Arts occupations in Fordyce, the most male-oriented occupations are Business & Financial (100.0%), Management (50.0%), and Education Instruction & Library (50.0%), while the most female-oriented occupations are Computers, Engineering & Science (100.0%), Architecture & Engineering (100.0%), and Health Diagnosing & Treating (100.0%).
| Occupation | Male | Female |
| Management | 10 (50.0%) | 10 (50.0%) |
| Business & Financial | 3 (100.0%) | 0 (0.0%) |
| Computers, Engineering & Science | 0 (0.0%) | 2 (100.0%) |
| Computers & Mathematics | 0 (0.0%) | 0 (0.0%) |
| Architecture & Engineering | 0 (0.0%) | 2 (100.0%) |
| Life, Physical & Social Science | 0 (0.0%) | 0 (0.0%) |
| Community & Social Service | 2 (40.0%) | 3 (60.0%) |
| Education, Arts & Media | 1 (33.3%) | 2 (66.7%) |
| Legal Services & Support | 0 (0.0%) | 0 (0.0%) |
| Education Instruction & Library | 1 (50.0%) | 1 (50.0%) |
| Arts, Media & Entertainment | 0 (0.0%) | 0 (0.0%) |
| Health Diagnosing & Treating | 0 (0.0%) | 5 (100.0%) |
| Health Technologists | 0 (0.0%) | 3 (100.0%) |
| Total (Category) | 15 (42.9%) | 20 (57.1%) |
| Total (Overall) | 58 (52.7%) | 52 (47.3%) |
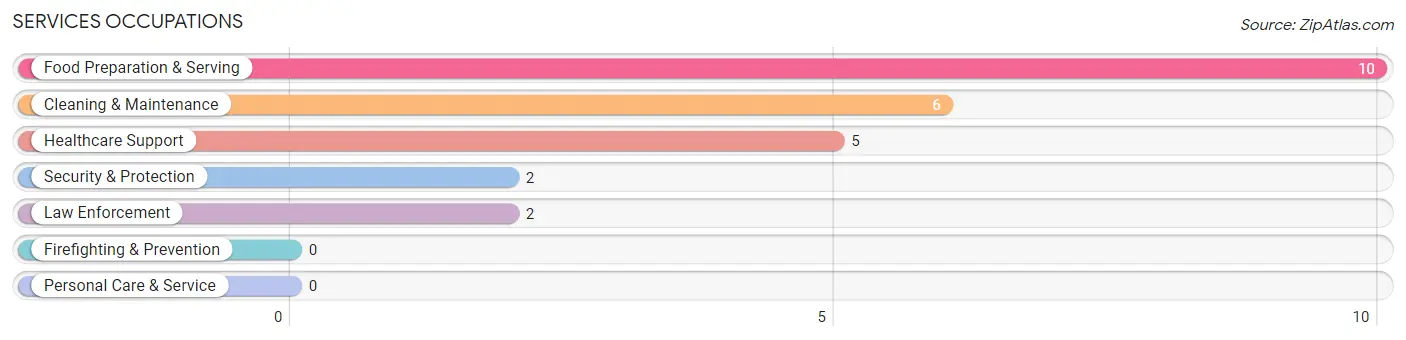
Services Occupations
The most common Services occupations in Fordyce are Food Preparation & Serving (10 | 9.1%), Cleaning & Maintenance (6 | 5.4%), Healthcare Support (5 | 4.5%), Security & Protection (2 | 1.8%), and Law Enforcement (2 | 1.8%).
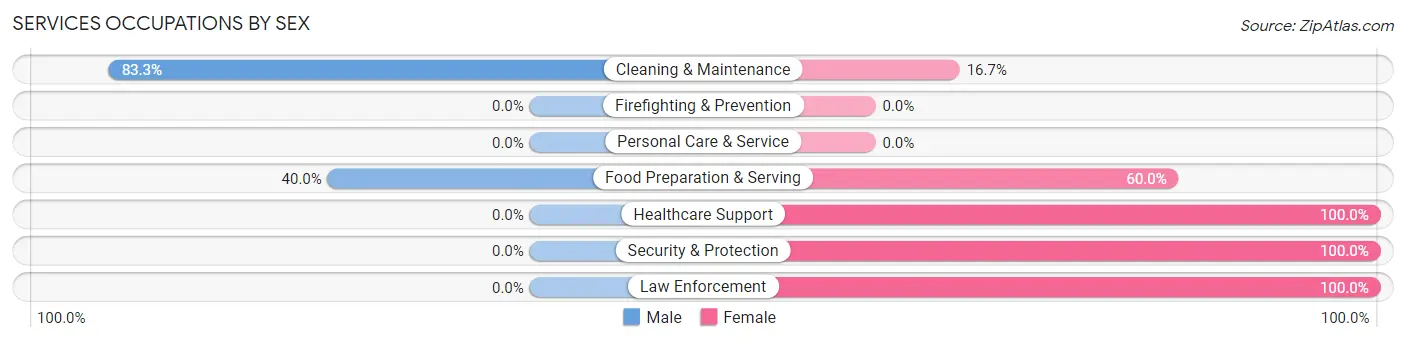
Services Occupations by Sex
Within the Services occupations in Fordyce, the most male-oriented occupations are Cleaning & Maintenance (83.3%), and Food Preparation & Serving (40.0%), while the most female-oriented occupations are Healthcare Support (100.0%), Security & Protection (100.0%), and Law Enforcement (100.0%).
| Occupation | Male | Female |
| Healthcare Support | 0 (0.0%) | 5 (100.0%) |
| Security & Protection | 0 (0.0%) | 2 (100.0%) |
| Firefighting & Prevention | 0 (0.0%) | 0 (0.0%) |
| Law Enforcement | 0 (0.0%) | 2 (100.0%) |
| Food Preparation & Serving | 4 (40.0%) | 6 (60.0%) |
| Cleaning & Maintenance | 5 (83.3%) | 1 (16.7%) |
| Personal Care & Service | 0 (0.0%) | 0 (0.0%) |
| Total (Category) | 9 (39.1%) | 14 (60.9%) |
| Total (Overall) | 58 (52.7%) | 52 (47.3%) |
Sales and Office Occupations
The most common Sales and Office occupations in Fordyce are Office & Administration (6 | 5.4%), and Sales & Related (3 | 2.7%).
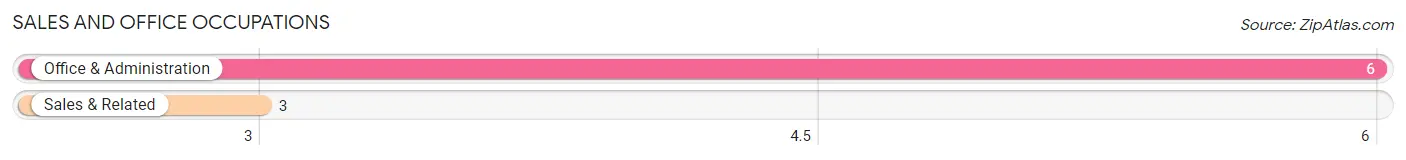
Sales and Office Occupations by Sex
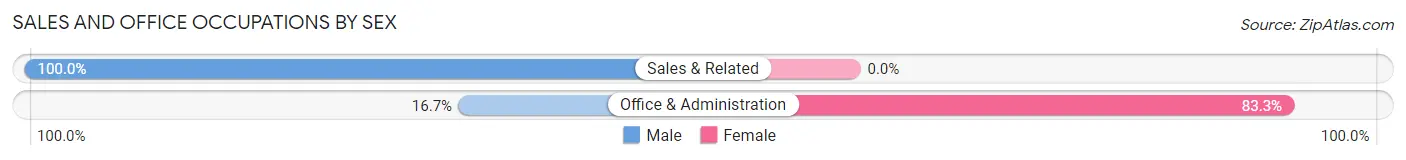
| Occupation | Male | Female |
| Sales & Related | 3 (100.0%) | 0 (0.0%) |
| Office & Administration | 1 (16.7%) | 5 (83.3%) |
| Total (Category) | 4 (44.4%) | 5 (55.6%) |
| Total (Overall) | 58 (52.7%) | 52 (47.3%) |
Natural Resources, Construction and Maintenance Occupations
The most common Natural Resources, Construction and Maintenance occupations in Fordyce are Construction & Extraction (12 | 10.9%), and Farming, Fishing & Forestry (6 | 5.4%).
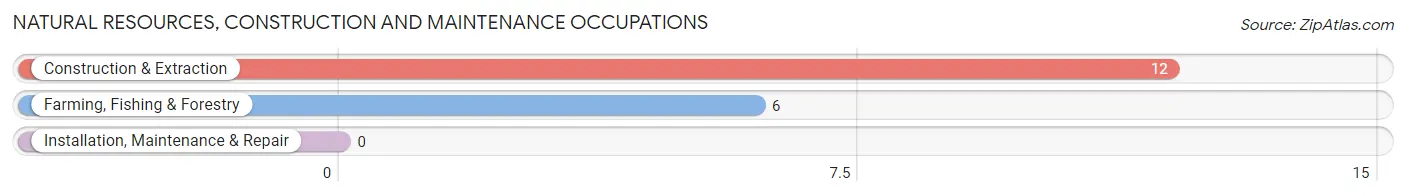
Natural Resources, Construction and Maintenance Occupations by Sex
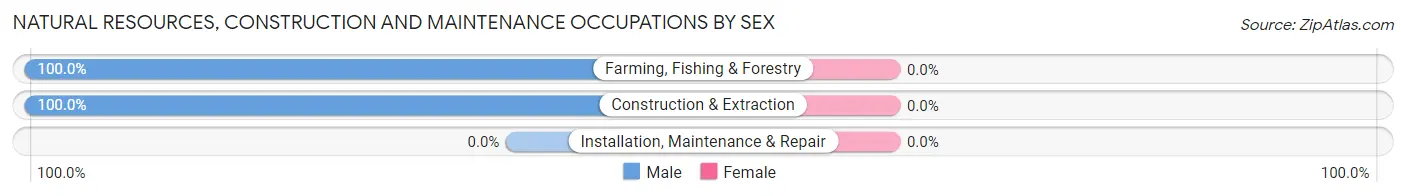
| Occupation | Male | Female |
| Farming, Fishing & Forestry | 6 (100.0%) | 0 (0.0%) |
| Construction & Extraction | 12 (100.0%) | 0 (0.0%) |
| Installation, Maintenance & Repair | 0 (0.0%) | 0 (0.0%) |
| Total (Category) | 18 (100.0%) | 0 (0.0%) |
| Total (Overall) | 58 (52.7%) | 52 (47.3%) |
Production, Transportation and Moving Occupations
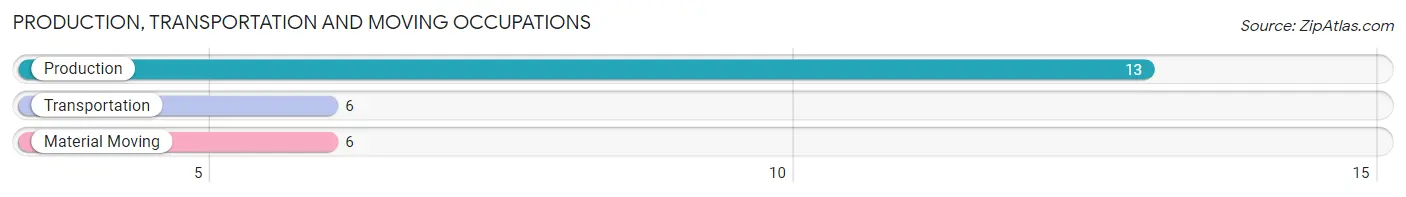
The most common Production, Transportation and Moving occupations in Fordyce are Production (13 | 11.8%), Transportation (6 | 5.4%), and Material Moving (6 | 5.4%).
Production, Transportation and Moving Occupations by Sex
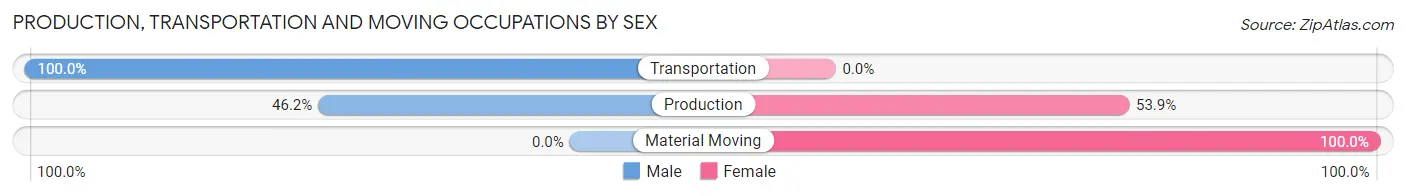
| Occupation | Male | Female |
| Production | 6 (46.2%) | 7 (53.8%) |
| Transportation | 6 (100.0%) | 0 (0.0%) |
| Material Moving | 0 (0.0%) | 6 (100.0%) |
| Total (Category) | 12 (48.0%) | 13 (52.0%) |
| Total (Overall) | 58 (52.7%) | 52 (47.3%) |
Employment Industries by Sex in Fordyce
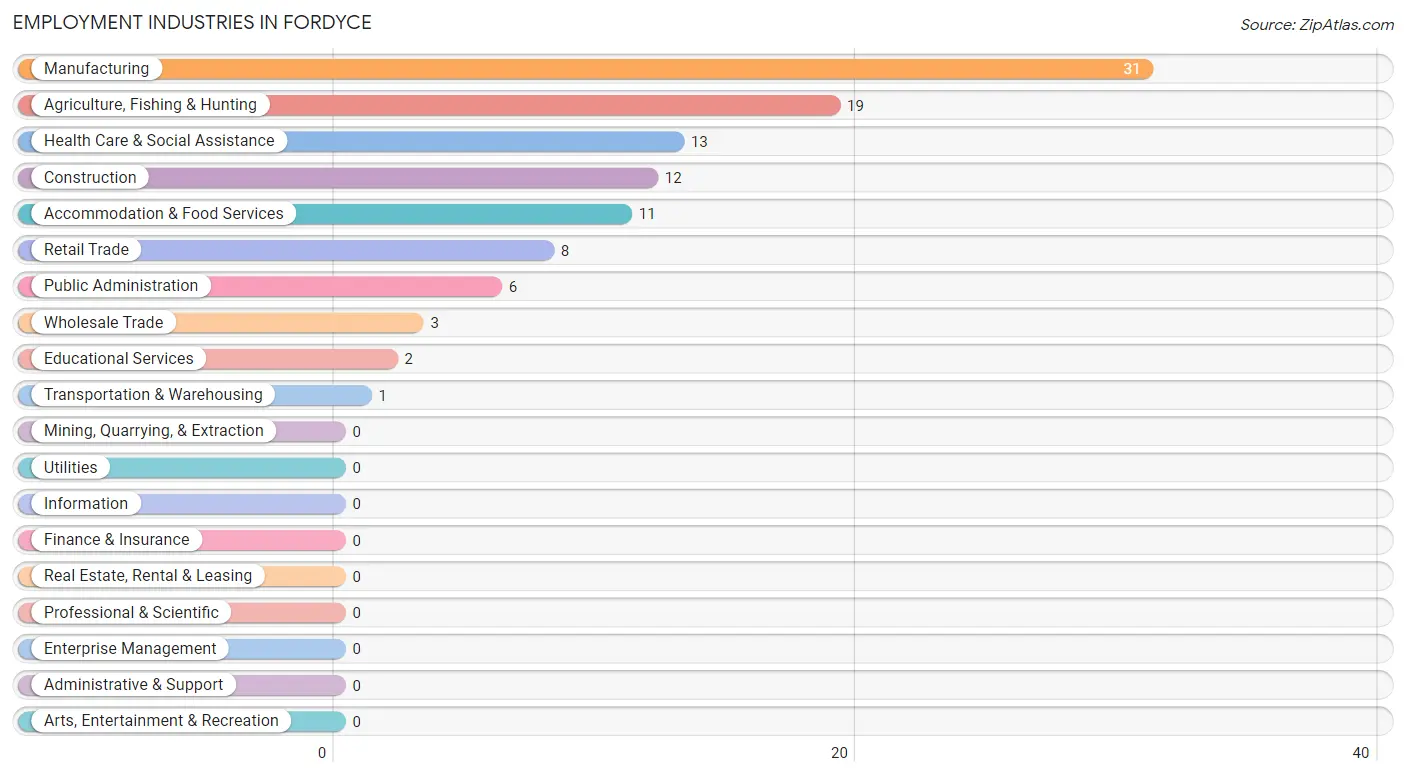
Employment Industries in Fordyce
The major employment industries in Fordyce include Manufacturing (31 | 28.2%), Agriculture, Fishing & Hunting (19 | 17.3%), Health Care & Social Assistance (13 | 11.8%), Construction (12 | 10.9%), and Accommodation & Food Services (11 | 10.0%).
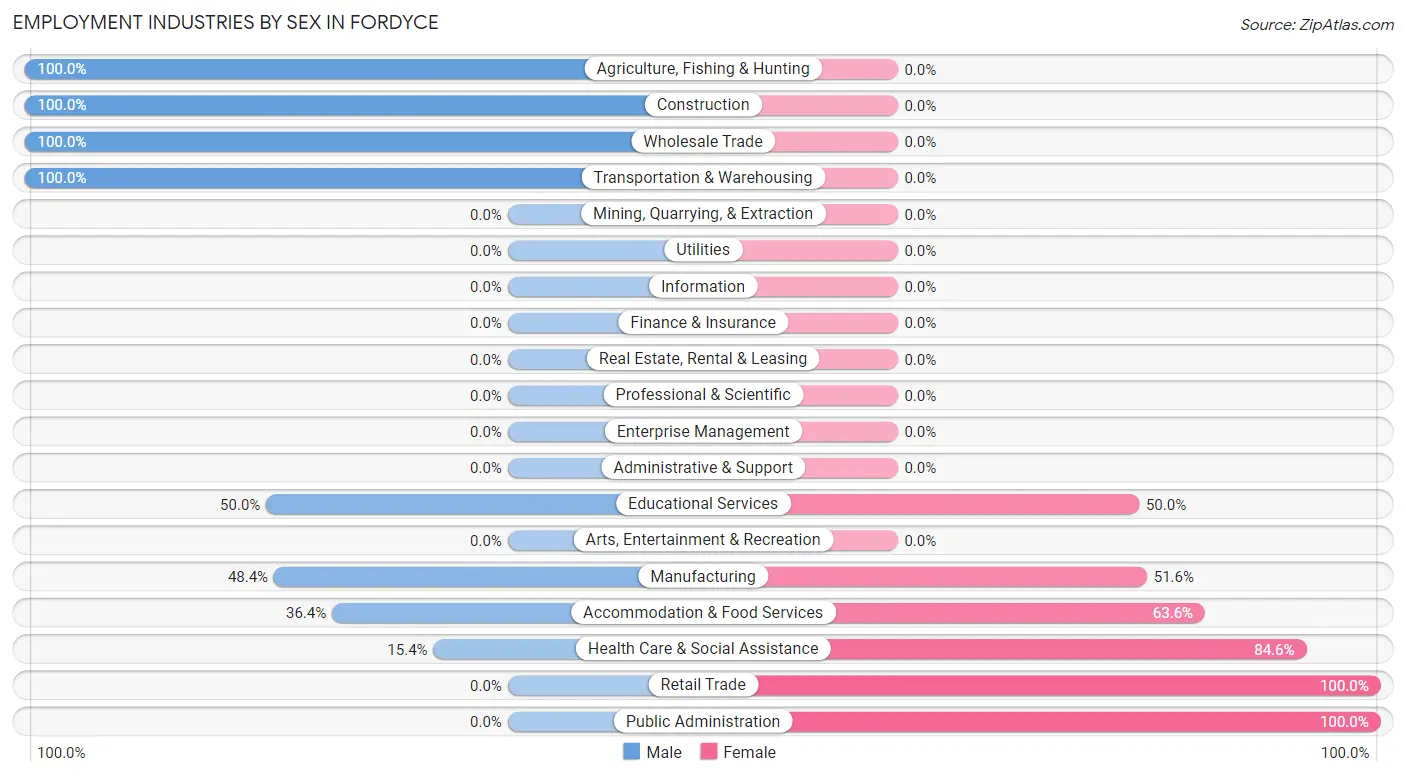
Employment Industries by Sex in Fordyce
The Fordyce industries that see more men than women are Agriculture, Fishing & Hunting (100.0%), Construction (100.0%), and Wholesale Trade (100.0%), whereas the industries that tend to have a higher number of women are Retail Trade (100.0%), Public Administration (100.0%), and Health Care & Social Assistance (84.6%).
| Industry | Male | Female |
| Agriculture, Fishing & Hunting | 19 (100.0%) | 0 (0.0%) |
| Mining, Quarrying, & Extraction | 0 (0.0%) | 0 (0.0%) |
| Construction | 12 (100.0%) | 0 (0.0%) |
| Manufacturing | 15 (48.4%) | 16 (51.6%) |
| Wholesale Trade | 3 (100.0%) | 0 (0.0%) |
| Retail Trade | 0 (0.0%) | 8 (100.0%) |
| Transportation & Warehousing | 1 (100.0%) | 0 (0.0%) |
| Utilities | 0 (0.0%) | 0 (0.0%) |
| Information | 0 (0.0%) | 0 (0.0%) |
| Finance & Insurance | 0 (0.0%) | 0 (0.0%) |
| Real Estate, Rental & Leasing | 0 (0.0%) | 0 (0.0%) |
| Professional & Scientific | 0 (0.0%) | 0 (0.0%) |
| Enterprise Management | 0 (0.0%) | 0 (0.0%) |
| Administrative & Support | 0 (0.0%) | 0 (0.0%) |
| Educational Services | 1 (50.0%) | 1 (50.0%) |
| Health Care & Social Assistance | 2 (15.4%) | 11 (84.6%) |
| Arts, Entertainment & Recreation | 0 (0.0%) | 0 (0.0%) |
| Accommodation & Food Services | 4 (36.4%) | 7 (63.6%) |
| Public Administration | 0 (0.0%) | 6 (100.0%) |
| Total | 58 (52.7%) | 52 (47.3%) |
Education in Fordyce
School Enrollment in Fordyce
The most common levels of schooling among the 63 students in Fordyce are high school (29 | 46.0%), middle school (18 | 28.6%), and elementary school (8 | 12.7%).
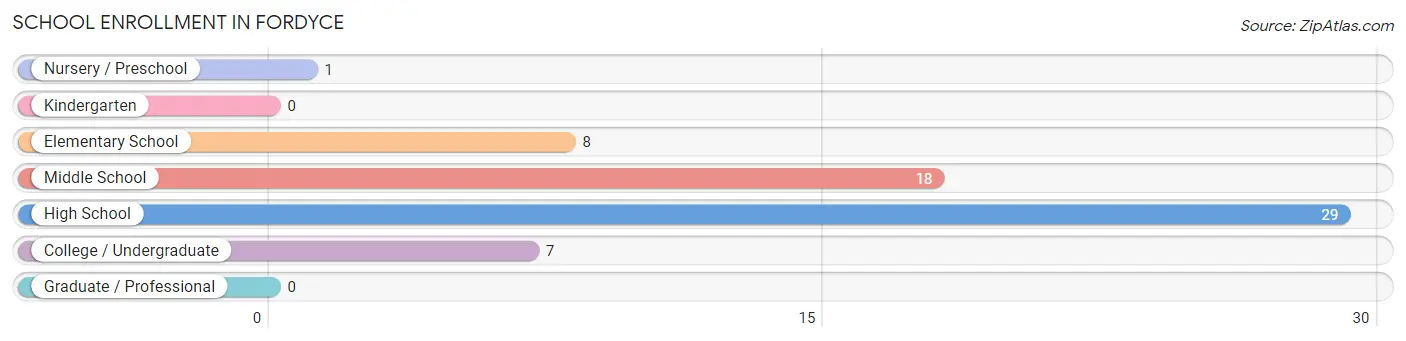
| School Level | # Students | % Students |
| Nursery / Preschool | 1 | 1.6% |
| Kindergarten | 0 | 0.0% |
| Elementary School | 8 | 12.7% |
| Middle School | 18 | 28.6% |
| High School | 29 | 46.0% |
| College / Undergraduate | 7 | 11.1% |
| Graduate / Professional | 0 | 0.0% |
| Total | 63 | 100.0% |
School Enrollment by Age by Funding Source in Fordyce
Out of a total of 63 students who are enrolled in schools in Fordyce, 13 (20.6%) attend a private institution, while the remaining 50 (79.4%) are enrolled in public schools. The age group of 5 to 9 year old has the highest likelihood of being enrolled in private schools, with 4 (66.7% in the age bracket) enrolled. Conversely, the age group of 15 to 17 year olds has the lowest likelihood of being enrolled in a private school, with 21 (100.0% in the age bracket) attending a public institution.
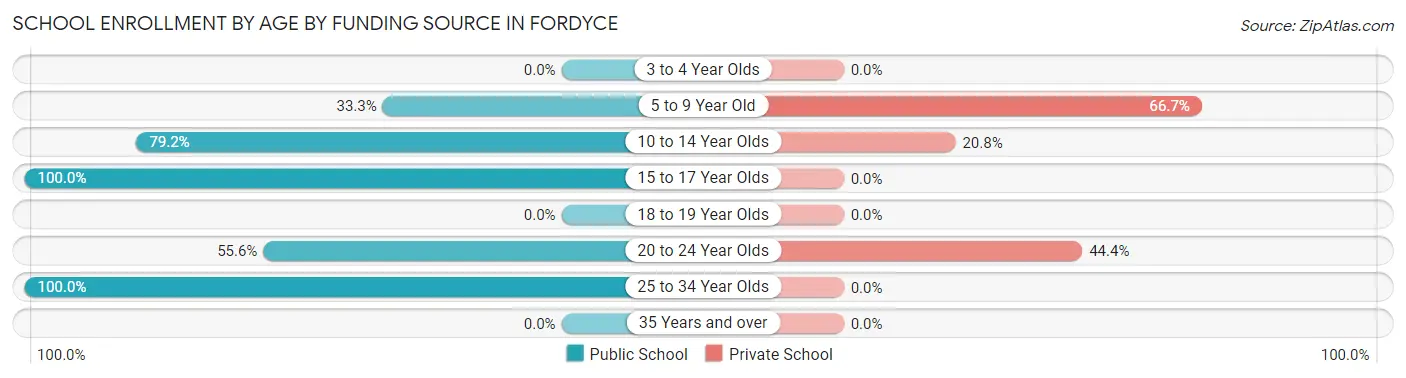
| Age Bracket | Public School | Private School |
| 3 to 4 Year Olds | 0 (0.0%) | 0 (0.0%) |
| 5 to 9 Year Old | 2 (33.3%) | 4 (66.7%) |
| 10 to 14 Year Olds | 19 (79.2%) | 5 (20.8%) |
| 15 to 17 Year Olds | 21 (100.0%) | 0 (0.0%) |
| 18 to 19 Year Olds | 0 (0.0%) | 0 (0.0%) |
| 20 to 24 Year Olds | 5 (55.6%) | 4 (44.4%) |
| 25 to 34 Year Olds | 3 (100.0%) | 0 (0.0%) |
| 35 Years and over | 0 (0.0%) | 0 (0.0%) |
| Total | 50 (79.4%) | 13 (20.6%) |
Educational Attainment by Field of Study in Fordyce
Communications (15 | 46.9%), arts & humanities (8 | 25.0%), bio, nature & agricultural (4 | 12.5%), science & technology (2 | 6.2%), and business (2 | 6.2%) are the most common fields of study among 32 individuals in Fordyce who have obtained a bachelor's degree or higher.
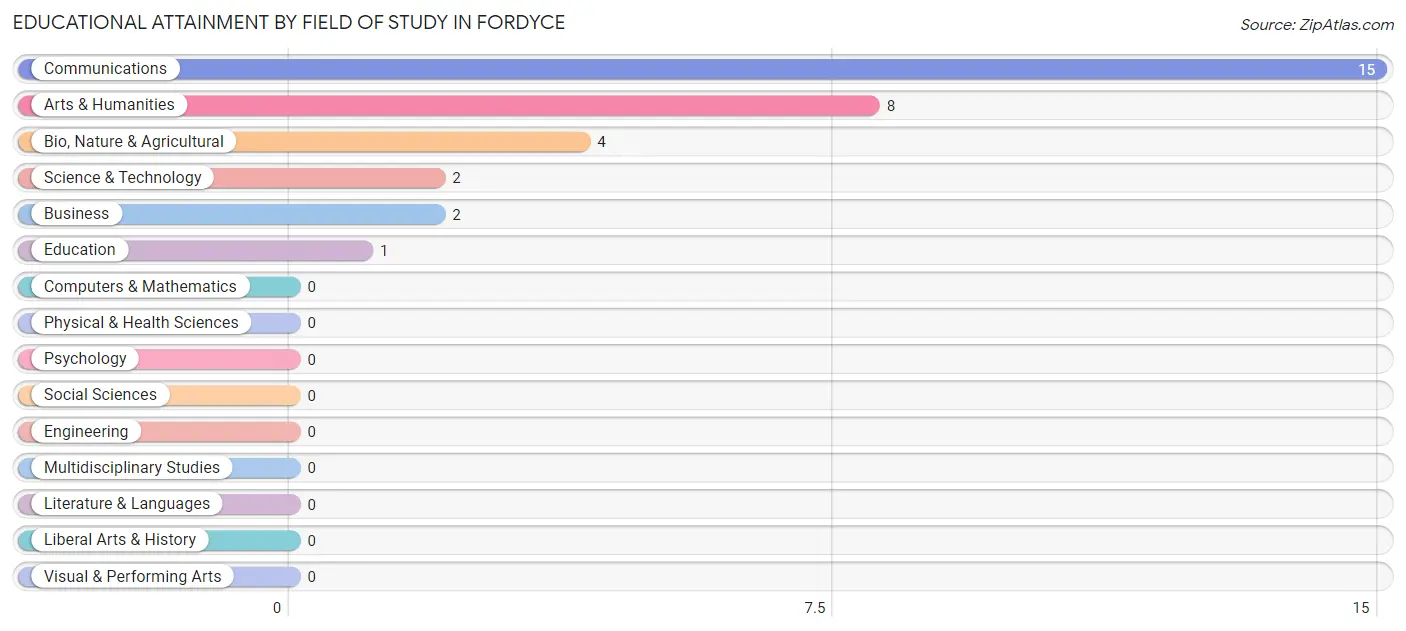
| Field of Study | # Graduates | % Graduates |
| Computers & Mathematics | 0 | 0.0% |
| Bio, Nature & Agricultural | 4 | 12.5% |
| Physical & Health Sciences | 0 | 0.0% |
| Psychology | 0 | 0.0% |
| Social Sciences | 0 | 0.0% |
| Engineering | 0 | 0.0% |
| Multidisciplinary Studies | 0 | 0.0% |
| Science & Technology | 2 | 6.2% |
| Business | 2 | 6.2% |
| Education | 1 | 3.1% |
| Literature & Languages | 0 | 0.0% |
| Liberal Arts & History | 0 | 0.0% |
| Visual & Performing Arts | 0 | 0.0% |
| Communications | 15 | 46.9% |
| Arts & Humanities | 8 | 25.0% |
| Total | 32 | 100.0% |
Transportation & Commute in Fordyce
Vehicle Availability by Sex in Fordyce
The most prevalent vehicle ownership categories in Fordyce are males with 2 vehicles (22, accounting for 37.9%) and females with 2 vehicles (22, making up 43.1%).
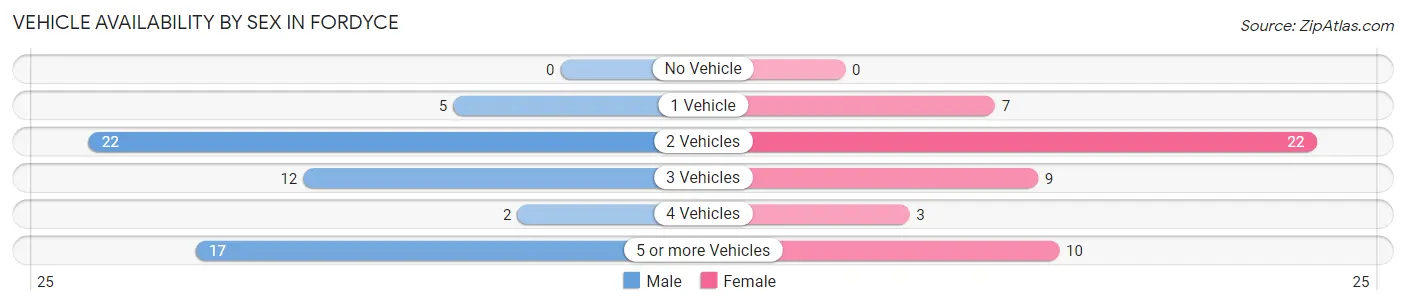
| Vehicles Available | Male | Female |
| No Vehicle | 0 (0.0%) | 0 (0.0%) |
| 1 Vehicle | 5 (8.6%) | 7 (13.7%) |
| 2 Vehicles | 22 (37.9%) | 22 (43.1%) |
| 3 Vehicles | 12 (20.7%) | 9 (17.6%) |
| 4 Vehicles | 2 (3.5%) | 3 (5.9%) |
| 5 or more Vehicles | 17 (29.3%) | 10 (19.6%) |
| Total | 58 (100.0%) | 51 (100.0%) |
Commute Time in Fordyce
The most frequently occuring commute durations in Fordyce are less than 5 minutes (32 commuters, 30.2%), 5 to 9 minutes (19 commuters, 17.9%), and 20 to 24 minutes (15 commuters, 14.1%).
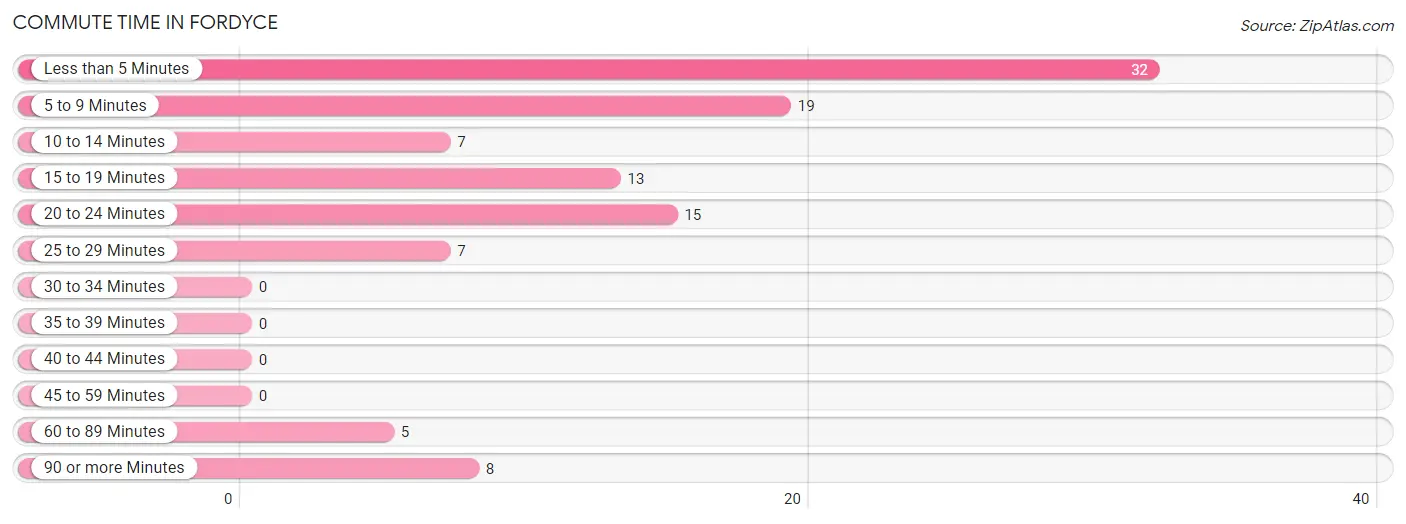
| Commute Time | # Commuters | % Commuters |
| Less than 5 Minutes | 32 | 30.2% |
| 5 to 9 Minutes | 19 | 17.9% |
| 10 to 14 Minutes | 7 | 6.6% |
| 15 to 19 Minutes | 13 | 12.3% |
| 20 to 24 Minutes | 15 | 14.1% |
| 25 to 29 Minutes | 7 | 6.6% |
| 30 to 34 Minutes | 0 | 0.0% |
| 35 to 39 Minutes | 0 | 0.0% |
| 40 to 44 Minutes | 0 | 0.0% |
| 45 to 59 Minutes | 0 | 0.0% |
| 60 to 89 Minutes | 5 | 4.7% |
| 90 or more Minutes | 8 | 7.5% |
Commute Time by Sex in Fordyce
The most common commute times in Fordyce are less than 5 minutes (16 commuters, 27.6%) for males and less than 5 minutes (16 commuters, 33.3%) for females.
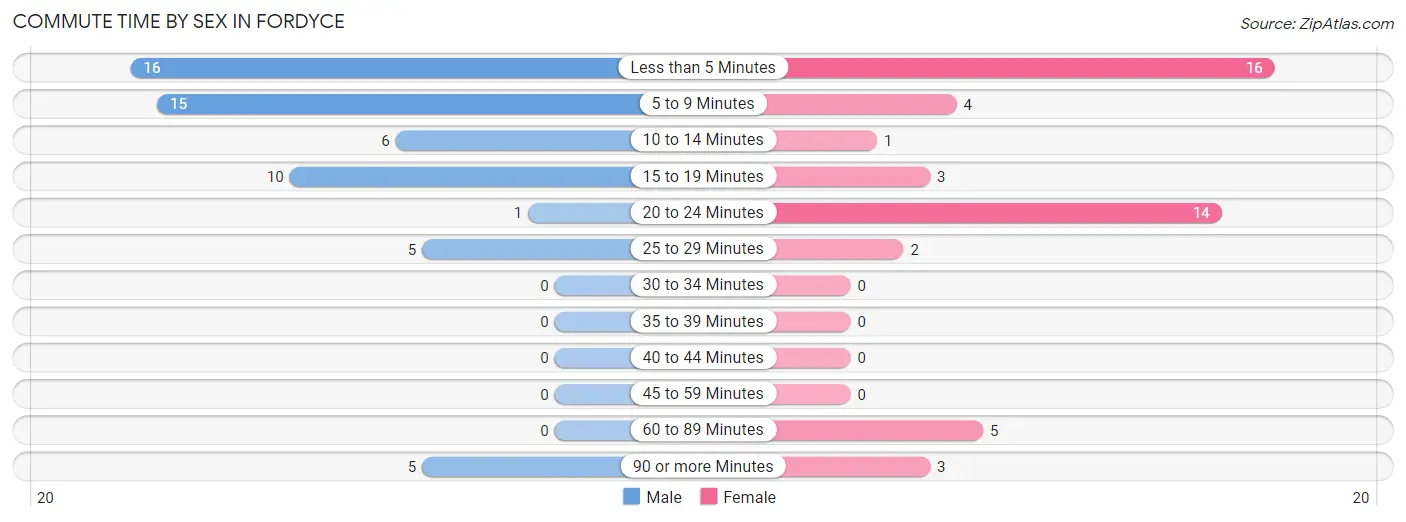
| Commute Time | Male | Female |
| Less than 5 Minutes | 16 (27.6%) | 16 (33.3%) |
| 5 to 9 Minutes | 15 (25.9%) | 4 (8.3%) |
| 10 to 14 Minutes | 6 (10.3%) | 1 (2.1%) |
| 15 to 19 Minutes | 10 (17.2%) | 3 (6.2%) |
| 20 to 24 Minutes | 1 (1.7%) | 14 (29.2%) |
| 25 to 29 Minutes | 5 (8.6%) | 2 (4.2%) |
| 30 to 34 Minutes | 0 (0.0%) | 0 (0.0%) |
| 35 to 39 Minutes | 0 (0.0%) | 0 (0.0%) |
| 40 to 44 Minutes | 0 (0.0%) | 0 (0.0%) |
| 45 to 59 Minutes | 0 (0.0%) | 0 (0.0%) |
| 60 to 89 Minutes | 0 (0.0%) | 5 (10.4%) |
| 90 or more Minutes | 5 (8.6%) | 3 (6.2%) |
Time of Departure to Work by Sex in Fordyce
The most frequent times of departure to work in Fordyce are 7:00 AM to 7:29 AM (27, 46.6%) for males and 7:00 AM to 7:29 AM (17, 35.4%) for females.
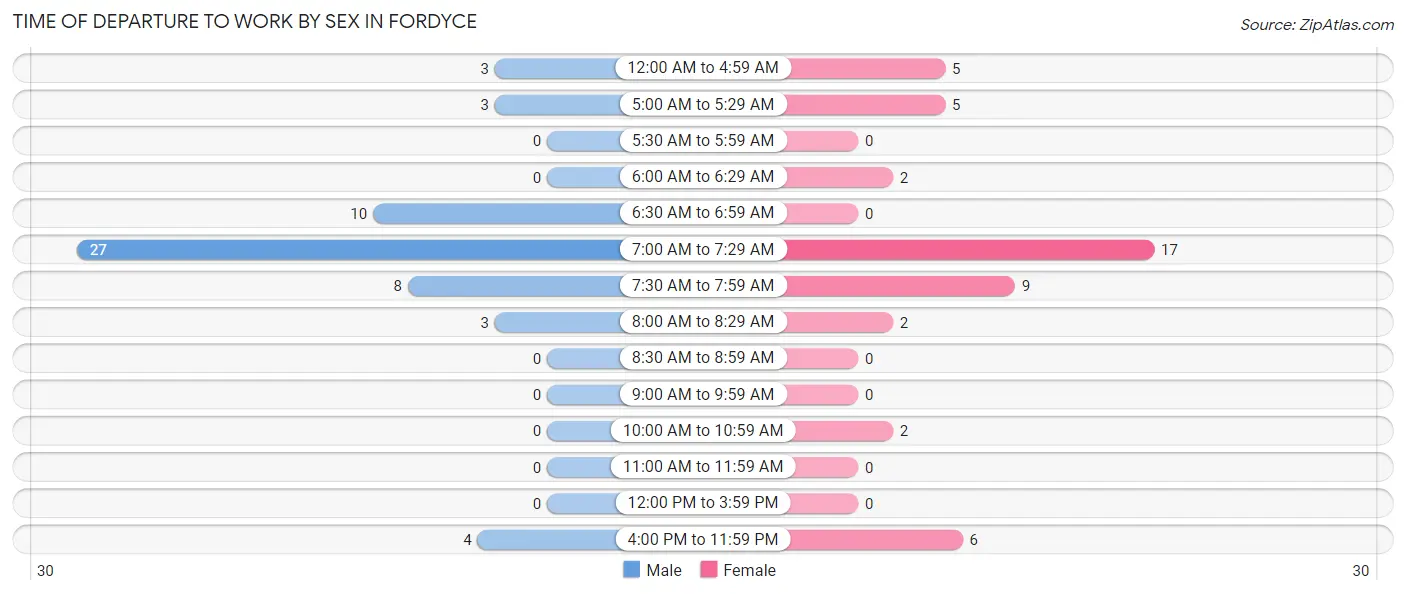
| Time of Departure | Male | Female |
| 12:00 AM to 4:59 AM | 3 (5.2%) | 5 (10.4%) |
| 5:00 AM to 5:29 AM | 3 (5.2%) | 5 (10.4%) |
| 5:30 AM to 5:59 AM | 0 (0.0%) | 0 (0.0%) |
| 6:00 AM to 6:29 AM | 0 (0.0%) | 2 (4.2%) |
| 6:30 AM to 6:59 AM | 10 (17.2%) | 0 (0.0%) |
| 7:00 AM to 7:29 AM | 27 (46.6%) | 17 (35.4%) |
| 7:30 AM to 7:59 AM | 8 (13.8%) | 9 (18.8%) |
| 8:00 AM to 8:29 AM | 3 (5.2%) | 2 (4.2%) |
| 8:30 AM to 8:59 AM | 0 (0.0%) | 0 (0.0%) |
| 9:00 AM to 9:59 AM | 0 (0.0%) | 0 (0.0%) |
| 10:00 AM to 10:59 AM | 0 (0.0%) | 2 (4.2%) |
| 11:00 AM to 11:59 AM | 0 (0.0%) | 0 (0.0%) |
| 12:00 PM to 3:59 PM | 0 (0.0%) | 0 (0.0%) |
| 4:00 PM to 11:59 PM | 4 (6.9%) | 6 (12.5%) |
| Total | 58 (100.0%) | 48 (100.0%) |
Housing Occupancy in Fordyce
Occupancy by Ownership in Fordyce
Of the total 81 dwellings in Fordyce, owner-occupied units account for 78 (96.3%), while renter-occupied units make up 3 (3.7%).
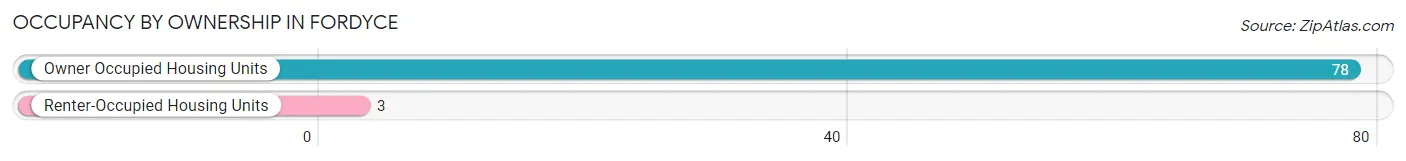
| Occupancy | # Housing Units | % Housing Units |
| Owner Occupied Housing Units | 78 | 96.3% |
| Renter-Occupied Housing Units | 3 | 3.7% |
| Total Occupied Housing Units | 81 | 100.0% |
Occupancy by Household Size in Fordyce
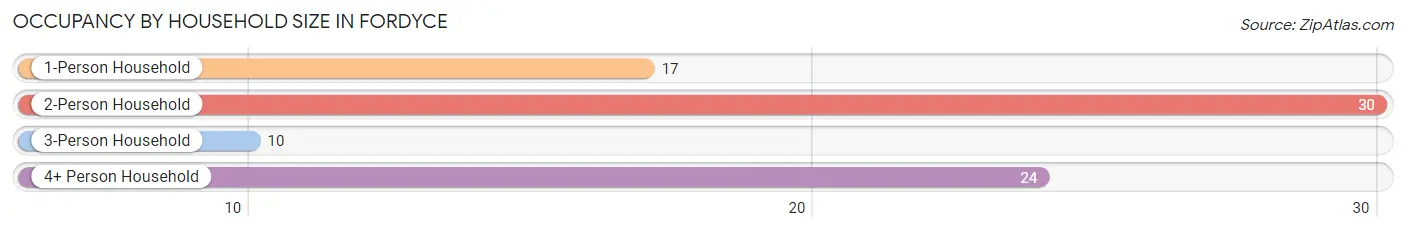
| Household Size | # Housing Units | % Housing Units |
| 1-Person Household | 17 | 21.0% |
| 2-Person Household | 30 | 37.0% |
| 3-Person Household | 10 | 12.3% |
| 4+ Person Household | 24 | 29.6% |
| Total Housing Units | 81 | 100.0% |
Occupancy by Ownership by Household Size in Fordyce
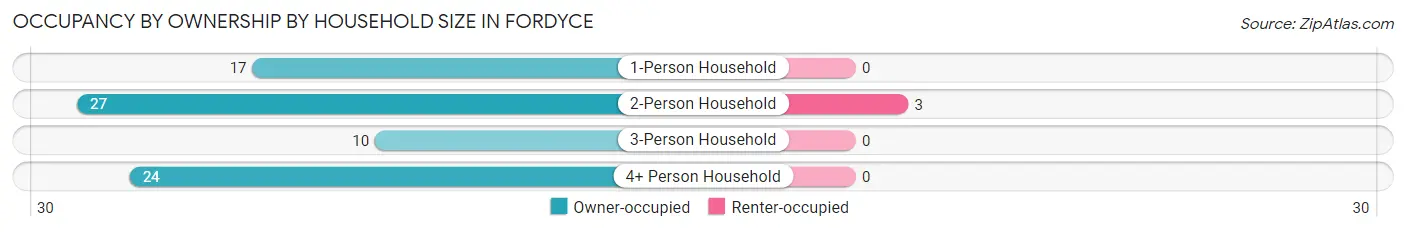
| Household Size | Owner-occupied | Renter-occupied |
| 1-Person Household | 17 (100.0%) | 0 (0.0%) |
| 2-Person Household | 27 (90.0%) | 3 (10.0%) |
| 3-Person Household | 10 (100.0%) | 0 (0.0%) |
| 4+ Person Household | 24 (100.0%) | 0 (0.0%) |
| Total Housing Units | 78 (96.3%) | 3 (3.7%) |
Occupancy by Educational Attainment in Fordyce
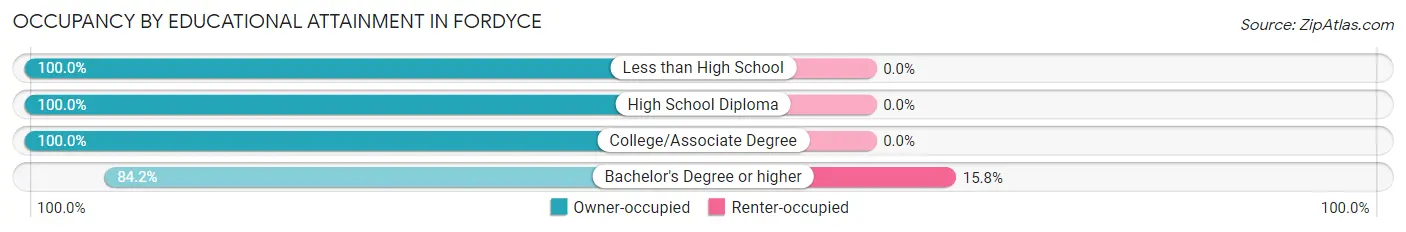
| Household Size | Owner-occupied | Renter-occupied |
| Less than High School | 11 (100.0%) | 0 (0.0%) |
| High School Diploma | 26 (100.0%) | 0 (0.0%) |
| College/Associate Degree | 25 (100.0%) | 0 (0.0%) |
| Bachelor's Degree or higher | 16 (84.2%) | 3 (15.8%) |
Occupancy by Age of Householder in Fordyce
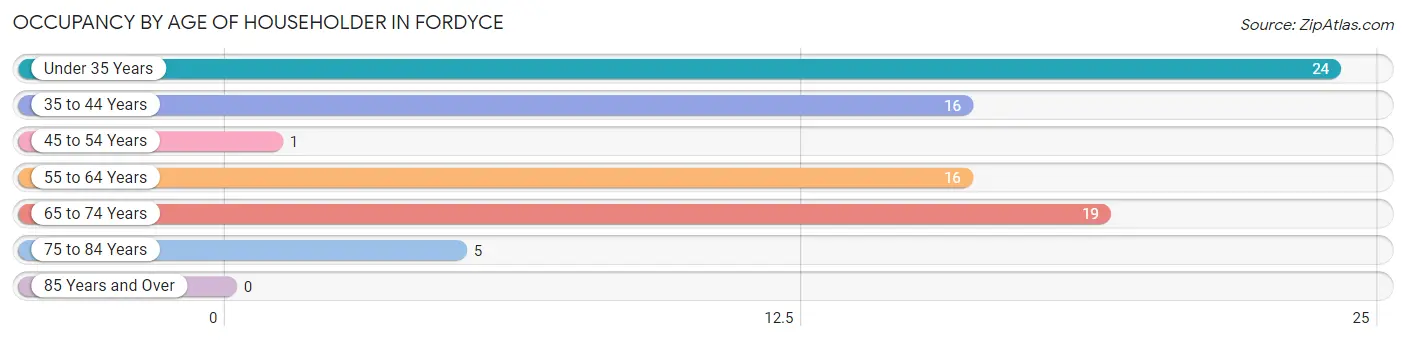
| Age Bracket | # Households | % Households |
| Under 35 Years | 24 | 29.6% |
| 35 to 44 Years | 16 | 19.8% |
| 45 to 54 Years | 1 | 1.2% |
| 55 to 64 Years | 16 | 19.8% |
| 65 to 74 Years | 19 | 23.5% |
| 75 to 84 Years | 5 | 6.2% |
| 85 Years and Over | 0 | 0.0% |
| Total | 81 | 100.0% |
Housing Finances in Fordyce
Median Income by Occupancy in Fordyce
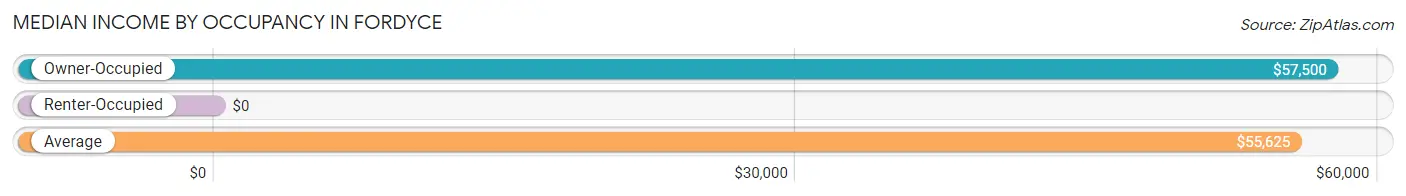
| Occupancy Type | # Households | Median Income |
| Owner-Occupied | 78 (96.3%) | $57,500 |
| Renter-Occupied | 3 (3.7%) | $0 |
| Average | 81 (100.0%) | $55,625 |
Occupancy by Householder Income Bracket in Fordyce
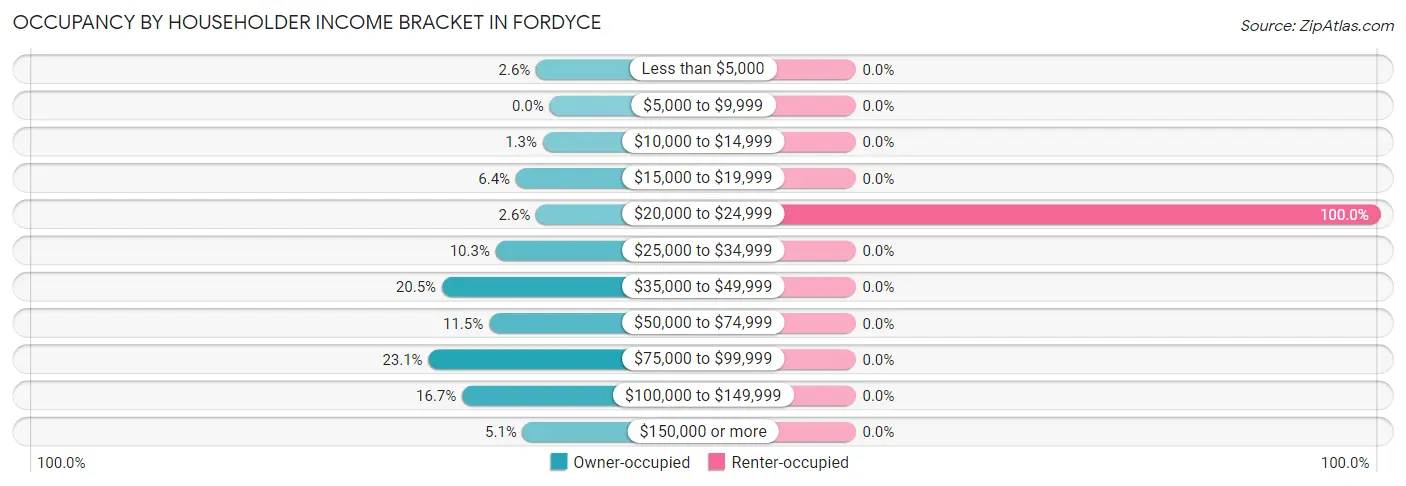
| Income Bracket | Owner-occupied | Renter-occupied |
| Less than $5,000 | 2 (2.6%) | 0 (0.0%) |
| $5,000 to $9,999 | 0 (0.0%) | 0 (0.0%) |
| $10,000 to $14,999 | 1 (1.3%) | 0 (0.0%) |
| $15,000 to $19,999 | 5 (6.4%) | 0 (0.0%) |
| $20,000 to $24,999 | 2 (2.6%) | 3 (100.0%) |
| $25,000 to $34,999 | 8 (10.3%) | 0 (0.0%) |
| $35,000 to $49,999 | 16 (20.5%) | 0 (0.0%) |
| $50,000 to $74,999 | 9 (11.5%) | 0 (0.0%) |
| $75,000 to $99,999 | 18 (23.1%) | 0 (0.0%) |
| $100,000 to $149,999 | 13 (16.7%) | 0 (0.0%) |
| $150,000 or more | 4 (5.1%) | 0 (0.0%) |
| Total | 78 (100.0%) | 3 (100.0%) |
Monthly Housing Cost Tiers in Fordyce
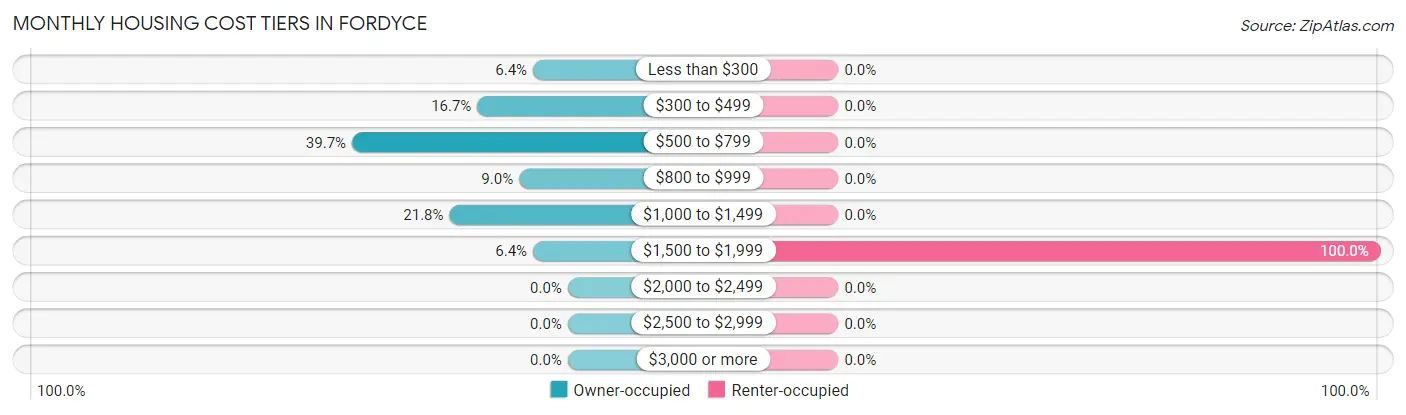
| Monthly Cost | Owner-occupied | Renter-occupied |
| Less than $300 | 5 (6.4%) | 0 (0.0%) |
| $300 to $499 | 13 (16.7%) | 0 (0.0%) |
| $500 to $799 | 31 (39.7%) | 0 (0.0%) |
| $800 to $999 | 7 (9.0%) | 0 (0.0%) |
| $1,000 to $1,499 | 17 (21.8%) | 0 (0.0%) |
| $1,500 to $1,999 | 5 (6.4%) | 3 (100.0%) |
| $2,000 to $2,499 | 0 (0.0%) | 0 (0.0%) |
| $2,500 to $2,999 | 0 (0.0%) | 0 (0.0%) |
| $3,000 or more | 0 (0.0%) | 0 (0.0%) |
| Total | 78 (100.0%) | 3 (100.0%) |
Physical Housing Characteristics in Fordyce
Housing Structures in Fordyce
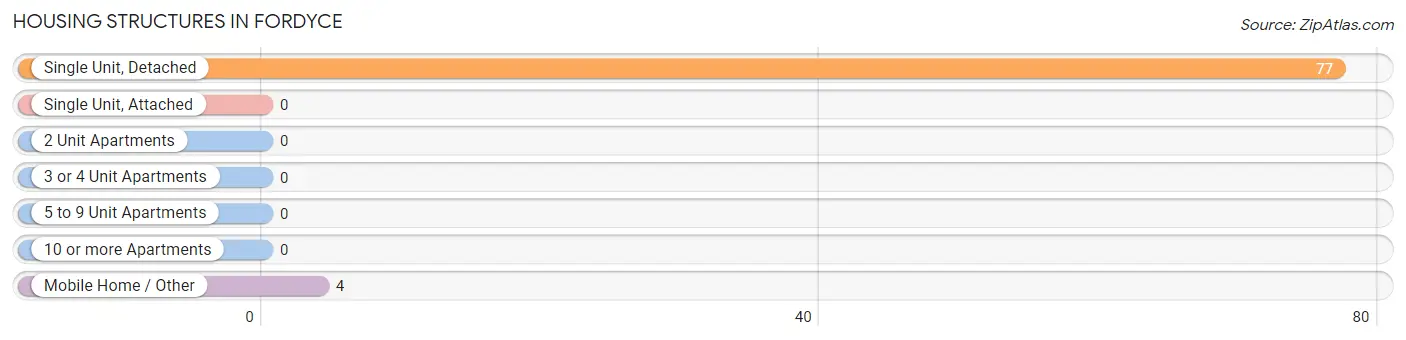
| Structure Type | # Housing Units | % Housing Units |
| Single Unit, Detached | 77 | 95.1% |
| Single Unit, Attached | 0 | 0.0% |
| 2 Unit Apartments | 0 | 0.0% |
| 3 or 4 Unit Apartments | 0 | 0.0% |
| 5 to 9 Unit Apartments | 0 | 0.0% |
| 10 or more Apartments | 0 | 0.0% |
| Mobile Home / Other | 4 | 4.9% |
| Total | 81 | 100.0% |
Housing Structures by Occupancy in Fordyce
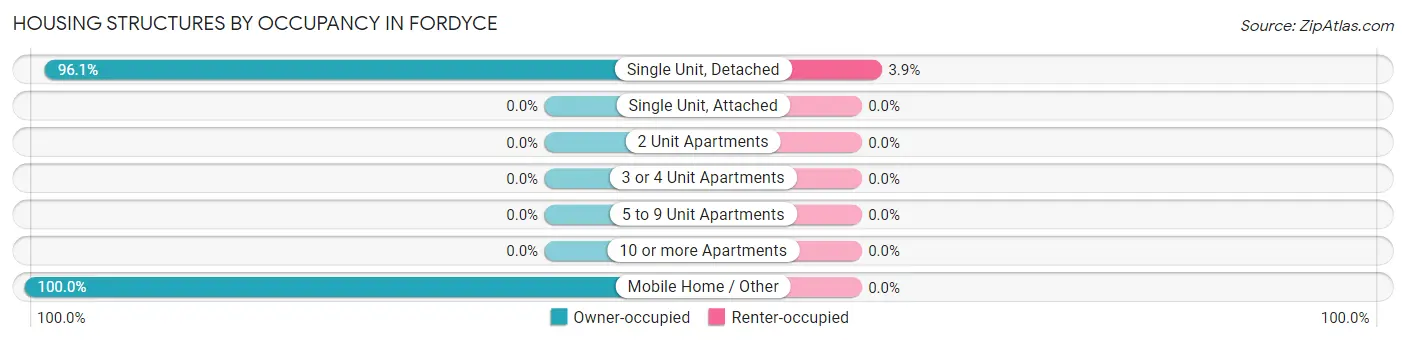
| Structure Type | Owner-occupied | Renter-occupied |
| Single Unit, Detached | 74 (96.1%) | 3 (3.9%) |
| Single Unit, Attached | 0 (0.0%) | 0 (0.0%) |
| 2 Unit Apartments | 0 (0.0%) | 0 (0.0%) |
| 3 or 4 Unit Apartments | 0 (0.0%) | 0 (0.0%) |
| 5 to 9 Unit Apartments | 0 (0.0%) | 0 (0.0%) |
| 10 or more Apartments | 0 (0.0%) | 0 (0.0%) |
| Mobile Home / Other | 4 (100.0%) | 0 (0.0%) |
| Total | 78 (96.3%) | 3 (3.7%) |
Housing Structures by Number of Rooms in Fordyce
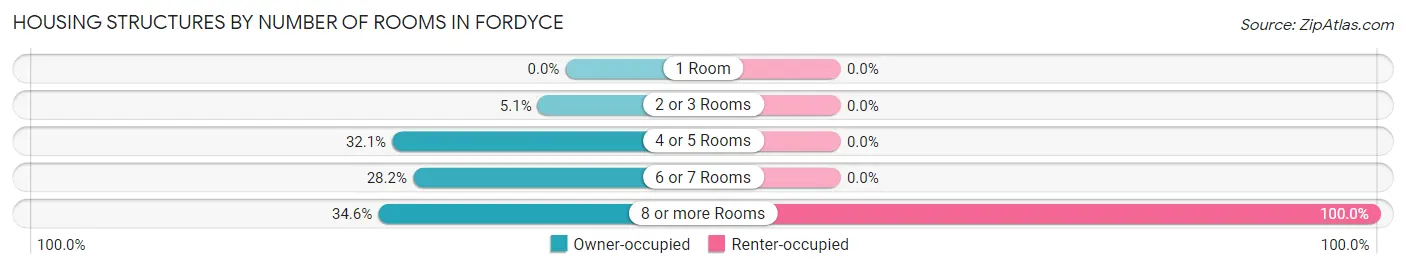
| Number of Rooms | Owner-occupied | Renter-occupied |
| 1 Room | 0 (0.0%) | 0 (0.0%) |
| 2 or 3 Rooms | 4 (5.1%) | 0 (0.0%) |
| 4 or 5 Rooms | 25 (32.1%) | 0 (0.0%) |
| 6 or 7 Rooms | 22 (28.2%) | 0 (0.0%) |
| 8 or more Rooms | 27 (34.6%) | 3 (100.0%) |
| Total | 78 (100.0%) | 3 (100.0%) |
Housing Structure by Heating Type in Fordyce
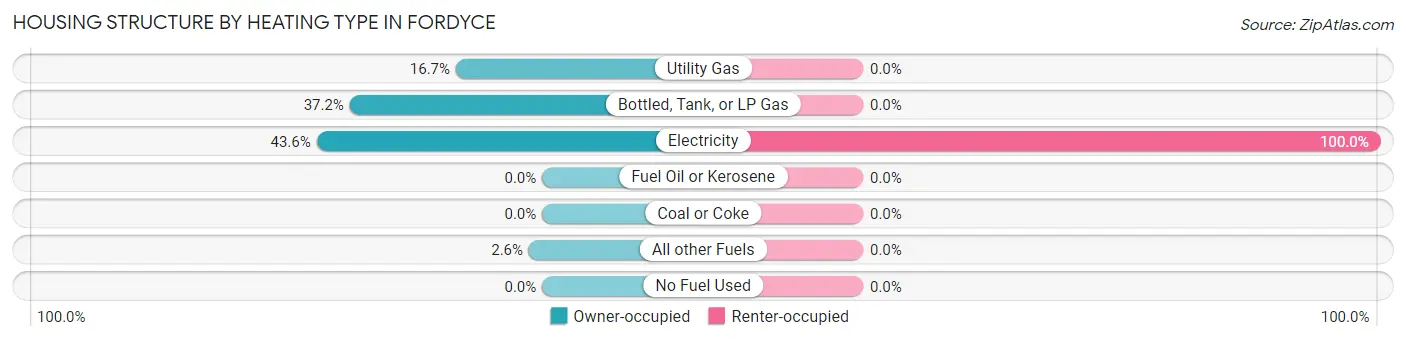
| Heating Type | Owner-occupied | Renter-occupied |
| Utility Gas | 13 (16.7%) | 0 (0.0%) |
| Bottled, Tank, or LP Gas | 29 (37.2%) | 0 (0.0%) |
| Electricity | 34 (43.6%) | 3 (100.0%) |
| Fuel Oil or Kerosene | 0 (0.0%) | 0 (0.0%) |
| Coal or Coke | 0 (0.0%) | 0 (0.0%) |
| All other Fuels | 2 (2.6%) | 0 (0.0%) |
| No Fuel Used | 0 (0.0%) | 0 (0.0%) |
| Total | 78 (100.0%) | 3 (100.0%) |
Household Vehicle Usage in Fordyce
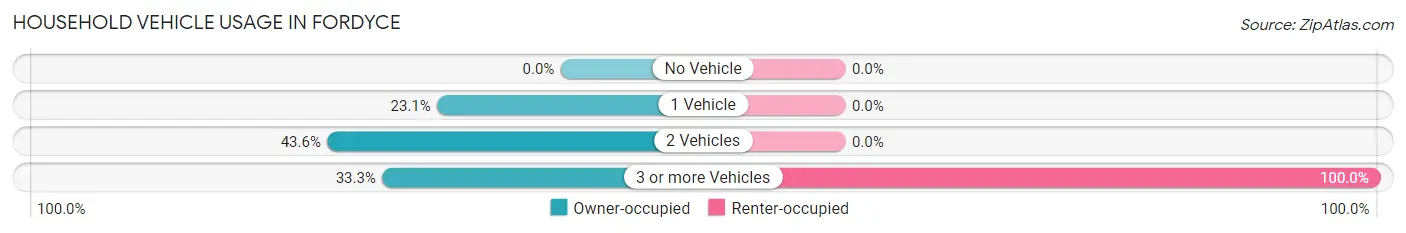
| Vehicles per Household | Owner-occupied | Renter-occupied |
| No Vehicle | 0 (0.0%) | 0 (0.0%) |
| 1 Vehicle | 18 (23.1%) | 0 (0.0%) |
| 2 Vehicles | 34 (43.6%) | 0 (0.0%) |
| 3 or more Vehicles | 26 (33.3%) | 3 (100.0%) |
| Total | 78 (100.0%) | 3 (100.0%) |
Real Estate & Mortgages in Fordyce
Real Estate and Mortgage Overview in Fordyce
| Characteristic | Without Mortgage | With Mortgage |
| Housing Units | 37 | 41 |
| Median Property Value | $73,000 | $98,300 |
| Median Household Income | $38,750 | $2 |
| Monthly Housing Costs | $506 | $0 |
| Real Estate Taxes | $563 | $3 |
Property Value by Mortgage Status in Fordyce
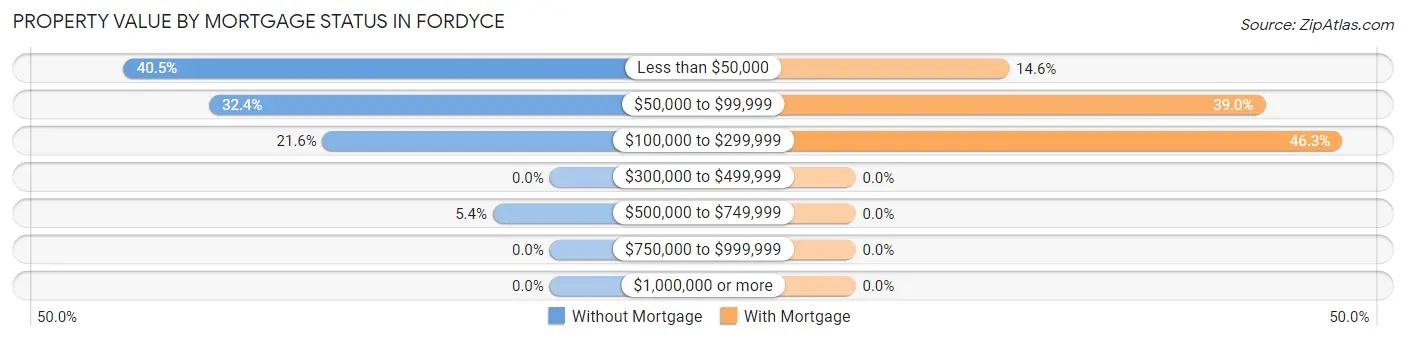
| Property Value | Without Mortgage | With Mortgage |
| Less than $50,000 | 15 (40.5%) | 6 (14.6%) |
| $50,000 to $99,999 | 12 (32.4%) | 16 (39.0%) |
| $100,000 to $299,999 | 8 (21.6%) | 19 (46.3%) |
| $300,000 to $499,999 | 0 (0.0%) | 0 (0.0%) |
| $500,000 to $749,999 | 2 (5.4%) | 0 (0.0%) |
| $750,000 to $999,999 | 0 (0.0%) | 0 (0.0%) |
| $1,000,000 or more | 0 (0.0%) | 0 (0.0%) |
| Total | 37 (100.0%) | 41 (100.0%) |
Household Income by Mortgage Status in Fordyce
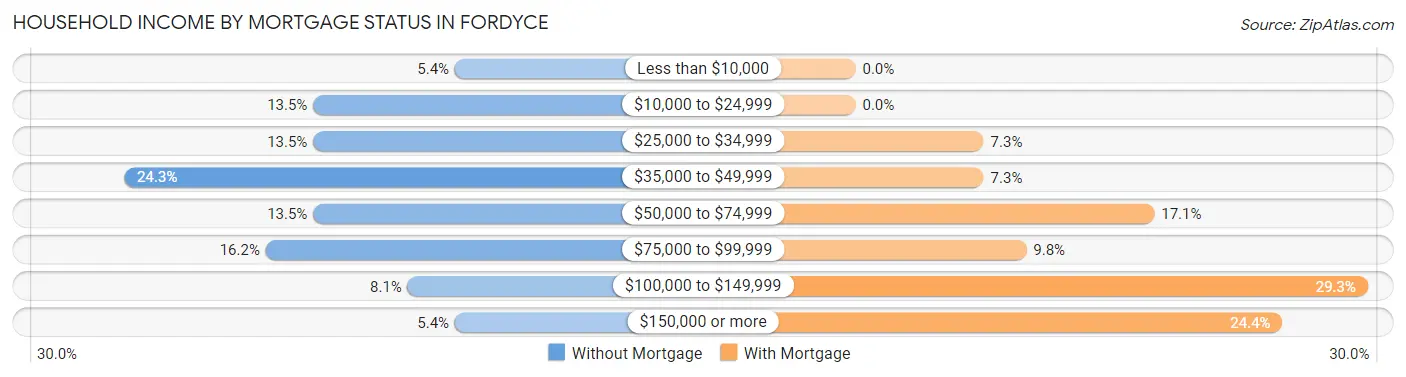
| Household Income | Without Mortgage | With Mortgage |
| Less than $10,000 | 2 (5.4%) | 0 (0.0%) |
| $10,000 to $24,999 | 5 (13.5%) | 0 (0.0%) |
| $25,000 to $34,999 | 5 (13.5%) | 3 (7.3%) |
| $35,000 to $49,999 | 9 (24.3%) | 3 (7.3%) |
| $50,000 to $74,999 | 5 (13.5%) | 7 (17.1%) |
| $75,000 to $99,999 | 6 (16.2%) | 4 (9.8%) |
| $100,000 to $149,999 | 3 (8.1%) | 12 (29.3%) |
| $150,000 or more | 2 (5.4%) | 10 (24.4%) |
| Total | 37 (100.0%) | 41 (100.0%) |
Property Value to Household Income Ratio in Fordyce
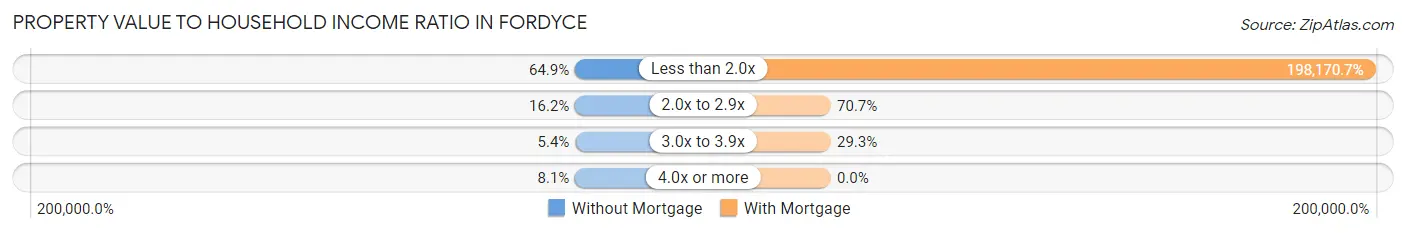
| Value-to-Income Ratio | Without Mortgage | With Mortgage |
| Less than 2.0x | 24 (64.9%) | 81,250 (198,170.7%) |
| 2.0x to 2.9x | 6 (16.2%) | 29 (70.7%) |
| 3.0x to 3.9x | 2 (5.4%) | 12 (29.3%) |
| 4.0x or more | 3 (8.1%) | 0 (0.0%) |
| Total | 37 (100.0%) | 41 (100.0%) |
Real Estate Taxes by Mortgage Status in Fordyce
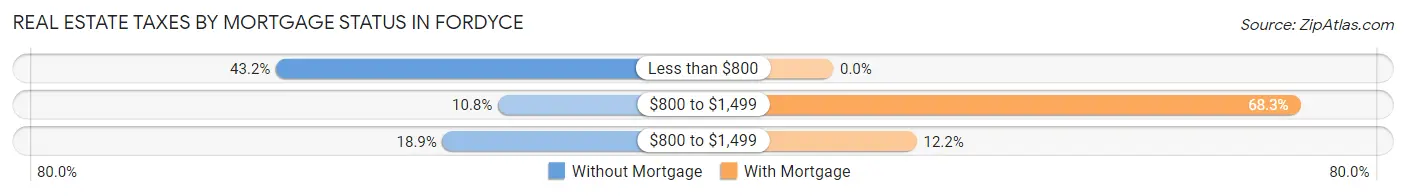
| Property Taxes | Without Mortgage | With Mortgage |
| Less than $800 | 16 (43.2%) | 0 (0.0%) |
| $800 to $1,499 | 4 (10.8%) | 28 (68.3%) |
| $800 to $1,499 | 7 (18.9%) | 5 (12.2%) |
| Total | 37 (100.0%) | 41 (100.0%) |
Health & Disability in Fordyce
Health Insurance Coverage by Age in Fordyce
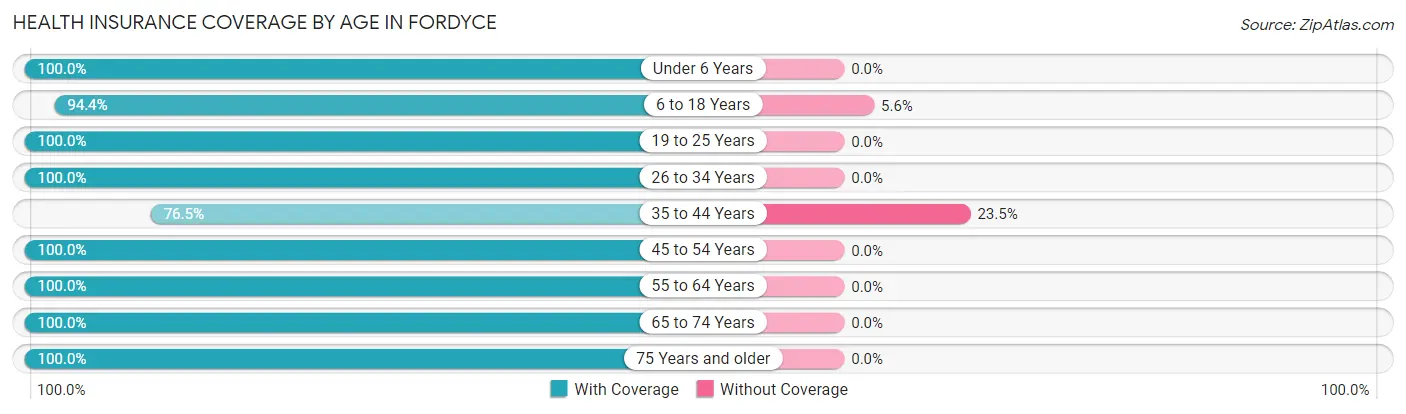
| Age Bracket | With Coverage | Without Coverage |
| Under 6 Years | 38 (100.0%) | 0 (0.0%) |
| 6 to 18 Years | 51 (94.4%) | 3 (5.6%) |
| 19 to 25 Years | 24 (100.0%) | 0 (0.0%) |
| 26 to 34 Years | 26 (100.0%) | 0 (0.0%) |
| 35 to 44 Years | 26 (76.5%) | 8 (23.5%) |
| 45 to 54 Years | 3 (100.0%) | 0 (0.0%) |
| 55 to 64 Years | 28 (100.0%) | 0 (0.0%) |
| 65 to 74 Years | 22 (100.0%) | 0 (0.0%) |
| 75 Years and older | 8 (100.0%) | 0 (0.0%) |
| Total | 226 (95.4%) | 11 (4.6%) |
Health Insurance Coverage by Citizenship Status in Fordyce
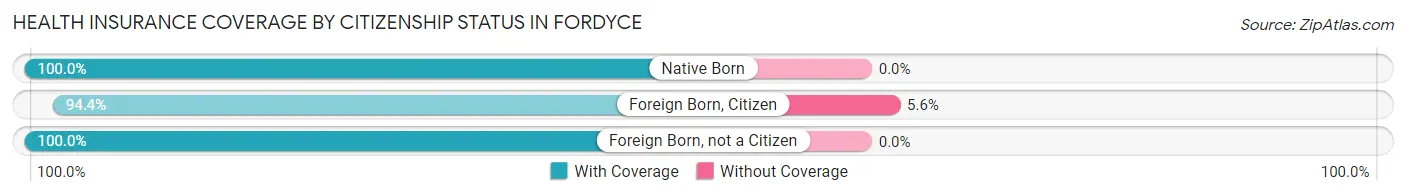
| Citizenship Status | With Coverage | Without Coverage |
| Native Born | 38 (100.0%) | 0 (0.0%) |
| Foreign Born, Citizen | 51 (94.4%) | 3 (5.6%) |
| Foreign Born, not a Citizen | 24 (100.0%) | 0 (0.0%) |
Health Insurance Coverage by Household Income in Fordyce
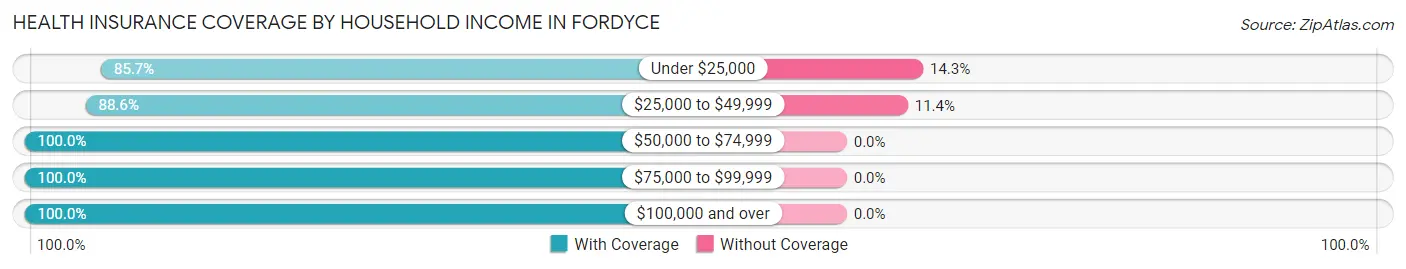
| Household Income | With Coverage | Without Coverage |
| Under $25,000 | 18 (85.7%) | 3 (14.3%) |
| $25,000 to $49,999 | 62 (88.6%) | 8 (11.4%) |
| $50,000 to $74,999 | 12 (100.0%) | 0 (0.0%) |
| $75,000 to $99,999 | 62 (100.0%) | 0 (0.0%) |
| $100,000 and over | 72 (100.0%) | 0 (0.0%) |
Public vs Private Health Insurance Coverage by Age in Fordyce
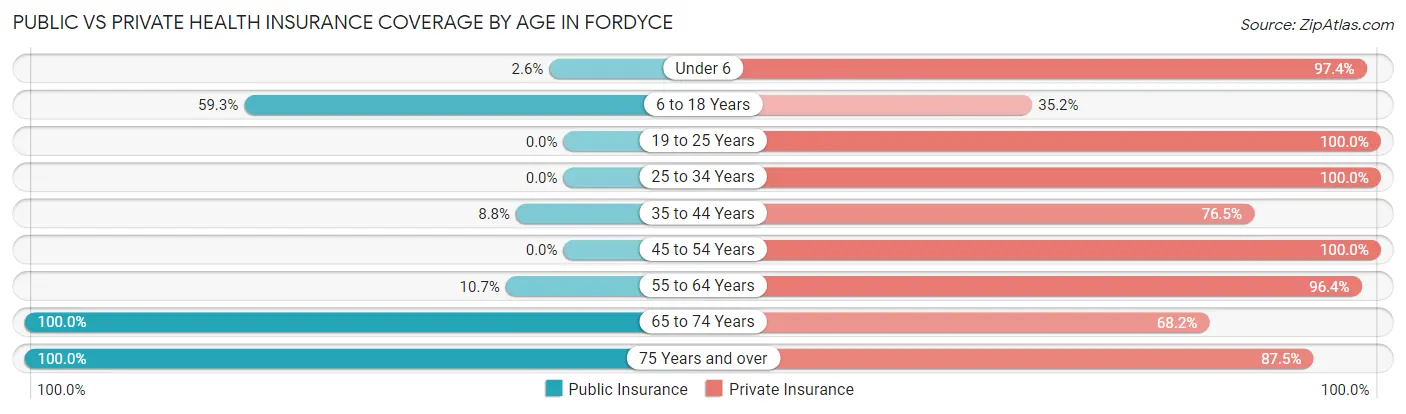
| Age Bracket | Public Insurance | Private Insurance |
| Under 6 | 1 (2.6%) | 37 (97.4%) |
| 6 to 18 Years | 32 (59.3%) | 19 (35.2%) |
| 19 to 25 Years | 0 (0.0%) | 24 (100.0%) |
| 25 to 34 Years | 0 (0.0%) | 26 (100.0%) |
| 35 to 44 Years | 3 (8.8%) | 26 (76.5%) |
| 45 to 54 Years | 0 (0.0%) | 3 (100.0%) |
| 55 to 64 Years | 3 (10.7%) | 27 (96.4%) |
| 65 to 74 Years | 22 (100.0%) | 15 (68.2%) |
| 75 Years and over | 8 (100.0%) | 7 (87.5%) |
| Total | 69 (29.1%) | 184 (77.6%) |
Disability Status by Sex by Age in Fordyce
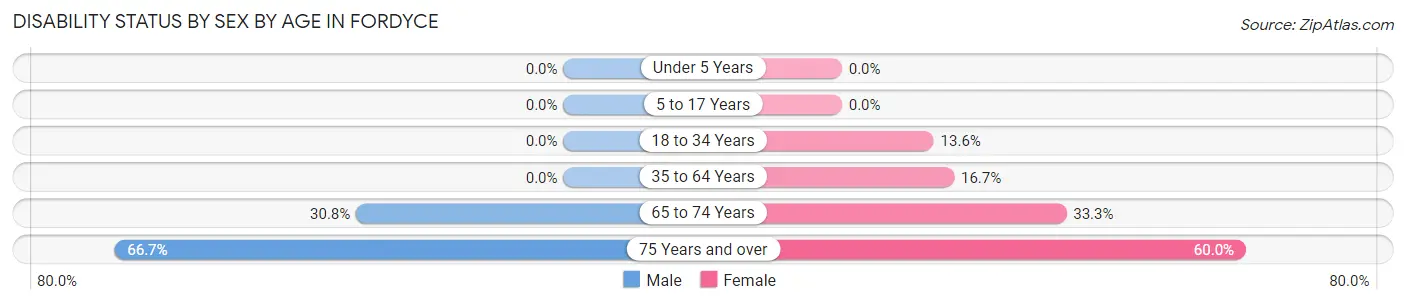
| Age Bracket | Male | Female |
| Under 5 Years | 0 (0.0%) | 0 (0.0%) |
| 5 to 17 Years | 0 (0.0%) | 0 (0.0%) |
| 18 to 34 Years | 0 (0.0%) | 3 (13.6%) |
| 35 to 64 Years | 0 (0.0%) | 5 (16.7%) |
| 65 to 74 Years | 4 (30.8%) | 3 (33.3%) |
| 75 Years and over | 2 (66.7%) | 3 (60.0%) |
Disability Class by Sex by Age in Fordyce
Disability Class: Hearing Difficulty
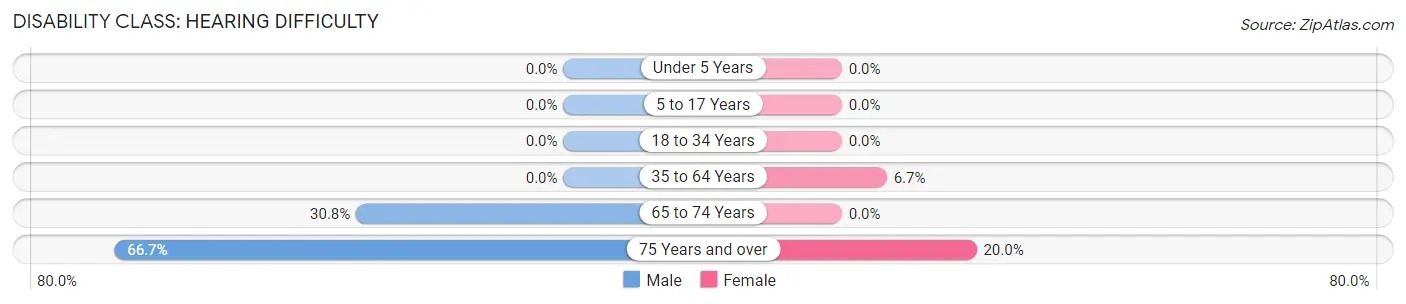
| Age Bracket | Male | Female |
| Under 5 Years | 0 (0.0%) | 0 (0.0%) |
| 5 to 17 Years | 0 (0.0%) | 0 (0.0%) |
| 18 to 34 Years | 0 (0.0%) | 0 (0.0%) |
| 35 to 64 Years | 0 (0.0%) | 2 (6.7%) |
| 65 to 74 Years | 4 (30.8%) | 0 (0.0%) |
| 75 Years and over | 2 (66.7%) | 1 (20.0%) |
Disability Class: Vision Difficulty
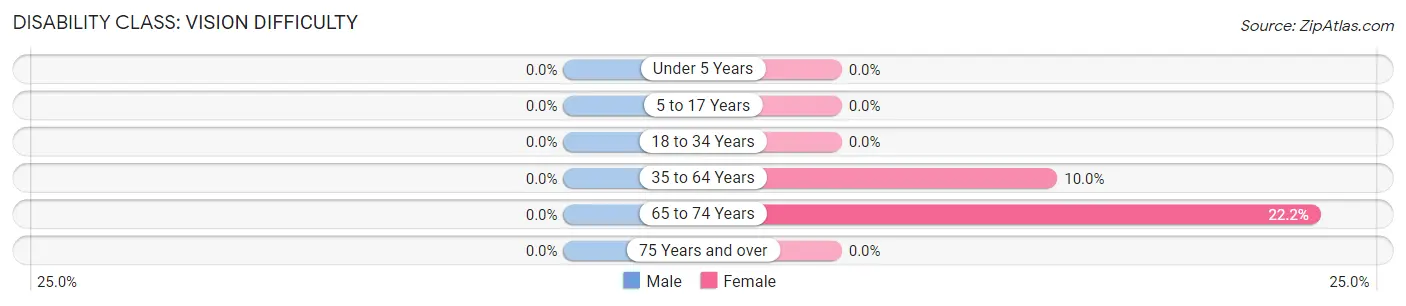
| Age Bracket | Male | Female |
| Under 5 Years | 0 (0.0%) | 0 (0.0%) |
| 5 to 17 Years | 0 (0.0%) | 0 (0.0%) |
| 18 to 34 Years | 0 (0.0%) | 0 (0.0%) |
| 35 to 64 Years | 0 (0.0%) | 3 (10.0%) |
| 65 to 74 Years | 0 (0.0%) | 2 (22.2%) |
| 75 Years and over | 0 (0.0%) | 0 (0.0%) |
Disability Class: Cognitive Difficulty
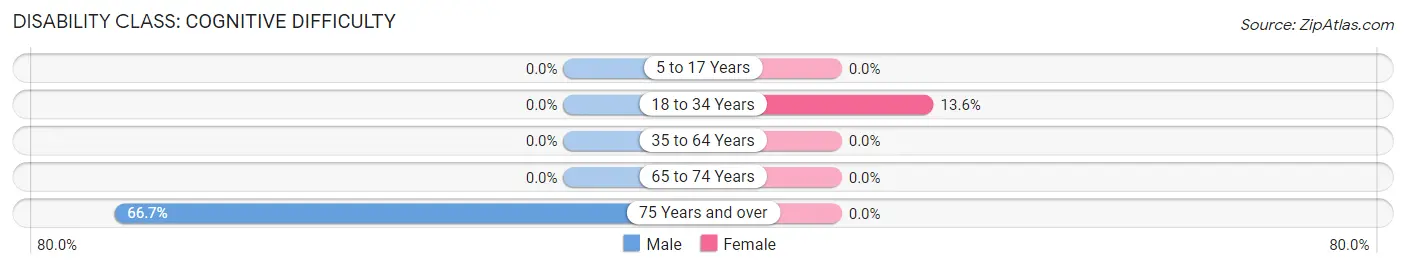
| Age Bracket | Male | Female |
| 5 to 17 Years | 0 (0.0%) | 0 (0.0%) |
| 18 to 34 Years | 0 (0.0%) | 3 (13.6%) |
| 35 to 64 Years | 0 (0.0%) | 0 (0.0%) |
| 65 to 74 Years | 0 (0.0%) | 0 (0.0%) |
| 75 Years and over | 2 (66.7%) | 0 (0.0%) |
Disability Class: Ambulatory Difficulty
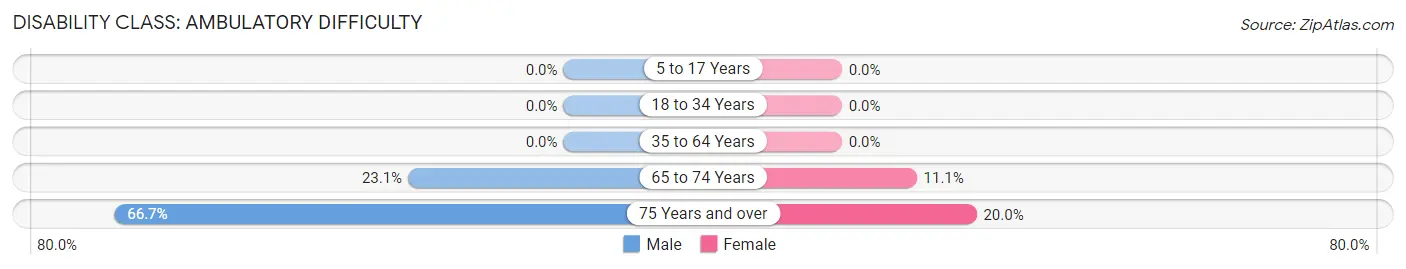
| Age Bracket | Male | Female |
| 5 to 17 Years | 0 (0.0%) | 0 (0.0%) |
| 18 to 34 Years | 0 (0.0%) | 0 (0.0%) |
| 35 to 64 Years | 0 (0.0%) | 0 (0.0%) |
| 65 to 74 Years | 3 (23.1%) | 1 (11.1%) |
| 75 Years and over | 2 (66.7%) | 1 (20.0%) |
Disability Class: Self-Care Difficulty
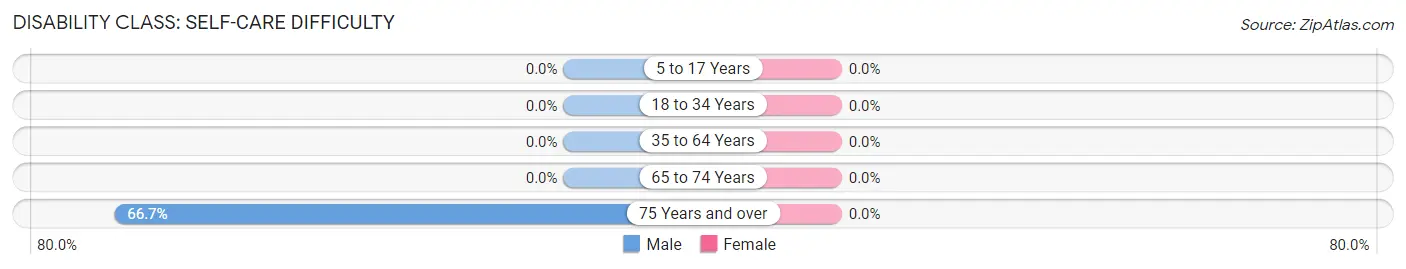
| Age Bracket | Male | Female |
| 5 to 17 Years | 0 (0.0%) | 0 (0.0%) |
| 18 to 34 Years | 0 (0.0%) | 0 (0.0%) |
| 35 to 64 Years | 0 (0.0%) | 0 (0.0%) |
| 65 to 74 Years | 0 (0.0%) | 0 (0.0%) |
| 75 Years and over | 2 (66.7%) | 0 (0.0%) |
Technology Access in Fordyce
Computing Device Access in Fordyce
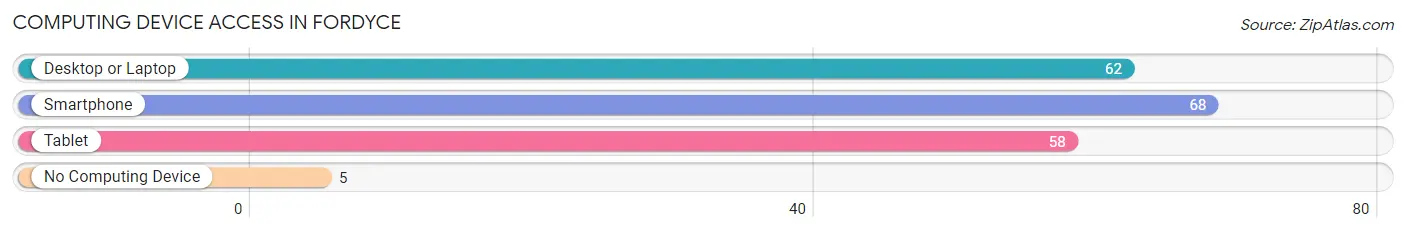
| Device Type | # Households | % Households |
| Desktop or Laptop | 62 | 76.5% |
| Smartphone | 68 | 84.0% |
| Tablet | 58 | 71.6% |
| No Computing Device | 5 | 6.2% |
| Total | 81 | 100.0% |
Internet Access in Fordyce
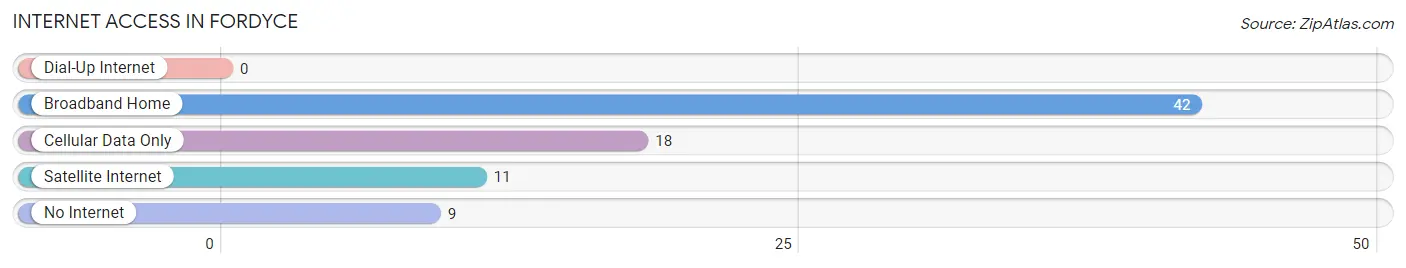
| Internet Type | # Households | % Households |
| Dial-Up Internet | 0 | 0.0% |
| Broadband Home | 42 | 51.8% |
| Cellular Data Only | 18 | 22.2% |
| Satellite Internet | 11 | 13.6% |
| No Internet | 9 | 11.1% |
| Total | 81 | 100.0% |
Fordyce Summary
History
The small town of Fordyce, Nebraska is located in the southeastern corner of the state, just a few miles from the Missouri River. The town was founded in 1887 by a group of settlers from Iowa, led by William Fordyce. The settlers were looking for a place to start a new life and found the area to be ideal for farming and ranching. The town was named after William Fordyce, who was the first postmaster of the town.
The town grew slowly but steadily over the years, and by the early 1900s, it had become a thriving agricultural community. The town was home to several businesses, including a general store, a blacksmith shop, a hotel, and a bank. The town also had a school, a church, and a post office.
In the 1920s, the town experienced a period of growth and prosperity. The population increased from about 500 to over 1,000 people. The town was home to several businesses, including a movie theater, a grocery store, and a hardware store. The town also had a library, a hospital, and a fire department.
The Great Depression hit Fordyce hard, and the population declined to just over 500 people. The town struggled to survive, but it managed to stay afloat. In the 1950s, the town experienced a period of growth and prosperity once again. The population increased to over 1,000 people, and the town was home to several businesses, including a gas station, a restaurant, and a bowling alley.
Geography
Fordyce is located in the southeastern corner of Nebraska, just a few miles from the Missouri River. The town is situated in a flat, open area of the state, with rolling hills and grasslands in the surrounding area. The town is located in the Central Plains region of the state, and the climate is generally mild and dry.
The town is located in the Platte River Valley, and the Platte River runs through the town. The town is also located near the Niobrara River, which is a popular destination for fishing and boating.
Economy
The economy of Fordyce is largely based on agriculture. The town is home to several farms and ranches, and the surrounding area is used for growing crops such as corn, soybeans, and wheat. The town is also home to several businesses, including a grocery store, a hardware store, and a restaurant.
The town is also home to several manufacturing companies, including a furniture factory and a plastics factory. The town is also home to several small businesses, including a gas station, a bowling alley, and a movie theater.
Demographics
As of the 2010 census, the population of Fordyce was 1,093. The town is predominantly white, with about 95% of the population being white. The town is also home to a small Hispanic population, with about 4% of the population being Hispanic. The town is also home to a small African American population, with about 1% of the population being African American.
The median household income in Fordyce is $45,000, and the median home value is $90,000. The town has a low unemployment rate, and the poverty rate is below the national average. The town is served by several public schools, and the town has a public library.
Common Questions
What is Per Capita Income in Fordyce?
Per Capita income in Fordyce is $25,928.
What is the Median Family Income in Fordyce?
Median Family Income in Fordyce is $81,000.
What is the Median Household income in Fordyce?
Median Household Income in Fordyce is $55,625.
What is Income or Wage Gap in Fordyce?
Income or Wage Gap in Fordyce is 32.9%.
Women in Fordyce earn 67.1 cents for every dollar earned by a man.
What is Inequality or Gini Index in Fordyce?
Inequality or Gini Index in Fordyce is 0.37.
What is the Total Population of Fordyce?
Total Population of Fordyce is 237.
What is the Total Male Population of Fordyce?
Total Male Population of Fordyce is 121.
What is the Total Female Population of Fordyce?
Total Female Population of Fordyce is 116.
What is the Ratio of Males per 100 Females in Fordyce?
There are 104.31 Males per 100 Females in Fordyce.
What is the Ratio of Females per 100 Males in Fordyce?
There are 95.87 Females per 100 Males in Fordyce.
What is the Median Population Age in Fordyce?
Median Population Age in Fordyce is 29.3 Years.
What is the Average Family Size in Fordyce
Average Family Size in Fordyce is 3.5 People.
What is the Average Household Size in Fordyce
Average Household Size in Fordyce is 2.9 People.
How Large is the Labor Force in Fordyce?
There are 128 People in the Labor Forcein in Fordyce.
What is the Percentage of People in the Labor Force in Fordyce?
79.5% of People are in the Labor Force in Fordyce.
What is the Unemployment Rate in Fordyce?
Unemployment Rate in Fordyce is 14.1%.