Seltzer, PA Map & Demographics
Seltzer Map
Seltzer Overview
$29,169
PER CAPITA INCOME
$83,200
AVG FAMILY INCOME
$84,100
AVG HOUSEHOLD INCOME
66.5%
WAGE / INCOME GAP [ % ]
33.5¢/ $1
WAGE / INCOME GAP [ $ ]
0.26
INEQUALITY / GINI INDEX
396
TOTAL POPULATION
183
MALE POPULATION
213
FEMALE POPULATION
85.92
MALES / 100 FEMALES
116.39
FEMALES / 100 MALES
33.2
MEDIAN AGE
3.3
AVG FAMILY SIZE
3.1
AVG HOUSEHOLD SIZE
150
LABOR FORCE [ PEOPLE ]
50.8%
PERCENT IN LABOR FORCE
9.3%
UNEMPLOYMENT RATE
Seltzer Zip Codes
Income in Seltzer
Income Overview in Seltzer
Per Capita Income in Seltzer is $29,169, while median incomes of families and households are $83,200 and $84,100 respectively.
| Characteristic | Number | Measure |
| Per Capita Income | 396 | $29,169 |
| Median Family Income | 108 | $83,200 |
| Mean Family Income | 108 | $77,461 |
| Median Household Income | 126 | $84,100 |
| Mean Household Income | 126 | $84,230 |
| Income Deficit | 108 | $0 |
| Wage / Income Gap (%) | 396 | 66.51% |
| Wage / Income Gap ($) | 396 | 33.49¢ per $1 |
| Gini / Inequality Index | 396 | 0.26 |
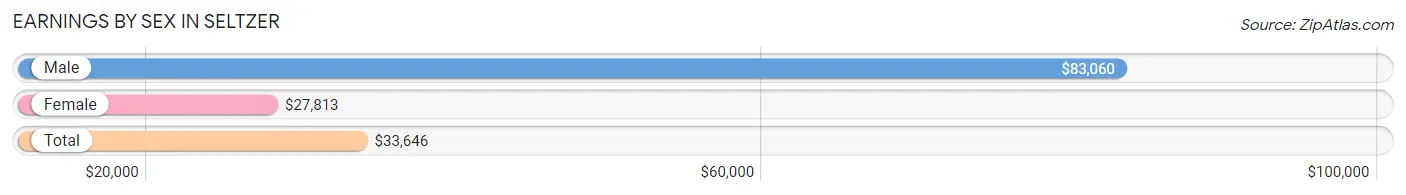
Earnings by Sex in Seltzer
Average Earnings in Seltzer are $33,646, $83,060 for men and $27,813 for women, a difference of 66.5%.
| Sex | Number | Average Earnings |
| Male | 81 (59.6%) | $83,060 |
| Female | 55 (40.4%) | $27,813 |
| Total | 136 (100.0%) | $33,646 |
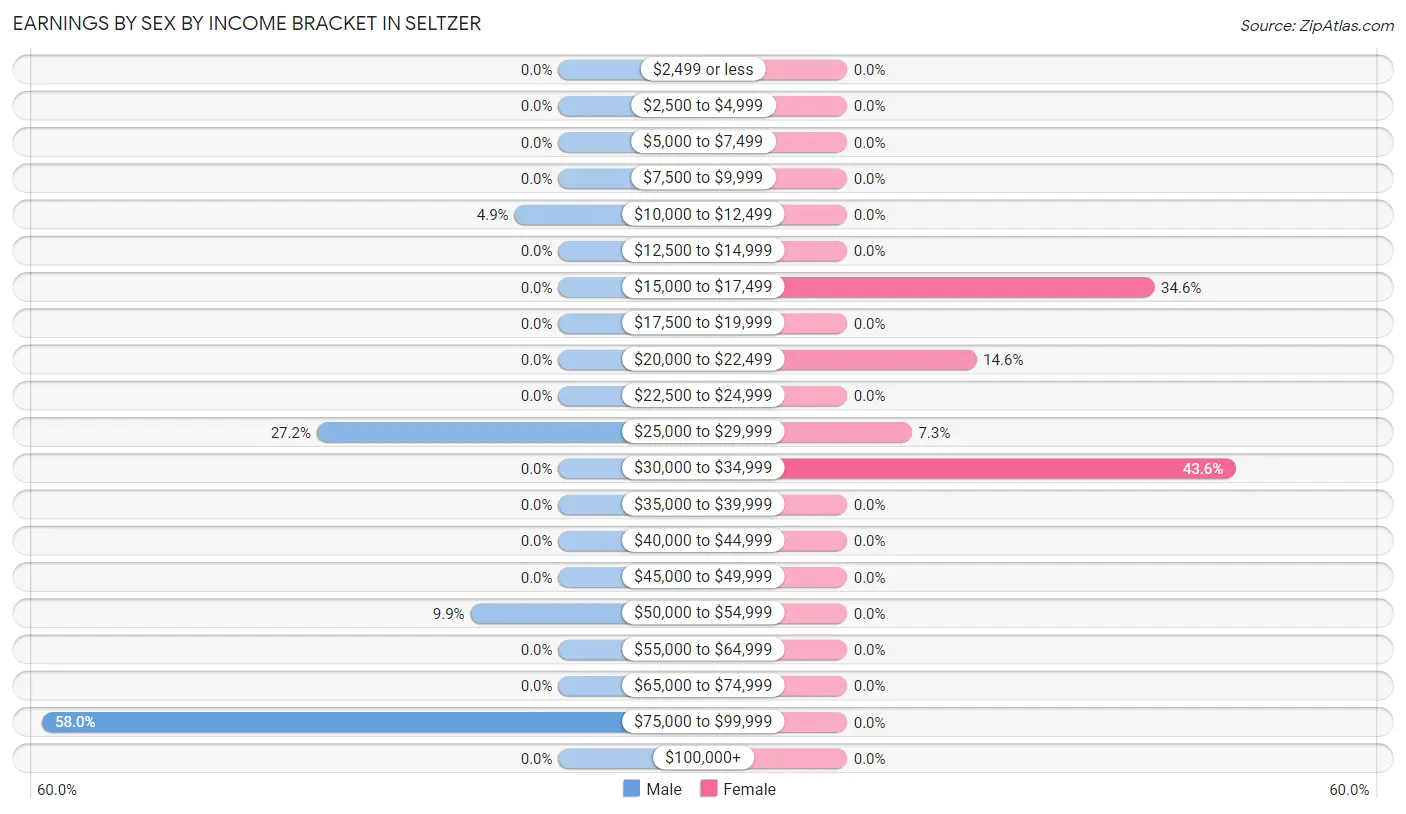
Earnings by Sex by Income Bracket in Seltzer
The most common earnings brackets in Seltzer are $75,000 to $99,999 for men (47 | 58.0%) and $30,000 to $34,999 for women (24 | 43.6%).
| Income | Male | Female |
| $2,499 or less | 0 (0.0%) | 0 (0.0%) |
| $2,500 to $4,999 | 0 (0.0%) | 0 (0.0%) |
| $5,000 to $7,499 | 0 (0.0%) | 0 (0.0%) |
| $7,500 to $9,999 | 0 (0.0%) | 0 (0.0%) |
| $10,000 to $12,499 | 4 (4.9%) | 0 (0.0%) |
| $12,500 to $14,999 | 0 (0.0%) | 0 (0.0%) |
| $15,000 to $17,499 | 0 (0.0%) | 19 (34.5%) |
| $17,500 to $19,999 | 0 (0.0%) | 0 (0.0%) |
| $20,000 to $22,499 | 0 (0.0%) | 8 (14.5%) |
| $22,500 to $24,999 | 0 (0.0%) | 0 (0.0%) |
| $25,000 to $29,999 | 22 (27.2%) | 4 (7.3%) |
| $30,000 to $34,999 | 0 (0.0%) | 24 (43.6%) |
| $35,000 to $39,999 | 0 (0.0%) | 0 (0.0%) |
| $40,000 to $44,999 | 0 (0.0%) | 0 (0.0%) |
| $45,000 to $49,999 | 0 (0.0%) | 0 (0.0%) |
| $50,000 to $54,999 | 8 (9.9%) | 0 (0.0%) |
| $55,000 to $64,999 | 0 (0.0%) | 0 (0.0%) |
| $65,000 to $74,999 | 0 (0.0%) | 0 (0.0%) |
| $75,000 to $99,999 | 47 (58.0%) | 0 (0.0%) |
| $100,000+ | 0 (0.0%) | 0 (0.0%) |
| Total | 81 (100.0%) | 55 (100.0%) |
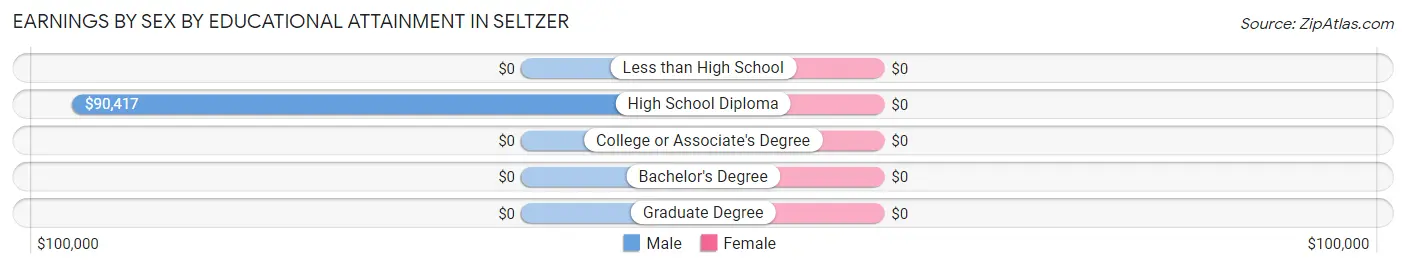
Earnings by Sex by Educational Attainment in Seltzer
| Educational Attainment | Male Income | Female Income |
| Less than High School | - | - |
| High School Diploma | $90,417 | $0 |
| College or Associate's Degree | - | - |
| Bachelor's Degree | - | - |
| Graduate Degree | - | - |
| Total | $83,060 | $0 |
Family Income in Seltzer
Family Income Brackets in Seltzer
According to the Seltzer family income data, there are 36 families falling into the $100,000 to $149,999 income range, which is the most common income bracket and makes up 33.3% of all families.
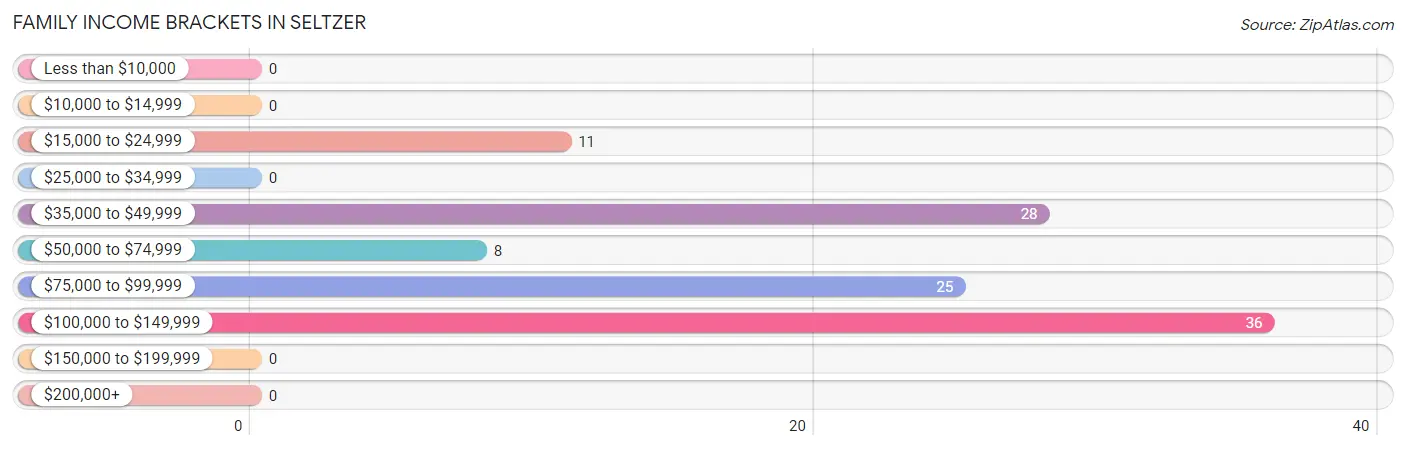
| Income Bracket | # Families | % Families |
| Less than $10,000 | 0 | 0.0% |
| $10,000 to $14,999 | 0 | 0.0% |
| $15,000 to $24,999 | 11 | 10.2% |
| $25,000 to $34,999 | 0 | 0.0% |
| $35,000 to $49,999 | 28 | 25.9% |
| $50,000 to $74,999 | 8 | 7.4% |
| $75,000 to $99,999 | 25 | 23.1% |
| $100,000 to $149,999 | 36 | 33.3% |
| $150,000 to $199,999 | 0 | 0.0% |
| $200,000+ | 0 | 0.0% |
Family Income by Famaliy Size in Seltzer
2-person families (46 | 42.6%) account for the highest median family income in Seltzer with $104,048 per family, while 2-person families (46 | 42.6%) have the highest median income of $52,024 per family member.
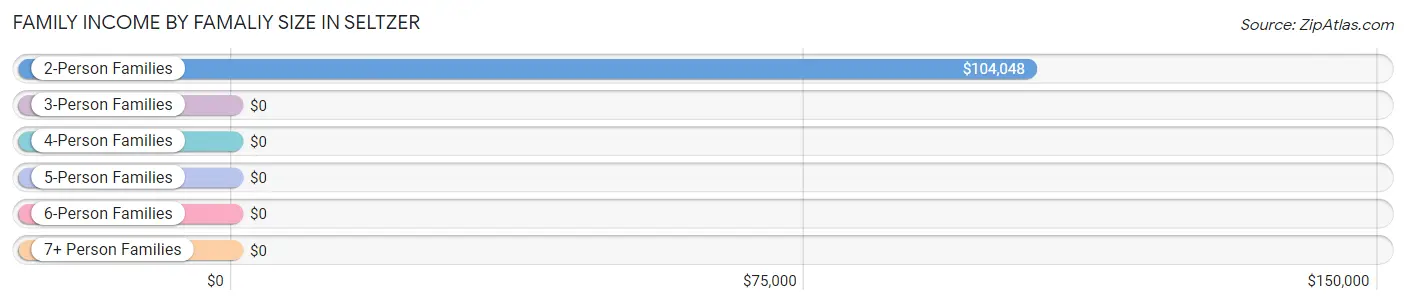
| Income Bracket | # Families | Median Income |
| 2-Person Families | 46 (42.6%) | $104,048 |
| 3-Person Families | 11 (10.2%) | $0 |
| 4-Person Families | 29 (26.9%) | $0 |
| 5-Person Families | 22 (20.4%) | $0 |
| 6-Person Families | 0 (0.0%) | $0 |
| 7+ Person Families | 0 (0.0%) | $0 |
| Total | 108 (100.0%) | $83,200 |
Family Income by Number of Earners in Seltzer
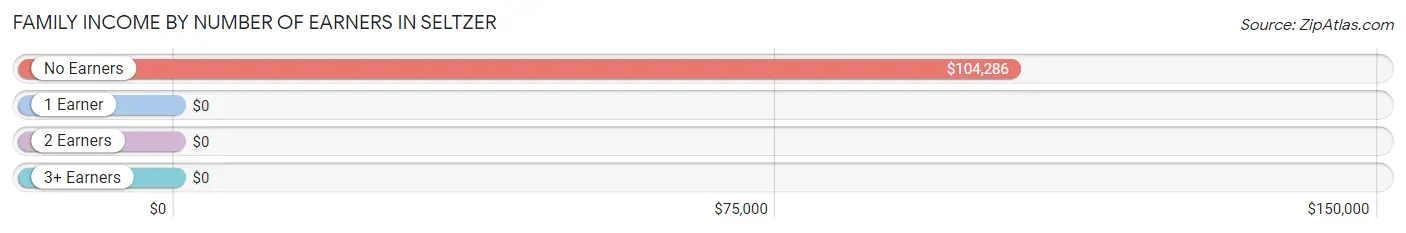
| Number of Earners | # Families | Median Income |
| No Earners | 42 (38.9%) | $104,286 |
| 1 Earner | 54 (50.0%) | $0 |
| 2 Earners | 12 (11.1%) | $0 |
| 3+ Earners | 0 (0.0%) | $0 |
| Total | 108 (100.0%) | $83,200 |
Household Income in Seltzer
Household Income Brackets in Seltzer
With 54 households falling in the category, the $100,000 to $149,999 income range is the most frequent in Seltzer, accounting for 42.9% of all households.
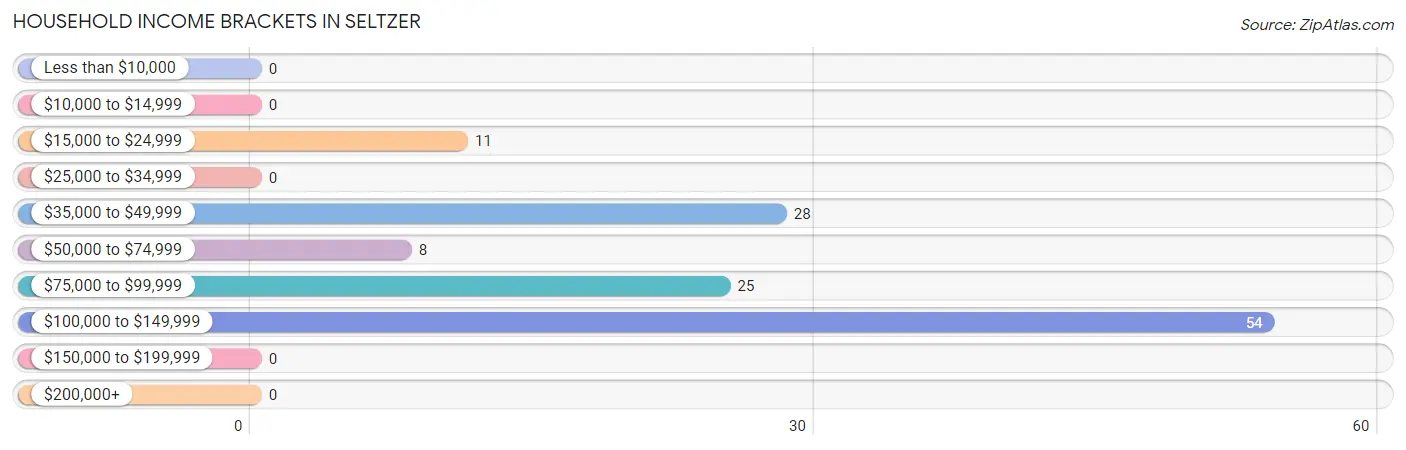
| Income Bracket | # Households | % Households |
| Less than $10,000 | 0 | 0.0% |
| $10,000 to $14,999 | 0 | 0.0% |
| $15,000 to $24,999 | 11 | 8.7% |
| $25,000 to $34,999 | 0 | 0.0% |
| $35,000 to $49,999 | 28 | 22.2% |
| $50,000 to $74,999 | 8 | 6.3% |
| $75,000 to $99,999 | 25 | 19.8% |
| $100,000 to $149,999 | 54 | 42.9% |
| $150,000 to $199,999 | 0 | 0.0% |
| $200,000+ | 0 | 0.0% |
Household Income by Householder Age in Seltzer
The median household income in Seltzer is $84,100, with the highest median household income of $104,048 found in the 65+ years age bracket for the primary householder. A total of 46 households (36.5%) fall into this category.
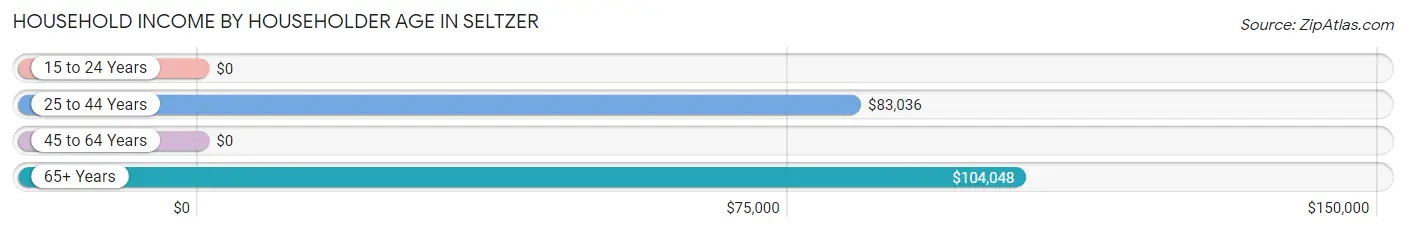
| Income Bracket | # Households | Median Income |
| 15 to 24 Years | 0 (0.0%) | $0 |
| 25 to 44 Years | 69 (54.8%) | $83,036 |
| 45 to 64 Years | 11 (8.7%) | $0 |
| 65+ Years | 46 (36.5%) | $104,048 |
| Total | 126 (100.0%) | $84,100 |
Poverty in Seltzer
Income Below Poverty by Sex and Age in Seltzer
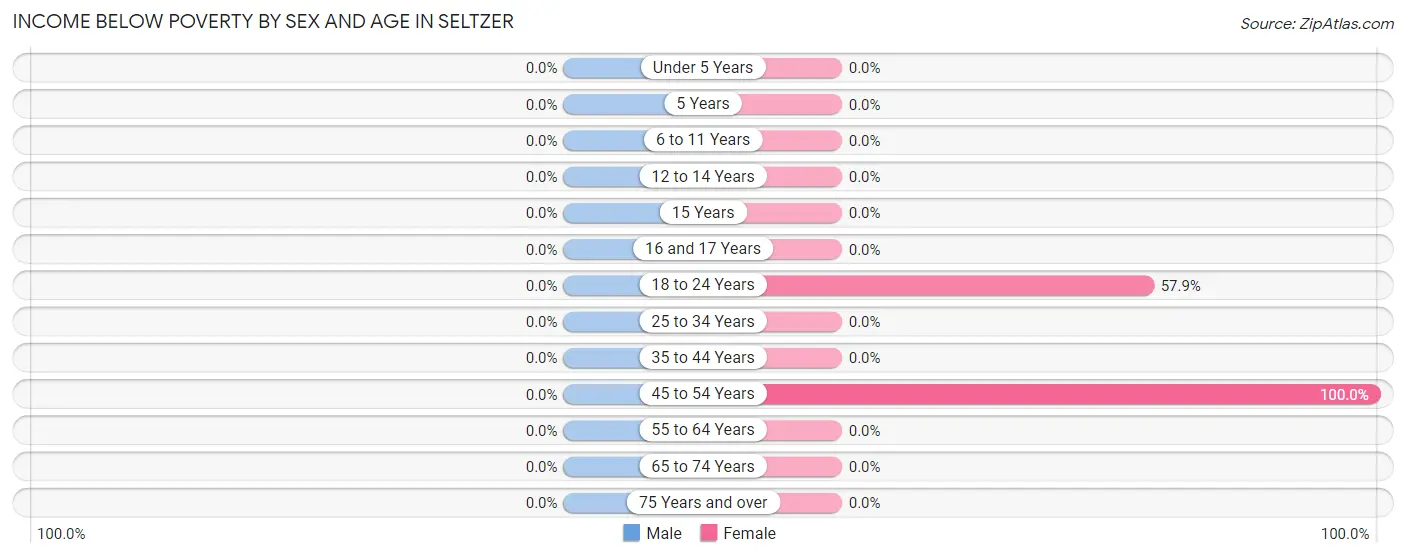
| Age Bracket | Male | Female |
| Under 5 Years | 0 (0.0%) | 0 (0.0%) |
| 5 Years | 0 (0.0%) | 0 (0.0%) |
| 6 to 11 Years | 0 (0.0%) | 0 (0.0%) |
| 12 to 14 Years | 0 (0.0%) | 0 (0.0%) |
| 15 Years | 0 (0.0%) | 0 (0.0%) |
| 16 and 17 Years | 0 (0.0%) | 0 (0.0%) |
| 18 to 24 Years | 0 (0.0%) | 33 (57.9%) |
| 25 to 34 Years | 0 (0.0%) | 0 (0.0%) |
| 35 to 44 Years | 0 (0.0%) | 0 (0.0%) |
| 45 to 54 Years | 0 (0.0%) | 11 (100.0%) |
| 55 to 64 Years | 0 (0.0%) | 0 (0.0%) |
| 65 to 74 Years | 0 (0.0%) | 0 (0.0%) |
| 75 Years and over | 0 (0.0%) | 0 (0.0%) |
| Total | 0 (0.0%) | 44 (20.7%) |
Income Above Poverty by Sex and Age in Seltzer
According to the poverty statistics in Seltzer, males aged under 5 years and females aged under 5 years are the age groups that are most secure financially, with 100.0% of males and 100.0% of females in these age groups living above the poverty line.
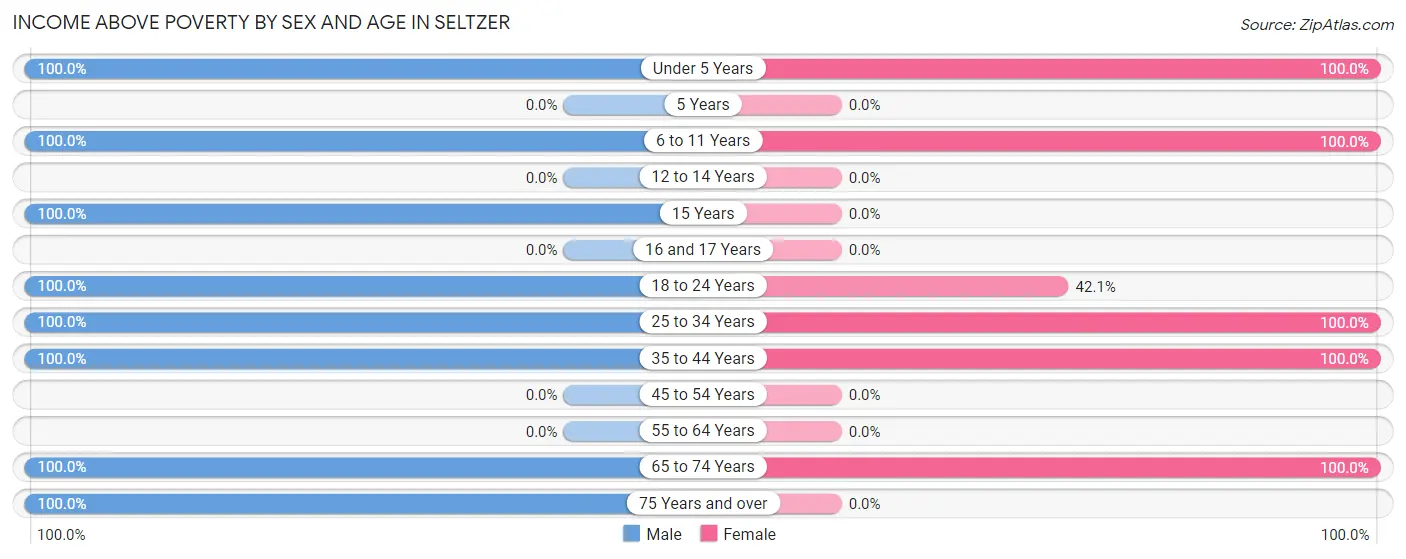
| Age Bracket | Male | Female |
| Under 5 Years | 22 (100.0%) | 35 (100.0%) |
| 5 Years | 0 (0.0%) | 0 (0.0%) |
| 6 to 11 Years | 16 (100.0%) | 19 (100.0%) |
| 12 to 14 Years | 0 (0.0%) | 0 (0.0%) |
| 15 Years | 9 (100.0%) | 0 (0.0%) |
| 16 and 17 Years | 0 (0.0%) | 0 (0.0%) |
| 18 to 24 Years | 14 (100.0%) | 24 (42.1%) |
| 25 to 34 Years | 69 (100.0%) | 17 (100.0%) |
| 35 to 44 Years | 8 (100.0%) | 29 (100.0%) |
| 45 to 54 Years | 0 (0.0%) | 0 (0.0%) |
| 55 to 64 Years | 0 (0.0%) | 0 (0.0%) |
| 65 to 74 Years | 25 (100.0%) | 45 (100.0%) |
| 75 Years and over | 20 (100.0%) | 0 (0.0%) |
| Total | 183 (100.0%) | 169 (79.3%) |
Income Below Poverty Among Married-Couple Families in Seltzer
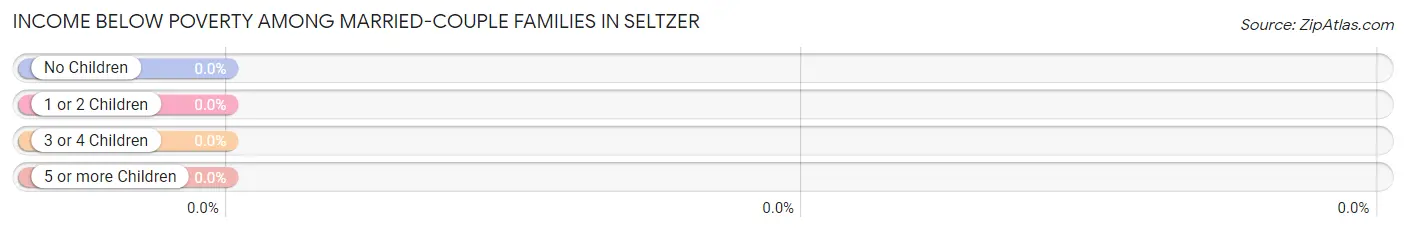
| Children | Above Poverty | Below Poverty |
| No Children | 46 (100.0%) | 0 (0.0%) |
| 1 or 2 Children | 29 (100.0%) | 0 (0.0%) |
| 3 or 4 Children | 22 (100.0%) | 0 (0.0%) |
| 5 or more Children | 0 (0.0%) | 0 (0.0%) |
| Total | 97 (100.0%) | 0 (0.0%) |
Income Below Poverty Among Single-Parent Households in Seltzer
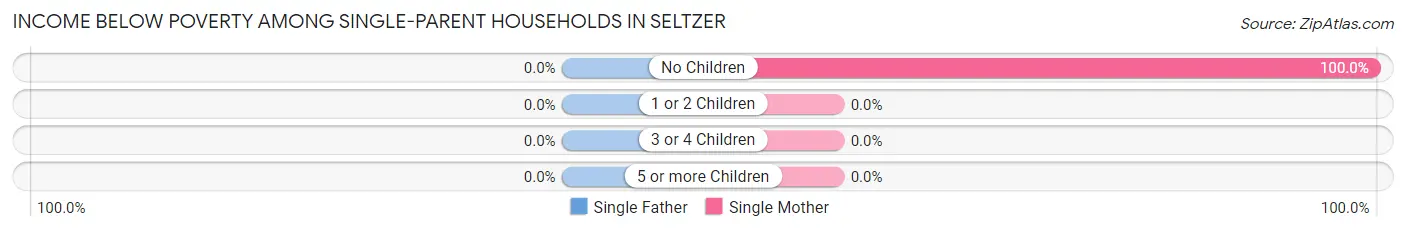
| Children | Single Father | Single Mother |
| No Children | 0 (0.0%) | 11 (100.0%) |
| 1 or 2 Children | 0 (0.0%) | 0 (0.0%) |
| 3 or 4 Children | 0 (0.0%) | 0 (0.0%) |
| 5 or more Children | 0 (0.0%) | 0 (0.0%) |
| Total | 0 (0.0%) | 11 (100.0%) |
Income Below Poverty Among Married-Couple vs Single-Parent Households in Seltzer
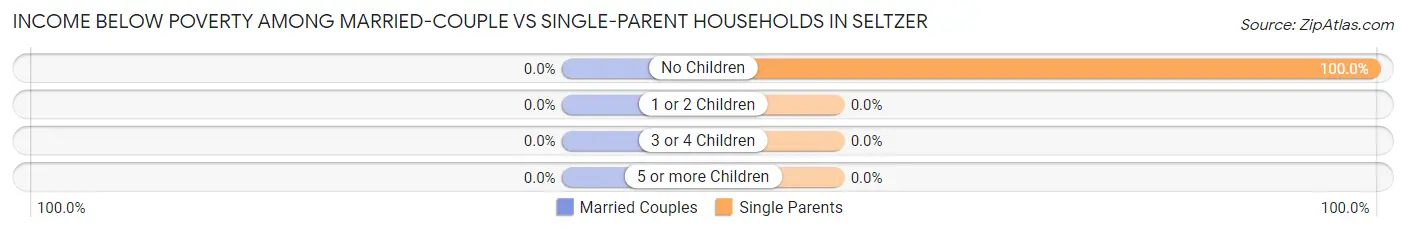
| Children | Married-Couple Families | Single-Parent Households |
| No Children | 0 (0.0%) | 11 (100.0%) |
| 1 or 2 Children | 0 (0.0%) | 0 (0.0%) |
| 3 or 4 Children | 0 (0.0%) | 0 (0.0%) |
| 5 or more Children | 0 (0.0%) | 0 (0.0%) |
| Total | 0 (0.0%) | 11 (100.0%) |
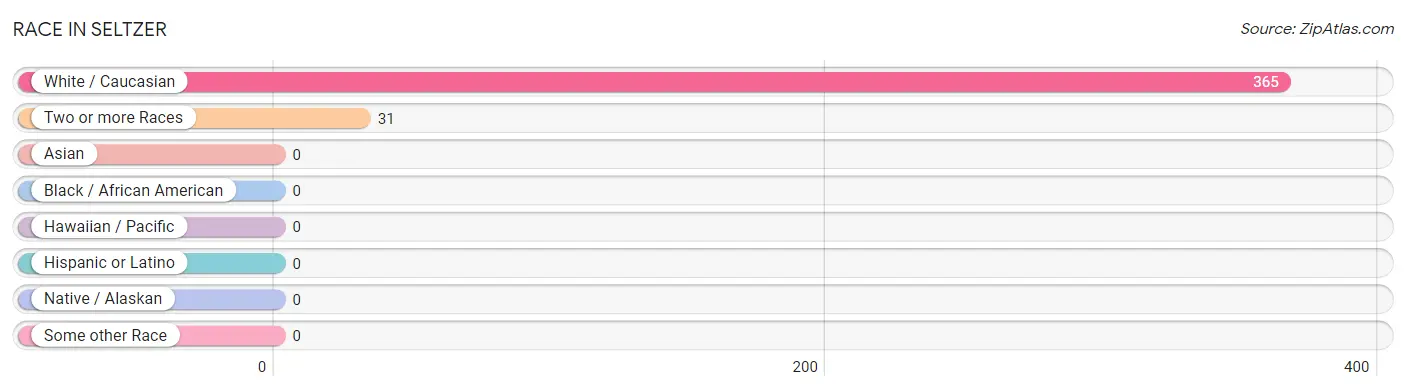
Race in Seltzer
The most populous races in Seltzer are White / Caucasian (365 | 92.2%), and Two or more Races (31 | 7.8%).
| Race | # Population | % Population |
| Asian | 0 | 0.0% |
| Black / African American | 0 | 0.0% |
| Hawaiian / Pacific | 0 | 0.0% |
| Hispanic or Latino | 0 | 0.0% |
| Native / Alaskan | 0 | 0.0% |
| White / Caucasian | 365 | 92.2% |
| Two or more Races | 31 | 7.8% |
| Some other Race | 0 | 0.0% |
| Total | 396 | 100.0% |
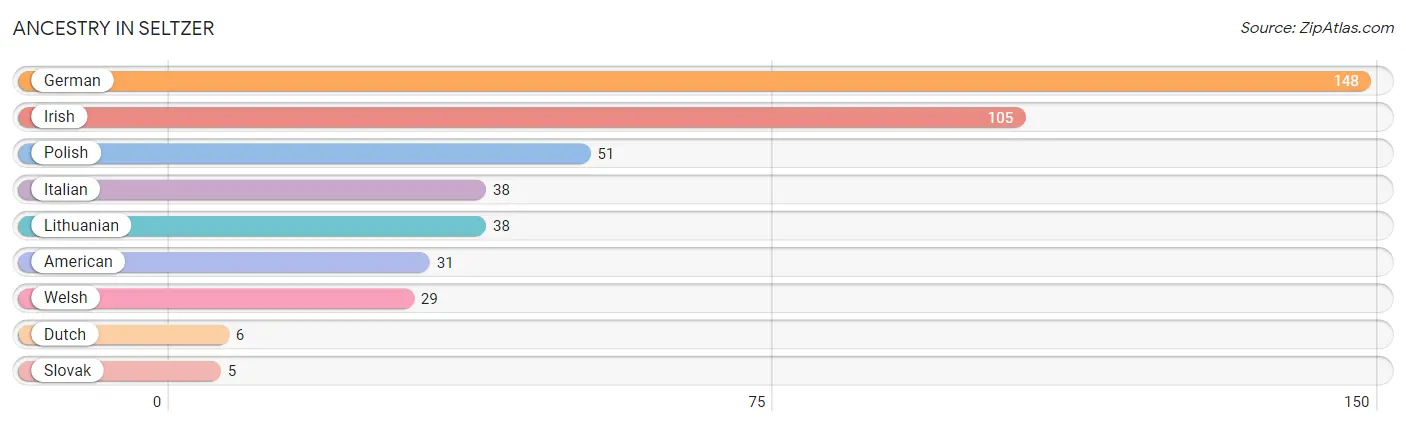
Ancestry in Seltzer
The most populous ancestries reported in Seltzer are German (148 | 37.4%), Irish (105 | 26.5%), Polish (51 | 12.9%), Italian (38 | 9.6%), and Lithuanian (38 | 9.6%), together accounting for 96.0% of all Seltzer residents.
| Ancestry | # Population | % Population |
| American | 31 | 7.8% |
| Dutch | 6 | 1.5% |
| German | 148 | 37.4% |
| Irish | 105 | 26.5% |
| Italian | 38 | 9.6% |
| Lithuanian | 38 | 9.6% |
| Polish | 51 | 12.9% |
| Slovak | 5 | 1.3% |
| Welsh | 29 | 7.3% | View All 9 Rows |
Immigrants in Seltzer

| Immigration Origin | # Population | % Population | View All 0 Rows |
Sex and Age in Seltzer
Sex and Age in Seltzer
The most populous age groups in Seltzer are 30 to 34 Years (51 | 27.9%) for men and 20 to 24 Years (43 | 20.2%) for women.
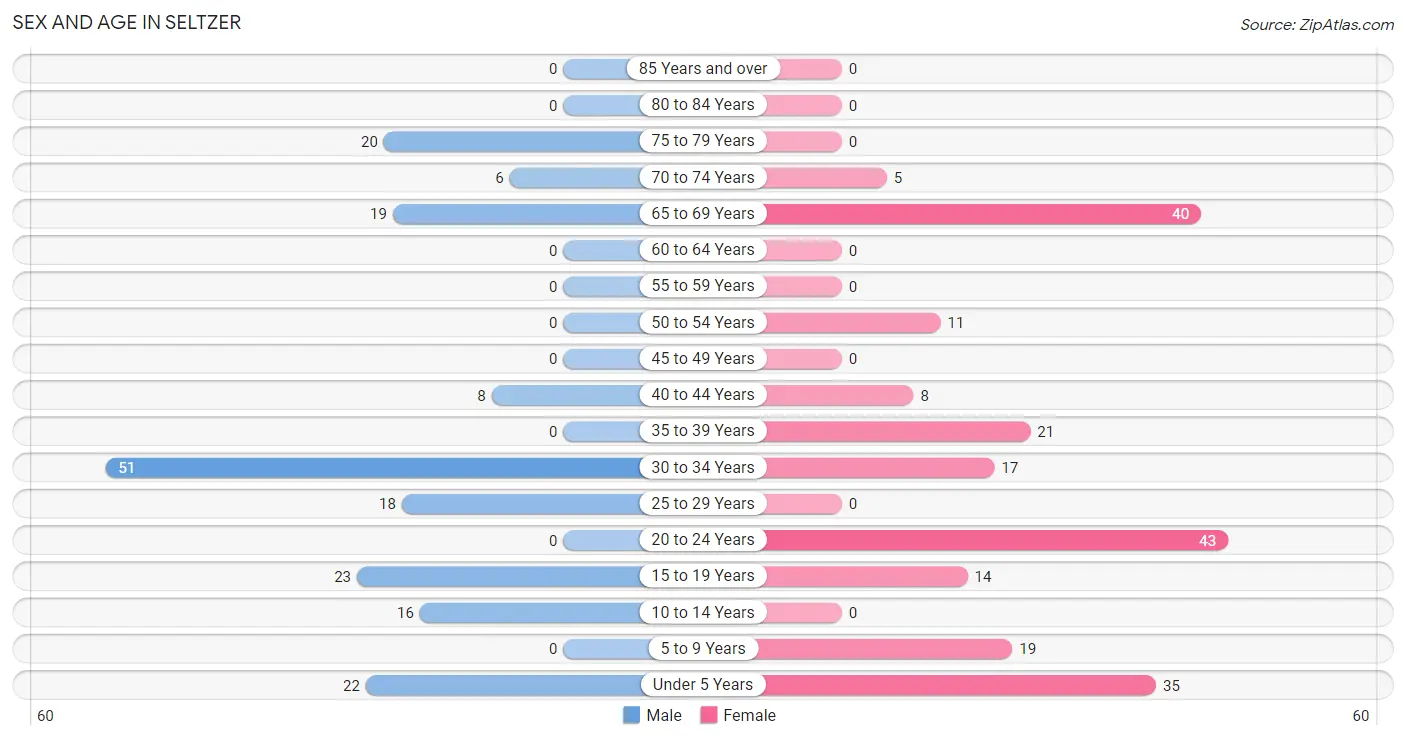
| Age Bracket | Male | Female |
| Under 5 Years | 22 (12.0%) | 35 (16.4%) |
| 5 to 9 Years | 0 (0.0%) | 19 (8.9%) |
| 10 to 14 Years | 16 (8.7%) | 0 (0.0%) |
| 15 to 19 Years | 23 (12.6%) | 14 (6.6%) |
| 20 to 24 Years | 0 (0.0%) | 43 (20.2%) |
| 25 to 29 Years | 18 (9.8%) | 0 (0.0%) |
| 30 to 34 Years | 51 (27.9%) | 17 (8.0%) |
| 35 to 39 Years | 0 (0.0%) | 21 (9.9%) |
| 40 to 44 Years | 8 (4.4%) | 8 (3.8%) |
| 45 to 49 Years | 0 (0.0%) | 0 (0.0%) |
| 50 to 54 Years | 0 (0.0%) | 11 (5.2%) |
| 55 to 59 Years | 0 (0.0%) | 0 (0.0%) |
| 60 to 64 Years | 0 (0.0%) | 0 (0.0%) |
| 65 to 69 Years | 19 (10.4%) | 40 (18.8%) |
| 70 to 74 Years | 6 (3.3%) | 5 (2.4%) |
| 75 to 79 Years | 20 (10.9%) | 0 (0.0%) |
| 80 to 84 Years | 0 (0.0%) | 0 (0.0%) |
| 85 Years and over | 0 (0.0%) | 0 (0.0%) |
| Total | 183 (100.0%) | 213 (100.0%) |
Families and Households in Seltzer
Median Family Size in Seltzer
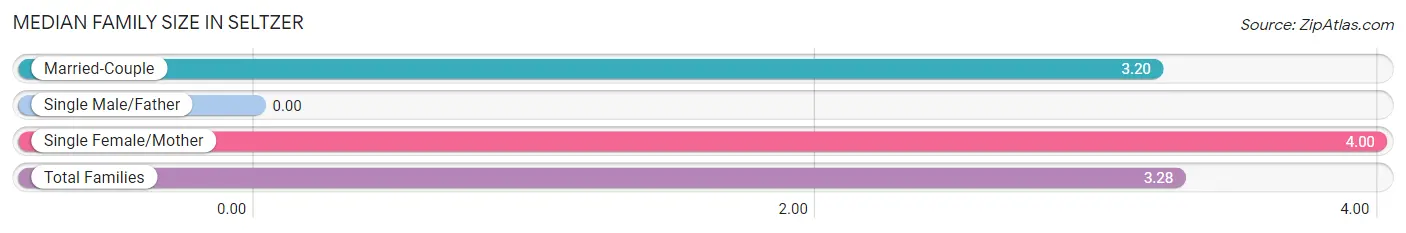
| Family Type | # Families | Family Size |
| Married-Couple | 97 (89.8%) | 3.20 |
| Single Male/Father | 0 (0.0%) | - |
| Single Female/Mother | 11 (10.2%) | 4.00 |
| Total Families | 108 (100.0%) | 3.28 |
Median Household Size in Seltzer
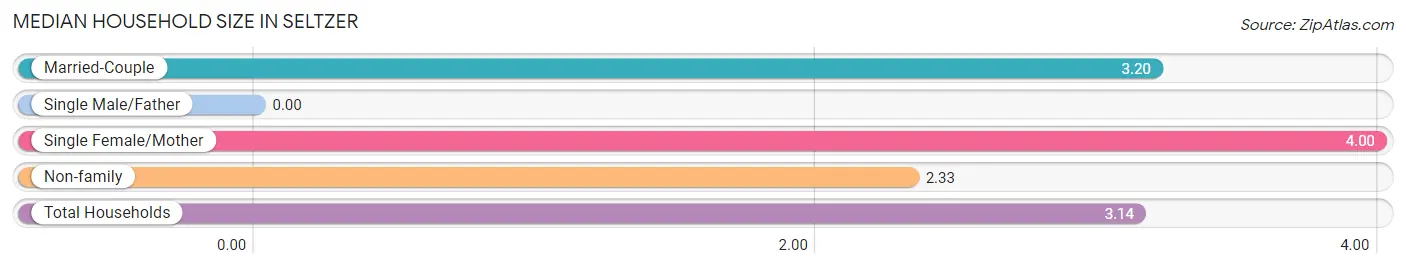
| Household Type | # Households | Household Size |
| Married-Couple | 97 (77.0%) | 3.20 |
| Single Male/Father | 0 (0.0%) | - |
| Single Female/Mother | 11 (8.7%) | 4.00 |
| Non-family | 18 (14.3%) | 2.33 |
| Total Households | 126 (100.0%) | 3.14 |
Household Size by Marriage Status in Seltzer
Out of a total of 126 households in Seltzer, 108 (85.7%) are family households, while 18 (14.3%) are nonfamily households. The most numerous type of family households are 2-person households, comprising 46, and the most common type of nonfamily households are 2-person households, comprising 18.
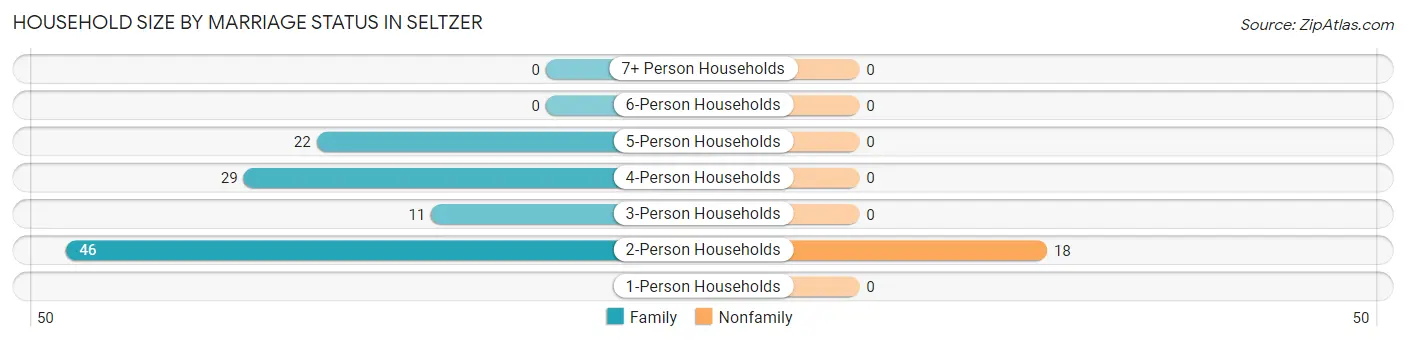
| Household Size | Family Households | Nonfamily Households |
| 1-Person Households | - | 0 (0.0%) |
| 2-Person Households | 46 (36.5%) | 18 (14.3%) |
| 3-Person Households | 11 (8.7%) | 0 (0.0%) |
| 4-Person Households | 29 (23.0%) | 0 (0.0%) |
| 5-Person Households | 22 (17.5%) | 0 (0.0%) |
| 6-Person Households | 0 (0.0%) | 0 (0.0%) |
| 7+ Person Households | 0 (0.0%) | 0 (0.0%) |
| Total | 108 (85.7%) | 18 (14.3%) |
Female Fertility in Seltzer
Fertility by Age in Seltzer
| Age Bracket | Women with Births | Births / 1,000 Women |
| 15 to 19 years | 0 (0.0%) | 0.0 |
| 20 to 34 years | 0 (0.0%) | 0.0 |
| 35 to 50 years | 0 (0.0%) | 0.0 |
| Total | 0 (0.0%) | 0.0 |
Fertility by Age by Marriage Status in Seltzer
| Age Bracket | Married | Unmarried |
| 15 to 19 years | 0 (0.0%) | 0 (0.0%) |
| 20 to 34 years | 0 (0.0%) | 0 (0.0%) |
| 35 to 50 years | 0 (0.0%) | 0 (0.0%) |
| Total | 0 (0.0%) | 0 (0.0%) |
Fertility by Education in Seltzer
| Educational Attainment | Women with Births | Births / 1,000 Women |
| Less than High School | 0 (0.0%) | 0.0 |
| High School Diploma | 0 (0.0%) | 0.0 |
| College or Associate's Degree | 0 (0.0%) | 0.0 |
| Bachelor's Degree | 0 (0.0%) | 0.0 |
| Graduate Degree | 0 (0.0%) | 0.0 |
| Total | 0 (0.0%) | 0.0 |
Fertility by Education by Marriage Status in Seltzer
| Educational Attainment | Married | Unmarried |
| Less than High School | 0 (0.0%) | 0 (0.0%) |
| High School Diploma | 0 (0.0%) | 0 (0.0%) |
| College or Associate's Degree | 0 (0.0%) | 0 (0.0%) |
| Bachelor's Degree | 0 (0.0%) | 0 (0.0%) |
| Graduate Degree | 0 (0.0%) | 0 (0.0%) |
| Total | 0 (0.0%) | 0 (0.0%) |
Employment Characteristics in Seltzer
Employment by Class of Employer in Seltzer
Among the 136 employed individuals in Seltzer, private company employees (109 | 80.1%), state government employees (19 | 14.0%), and self-employed (not incorporated) (8 | 5.9%) make up the most common classes of employment.
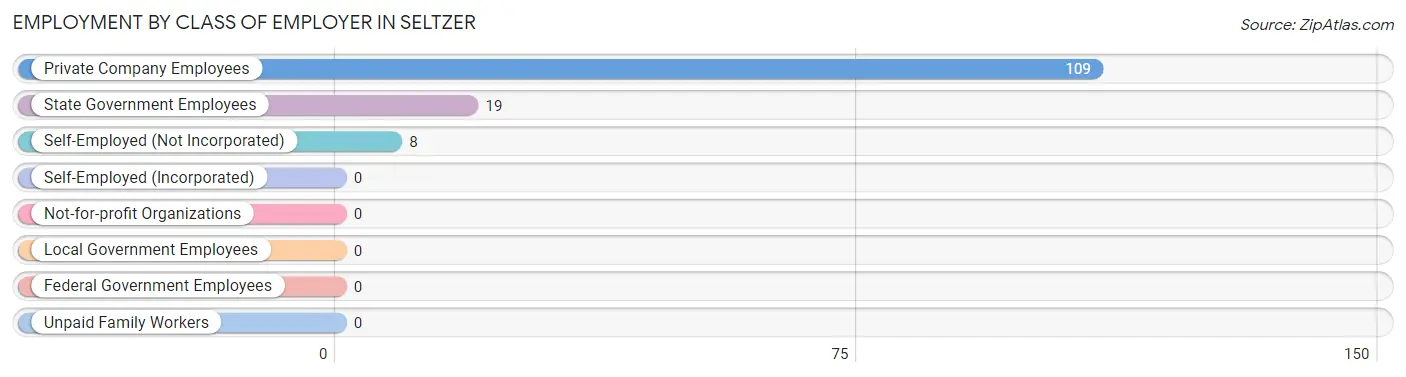
| Employer Class | # Employees | % Employees |
| Private Company Employees | 109 | 80.1% |
| Self-Employed (Incorporated) | 0 | 0.0% |
| Self-Employed (Not Incorporated) | 8 | 5.9% |
| Not-for-profit Organizations | 0 | 0.0% |
| Local Government Employees | 0 | 0.0% |
| State Government Employees | 19 | 14.0% |
| Federal Government Employees | 0 | 0.0% |
| Unpaid Family Workers | 0 | 0.0% |
| Total | 136 | 100.0% |
Employment Status by Age in Seltzer
According to the labor force statistics for Seltzer, out of the total population over 16 years of age (295), 50.8% or 150 individuals are in the labor force, with 9.3% or 14 of them unemployed. The age group with the highest labor force participation rate is 20 to 24 years, with 100.0% or 43 individuals in the labor force. Within the labor force, the 16 to 19 years age range has the highest percentage of unemployed individuals, with 100.0% or 14 of them being unemployed.
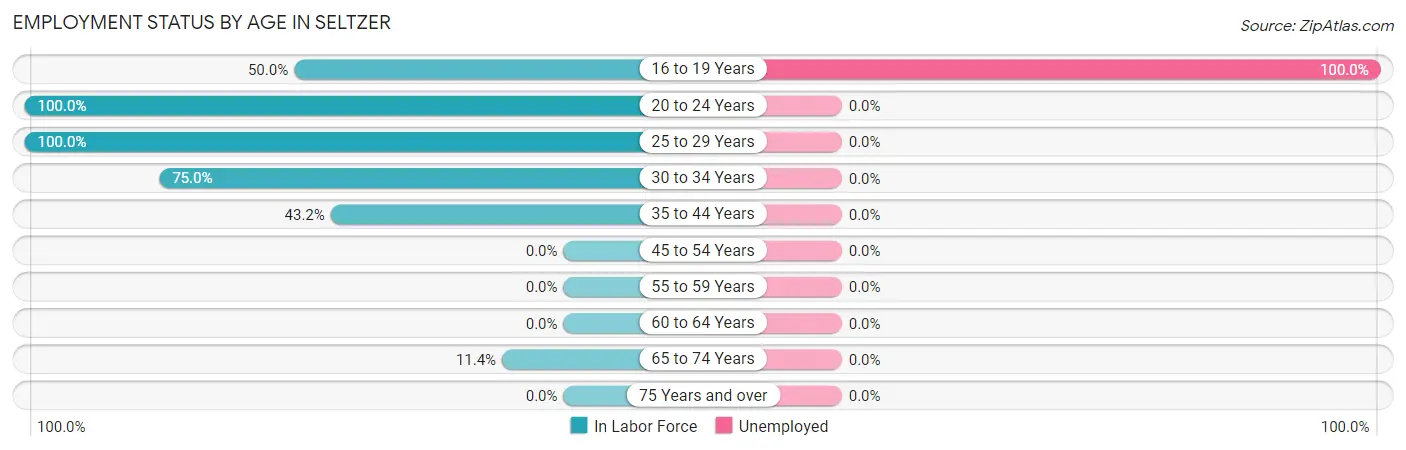
| Age Bracket | In Labor Force | Unemployed |
| 16 to 19 Years | 14 (50.0%) | 14 (100.0%) |
| 20 to 24 Years | 43 (100.0%) | 0 (0.0%) |
| 25 to 29 Years | 18 (100.0%) | 0 (0.0%) |
| 30 to 34 Years | 51 (75.0%) | 0 (0.0%) |
| 35 to 44 Years | 16 (43.2%) | 0 (0.0%) |
| 45 to 54 Years | 0 (0.0%) | 0 (0.0%) |
| 55 to 59 Years | 0 (0.0%) | 0 (0.0%) |
| 60 to 64 Years | 0 (0.0%) | 0 (0.0%) |
| 65 to 74 Years | 8 (11.4%) | 0 (0.0%) |
| 75 Years and over | 0 (0.0%) | 0 (0.0%) |
| Total | 150 (50.8%) | 14 (9.3%) |
Employment Status by Educational Attainment in Seltzer
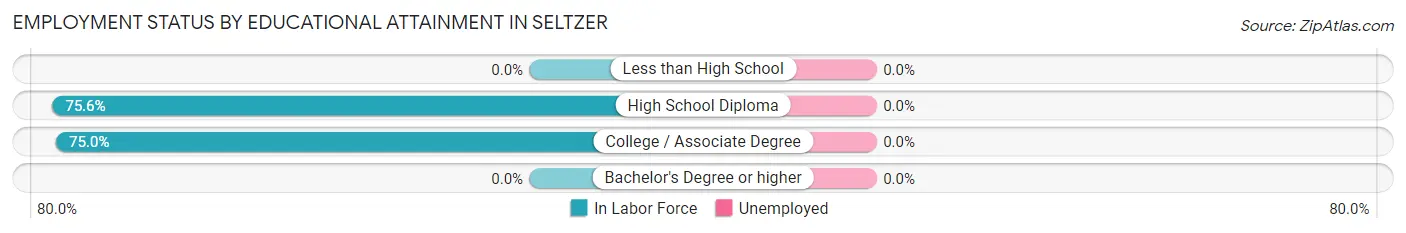
| Educational Attainment | In Labor Force | Unemployed |
| Less than High School | 0 (0.0%) | 0 (0.0%) |
| High School Diploma | 34 (75.6%) | 0 (0.0%) |
| College / Associate Degree | 51 (75.0%) | 0 (0.0%) |
| Bachelor's Degree or higher | 0 (0.0%) | 0 (0.0%) |
| Total | 85 (63.4%) | 0 (0.0%) |
Employment Occupations by Sex in Seltzer
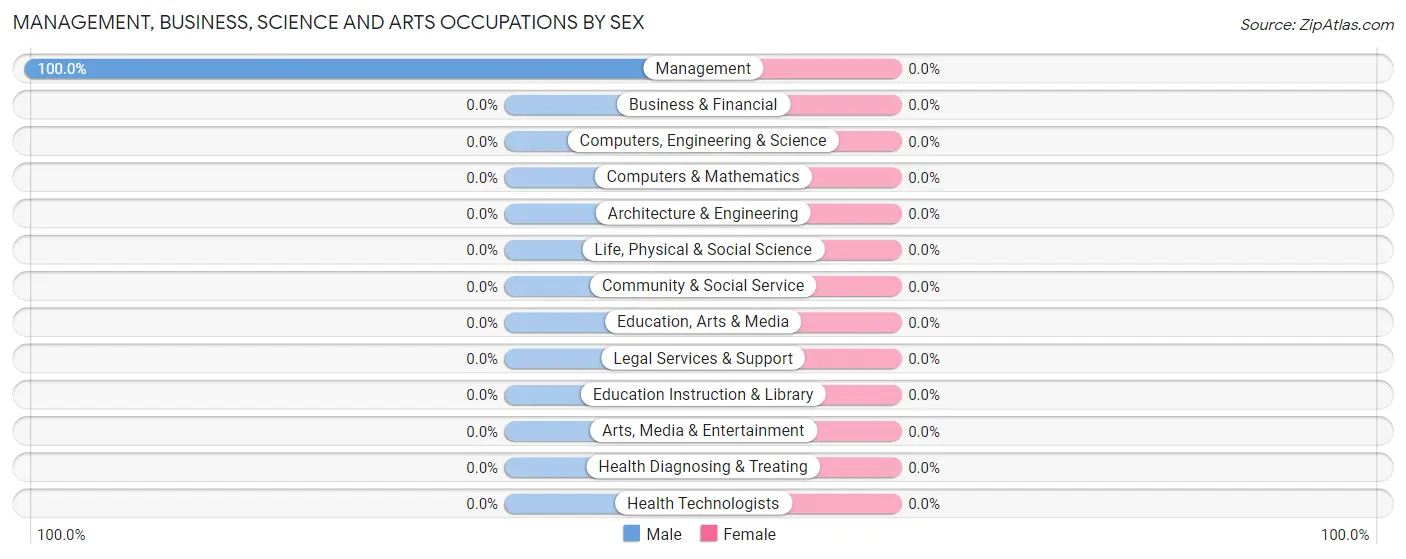
Management, Business, Science and Arts Occupations
The most common Management, Business, Science and Arts occupations in Seltzer are , and Management (29 | 21.3%).
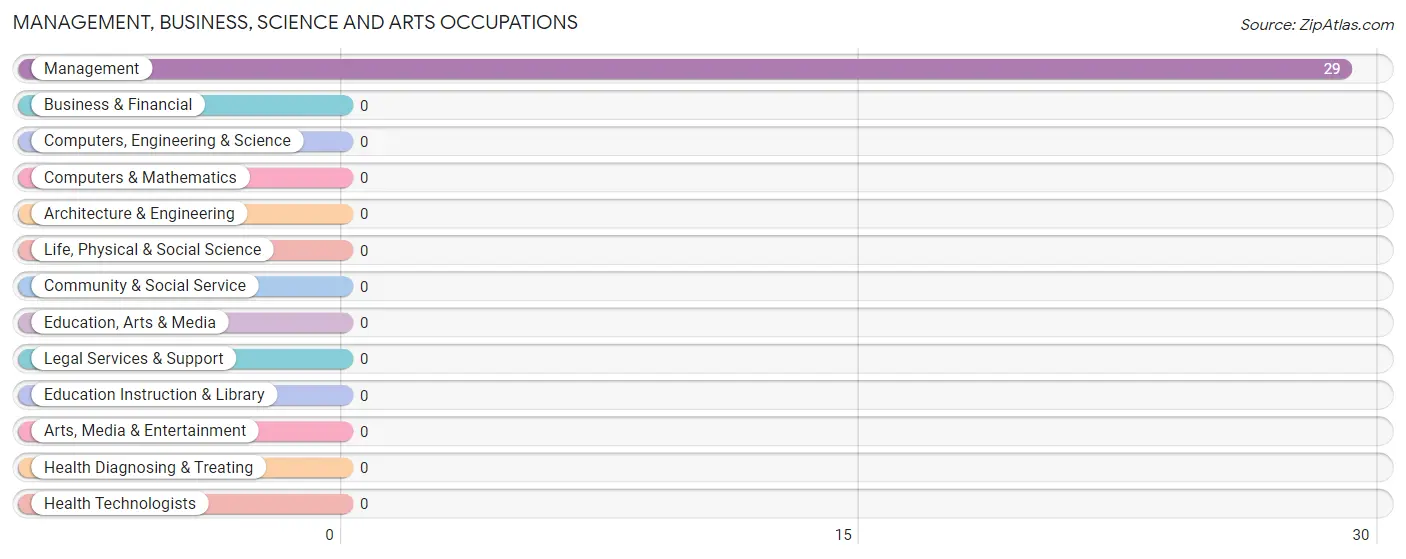
Management, Business, Science and Arts Occupations by Sex
| Occupation | Male | Female |
| Management | 29 (100.0%) | 0 (0.0%) |
| Business & Financial | 0 (0.0%) | 0 (0.0%) |
| Computers, Engineering & Science | 0 (0.0%) | 0 (0.0%) |
| Computers & Mathematics | 0 (0.0%) | 0 (0.0%) |
| Architecture & Engineering | 0 (0.0%) | 0 (0.0%) |
| Life, Physical & Social Science | 0 (0.0%) | 0 (0.0%) |
| Community & Social Service | 0 (0.0%) | 0 (0.0%) |
| Education, Arts & Media | 0 (0.0%) | 0 (0.0%) |
| Legal Services & Support | 0 (0.0%) | 0 (0.0%) |
| Education Instruction & Library | 0 (0.0%) | 0 (0.0%) |
| Arts, Media & Entertainment | 0 (0.0%) | 0 (0.0%) |
| Health Diagnosing & Treating | 0 (0.0%) | 0 (0.0%) |
| Health Technologists | 0 (0.0%) | 0 (0.0%) |
| Total (Category) | 29 (100.0%) | 0 (0.0%) |
| Total (Overall) | 81 (59.6%) | 55 (40.4%) |
Services Occupations
The most common Services occupations in Seltzer are , and Healthcare Support (8 | 5.9%).
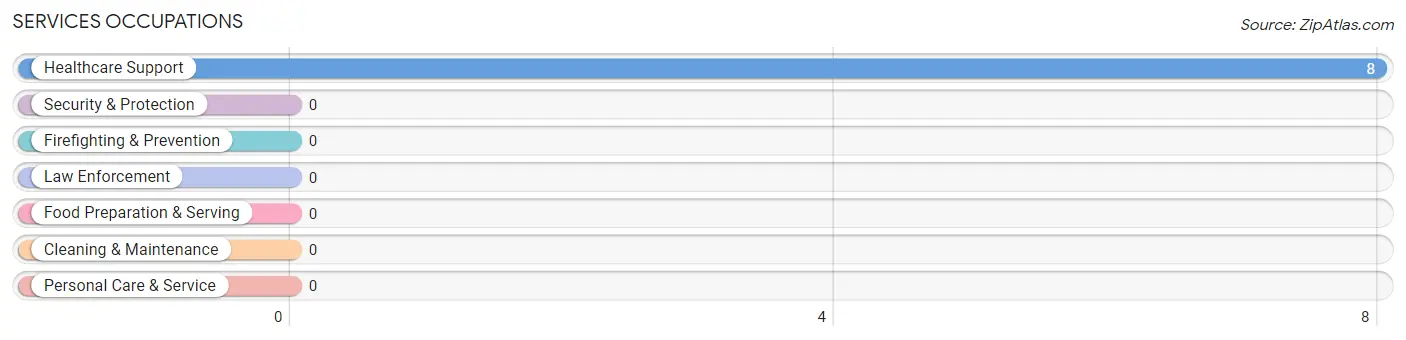
Services Occupations by Sex
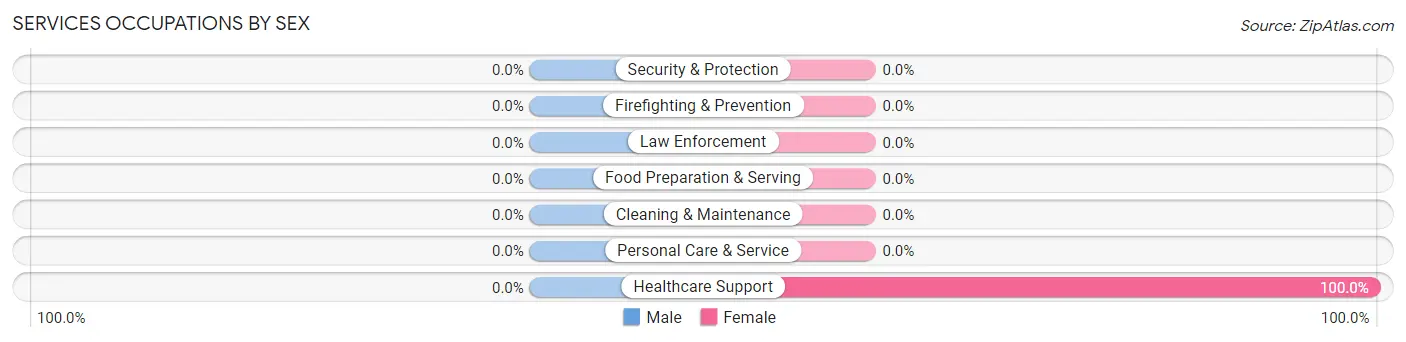
| Occupation | Male | Female |
| Healthcare Support | 0 (0.0%) | 8 (100.0%) |
| Security & Protection | 0 (0.0%) | 0 (0.0%) |
| Firefighting & Prevention | 0 (0.0%) | 0 (0.0%) |
| Law Enforcement | 0 (0.0%) | 0 (0.0%) |
| Food Preparation & Serving | 0 (0.0%) | 0 (0.0%) |
| Cleaning & Maintenance | 0 (0.0%) | 0 (0.0%) |
| Personal Care & Service | 0 (0.0%) | 0 (0.0%) |
| Total (Category) | 0 (0.0%) | 8 (100.0%) |
| Total (Overall) | 81 (59.6%) | 55 (40.4%) |
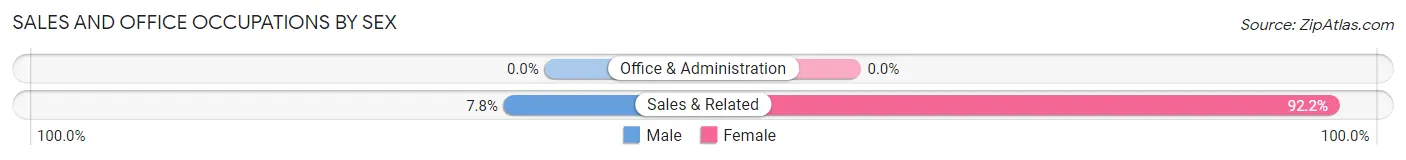
Sales and Office Occupations
The most common Sales and Office occupations in Seltzer are , and Sales & Related (51 | 37.5%).
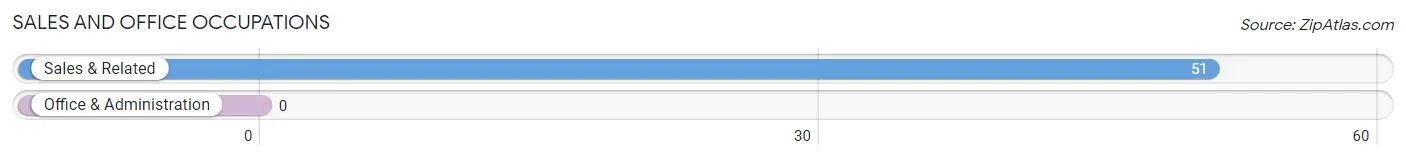
Sales and Office Occupations by Sex
| Occupation | Male | Female |
| Sales & Related | 4 (7.8%) | 47 (92.2%) |
| Office & Administration | 0 (0.0%) | 0 (0.0%) |
| Total (Category) | 4 (7.8%) | 47 (92.2%) |
| Total (Overall) | 81 (59.6%) | 55 (40.4%) |
Natural Resources, Construction and Maintenance Occupations
The most common Natural Resources, Construction and Maintenance occupations in Seltzer are Installation, Maintenance & Repair (22 | 16.2%), and Construction & Extraction (18 | 13.2%).
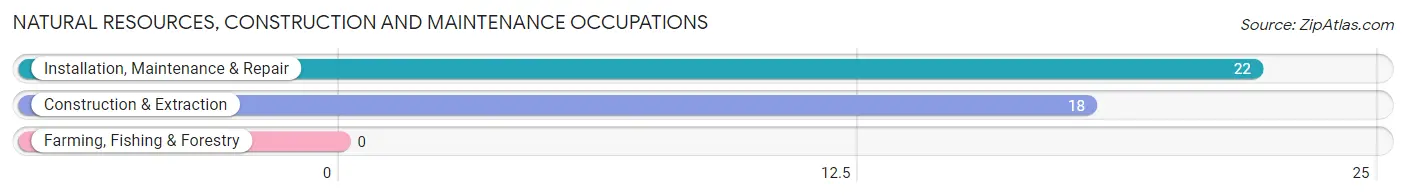
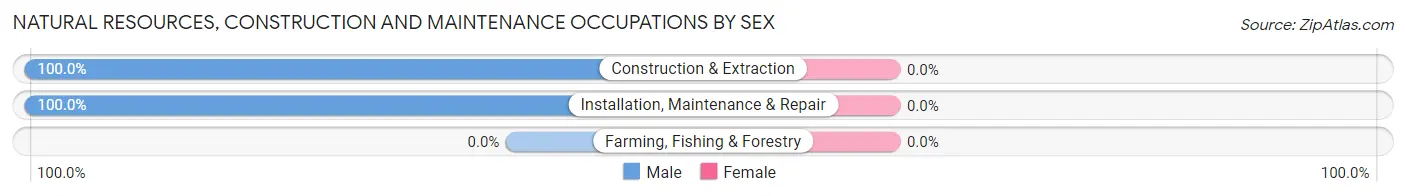
Natural Resources, Construction and Maintenance Occupations by Sex
| Occupation | Male | Female |
| Farming, Fishing & Forestry | 0 (0.0%) | 0 (0.0%) |
| Construction & Extraction | 18 (100.0%) | 0 (0.0%) |
| Installation, Maintenance & Repair | 22 (100.0%) | 0 (0.0%) |
| Total (Category) | 40 (100.0%) | 0 (0.0%) |
| Total (Overall) | 81 (59.6%) | 55 (40.4%) |
Production, Transportation and Moving Occupations
The most common Production, Transportation and Moving occupations in Seltzer are , and Production (8 | 5.9%).
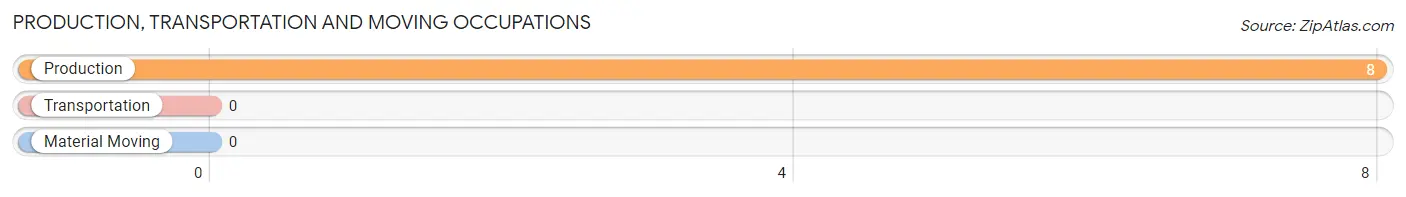
Production, Transportation and Moving Occupations by Sex
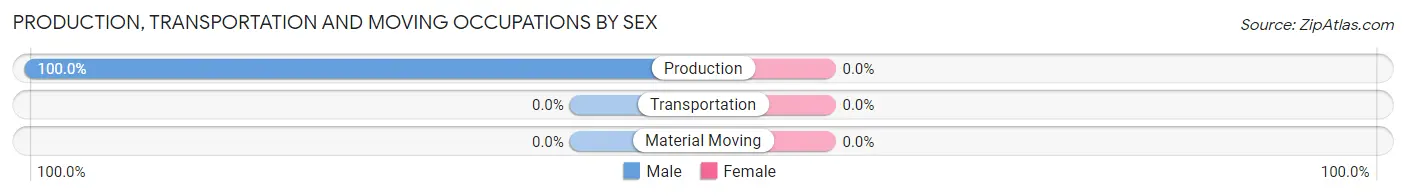
| Occupation | Male | Female |
| Production | 8 (100.0%) | 0 (0.0%) |
| Transportation | 0 (0.0%) | 0 (0.0%) |
| Material Moving | 0 (0.0%) | 0 (0.0%) |
| Total (Category) | 8 (100.0%) | 0 (0.0%) |
| Total (Overall) | 81 (59.6%) | 55 (40.4%) |
Employment Industries by Sex in Seltzer
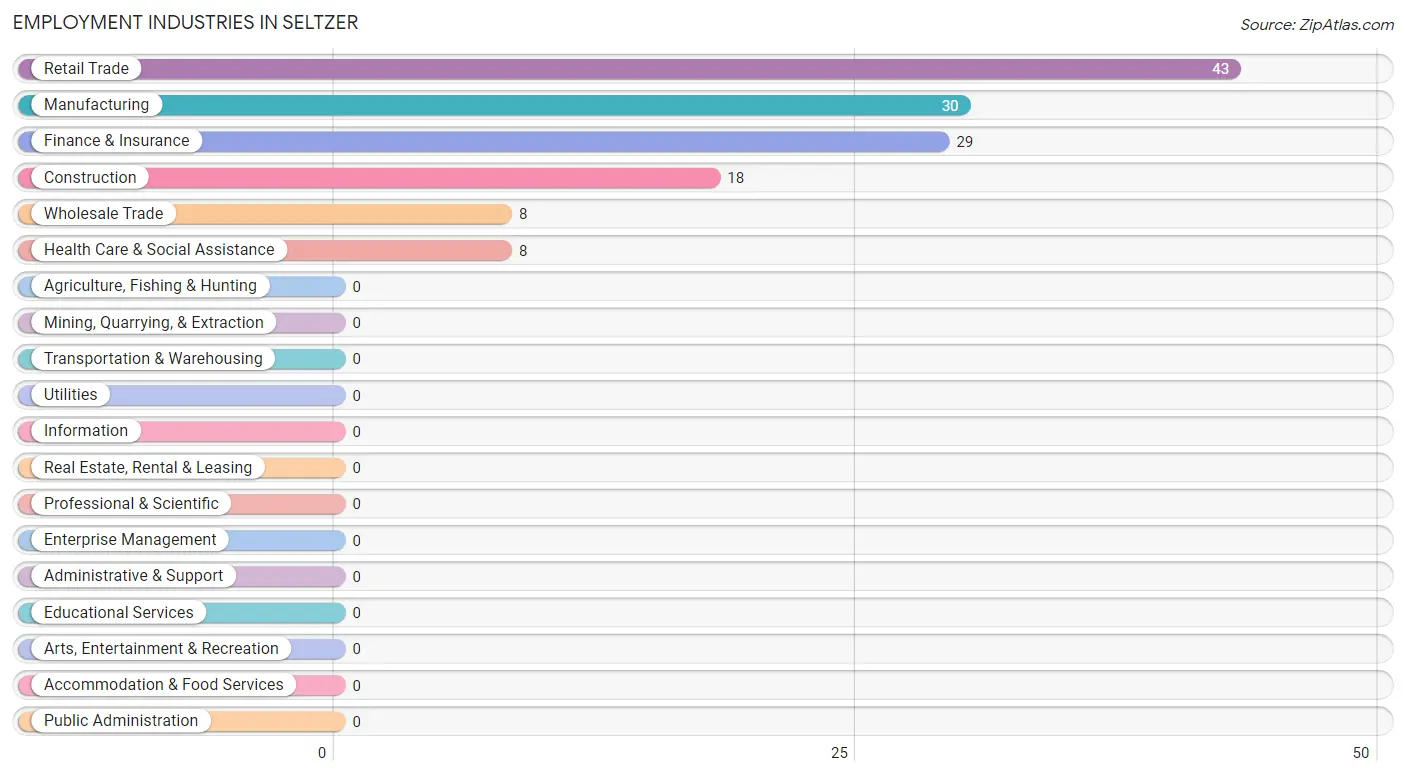
Employment Industries in Seltzer
The major employment industries in Seltzer include Retail Trade (43 | 31.6%), Manufacturing (30 | 22.1%), Finance & Insurance (29 | 21.3%), Construction (18 | 13.2%), and Wholesale Trade (8 | 5.9%).
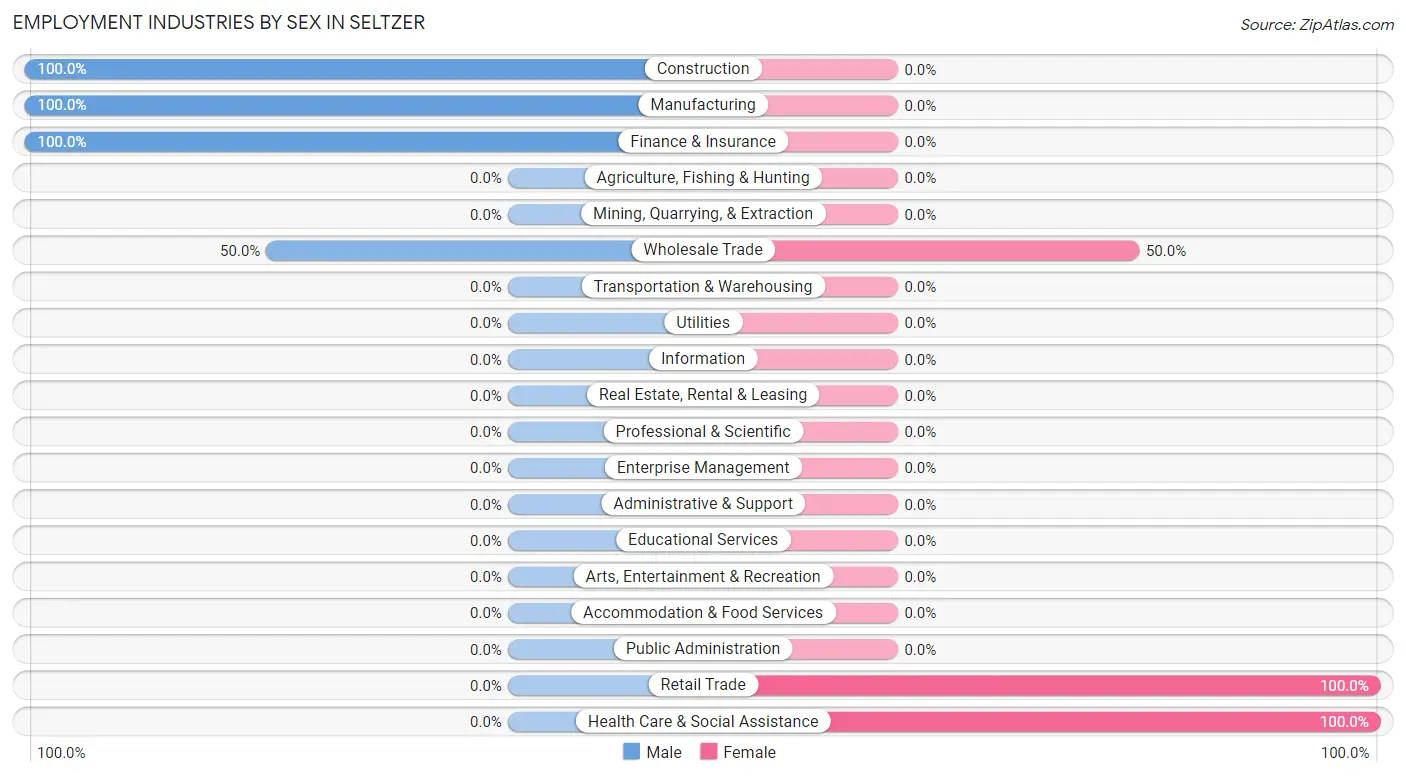
Employment Industries by Sex in Seltzer
The Seltzer industries that see more men than women are Construction (100.0%), Manufacturing (100.0%), and Finance & Insurance (100.0%), whereas the industries that tend to have a higher number of women are Retail Trade (100.0%), Health Care & Social Assistance (100.0%), and Wholesale Trade (50.0%).
| Industry | Male | Female |
| Agriculture, Fishing & Hunting | 0 (0.0%) | 0 (0.0%) |
| Mining, Quarrying, & Extraction | 0 (0.0%) | 0 (0.0%) |
| Construction | 18 (100.0%) | 0 (0.0%) |
| Manufacturing | 30 (100.0%) | 0 (0.0%) |
| Wholesale Trade | 4 (50.0%) | 4 (50.0%) |
| Retail Trade | 0 (0.0%) | 43 (100.0%) |
| Transportation & Warehousing | 0 (0.0%) | 0 (0.0%) |
| Utilities | 0 (0.0%) | 0 (0.0%) |
| Information | 0 (0.0%) | 0 (0.0%) |
| Finance & Insurance | 29 (100.0%) | 0 (0.0%) |
| Real Estate, Rental & Leasing | 0 (0.0%) | 0 (0.0%) |
| Professional & Scientific | 0 (0.0%) | 0 (0.0%) |
| Enterprise Management | 0 (0.0%) | 0 (0.0%) |
| Administrative & Support | 0 (0.0%) | 0 (0.0%) |
| Educational Services | 0 (0.0%) | 0 (0.0%) |
| Health Care & Social Assistance | 0 (0.0%) | 8 (100.0%) |
| Arts, Entertainment & Recreation | 0 (0.0%) | 0 (0.0%) |
| Accommodation & Food Services | 0 (0.0%) | 0 (0.0%) |
| Public Administration | 0 (0.0%) | 0 (0.0%) |
| Total | 81 (59.6%) | 55 (40.4%) |
Education in Seltzer
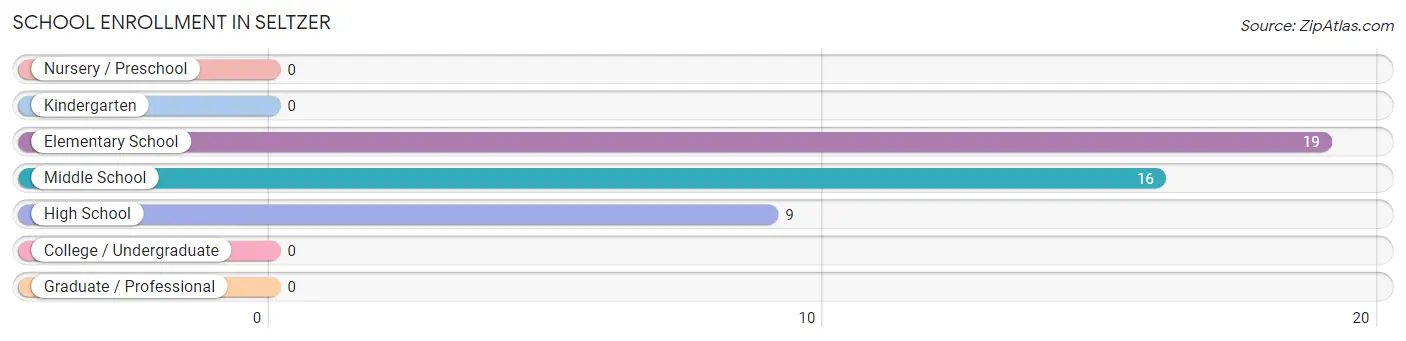
School Enrollment in Seltzer
The most common levels of schooling among the 44 students in Seltzer are elementary school (19 | 43.2%), middle school (16 | 36.4%), and high school (9 | 20.4%).
| School Level | # Students | % Students |
| Nursery / Preschool | 0 | 0.0% |
| Kindergarten | 0 | 0.0% |
| Elementary School | 19 | 43.2% |
| Middle School | 16 | 36.4% |
| High School | 9 | 20.4% |
| College / Undergraduate | 0 | 0.0% |
| Graduate / Professional | 0 | 0.0% |
| Total | 44 | 100.0% |
School Enrollment by Age by Funding Source in Seltzer
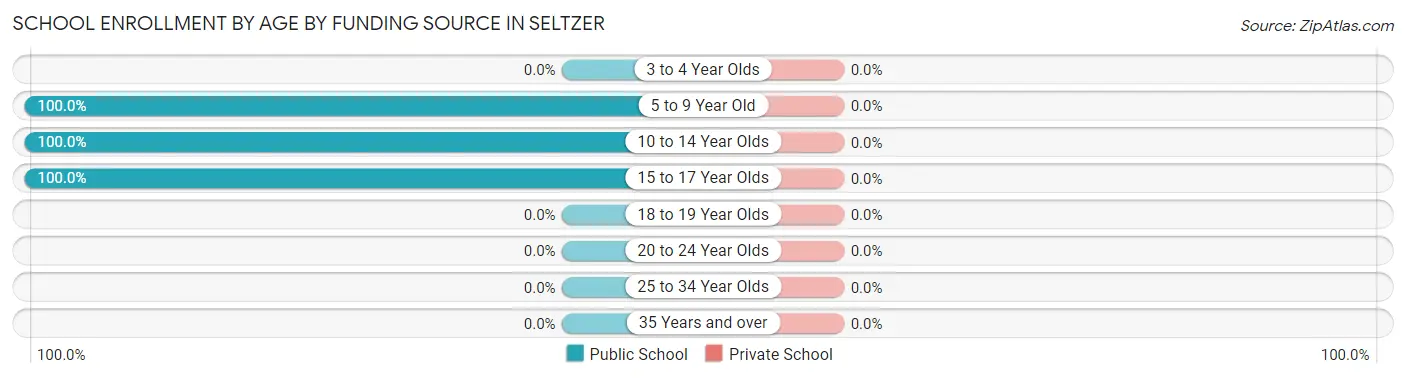
| Age Bracket | Public School | Private School |
| 3 to 4 Year Olds | 0 (0.0%) | 0 (0.0%) |
| 5 to 9 Year Old | 19 (100.0%) | 0 (0.0%) |
| 10 to 14 Year Olds | 16 (100.0%) | 0 (0.0%) |
| 15 to 17 Year Olds | 9 (100.0%) | 0 (0.0%) |
| 18 to 19 Year Olds | 0 (0.0%) | 0 (0.0%) |
| 20 to 24 Year Olds | 0 (0.0%) | 0 (0.0%) |
| 25 to 34 Year Olds | 0 (0.0%) | 0 (0.0%) |
| 35 Years and over | 0 (0.0%) | 0 (0.0%) |
| Total | 44 (100.0%) | 0 (0.0%) |
Educational Attainment by Field of Study in Seltzer
Communications (21 | 58.3%), and education (15 | 41.7%) are the most common fields of study among 36 individuals in Seltzer who have obtained a bachelor's degree or higher.
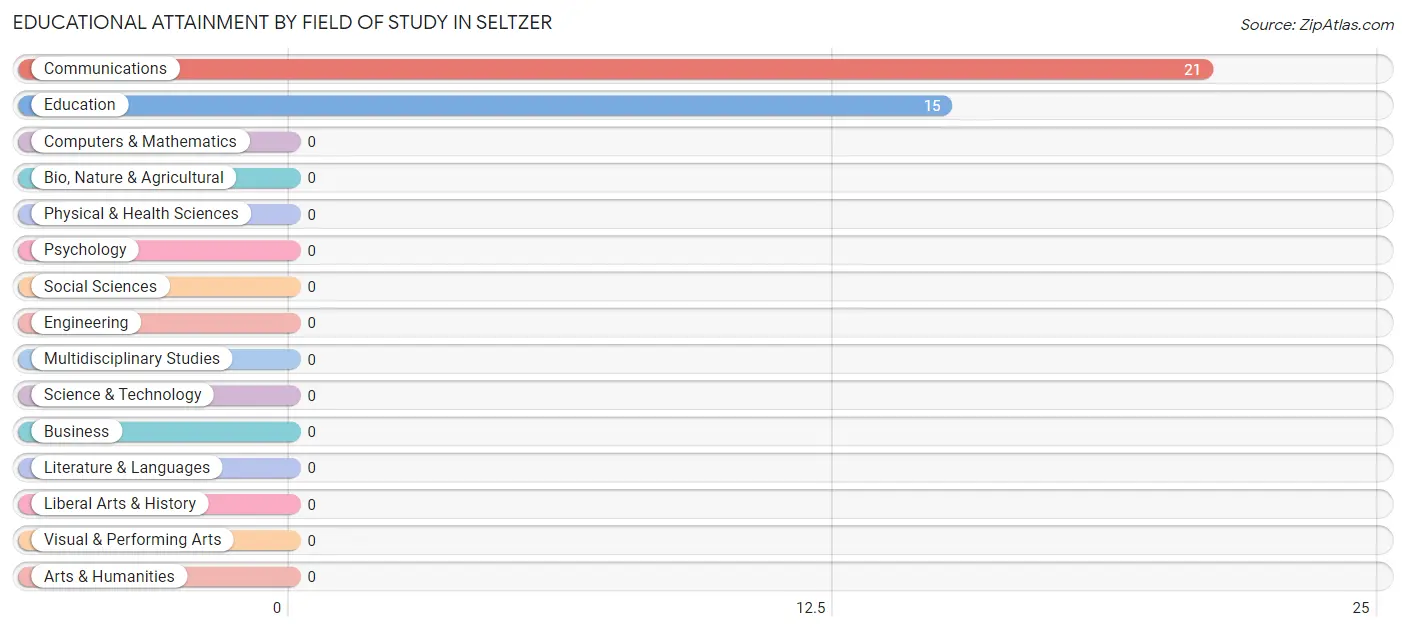
| Field of Study | # Graduates | % Graduates |
| Computers & Mathematics | 0 | 0.0% |
| Bio, Nature & Agricultural | 0 | 0.0% |
| Physical & Health Sciences | 0 | 0.0% |
| Psychology | 0 | 0.0% |
| Social Sciences | 0 | 0.0% |
| Engineering | 0 | 0.0% |
| Multidisciplinary Studies | 0 | 0.0% |
| Science & Technology | 0 | 0.0% |
| Business | 0 | 0.0% |
| Education | 15 | 41.7% |
| Literature & Languages | 0 | 0.0% |
| Liberal Arts & History | 0 | 0.0% |
| Visual & Performing Arts | 0 | 0.0% |
| Communications | 21 | 58.3% |
| Arts & Humanities | 0 | 0.0% |
| Total | 36 | 100.0% |
Transportation & Commute in Seltzer
Vehicle Availability by Sex in Seltzer
The most prevalent vehicle ownership categories in Seltzer are males with 2 vehicles (81, accounting for 100.0%) and females with 2 vehicles (36, making up 147.3%).
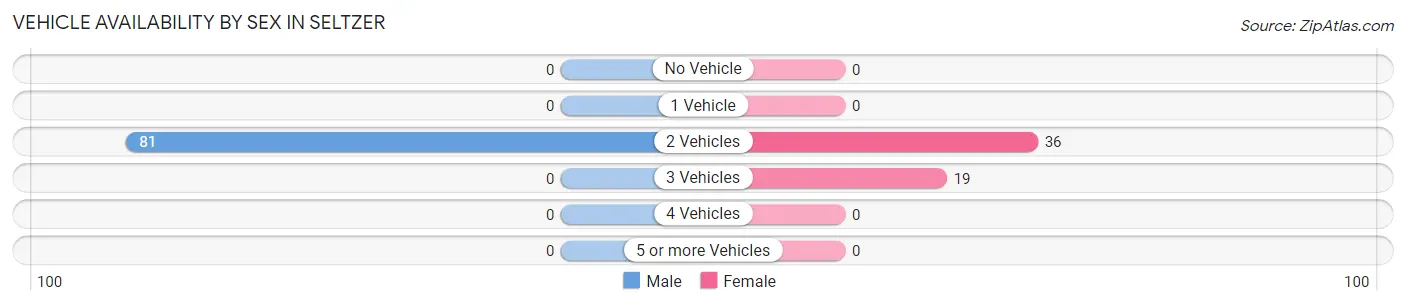
| Vehicles Available | Male | Female |
| No Vehicle | 0 (0.0%) | 0 (0.0%) |
| 1 Vehicle | 0 (0.0%) | 0 (0.0%) |
| 2 Vehicles | 81 (100.0%) | 36 (65.4%) |
| 3 Vehicles | 0 (0.0%) | 19 (34.5%) |
| 4 Vehicles | 0 (0.0%) | 0 (0.0%) |
| 5 or more Vehicles | 0 (0.0%) | 0 (0.0%) |
| Total | 81 (100.0%) | 55 (100.0%) |
Commute Time in Seltzer
The most frequently occuring commute durations in Seltzer are 60 to 89 minutes (59 commuters, 43.4%), 5 to 9 minutes (28 commuters, 20.6%), and 15 to 19 minutes (19 commuters, 14.0%).
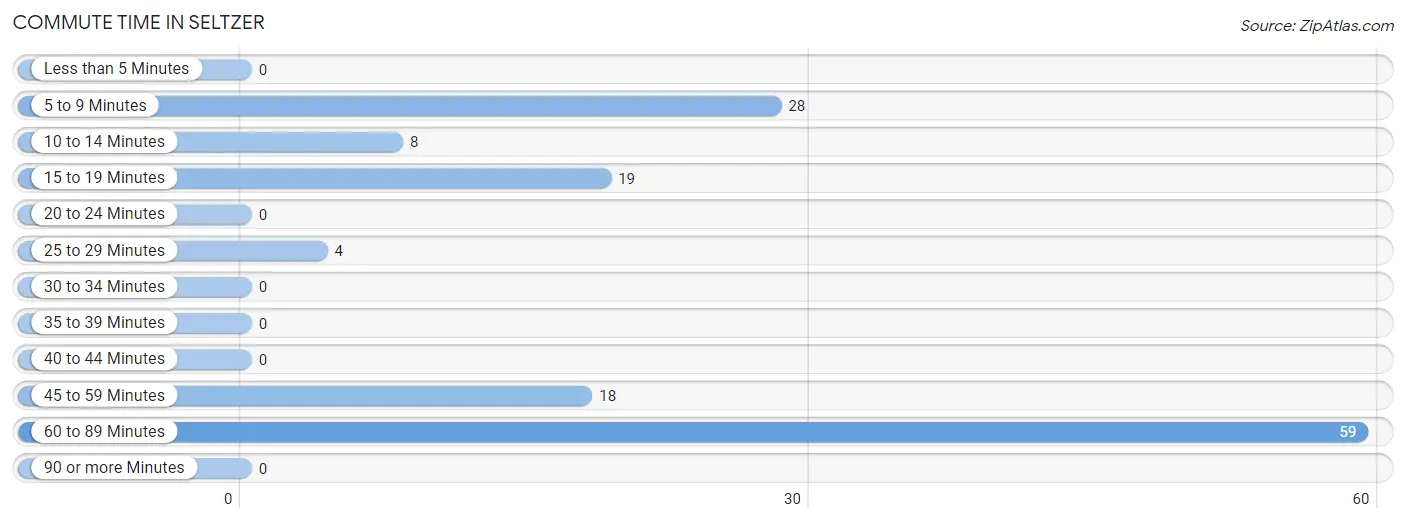
| Commute Time | # Commuters | % Commuters |
| Less than 5 Minutes | 0 | 0.0% |
| 5 to 9 Minutes | 28 | 20.6% |
| 10 to 14 Minutes | 8 | 5.9% |
| 15 to 19 Minutes | 19 | 14.0% |
| 20 to 24 Minutes | 0 | 0.0% |
| 25 to 29 Minutes | 4 | 2.9% |
| 30 to 34 Minutes | 0 | 0.0% |
| 35 to 39 Minutes | 0 | 0.0% |
| 40 to 44 Minutes | 0 | 0.0% |
| 45 to 59 Minutes | 18 | 13.2% |
| 60 to 89 Minutes | 59 | 43.4% |
| 90 or more Minutes | 0 | 0.0% |
Commute Time by Sex in Seltzer
The most common commute times in Seltzer are 60 to 89 minutes (59 commuters, 72.8%) for males and 5 to 9 minutes (24 commuters, 43.6%) for females.
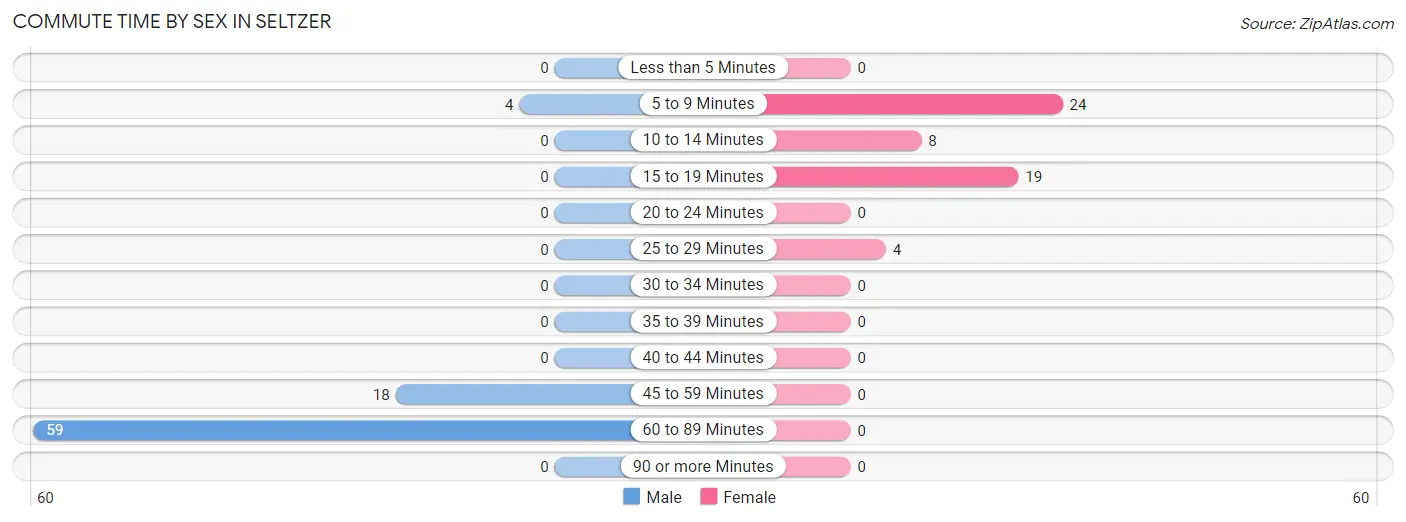
| Commute Time | Male | Female |
| Less than 5 Minutes | 0 (0.0%) | 0 (0.0%) |
| 5 to 9 Minutes | 4 (4.9%) | 24 (43.6%) |
| 10 to 14 Minutes | 0 (0.0%) | 8 (14.5%) |
| 15 to 19 Minutes | 0 (0.0%) | 19 (34.5%) |
| 20 to 24 Minutes | 0 (0.0%) | 0 (0.0%) |
| 25 to 29 Minutes | 0 (0.0%) | 4 (7.3%) |
| 30 to 34 Minutes | 0 (0.0%) | 0 (0.0%) |
| 35 to 39 Minutes | 0 (0.0%) | 0 (0.0%) |
| 40 to 44 Minutes | 0 (0.0%) | 0 (0.0%) |
| 45 to 59 Minutes | 18 (22.2%) | 0 (0.0%) |
| 60 to 89 Minutes | 59 (72.8%) | 0 (0.0%) |
| 90 or more Minutes | 0 (0.0%) | 0 (0.0%) |
Time of Departure to Work by Sex in Seltzer
The most frequent times of departure to work in Seltzer are 7:30 AM to 7:59 AM (33, 40.7%) for males and 9:00 AM to 9:59 AM (32, 58.2%) for females.
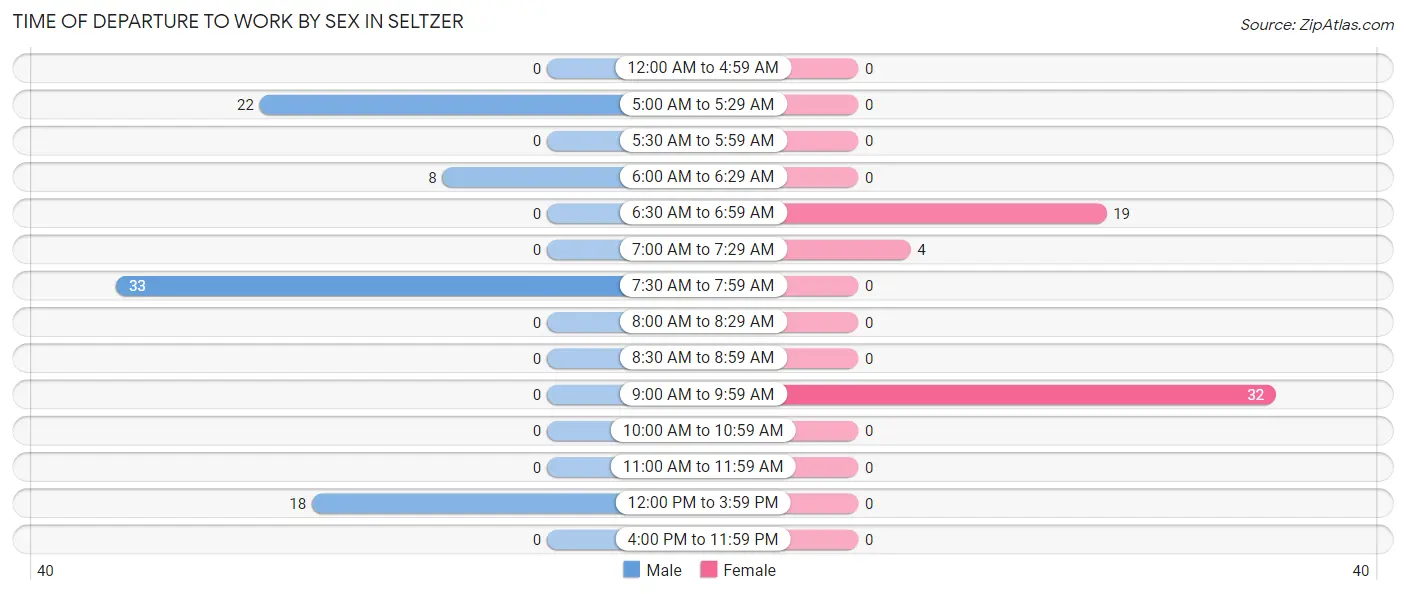
| Time of Departure | Male | Female |
| 12:00 AM to 4:59 AM | 0 (0.0%) | 0 (0.0%) |
| 5:00 AM to 5:29 AM | 22 (27.2%) | 0 (0.0%) |
| 5:30 AM to 5:59 AM | 0 (0.0%) | 0 (0.0%) |
| 6:00 AM to 6:29 AM | 8 (9.9%) | 0 (0.0%) |
| 6:30 AM to 6:59 AM | 0 (0.0%) | 19 (34.5%) |
| 7:00 AM to 7:29 AM | 0 (0.0%) | 4 (7.3%) |
| 7:30 AM to 7:59 AM | 33 (40.7%) | 0 (0.0%) |
| 8:00 AM to 8:29 AM | 0 (0.0%) | 0 (0.0%) |
| 8:30 AM to 8:59 AM | 0 (0.0%) | 0 (0.0%) |
| 9:00 AM to 9:59 AM | 0 (0.0%) | 32 (58.2%) |
| 10:00 AM to 10:59 AM | 0 (0.0%) | 0 (0.0%) |
| 11:00 AM to 11:59 AM | 0 (0.0%) | 0 (0.0%) |
| 12:00 PM to 3:59 PM | 18 (22.2%) | 0 (0.0%) |
| 4:00 PM to 11:59 PM | 0 (0.0%) | 0 (0.0%) |
| Total | 81 (100.0%) | 55 (100.0%) |
Housing Occupancy in Seltzer
Occupancy by Ownership in Seltzer
Of the total 126 dwellings in Seltzer, owner-occupied units account for 104 (82.5%), while renter-occupied units make up 22 (17.5%).
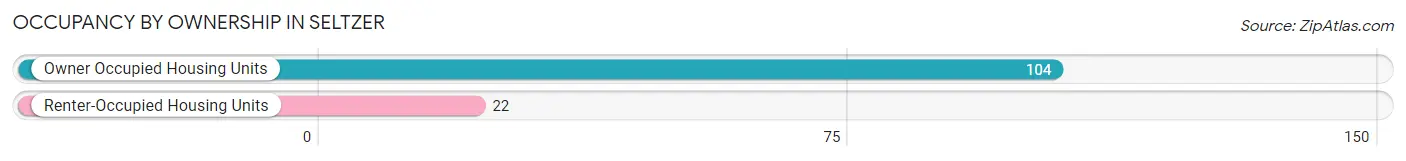
| Occupancy | # Housing Units | % Housing Units |
| Owner Occupied Housing Units | 104 | 82.5% |
| Renter-Occupied Housing Units | 22 | 17.5% |
| Total Occupied Housing Units | 126 | 100.0% |
Occupancy by Household Size in Seltzer
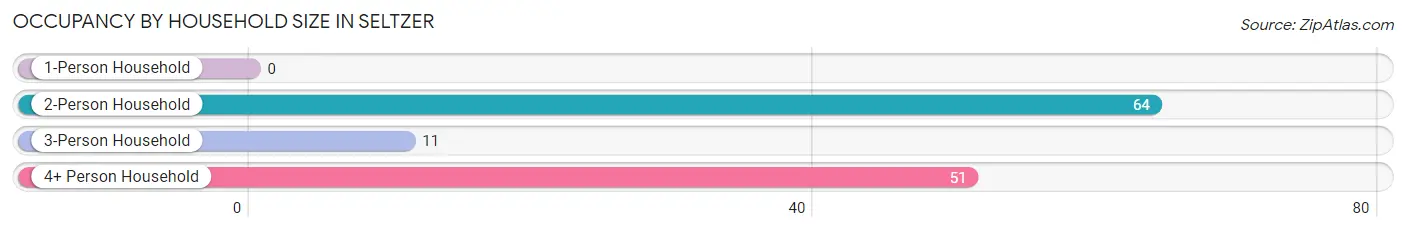
| Household Size | # Housing Units | % Housing Units |
| 1-Person Household | 0 | 0.0% |
| 2-Person Household | 64 | 50.8% |
| 3-Person Household | 11 | 8.7% |
| 4+ Person Household | 51 | 40.5% |
| Total Housing Units | 126 | 100.0% |
Occupancy by Ownership by Household Size in Seltzer
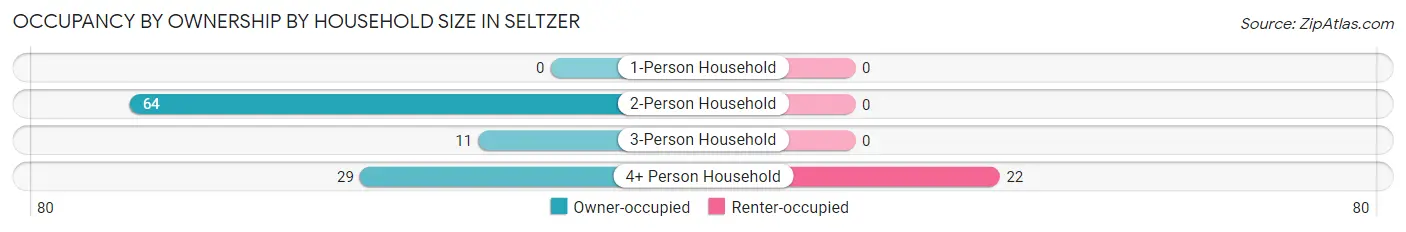
| Household Size | Owner-occupied | Renter-occupied |
| 1-Person Household | 0 (0.0%) | 0 (0.0%) |
| 2-Person Household | 64 (100.0%) | 0 (0.0%) |
| 3-Person Household | 11 (100.0%) | 0 (0.0%) |
| 4+ Person Household | 29 (56.9%) | 22 (43.1%) |
| Total Housing Units | 104 (82.5%) | 22 (17.5%) |
Occupancy by Educational Attainment in Seltzer
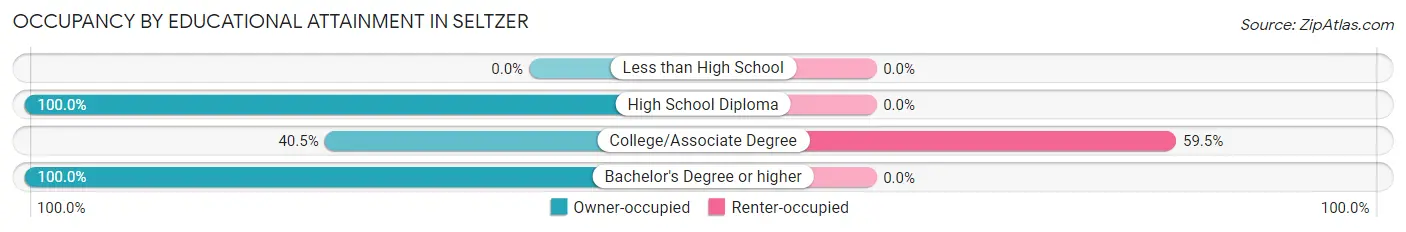
| Household Size | Owner-occupied | Renter-occupied |
| Less than High School | 0 (0.0%) | 0 (0.0%) |
| High School Diploma | 68 (100.0%) | 0 (0.0%) |
| College/Associate Degree | 15 (40.5%) | 22 (59.5%) |
| Bachelor's Degree or higher | 21 (100.0%) | 0 (0.0%) |
Occupancy by Age of Householder in Seltzer
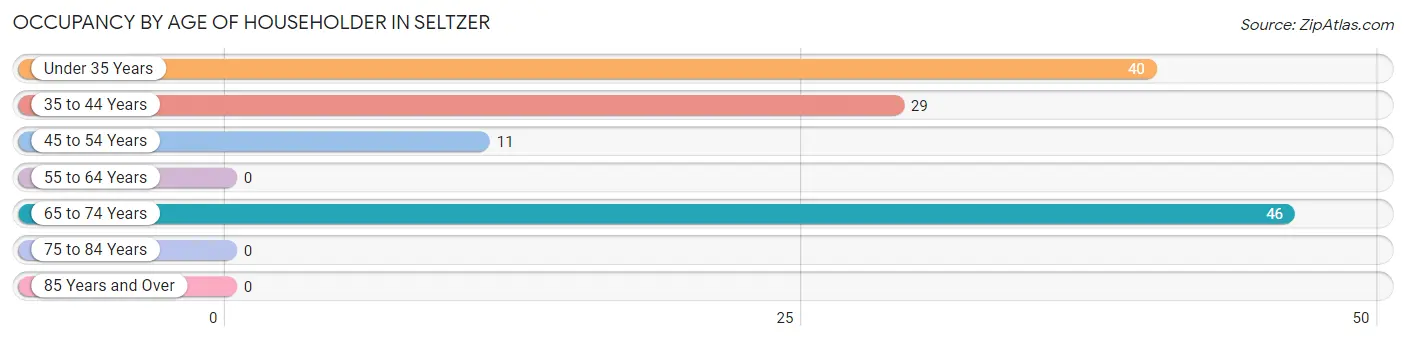
| Age Bracket | # Households | % Households |
| Under 35 Years | 40 | 31.8% |
| 35 to 44 Years | 29 | 23.0% |
| 45 to 54 Years | 11 | 8.7% |
| 55 to 64 Years | 0 | 0.0% |
| 65 to 74 Years | 46 | 36.5% |
| 75 to 84 Years | 0 | 0.0% |
| 85 Years and Over | 0 | 0.0% |
| Total | 126 | 100.0% |
Housing Finances in Seltzer
Median Income by Occupancy in Seltzer
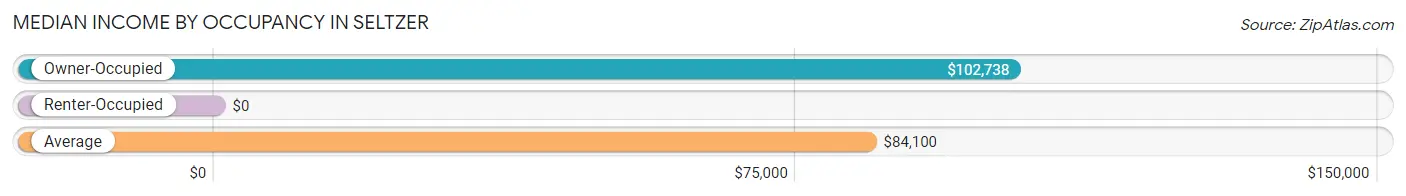
| Occupancy Type | # Households | Median Income |
| Owner-Occupied | 104 (82.5%) | $102,738 |
| Renter-Occupied | 22 (17.5%) | $0 |
| Average | 126 (100.0%) | $84,100 |
Occupancy by Householder Income Bracket in Seltzer
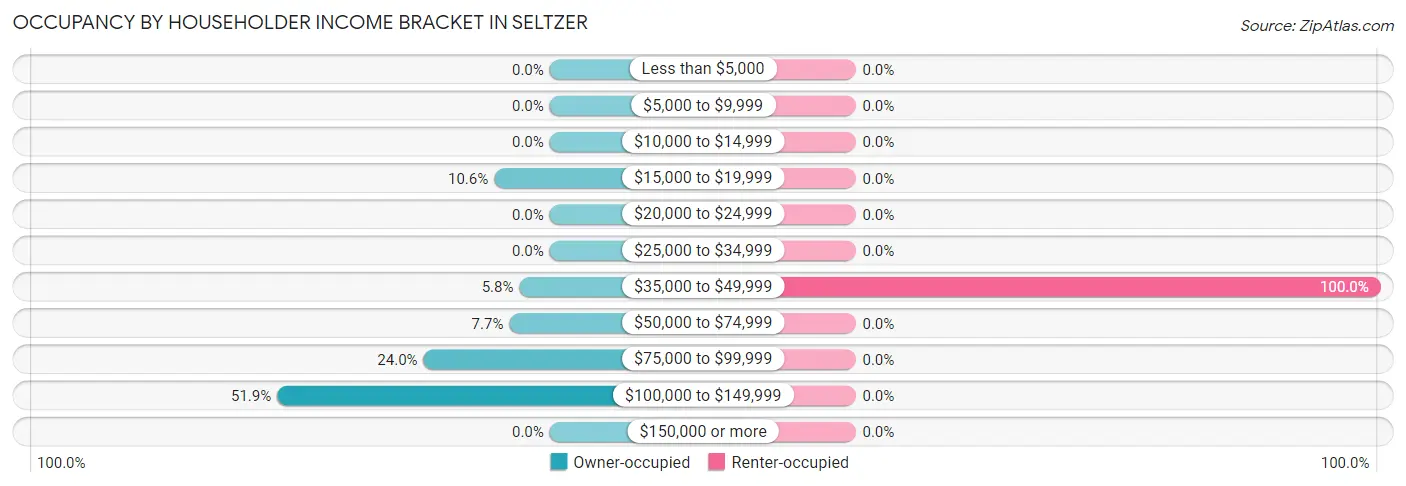
| Income Bracket | Owner-occupied | Renter-occupied |
| Less than $5,000 | 0 (0.0%) | 0 (0.0%) |
| $5,000 to $9,999 | 0 (0.0%) | 0 (0.0%) |
| $10,000 to $14,999 | 0 (0.0%) | 0 (0.0%) |
| $15,000 to $19,999 | 11 (10.6%) | 0 (0.0%) |
| $20,000 to $24,999 | 0 (0.0%) | 0 (0.0%) |
| $25,000 to $34,999 | 0 (0.0%) | 0 (0.0%) |
| $35,000 to $49,999 | 6 (5.8%) | 22 (100.0%) |
| $50,000 to $74,999 | 8 (7.7%) | 0 (0.0%) |
| $75,000 to $99,999 | 25 (24.0%) | 0 (0.0%) |
| $100,000 to $149,999 | 54 (51.9%) | 0 (0.0%) |
| $150,000 or more | 0 (0.0%) | 0 (0.0%) |
| Total | 104 (100.0%) | 22 (100.0%) |
Monthly Housing Cost Tiers in Seltzer
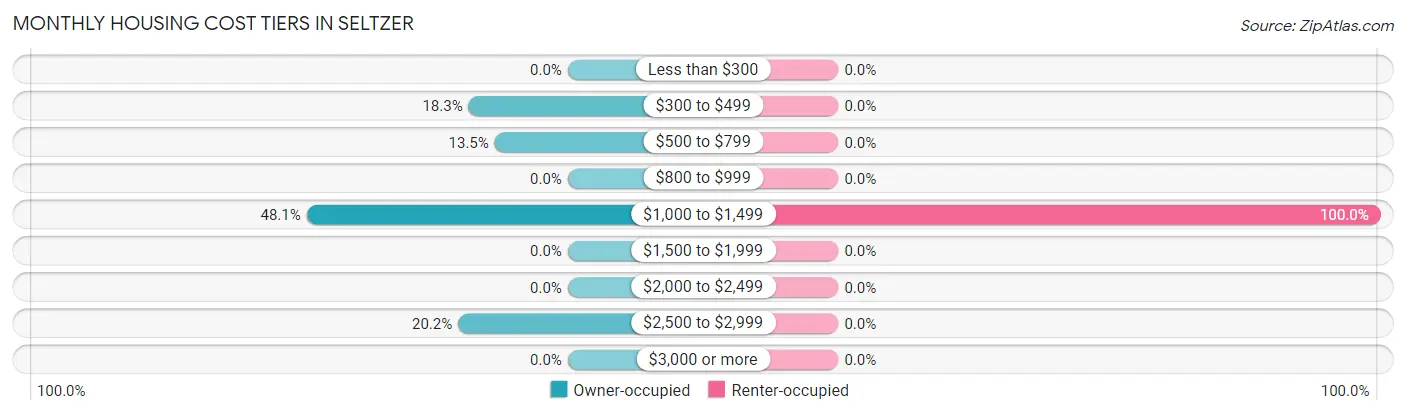
| Monthly Cost | Owner-occupied | Renter-occupied |
| Less than $300 | 0 (0.0%) | 0 (0.0%) |
| $300 to $499 | 19 (18.3%) | 0 (0.0%) |
| $500 to $799 | 14 (13.5%) | 0 (0.0%) |
| $800 to $999 | 0 (0.0%) | 0 (0.0%) |
| $1,000 to $1,499 | 50 (48.1%) | 22 (100.0%) |
| $1,500 to $1,999 | 0 (0.0%) | 0 (0.0%) |
| $2,000 to $2,499 | 0 (0.0%) | 0 (0.0%) |
| $2,500 to $2,999 | 21 (20.2%) | 0 (0.0%) |
| $3,000 or more | 0 (0.0%) | 0 (0.0%) |
| Total | 104 (100.0%) | 22 (100.0%) |
Physical Housing Characteristics in Seltzer
Housing Structures in Seltzer
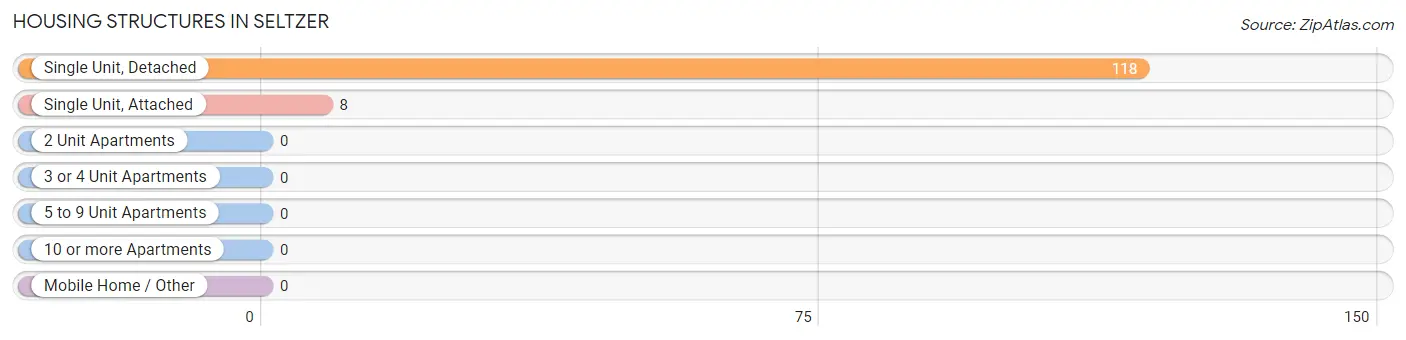
| Structure Type | # Housing Units | % Housing Units |
| Single Unit, Detached | 118 | 93.6% |
| Single Unit, Attached | 8 | 6.4% |
| 2 Unit Apartments | 0 | 0.0% |
| 3 or 4 Unit Apartments | 0 | 0.0% |
| 5 to 9 Unit Apartments | 0 | 0.0% |
| 10 or more Apartments | 0 | 0.0% |
| Mobile Home / Other | 0 | 0.0% |
| Total | 126 | 100.0% |
Housing Structures by Occupancy in Seltzer
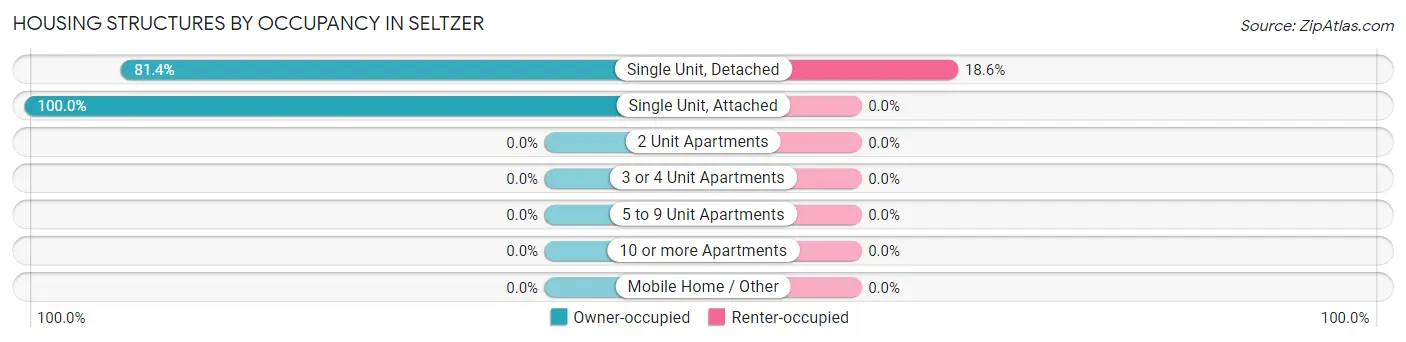
| Structure Type | Owner-occupied | Renter-occupied |
| Single Unit, Detached | 96 (81.4%) | 22 (18.6%) |
| Single Unit, Attached | 8 (100.0%) | 0 (0.0%) |
| 2 Unit Apartments | 0 (0.0%) | 0 (0.0%) |
| 3 or 4 Unit Apartments | 0 (0.0%) | 0 (0.0%) |
| 5 to 9 Unit Apartments | 0 (0.0%) | 0 (0.0%) |
| 10 or more Apartments | 0 (0.0%) | 0 (0.0%) |
| Mobile Home / Other | 0 (0.0%) | 0 (0.0%) |
| Total | 104 (82.5%) | 22 (17.5%) |
Housing Structures by Number of Rooms in Seltzer
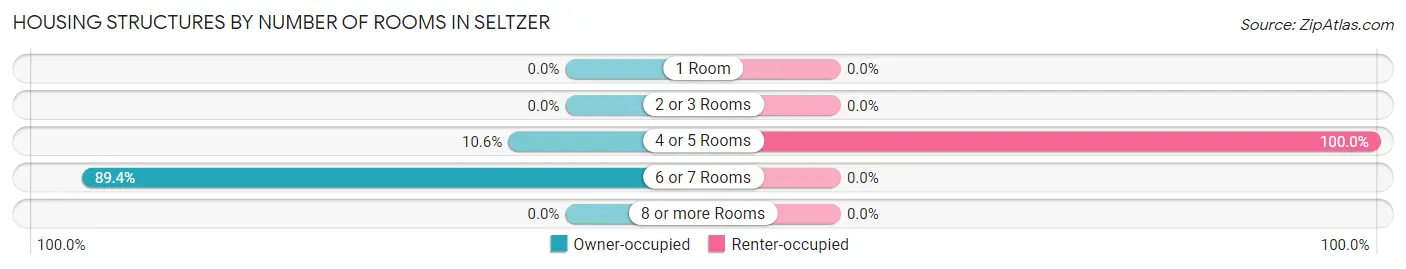
| Number of Rooms | Owner-occupied | Renter-occupied |
| 1 Room | 0 (0.0%) | 0 (0.0%) |
| 2 or 3 Rooms | 0 (0.0%) | 0 (0.0%) |
| 4 or 5 Rooms | 11 (10.6%) | 22 (100.0%) |
| 6 or 7 Rooms | 93 (89.4%) | 0 (0.0%) |
| 8 or more Rooms | 0 (0.0%) | 0 (0.0%) |
| Total | 104 (100.0%) | 22 (100.0%) |
Housing Structure by Heating Type in Seltzer
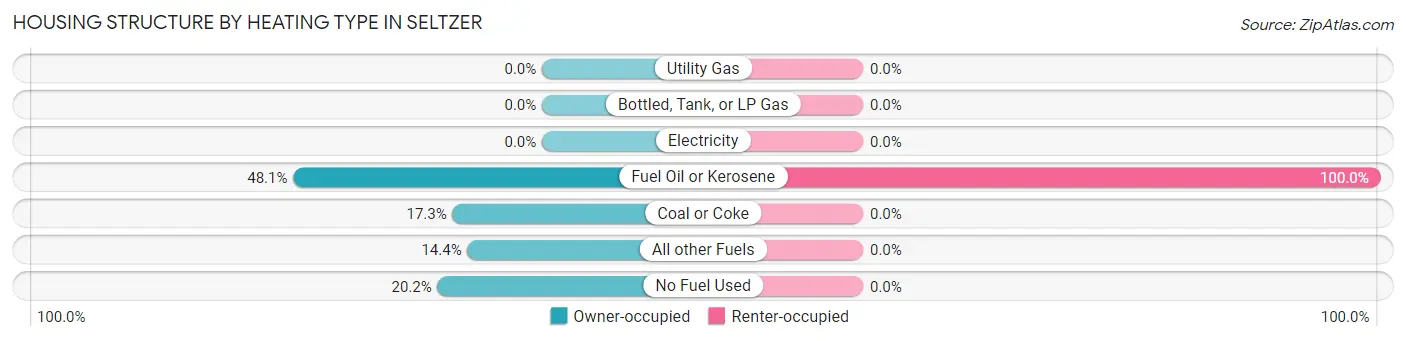
| Heating Type | Owner-occupied | Renter-occupied |
| Utility Gas | 0 (0.0%) | 0 (0.0%) |
| Bottled, Tank, or LP Gas | 0 (0.0%) | 0 (0.0%) |
| Electricity | 0 (0.0%) | 0 (0.0%) |
| Fuel Oil or Kerosene | 50 (48.1%) | 22 (100.0%) |
| Coal or Coke | 18 (17.3%) | 0 (0.0%) |
| All other Fuels | 15 (14.4%) | 0 (0.0%) |
| No Fuel Used | 21 (20.2%) | 0 (0.0%) |
| Total | 104 (100.0%) | 22 (100.0%) |
Household Vehicle Usage in Seltzer
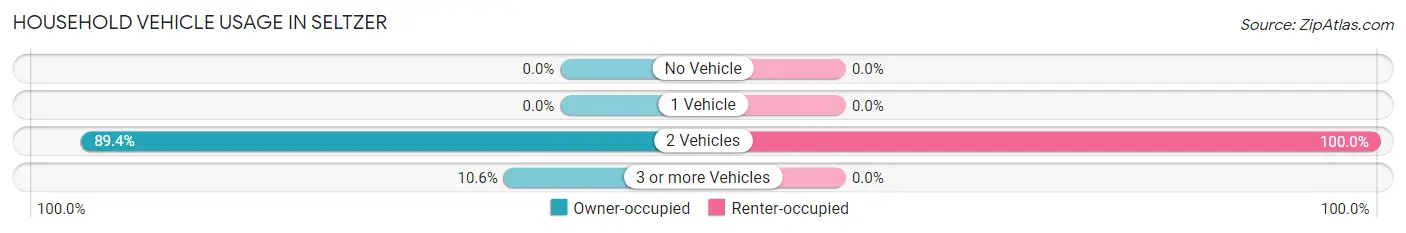
| Vehicles per Household | Owner-occupied | Renter-occupied |
| No Vehicle | 0 (0.0%) | 0 (0.0%) |
| 1 Vehicle | 0 (0.0%) | 0 (0.0%) |
| 2 Vehicles | 93 (89.4%) | 22 (100.0%) |
| 3 or more Vehicles | 11 (10.6%) | 0 (0.0%) |
| Total | 104 (100.0%) | 22 (100.0%) |
Real Estate & Mortgages in Seltzer
Real Estate and Mortgage Overview in Seltzer
| Characteristic | Without Mortgage | With Mortgage |
| Housing Units | 27 | 77 |
| Median Property Value | - | - |
| Median Household Income | $140,250 | $0 |
| Monthly Housing Costs | $471 | $0 |
| Real Estate Taxes | - | - |
Property Value by Mortgage Status in Seltzer
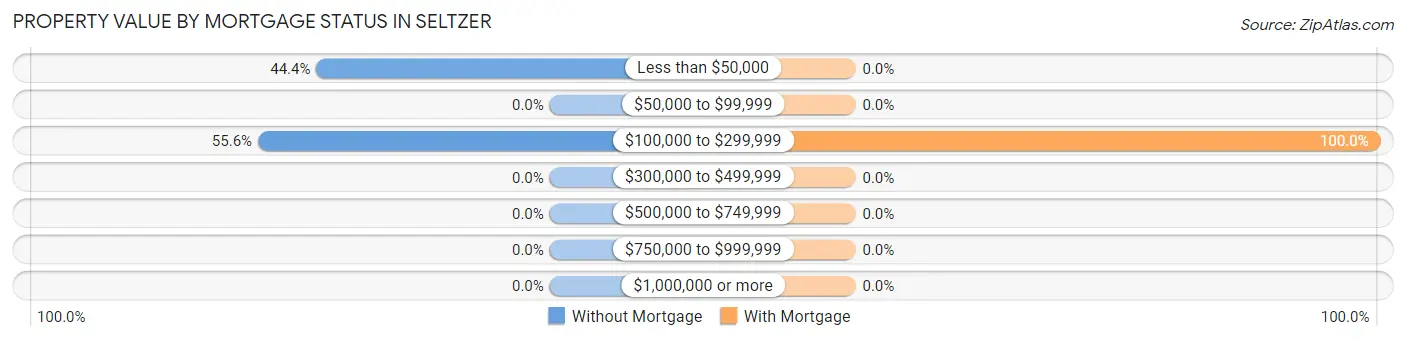
| Property Value | Without Mortgage | With Mortgage |
| Less than $50,000 | 12 (44.4%) | 0 (0.0%) |
| $50,000 to $99,999 | 0 (0.0%) | 0 (0.0%) |
| $100,000 to $299,999 | 15 (55.6%) | 77 (100.0%) |
| $300,000 to $499,999 | 0 (0.0%) | 0 (0.0%) |
| $500,000 to $749,999 | 0 (0.0%) | 0 (0.0%) |
| $750,000 to $999,999 | 0 (0.0%) | 0 (0.0%) |
| $1,000,000 or more | 0 (0.0%) | 0 (0.0%) |
| Total | 27 (100.0%) | 77 (100.0%) |
Household Income by Mortgage Status in Seltzer
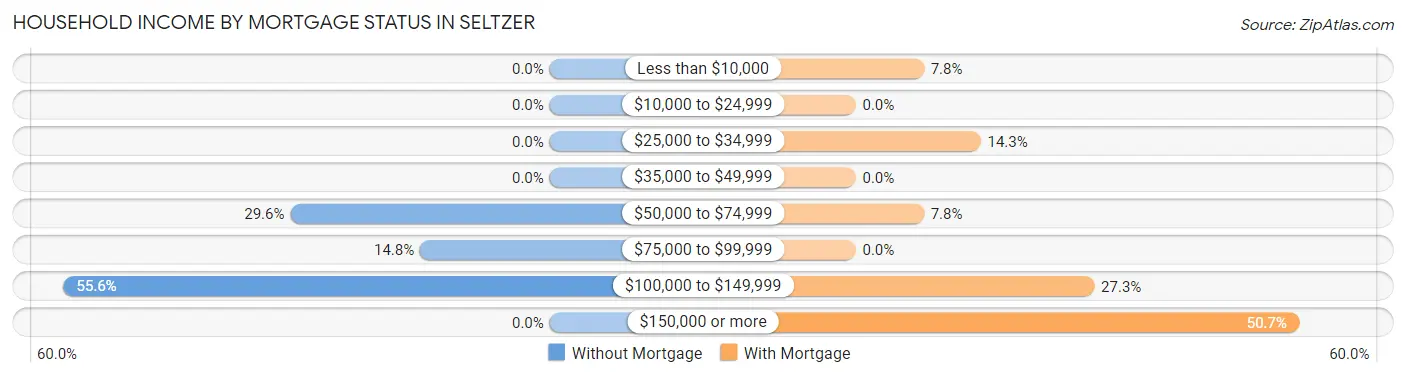
| Household Income | Without Mortgage | With Mortgage |
| Less than $10,000 | 0 (0.0%) | 6 (7.8%) |
| $10,000 to $24,999 | 0 (0.0%) | 0 (0.0%) |
| $25,000 to $34,999 | 0 (0.0%) | 11 (14.3%) |
| $35,000 to $49,999 | 0 (0.0%) | 0 (0.0%) |
| $50,000 to $74,999 | 8 (29.6%) | 6 (7.8%) |
| $75,000 to $99,999 | 4 (14.8%) | 0 (0.0%) |
| $100,000 to $149,999 | 15 (55.6%) | 21 (27.3%) |
| $150,000 or more | 0 (0.0%) | 39 (50.6%) |
| Total | 27 (100.0%) | 77 (100.0%) |
Property Value to Household Income Ratio in Seltzer
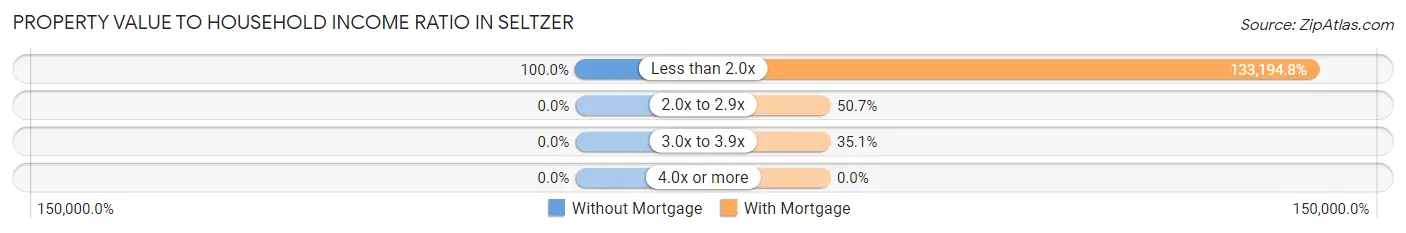
| Value-to-Income Ratio | Without Mortgage | With Mortgage |
| Less than 2.0x | 27 (100.0%) | 102,560 (133,194.8%) |
| 2.0x to 2.9x | 0 (0.0%) | 39 (50.6%) |
| 3.0x to 3.9x | 0 (0.0%) | 27 (35.1%) |
| 4.0x or more | 0 (0.0%) | 0 (0.0%) |
| Total | 27 (100.0%) | 77 (100.0%) |
Real Estate Taxes by Mortgage Status in Seltzer
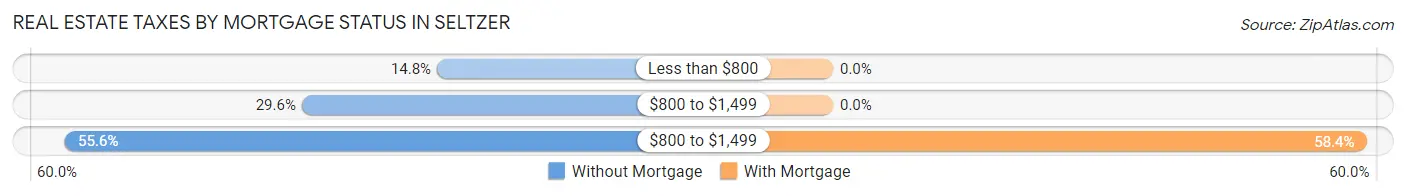
| Property Taxes | Without Mortgage | With Mortgage |
| Less than $800 | 4 (14.8%) | 0 (0.0%) |
| $800 to $1,499 | 8 (29.6%) | 0 (0.0%) |
| $800 to $1,499 | 15 (55.6%) | 45 (58.4%) |
| Total | 27 (100.0%) | 77 (100.0%) |
Health & Disability in Seltzer
Health Insurance Coverage by Age in Seltzer
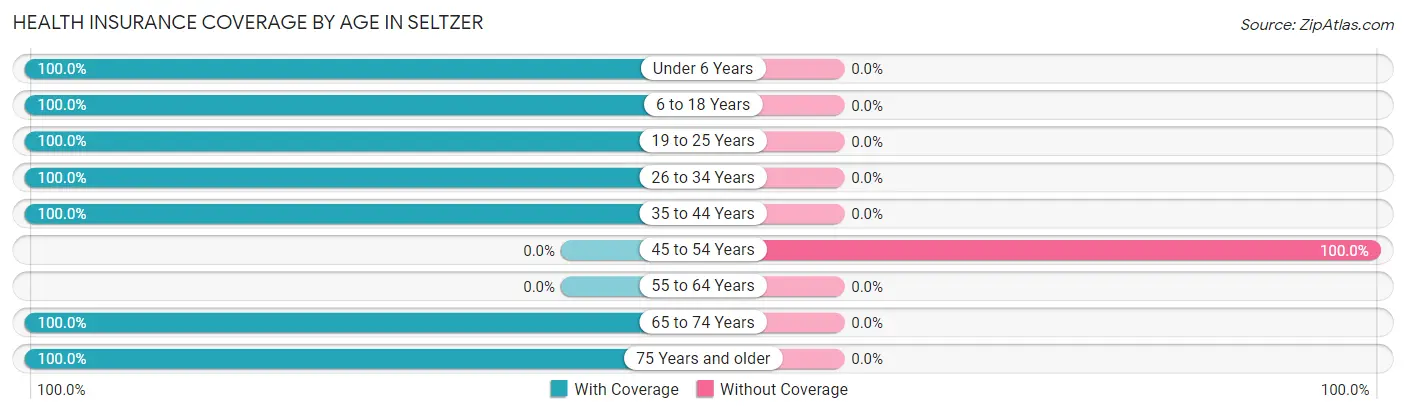
| Age Bracket | With Coverage | Without Coverage |
| Under 6 Years | 57 (100.0%) | 0 (0.0%) |
| 6 to 18 Years | 58 (100.0%) | 0 (0.0%) |
| 19 to 25 Years | 75 (100.0%) | 0 (0.0%) |
| 26 to 34 Years | 68 (100.0%) | 0 (0.0%) |
| 35 to 44 Years | 37 (100.0%) | 0 (0.0%) |
| 45 to 54 Years | 0 (0.0%) | 11 (100.0%) |
| 55 to 64 Years | 0 (0.0%) | 0 (0.0%) |
| 65 to 74 Years | 70 (100.0%) | 0 (0.0%) |
| 75 Years and older | 20 (100.0%) | 0 (0.0%) |
| Total | 385 (97.2%) | 11 (2.8%) |
Health Insurance Coverage by Citizenship Status in Seltzer
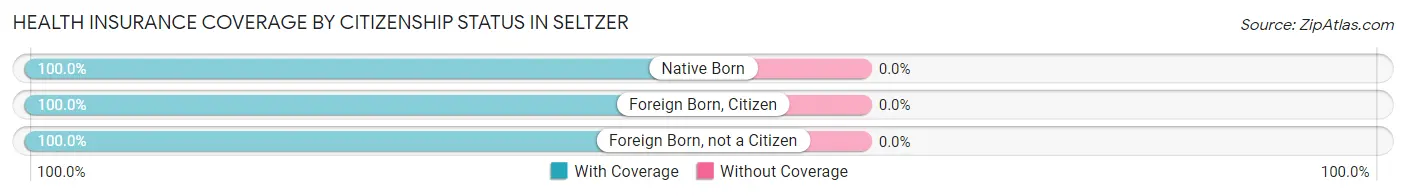
| Citizenship Status | With Coverage | Without Coverage |
| Native Born | 57 (100.0%) | 0 (0.0%) |
| Foreign Born, Citizen | 58 (100.0%) | 0 (0.0%) |
| Foreign Born, not a Citizen | 75 (100.0%) | 0 (0.0%) |
Health Insurance Coverage by Household Income in Seltzer
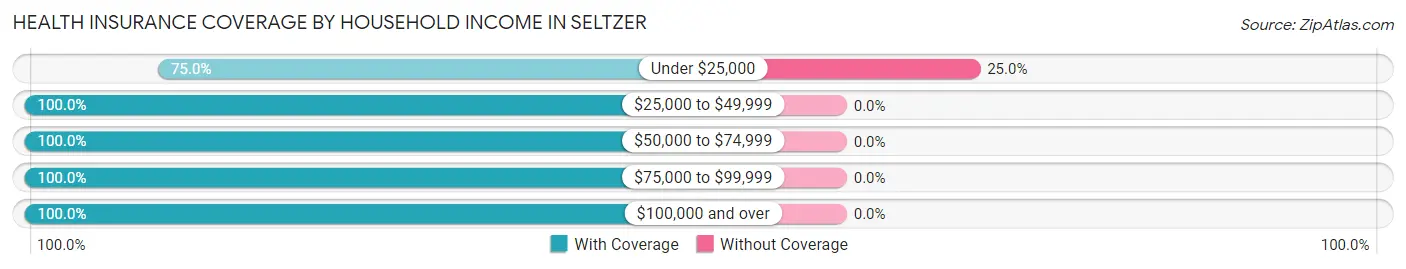
| Household Income | With Coverage | Without Coverage |
| Under $25,000 | 33 (75.0%) | 11 (25.0%) |
| $25,000 to $49,999 | 100 (100.0%) | 0 (0.0%) |
| $50,000 to $74,999 | 39 (100.0%) | 0 (0.0%) |
| $75,000 to $99,999 | 100 (100.0%) | 0 (0.0%) |
| $100,000 and over | 113 (100.0%) | 0 (0.0%) |
Public vs Private Health Insurance Coverage by Age in Seltzer
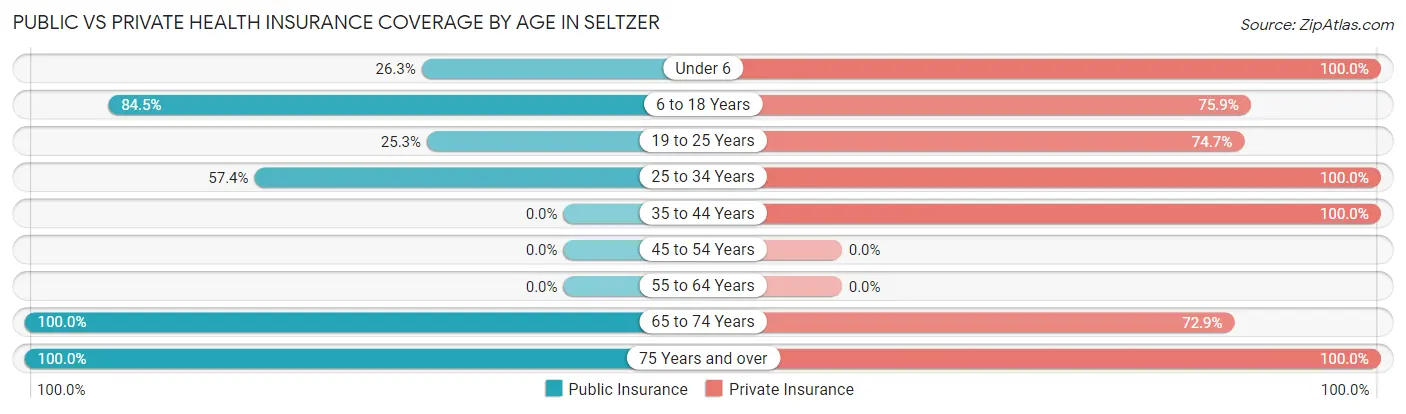
| Age Bracket | Public Insurance | Private Insurance |
| Under 6 | 15 (26.3%) | 57 (100.0%) |
| 6 to 18 Years | 49 (84.5%) | 44 (75.9%) |
| 19 to 25 Years | 19 (25.3%) | 56 (74.7%) |
| 25 to 34 Years | 39 (57.4%) | 68 (100.0%) |
| 35 to 44 Years | 0 (0.0%) | 37 (100.0%) |
| 45 to 54 Years | 0 (0.0%) | 0 (0.0%) |
| 55 to 64 Years | 0 (0.0%) | 0 (0.0%) |
| 65 to 74 Years | 70 (100.0%) | 51 (72.9%) |
| 75 Years and over | 20 (100.0%) | 20 (100.0%) |
| Total | 212 (53.5%) | 333 (84.1%) |
Disability Status by Sex by Age in Seltzer
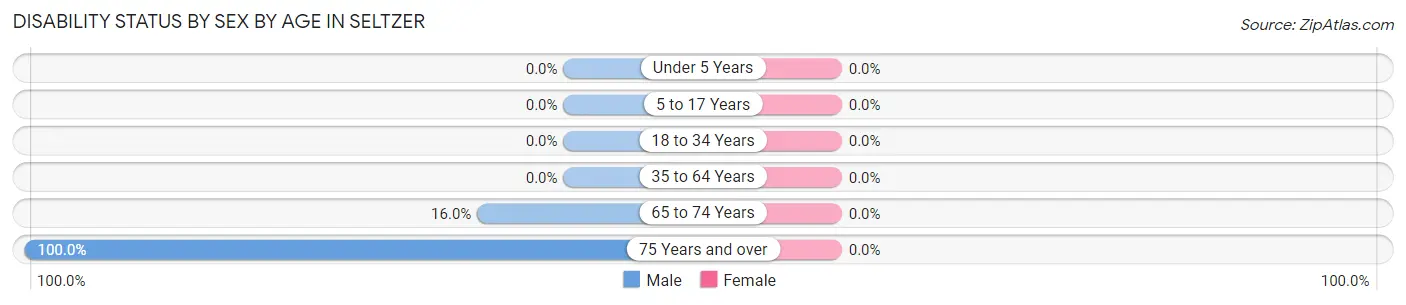
| Age Bracket | Male | Female |
| Under 5 Years | 0 (0.0%) | 0 (0.0%) |
| 5 to 17 Years | 0 (0.0%) | 0 (0.0%) |
| 18 to 34 Years | 0 (0.0%) | 0 (0.0%) |
| 35 to 64 Years | 0 (0.0%) | 0 (0.0%) |
| 65 to 74 Years | 4 (16.0%) | 0 (0.0%) |
| 75 Years and over | 20 (100.0%) | 0 (0.0%) |
Disability Class by Sex by Age in Seltzer
Disability Class: Hearing Difficulty
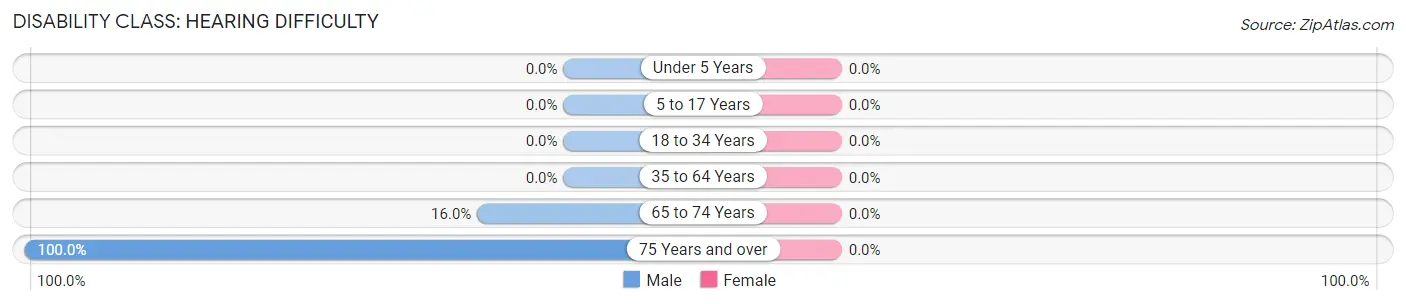
| Age Bracket | Male | Female |
| Under 5 Years | 0 (0.0%) | 0 (0.0%) |
| 5 to 17 Years | 0 (0.0%) | 0 (0.0%) |
| 18 to 34 Years | 0 (0.0%) | 0 (0.0%) |
| 35 to 64 Years | 0 (0.0%) | 0 (0.0%) |
| 65 to 74 Years | 4 (16.0%) | 0 (0.0%) |
| 75 Years and over | 20 (100.0%) | 0 (0.0%) |
Disability Class: Vision Difficulty
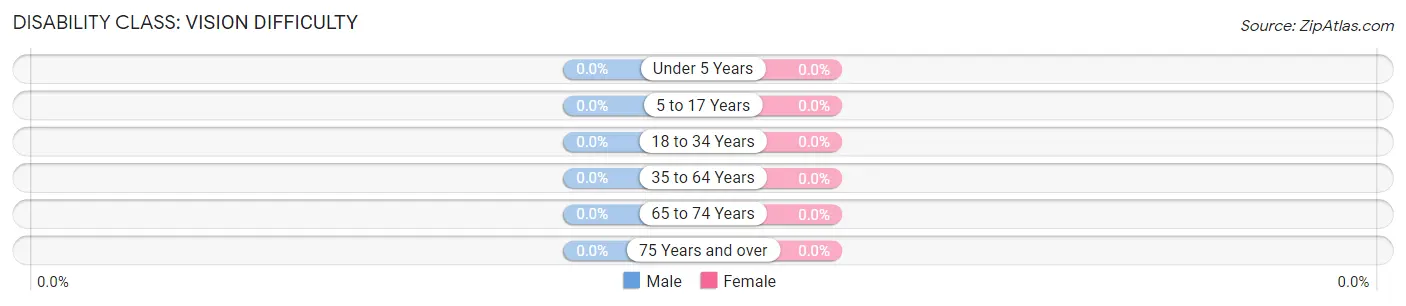
| Age Bracket | Male | Female |
| Under 5 Years | 0 (0.0%) | 0 (0.0%) |
| 5 to 17 Years | 0 (0.0%) | 0 (0.0%) |
| 18 to 34 Years | 0 (0.0%) | 0 (0.0%) |
| 35 to 64 Years | 0 (0.0%) | 0 (0.0%) |
| 65 to 74 Years | 0 (0.0%) | 0 (0.0%) |
| 75 Years and over | 0 (0.0%) | 0 (0.0%) |
Disability Class: Cognitive Difficulty
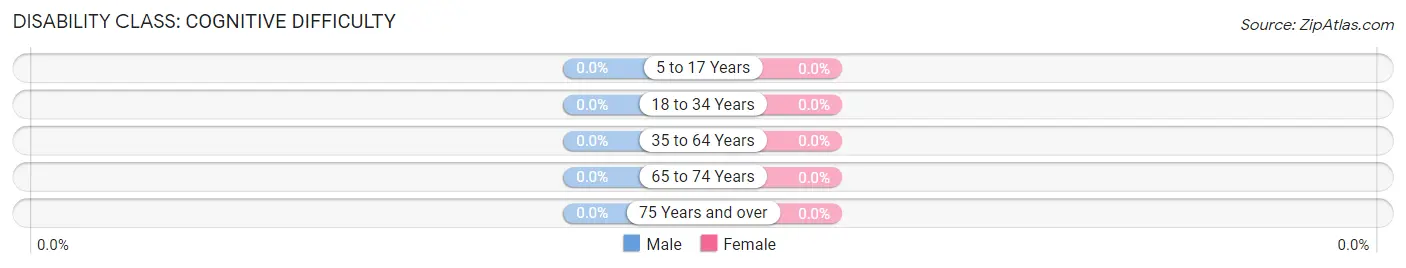
| Age Bracket | Male | Female |
| 5 to 17 Years | 0 (0.0%) | 0 (0.0%) |
| 18 to 34 Years | 0 (0.0%) | 0 (0.0%) |
| 35 to 64 Years | 0 (0.0%) | 0 (0.0%) |
| 65 to 74 Years | 0 (0.0%) | 0 (0.0%) |
| 75 Years and over | 0 (0.0%) | 0 (0.0%) |
Disability Class: Ambulatory Difficulty
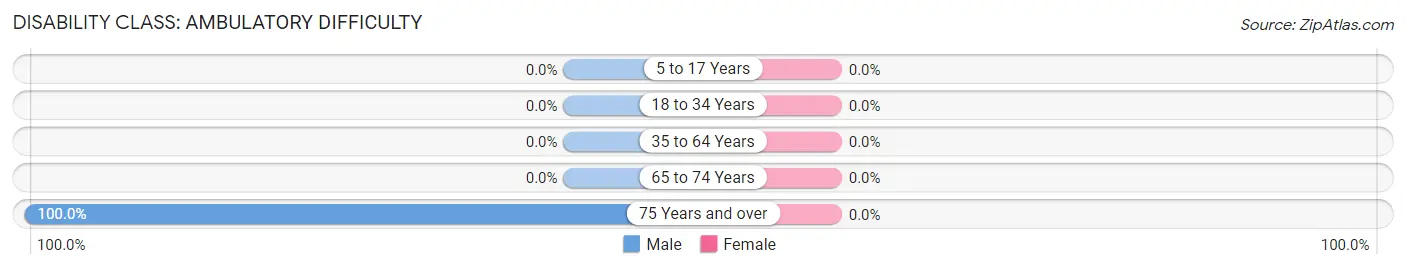
| Age Bracket | Male | Female |
| 5 to 17 Years | 0 (0.0%) | 0 (0.0%) |
| 18 to 34 Years | 0 (0.0%) | 0 (0.0%) |
| 35 to 64 Years | 0 (0.0%) | 0 (0.0%) |
| 65 to 74 Years | 0 (0.0%) | 0 (0.0%) |
| 75 Years and over | 20 (100.0%) | 0 (0.0%) |
Disability Class: Self-Care Difficulty
| Age Bracket | Male | Female |
| 5 to 17 Years | 0 (0.0%) | 0 (0.0%) |
| 18 to 34 Years | 0 (0.0%) | 0 (0.0%) |
| 35 to 64 Years | 0 (0.0%) | 0 (0.0%) |
| 65 to 74 Years | 0 (0.0%) | 0 (0.0%) |
| 75 Years and over | 0 (0.0%) | 0 (0.0%) |
Technology Access in Seltzer
Computing Device Access in Seltzer
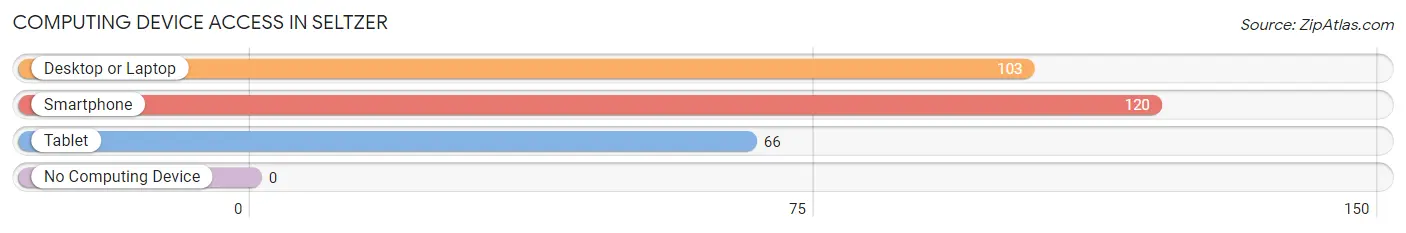
| Device Type | # Households | % Households |
| Desktop or Laptop | 103 | 81.8% |
| Smartphone | 120 | 95.2% |
| Tablet | 66 | 52.4% |
| No Computing Device | 0 | 0.0% |
| Total | 126 | 100.0% |
Internet Access in Seltzer
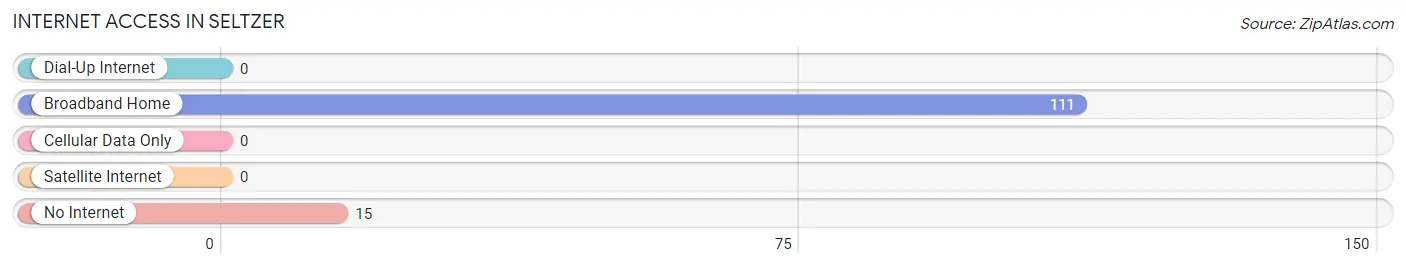
| Internet Type | # Households | % Households |
| Dial-Up Internet | 0 | 0.0% |
| Broadband Home | 111 | 88.1% |
| Cellular Data Only | 0 | 0.0% |
| Satellite Internet | 0 | 0.0% |
| No Internet | 15 | 11.9% |
| Total | 126 | 100.0% |
Seltzer Summary
Seltzer, Pennsylvania is a small borough located in Schuylkill County, Pennsylvania. It is situated in the southern part of the county, approximately five miles south of the county seat of Pottsville. The population of Seltzer was 545 at the 2010 census.
History
Seltzer was founded in 1845 by a group of German immigrants who had settled in the area. The town was named after the nearby Seltzer Creek, which was named after the German word for “salt”. The town was originally a farming community, but in the late 19th century, the coal industry began to take off in the area. The town was home to several coal mines, and the population grew rapidly. By the early 20th century, Seltzer had become a bustling coal mining town.
Geography
Seltzer is located in the southern part of Schuylkill County, approximately five miles south of the county seat of Pottsville. The borough is situated in the Appalachian Mountains, and is surrounded by rolling hills and forests. The town is located along the Schuylkill River, and is bordered by the towns of Pine Grove, Tremont, and Port Carbon.
Economy
The economy of Seltzer is largely based on the coal industry. The town is home to several coal mines, and the coal industry is the primary source of employment for the town’s residents. In addition to the coal industry, Seltzer is also home to several small businesses, including a grocery store, a hardware store, and a few restaurants.
Demographics
As of the 2010 census, the population of Seltzer was 545. The racial makeup of the town was 97.3% White, 0.7% African American, 0.2% Native American, 0.2% Asian, and 1.6% from two or more races. The median household income was $37,500, and the median family income was $45,000. The per capita income was $17,000.
Seltzer is a small, rural town with a rich history and a strong sense of community. The town is home to a diverse population, and the economy is largely based on the coal industry. Despite its small size, Seltzer is a vibrant and thriving community, and its residents take pride in their town and its history.
Common Questions
What is Per Capita Income in Seltzer?
Per Capita income in Seltzer is $29,169.
What is the Median Family Income in Seltzer?
Median Family Income in Seltzer is $83,200.
What is the Median Household income in Seltzer?
Median Household Income in Seltzer is $84,100.
What is Income or Wage Gap in Seltzer?
Income or Wage Gap in Seltzer is 66.5%.
Women in Seltzer earn 33.5 cents for every dollar earned by a man.
What is Inequality or Gini Index in Seltzer?
Inequality or Gini Index in Seltzer is 0.26.
What is the Total Population of Seltzer?
Total Population of Seltzer is 396.
What is the Total Male Population of Seltzer?
Total Male Population of Seltzer is 183.
What is the Total Female Population of Seltzer?
Total Female Population of Seltzer is 213.
What is the Ratio of Males per 100 Females in Seltzer?
There are 85.92 Males per 100 Females in Seltzer.
What is the Ratio of Females per 100 Males in Seltzer?
There are 116.39 Females per 100 Males in Seltzer.
What is the Median Population Age in Seltzer?
Median Population Age in Seltzer is 33.2 Years.
What is the Average Family Size in Seltzer
Average Family Size in Seltzer is 3.3 People.
What is the Average Household Size in Seltzer
Average Household Size in Seltzer is 3.1 People.
How Large is the Labor Force in Seltzer?
There are 150 People in the Labor Forcein in Seltzer.
What is the Percentage of People in the Labor Force in Seltzer?
50.8% of People are in the Labor Force in Seltzer.
What is the Unemployment Rate in Seltzer?
Unemployment Rate in Seltzer is 9.3%.