Earle, AR Map & Demographics
Earle Map
Earle Overview
$17,308
PER CAPITA INCOME
$47,250
AVG FAMILY INCOME
$41,484
AVG HOUSEHOLD INCOME
4.9%
WAGE / INCOME GAP [ % ]
95.1¢/ $1
WAGE / INCOME GAP [ $ ]
$14,454
FAMILY INCOME DEFICIT
0.48
INEQUALITY / GINI INDEX
1,759
TOTAL POPULATION
819
MALE POPULATION
940
FEMALE POPULATION
87.13
MALES / 100 FEMALES
114.77
FEMALES / 100 MALES
36.3
MEDIAN AGE
3.9
AVG FAMILY SIZE
2.8
AVG HOUSEHOLD SIZE
663
LABOR FORCE [ PEOPLE ]
50.7%
PERCENT IN LABOR FORCE
17.0%
UNEMPLOYMENT RATE
Earle Zip Codes
Earle Area Codes
Income in Earle
Income Overview in Earle
Per Capita Income in Earle is $17,308, while median incomes of families and households are $47,250 and $41,484 respectively.
| Characteristic | Number | Measure |
| Per Capita Income | 1,759 | $17,308 |
| Median Family Income | 329 | $47,250 |
| Mean Family Income | 329 | $60,980 |
| Median Household Income | 617 | $41,484 |
| Mean Household Income | 617 | $49,187 |
| Income Deficit | 329 | $14,454 |
| Wage / Income Gap (%) | 1,759 | 4.90% |
| Wage / Income Gap ($) | 1,759 | 95.10¢ per $1 |
| Gini / Inequality Index | 1,759 | 0.48 |
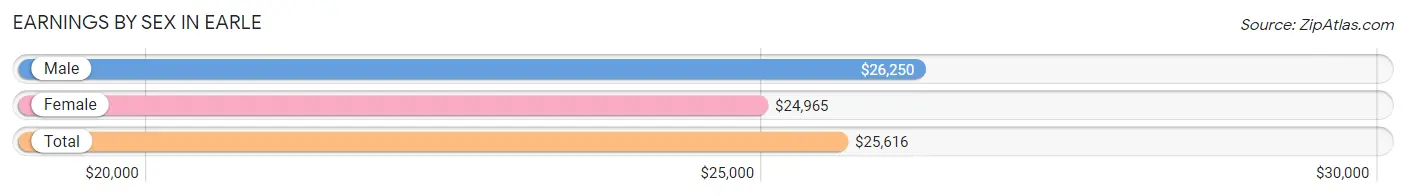
Earnings by Sex in Earle
Average Earnings in Earle are $25,616, $26,250 for men and $24,965 for women, a difference of 4.9%.
| Sex | Number | Average Earnings |
| Male | 319 (50.6%) | $26,250 |
| Female | 311 (49.4%) | $24,965 |
| Total | 630 (100.0%) | $25,616 |
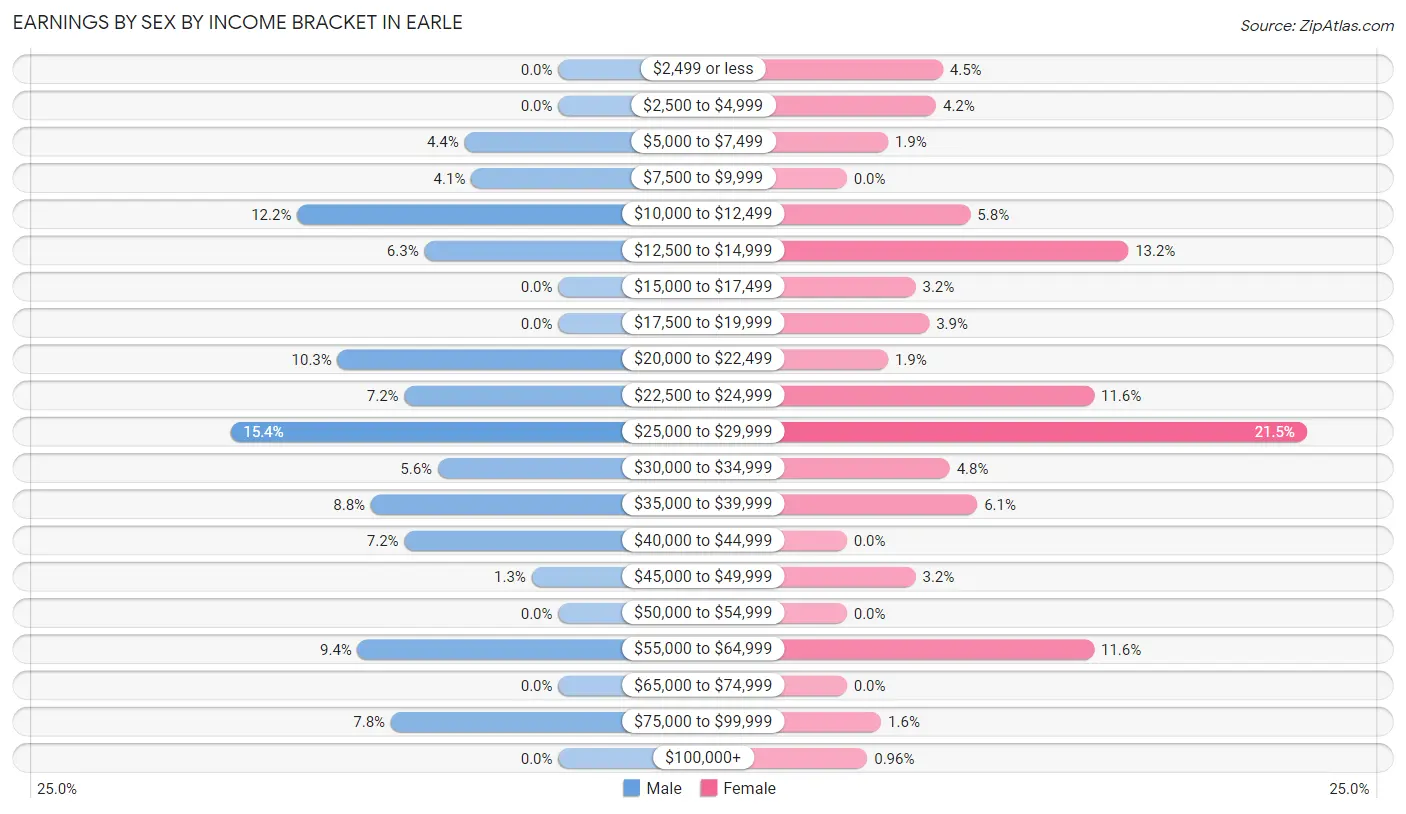
Earnings by Sex by Income Bracket in Earle
The most common earnings brackets in Earle are $25,000 to $29,999 for men (49 | 15.4%) and $25,000 to $29,999 for women (67 | 21.5%).
| Income | Male | Female |
| $2,499 or less | 0 (0.0%) | 14 (4.5%) |
| $2,500 to $4,999 | 0 (0.0%) | 13 (4.2%) |
| $5,000 to $7,499 | 14 (4.4%) | 6 (1.9%) |
| $7,500 to $9,999 | 13 (4.1%) | 0 (0.0%) |
| $10,000 to $12,499 | 39 (12.2%) | 18 (5.8%) |
| $12,500 to $14,999 | 20 (6.3%) | 41 (13.2%) |
| $15,000 to $17,499 | 0 (0.0%) | 10 (3.2%) |
| $17,500 to $19,999 | 0 (0.0%) | 12 (3.9%) |
| $20,000 to $22,499 | 33 (10.3%) | 6 (1.9%) |
| $22,500 to $24,999 | 23 (7.2%) | 36 (11.6%) |
| $25,000 to $29,999 | 49 (15.4%) | 67 (21.5%) |
| $30,000 to $34,999 | 18 (5.6%) | 15 (4.8%) |
| $35,000 to $39,999 | 28 (8.8%) | 19 (6.1%) |
| $40,000 to $44,999 | 23 (7.2%) | 0 (0.0%) |
| $45,000 to $49,999 | 4 (1.3%) | 10 (3.2%) |
| $50,000 to $54,999 | 0 (0.0%) | 0 (0.0%) |
| $55,000 to $64,999 | 30 (9.4%) | 36 (11.6%) |
| $65,000 to $74,999 | 0 (0.0%) | 0 (0.0%) |
| $75,000 to $99,999 | 25 (7.8%) | 5 (1.6%) |
| $100,000+ | 0 (0.0%) | 3 (1.0%) |
| Total | 319 (100.0%) | 311 (100.0%) |
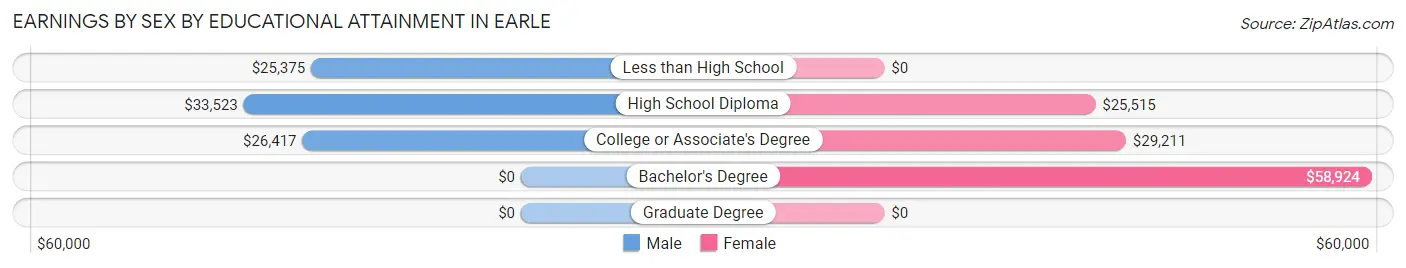
Earnings by Sex by Educational Attainment in Earle
Average earnings in Earle are $27,857 for men and $27,619 for women, a difference of 0.9%. Men with an educational attainment of high school diploma enjoy the highest average annual earnings of $33,523, while those with less than high school education earn the least with $25,375. Women with an educational attainment of bachelor's degree earn the most with the average annual earnings of $58,924, while those with high school diploma education have the smallest earnings of $25,515.
| Educational Attainment | Male Income | Female Income |
| Less than High School | $25,375 | $0 |
| High School Diploma | $33,523 | $25,515 |
| College or Associate's Degree | $26,417 | $29,211 |
| Bachelor's Degree | - | - |
| Graduate Degree | - | - |
| Total | $27,857 | $27,619 |
Family Income in Earle
Family Income Brackets in Earle
According to the Earle family income data, there are 101 families falling into the $75,000 to $99,999 income range, which is the most common income bracket and makes up 30.7% of all families.
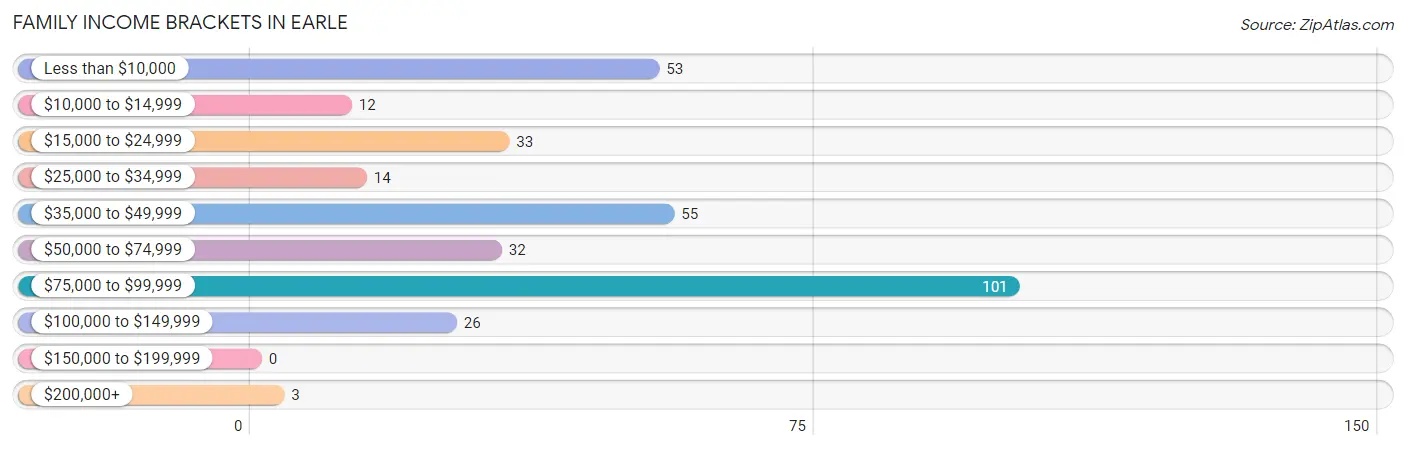
| Income Bracket | # Families | % Families |
| Less than $10,000 | 53 | 16.1% |
| $10,000 to $14,999 | 12 | 3.6% |
| $15,000 to $24,999 | 33 | 10.0% |
| $25,000 to $34,999 | 14 | 4.3% |
| $35,000 to $49,999 | 55 | 16.7% |
| $50,000 to $74,999 | 32 | 9.7% |
| $75,000 to $99,999 | 101 | 30.7% |
| $100,000 to $149,999 | 26 | 7.9% |
| $150,000 to $199,999 | 0 | 0.0% |
| $200,000+ | 3 | 0.9% |
Family Income by Famaliy Size in Earle
5-person families (44 | 13.4%) account for the highest median family income in Earle with $79,464 per family, while 3-person families (85 | 25.8%) have the highest median income of $25,122 per family member.
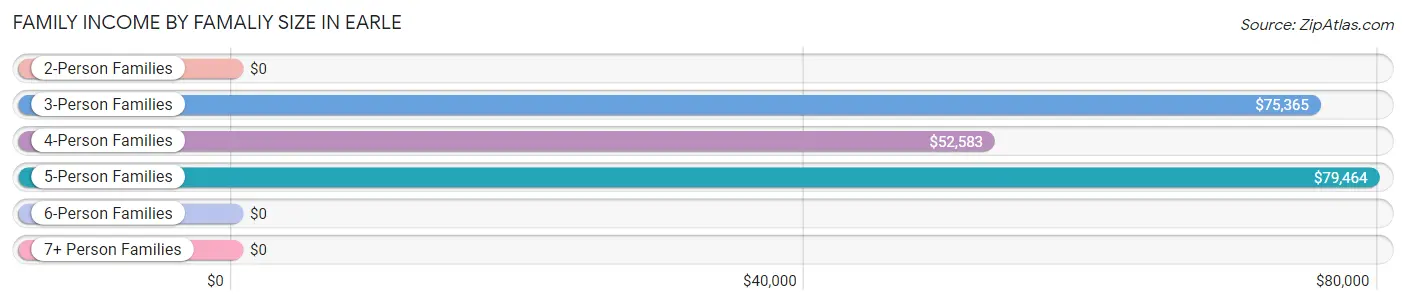
| Income Bracket | # Families | Median Income |
| 2-Person Families | 121 (36.8%) | $0 |
| 3-Person Families | 85 (25.8%) | $75,365 |
| 4-Person Families | 61 (18.5%) | $52,583 |
| 5-Person Families | 44 (13.4%) | $79,464 |
| 6-Person Families | 12 (3.6%) | $0 |
| 7+ Person Families | 6 (1.8%) | $0 |
| Total | 329 (100.0%) | $47,250 |
Family Income by Number of Earners in Earle
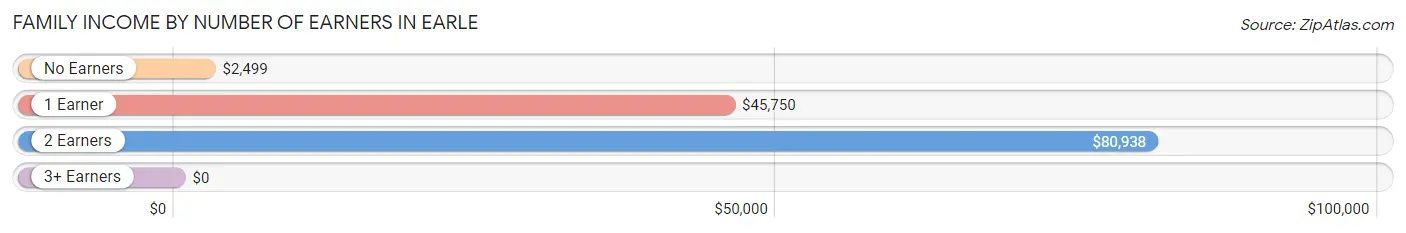
| Number of Earners | # Families | Median Income |
| No Earners | 89 (27.1%) | $2,499 |
| 1 Earner | 120 (36.5%) | $45,750 |
| 2 Earners | 96 (29.2%) | $80,938 |
| 3+ Earners | 24 (7.3%) | $0 |
| Total | 329 (100.0%) | $47,250 |
Household Income in Earle
Household Income Brackets in Earle
With 118 households falling in the category, the $75,000 to $99,999 income range is the most frequent in Earle, accounting for 19.1% of all households.
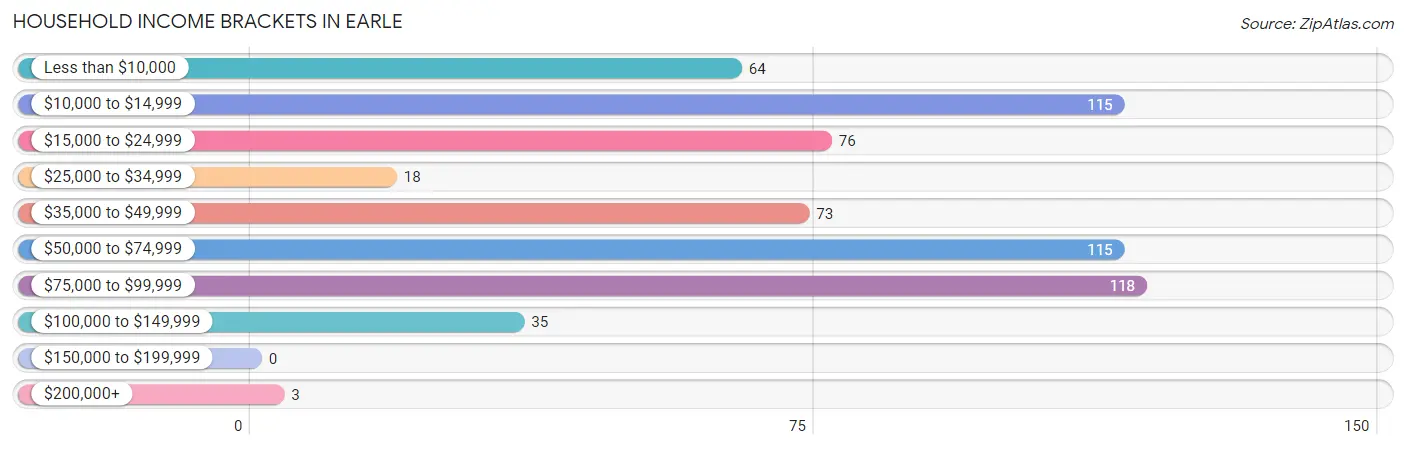
| Income Bracket | # Households | % Households |
| Less than $10,000 | 64 | 10.4% |
| $10,000 to $14,999 | 115 | 18.6% |
| $15,000 to $24,999 | 76 | 12.3% |
| $25,000 to $34,999 | 18 | 2.9% |
| $35,000 to $49,999 | 73 | 11.8% |
| $50,000 to $74,999 | 115 | 18.6% |
| $75,000 to $99,999 | 118 | 19.1% |
| $100,000 to $149,999 | 35 | 5.7% |
| $150,000 to $199,999 | 0 | 0.0% |
| $200,000+ | 3 | 0.5% |
Household Income by Householder Age in Earle
The median household income in Earle is $41,484, with the highest median household income of $61,719 found in the 25 to 44 years age bracket for the primary householder. A total of 166 households (26.9%) fall into this category. Meanwhile, the 15 to 24 years age bracket for the primary householder has the lowest median household income of $0, with 11 households (1.8%) in this group.
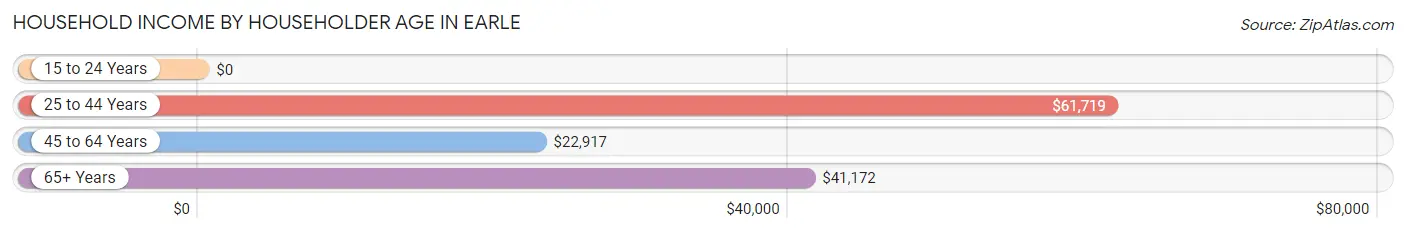
| Income Bracket | # Households | Median Income |
| 15 to 24 Years | 11 (1.8%) | $0 |
| 25 to 44 Years | 166 (26.9%) | $61,719 |
| 45 to 64 Years | 293 (47.5%) | $22,917 |
| 65+ Years | 147 (23.8%) | $41,172 |
| Total | 617 (100.0%) | $41,484 |
Poverty in Earle
Income Below Poverty by Sex and Age in Earle
With 32.0% poverty level for males and 34.3% for females among the residents of Earle, 5 year old males and 5 year old females are the most vulnerable to poverty, with 8 males (100.0%) and 24 females (100.0%) in their respective age groups living below the poverty level.
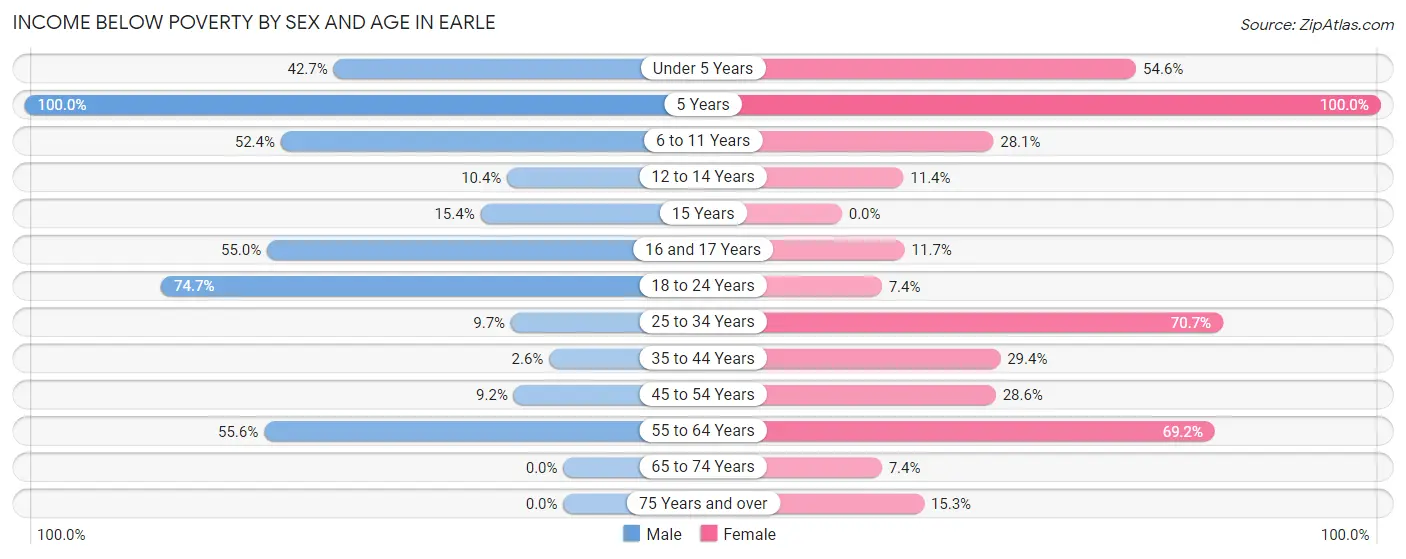
| Age Bracket | Male | Female |
| Under 5 Years | 29 (42.6%) | 53 (54.6%) |
| 5 Years | 8 (100.0%) | 24 (100.0%) |
| 6 to 11 Years | 43 (52.4%) | 18 (28.1%) |
| 12 to 14 Years | 5 (10.4%) | 4 (11.4%) |
| 15 Years | 2 (15.4%) | 0 (0.0%) |
| 16 and 17 Years | 22 (55.0%) | 7 (11.7%) |
| 18 to 24 Years | 53 (74.7%) | 6 (7.4%) |
| 25 to 34 Years | 11 (9.7%) | 29 (70.7%) |
| 35 to 44 Years | 2 (2.6%) | 35 (29.4%) |
| 45 to 54 Years | 7 (9.2%) | 16 (28.6%) |
| 55 to 64 Years | 80 (55.6%) | 108 (69.2%) |
| 65 to 74 Years | 0 (0.0%) | 10 (7.4%) |
| 75 Years and over | 0 (0.0%) | 9 (15.2%) |
| Total | 262 (32.0%) | 319 (34.3%) |
Income Above Poverty by Sex and Age in Earle
According to the poverty statistics in Earle, males aged 65 to 74 years and females aged 15 years are the age groups that are most secure financially, with 100.0% of males and 100.0% of females in these age groups living above the poverty line.
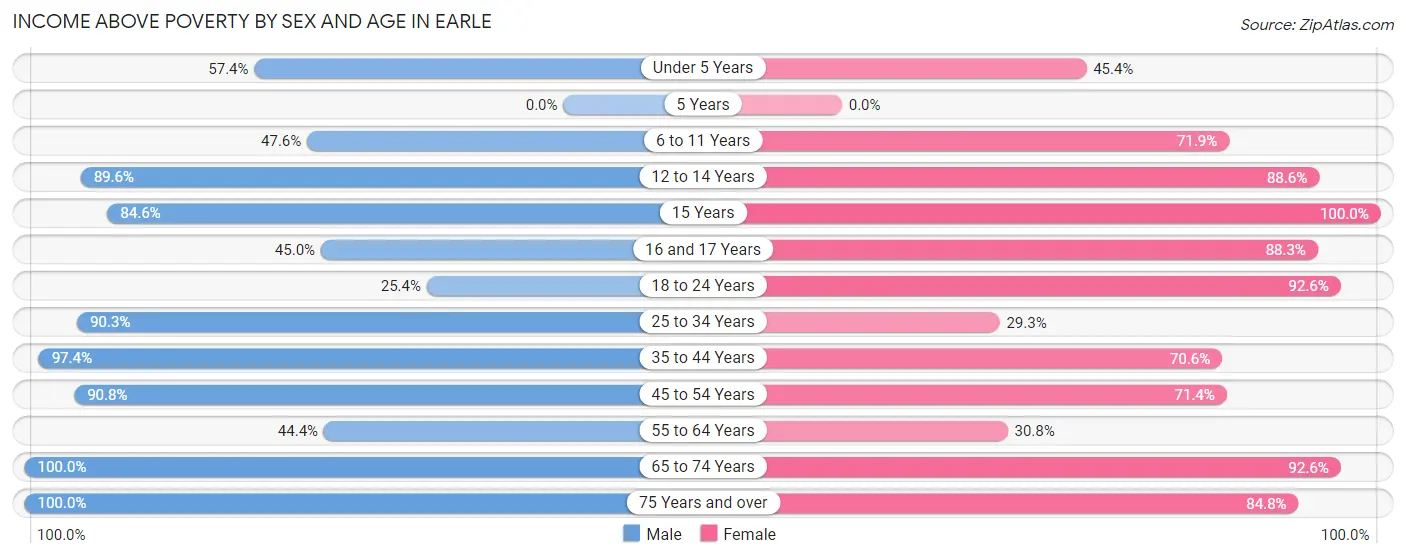
| Age Bracket | Male | Female |
| Under 5 Years | 39 (57.4%) | 44 (45.4%) |
| 5 Years | 0 (0.0%) | 0 (0.0%) |
| 6 to 11 Years | 39 (47.6%) | 46 (71.9%) |
| 12 to 14 Years | 43 (89.6%) | 31 (88.6%) |
| 15 Years | 11 (84.6%) | 4 (100.0%) |
| 16 and 17 Years | 18 (45.0%) | 53 (88.3%) |
| 18 to 24 Years | 18 (25.4%) | 75 (92.6%) |
| 25 to 34 Years | 102 (90.3%) | 12 (29.3%) |
| 35 to 44 Years | 74 (97.4%) | 84 (70.6%) |
| 45 to 54 Years | 69 (90.8%) | 40 (71.4%) |
| 55 to 64 Years | 64 (44.4%) | 48 (30.8%) |
| 65 to 74 Years | 69 (100.0%) | 125 (92.6%) |
| 75 Years and over | 11 (100.0%) | 50 (84.8%) |
| Total | 557 (68.0%) | 612 (65.7%) |
Income Below Poverty Among Married-Couple Families in Earle
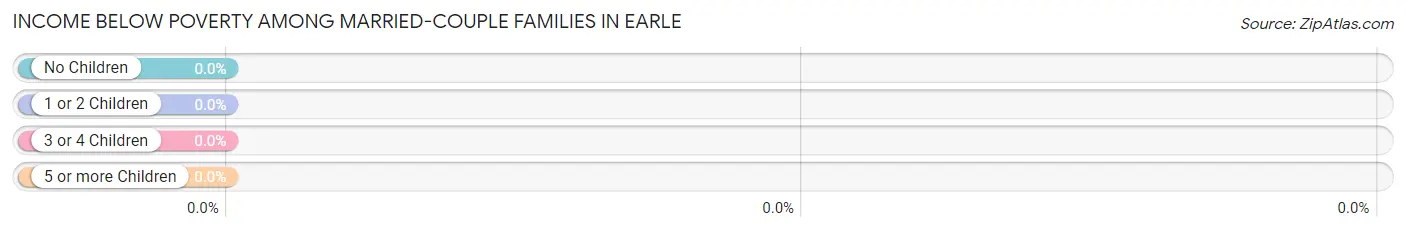
| Children | Above Poverty | Below Poverty |
| No Children | 47 (100.0%) | 0 (0.0%) |
| 1 or 2 Children | 27 (100.0%) | 0 (0.0%) |
| 3 or 4 Children | 13 (100.0%) | 0 (0.0%) |
| 5 or more Children | 6 (100.0%) | 0 (0.0%) |
| Total | 93 (100.0%) | 0 (0.0%) |
Income Below Poverty Among Single-Parent Households in Earle
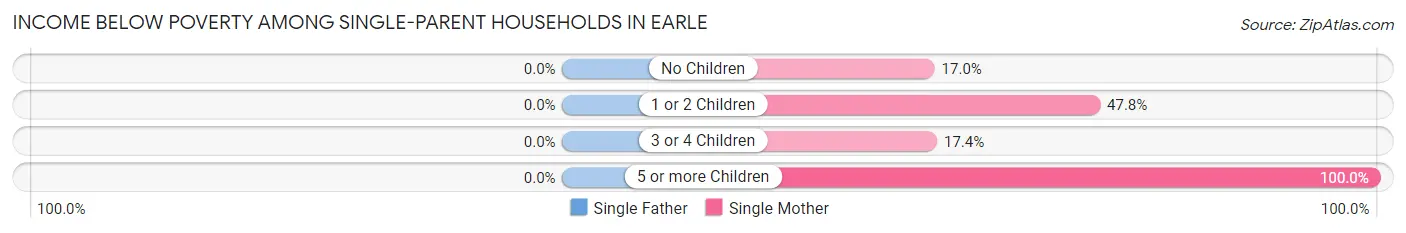
| Children | Single Father | Single Mother |
| No Children | 0 (0.0%) | 10 (17.0%) |
| 1 or 2 Children | 0 (0.0%) | 64 (47.8%) |
| 3 or 4 Children | 0 (0.0%) | 4 (17.4%) |
| 5 or more Children | 0 (0.0%) | 12 (100.0%) |
| Total | 0 (0.0%) | 90 (39.5%) |
Income Below Poverty Among Married-Couple vs Single-Parent Households in Earle
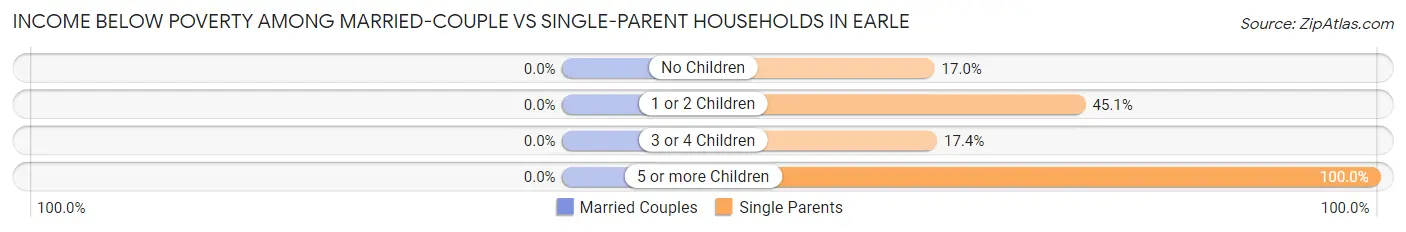
| Children | Married-Couple Families | Single-Parent Households |
| No Children | 0 (0.0%) | 10 (17.0%) |
| 1 or 2 Children | 0 (0.0%) | 64 (45.1%) |
| 3 or 4 Children | 0 (0.0%) | 4 (17.4%) |
| 5 or more Children | 0 (0.0%) | 12 (100.0%) |
| Total | 0 (0.0%) | 90 (38.1%) |
Race in Earle
The most populous races in Earle are Black / African American (1,278 | 72.7%), White / Caucasian (282 | 16.0%), and Two or more Races (199 | 11.3%).
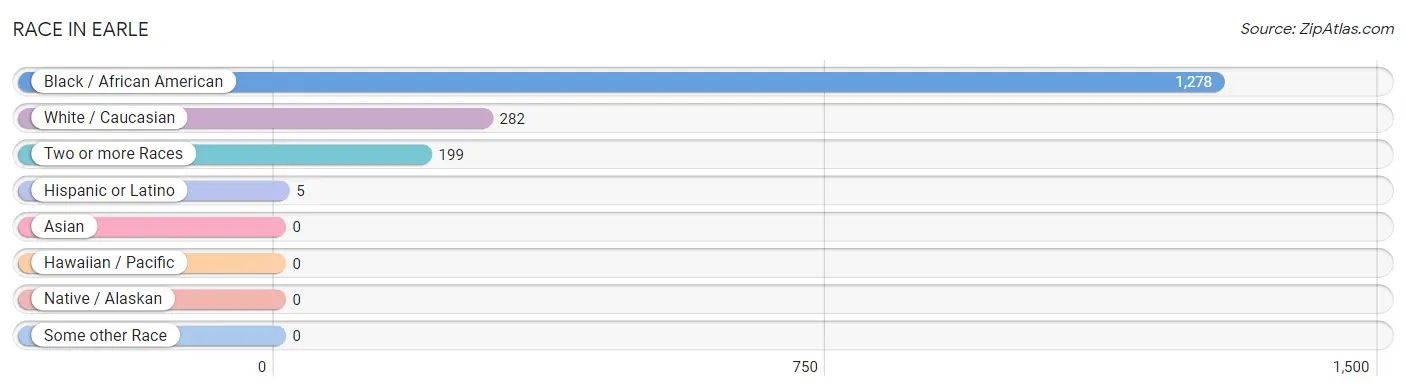
| Race | # Population | % Population |
| Asian | 0 | 0.0% |
| Black / African American | 1,278 | 72.7% |
| Hawaiian / Pacific | 0 | 0.0% |
| Hispanic or Latino | 5 | 0.3% |
| Native / Alaskan | 0 | 0.0% |
| White / Caucasian | 282 | 16.0% |
| Two or more Races | 199 | 11.3% |
| Some other Race | 0 | 0.0% |
| Total | 1,759 | 100.0% |
Ancestry in Earle
The most populous ancestries reported in Earle are American (155 | 8.8%), Cherokee (75 | 4.3%), German (65 | 3.7%), African (63 | 3.6%), and Subsaharan African (63 | 3.6%), together accounting for 23.9% of all Earle residents.
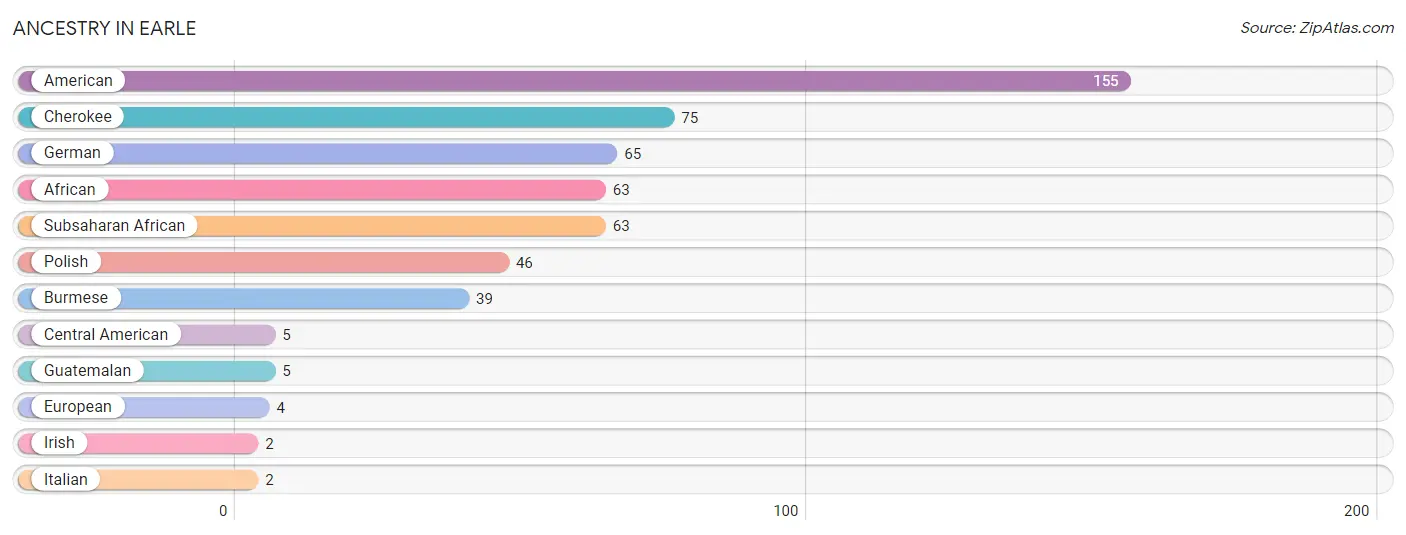
| Ancestry | # Population | % Population |
| African | 63 | 3.6% |
| American | 155 | 8.8% |
| Burmese | 39 | 2.2% |
| Central American | 5 | 0.3% |
| Cherokee | 75 | 4.3% |
| European | 4 | 0.2% |
| German | 65 | 3.7% |
| Guatemalan | 5 | 0.3% |
| Irish | 2 | 0.1% |
| Italian | 2 | 0.1% |
| Polish | 46 | 2.6% |
| Subsaharan African | 63 | 3.6% | View All 12 Rows |
Immigrants in Earle

| Immigration Origin | # Population | % Population | View All 0 Rows |
Sex and Age in Earle
Sex and Age in Earle
The most populous age groups in Earle are 55 to 59 Years (108 | 13.2%) for men and 65 to 69 Years (126 | 13.4%) for women.
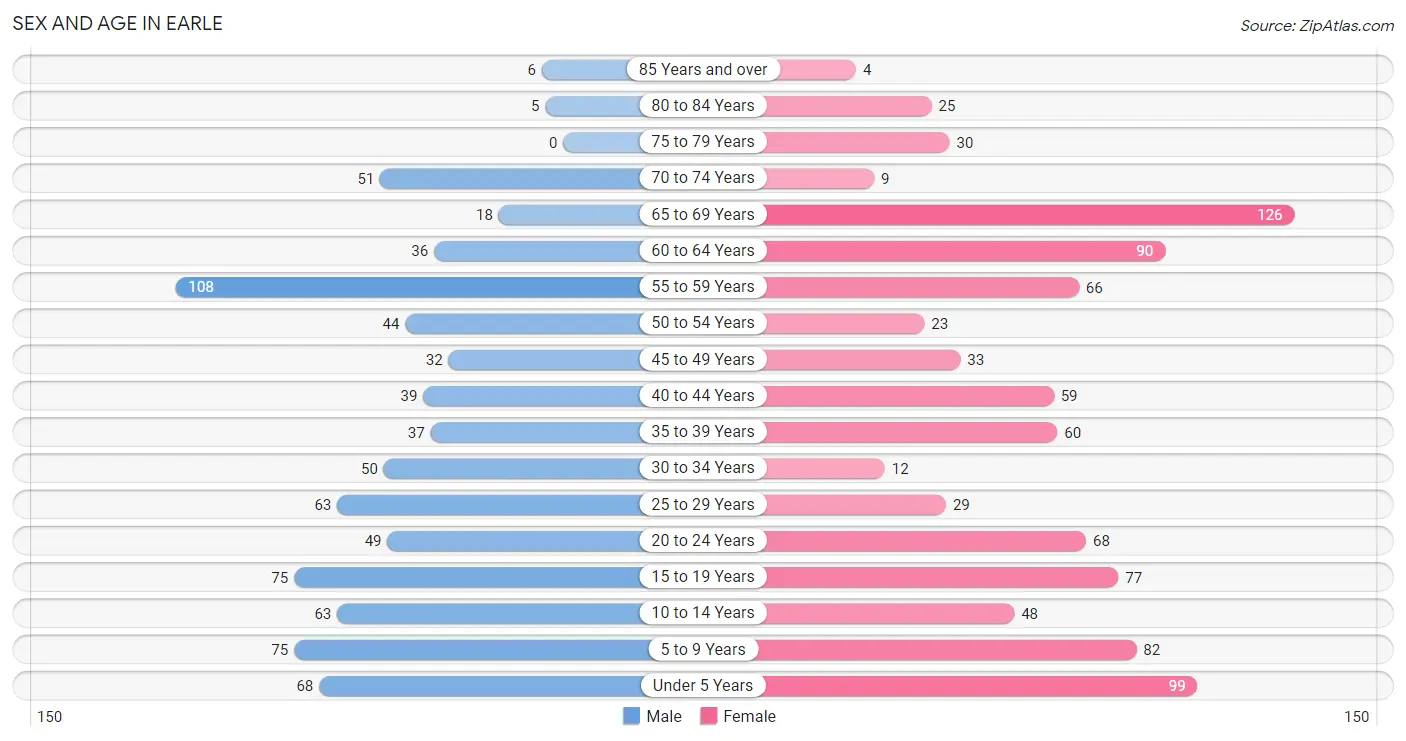
| Age Bracket | Male | Female |
| Under 5 Years | 68 (8.3%) | 99 (10.5%) |
| 5 to 9 Years | 75 (9.2%) | 82 (8.7%) |
| 10 to 14 Years | 63 (7.7%) | 48 (5.1%) |
| 15 to 19 Years | 75 (9.2%) | 77 (8.2%) |
| 20 to 24 Years | 49 (6.0%) | 68 (7.2%) |
| 25 to 29 Years | 63 (7.7%) | 29 (3.1%) |
| 30 to 34 Years | 50 (6.1%) | 12 (1.3%) |
| 35 to 39 Years | 37 (4.5%) | 60 (6.4%) |
| 40 to 44 Years | 39 (4.8%) | 59 (6.3%) |
| 45 to 49 Years | 32 (3.9%) | 33 (3.5%) |
| 50 to 54 Years | 44 (5.4%) | 23 (2.5%) |
| 55 to 59 Years | 108 (13.2%) | 66 (7.0%) |
| 60 to 64 Years | 36 (4.4%) | 90 (9.6%) |
| 65 to 69 Years | 18 (2.2%) | 126 (13.4%) |
| 70 to 74 Years | 51 (6.2%) | 9 (1.0%) |
| 75 to 79 Years | 0 (0.0%) | 30 (3.2%) |
| 80 to 84 Years | 5 (0.6%) | 25 (2.7%) |
| 85 Years and over | 6 (0.7%) | 4 (0.4%) |
| Total | 819 (100.0%) | 940 (100.0%) |
Families and Households in Earle
Median Family Size in Earle
The median family size in Earle is 3.89 persons per family, with single female/mother families (228 | 69.3%) accounting for the largest median family size of 4.04 persons per family. On the other hand, single male/father families (8 | 2.4%) represent the smallest median family size with 2.25 persons per family.
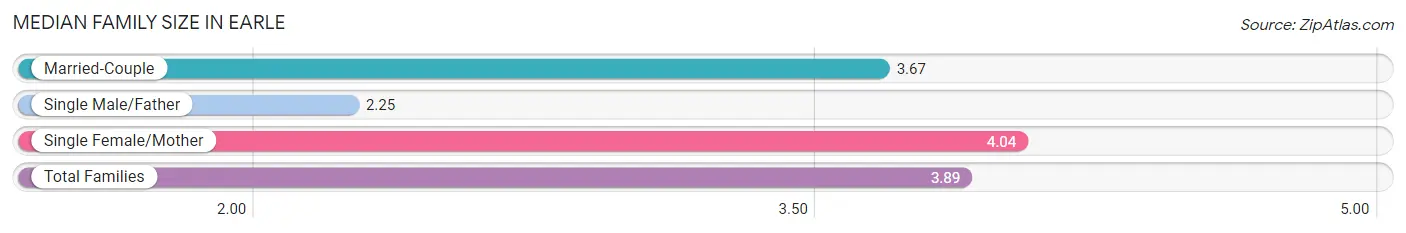
| Family Type | # Families | Family Size |
| Married-Couple | 93 (28.3%) | 3.67 |
| Single Male/Father | 8 (2.4%) | 2.25 |
| Single Female/Mother | 228 (69.3%) | 4.04 |
| Total Families | 329 (100.0%) | 3.89 |
Median Household Size in Earle
The median household size in Earle is 2.82 persons per household, with single female/mother households (228 | 36.9%) accounting for the largest median household size of 4.23 persons per household. non-family households (288 | 46.7%) represent the smallest median household size with 1.42 persons per household.
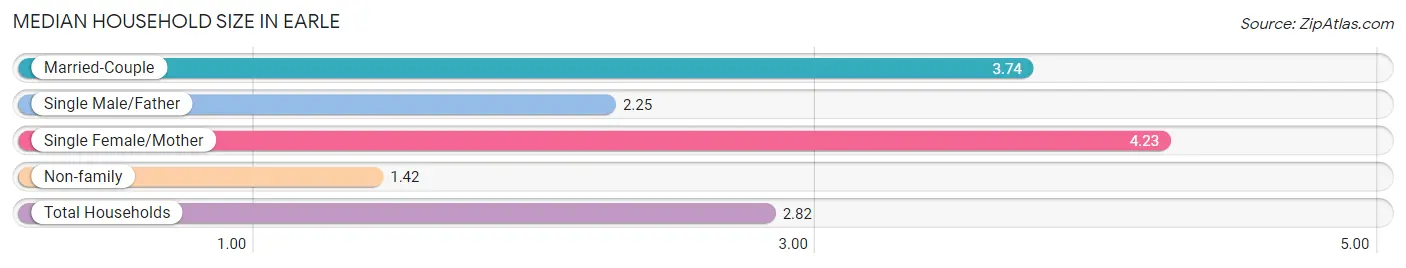
| Household Type | # Households | Household Size |
| Married-Couple | 93 (15.1%) | 3.74 |
| Single Male/Father | 8 (1.3%) | 2.25 |
| Single Female/Mother | 228 (36.9%) | 4.23 |
| Non-family | 288 (46.7%) | 1.42 |
| Total Households | 617 (100.0%) | 2.82 |
Household Size by Marriage Status in Earle
Out of a total of 617 households in Earle, 329 (53.3%) are family households, while 288 (46.7%) are nonfamily households. The most numerous type of family households are 2-person households, comprising 104, and the most common type of nonfamily households are 1-person households, comprising 158.
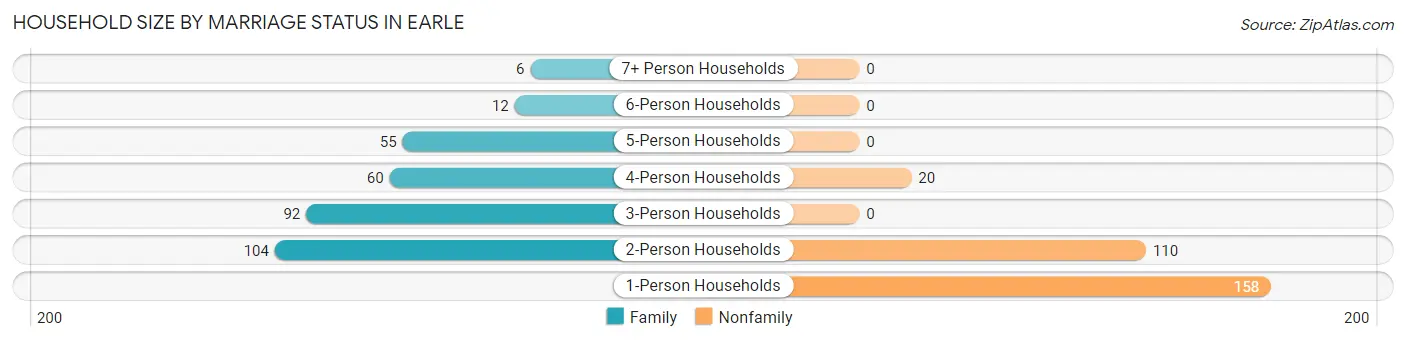
| Household Size | Family Households | Nonfamily Households |
| 1-Person Households | - | 158 (25.6%) |
| 2-Person Households | 104 (16.9%) | 110 (17.8%) |
| 3-Person Households | 92 (14.9%) | 0 (0.0%) |
| 4-Person Households | 60 (9.7%) | 20 (3.2%) |
| 5-Person Households | 55 (8.9%) | 0 (0.0%) |
| 6-Person Households | 12 (1.9%) | 0 (0.0%) |
| 7+ Person Households | 6 (1.0%) | 0 (0.0%) |
| Total | 329 (53.3%) | 288 (46.7%) |
Female Fertility in Earle
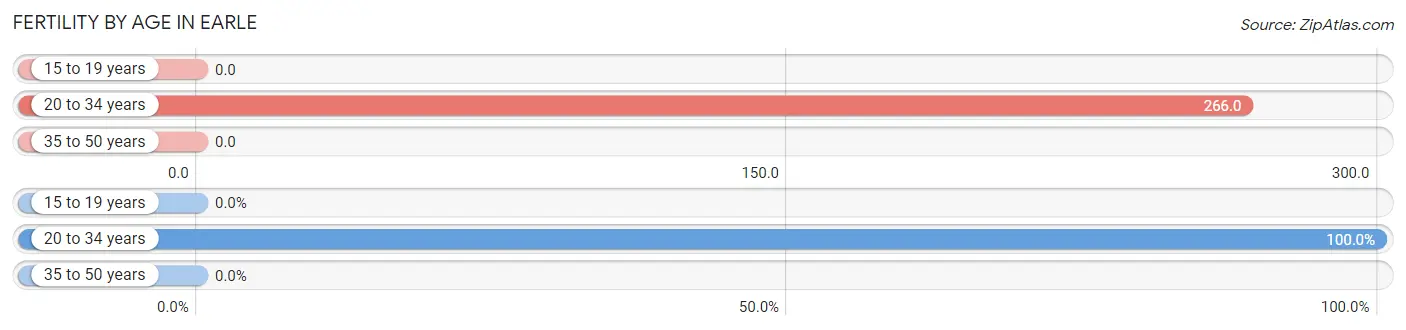
Fertility by Age in Earle
Average fertility rate in Earle is 86.0 births per 1,000 women. Women in the age bracket of 20 to 34 years have the highest fertility rate with 266.0 births per 1,000 women. Women in the age bracket of 20 to 34 years acount for 100.0% of all women with births.
| Age Bracket | Women with Births | Births / 1,000 Women |
| 15 to 19 years | 0 (0.0%) | 0.0 |
| 20 to 34 years | 29 (100.0%) | 266.0 |
| 35 to 50 years | 0 (0.0%) | 0.0 |
| Total | 29 (100.0%) | 86.0 |
Fertility by Age by Marriage Status in Earle
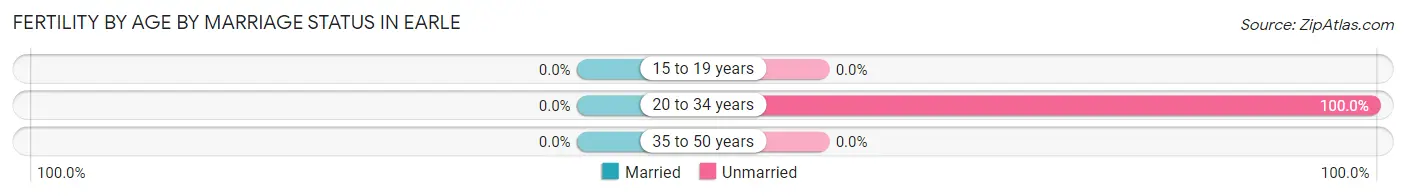
| Age Bracket | Married | Unmarried |
| 15 to 19 years | 0 (0.0%) | 0 (0.0%) |
| 20 to 34 years | 0 (0.0%) | 29 (100.0%) |
| 35 to 50 years | 0 (0.0%) | 0 (0.0%) |
| Total | 0 (0.0%) | 29 (100.0%) |
Fertility by Education in Earle
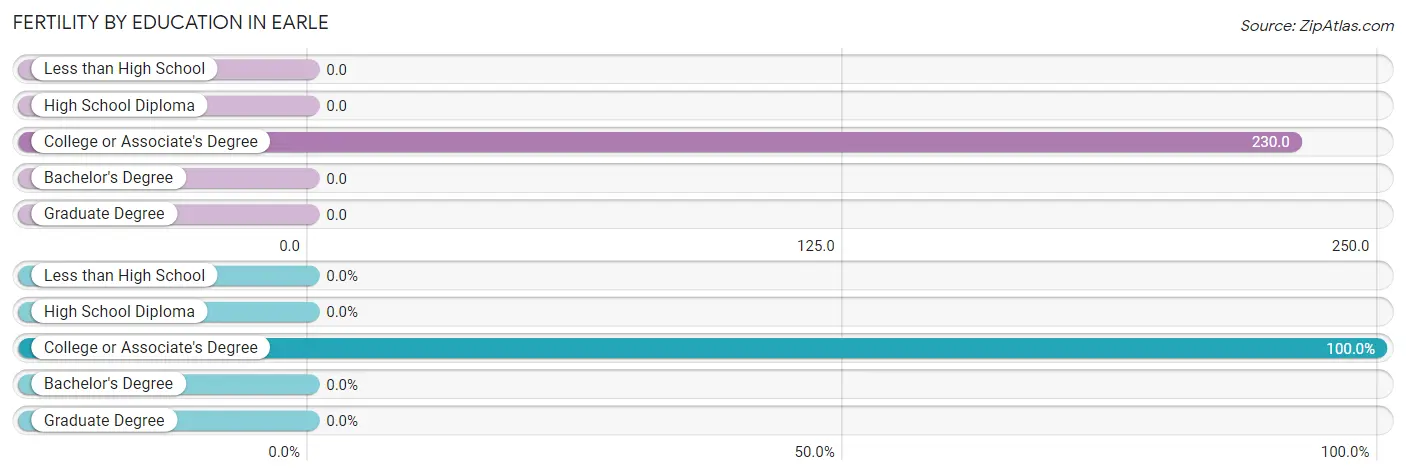
| Educational Attainment | Women with Births | Births / 1,000 Women |
| Less than High School | 0 (0.0%) | 0.0 |
| High School Diploma | 0 (0.0%) | 0.0 |
| College or Associate's Degree | 29 (100.0%) | 230.0 |
| Bachelor's Degree | 0 (0.0%) | 0.0 |
| Graduate Degree | 0 (0.0%) | 0.0 |
| Total | 29 (100.0%) | 86.0 |
Fertility by Education by Marriage Status in Earle
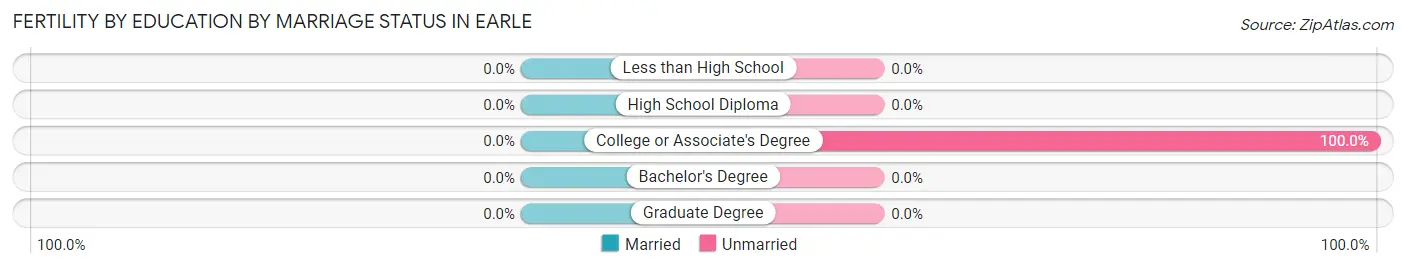
| Educational Attainment | Married | Unmarried |
| Less than High School | 0 (0.0%) | 0 (0.0%) |
| High School Diploma | 0 (0.0%) | 0 (0.0%) |
| College or Associate's Degree | 0 (0.0%) | 29 (100.0%) |
| Bachelor's Degree | 0 (0.0%) | 0 (0.0%) |
| Graduate Degree | 0 (0.0%) | 0 (0.0%) |
| Total | 0 (0.0%) | 29 (100.0%) |
Employment Characteristics in Earle
Employment by Class of Employer in Earle
Among the 550 employed individuals in Earle, private company employees (442 | 80.4%), local government employees (38 | 6.9%), and not-for-profit organizations (30 | 5.4%) make up the most common classes of employment.
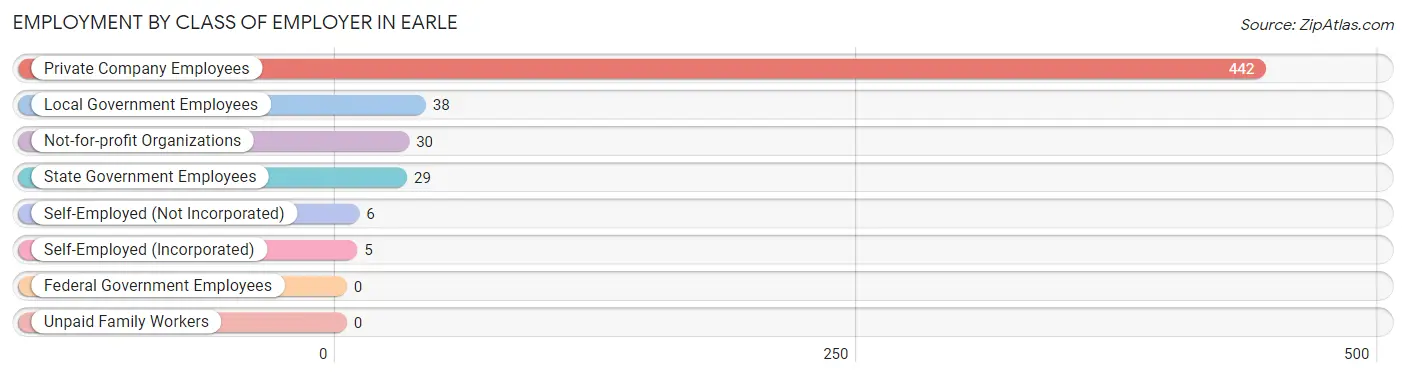
| Employer Class | # Employees | % Employees |
| Private Company Employees | 442 | 80.4% |
| Self-Employed (Incorporated) | 5 | 0.9% |
| Self-Employed (Not Incorporated) | 6 | 1.1% |
| Not-for-profit Organizations | 30 | 5.4% |
| Local Government Employees | 38 | 6.9% |
| State Government Employees | 29 | 5.3% |
| Federal Government Employees | 0 | 0.0% |
| Unpaid Family Workers | 0 | 0.0% |
| Total | 550 | 100.0% |
Employment Status by Age in Earle
According to the labor force statistics for Earle, out of the total population over 16 years of age (1,307), 50.7% or 663 individuals are in the labor force, with 17.0% or 113 of them unemployed. The age group with the highest labor force participation rate is 20 to 24 years, with 100.0% or 117 individuals in the labor force. Within the labor force, the 30 to 34 years age range has the highest percentage of unemployed individuals, with 56.5% or 13 of them being unemployed.
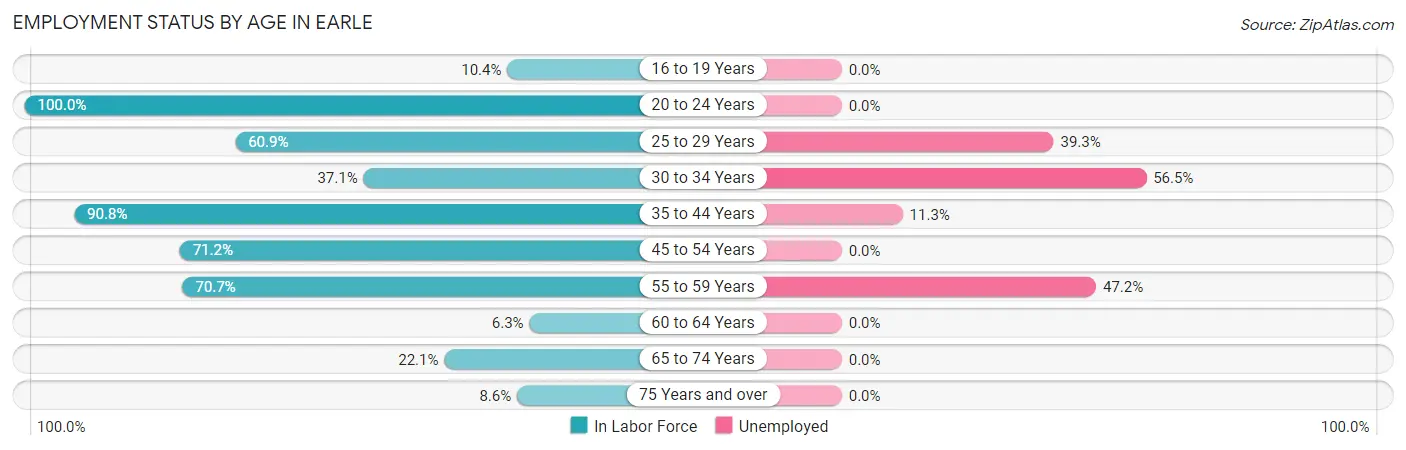
| Age Bracket | In Labor Force | Unemployed |
| 16 to 19 Years | 14 (10.4%) | 0 (0.0%) |
| 20 to 24 Years | 117 (100.0%) | 0 (0.0%) |
| 25 to 29 Years | 56 (60.9%) | 22 (39.3%) |
| 30 to 34 Years | 23 (37.1%) | 13 (56.5%) |
| 35 to 44 Years | 177 (90.8%) | 20 (11.3%) |
| 45 to 54 Years | 94 (71.2%) | 0 (0.0%) |
| 55 to 59 Years | 123 (70.7%) | 58 (47.2%) |
| 60 to 64 Years | 8 (6.3%) | 0 (0.0%) |
| 65 to 74 Years | 45 (22.1%) | 0 (0.0%) |
| 75 Years and over | 6 (8.6%) | 0 (0.0%) |
| Total | 663 (50.7%) | 113 (17.0%) |
Employment Status by Educational Attainment in Earle
According to labor force statistics for Earle, 61.6% of individuals (481) out of the total population between 25 and 64 years of age (781) are in the labor force, with 23.5% or 113 of them being unemployed. The group with the highest labor force participation rate are those with the educational attainment of bachelor's degree or higher, with 100.0% or 58 individuals in the labor force. Within the labor force, individuals with less than high school education have the highest percentage of unemployment, with 49.6% or 58 of them being unemployed.
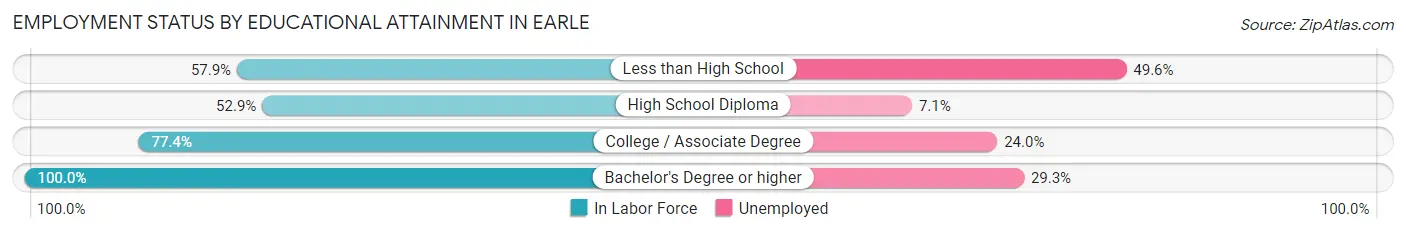
| Educational Attainment | In Labor Force | Unemployed |
| Less than High School | 117 (57.9%) | 100 (49.6%) |
| High School Diploma | 210 (52.9%) | 28 (7.1%) |
| College / Associate Degree | 96 (77.4%) | 30 (24.0%) |
| Bachelor's Degree or higher | 58 (100.0%) | 17 (29.3%) |
| Total | 481 (61.6%) | 184 (23.5%) |
Employment Occupations by Sex in Earle
Management, Business, Science and Arts Occupations
The most common Management, Business, Science and Arts occupations in Earle are Business & Financial (15 | 2.7%), Management (8 | 1.5%), Computers, Engineering & Science (5 | 0.9%), Architecture & Engineering (5 | 0.9%), and Health Diagnosing & Treating (5 | 0.9%).
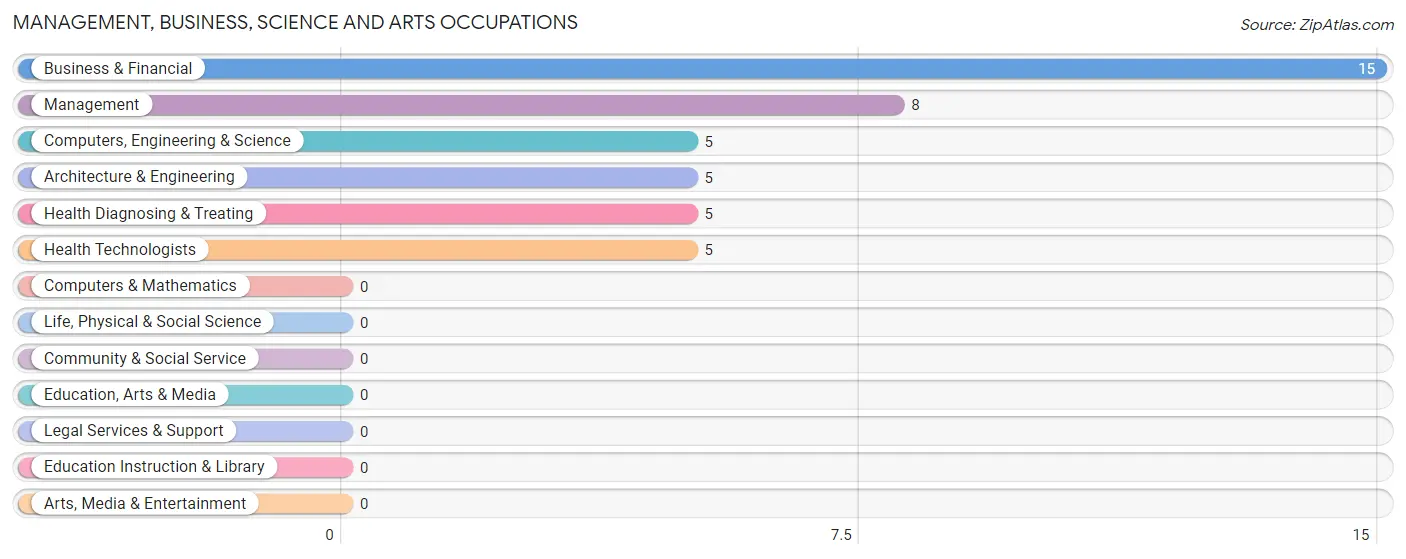
Management, Business, Science and Arts Occupations by Sex
Within the Management, Business, Science and Arts occupations in Earle, the most male-oriented occupations are Management (100.0%), Computers, Engineering & Science (100.0%), and Architecture & Engineering (100.0%), while the most female-oriented occupations are Business & Financial (100.0%), Health Diagnosing & Treating (100.0%), and Health Technologists (100.0%).
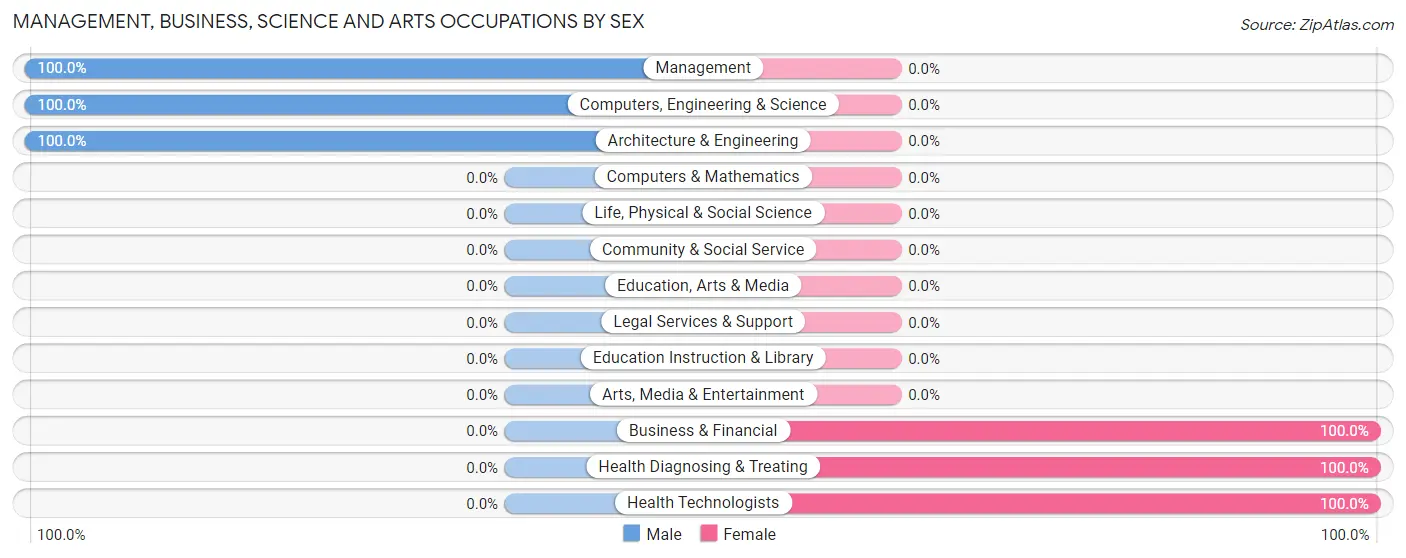
| Occupation | Male | Female |
| Management | 8 (100.0%) | 0 (0.0%) |
| Business & Financial | 0 (0.0%) | 15 (100.0%) |
| Computers, Engineering & Science | 5 (100.0%) | 0 (0.0%) |
| Computers & Mathematics | 0 (0.0%) | 0 (0.0%) |
| Architecture & Engineering | 5 (100.0%) | 0 (0.0%) |
| Life, Physical & Social Science | 0 (0.0%) | 0 (0.0%) |
| Community & Social Service | 0 (0.0%) | 0 (0.0%) |
| Education, Arts & Media | 0 (0.0%) | 0 (0.0%) |
| Legal Services & Support | 0 (0.0%) | 0 (0.0%) |
| Education Instruction & Library | 0 (0.0%) | 0 (0.0%) |
| Arts, Media & Entertainment | 0 (0.0%) | 0 (0.0%) |
| Health Diagnosing & Treating | 0 (0.0%) | 5 (100.0%) |
| Health Technologists | 0 (0.0%) | 5 (100.0%) |
| Total (Category) | 13 (39.4%) | 20 (60.6%) |
| Total (Overall) | 273 (49.6%) | 277 (50.4%) |
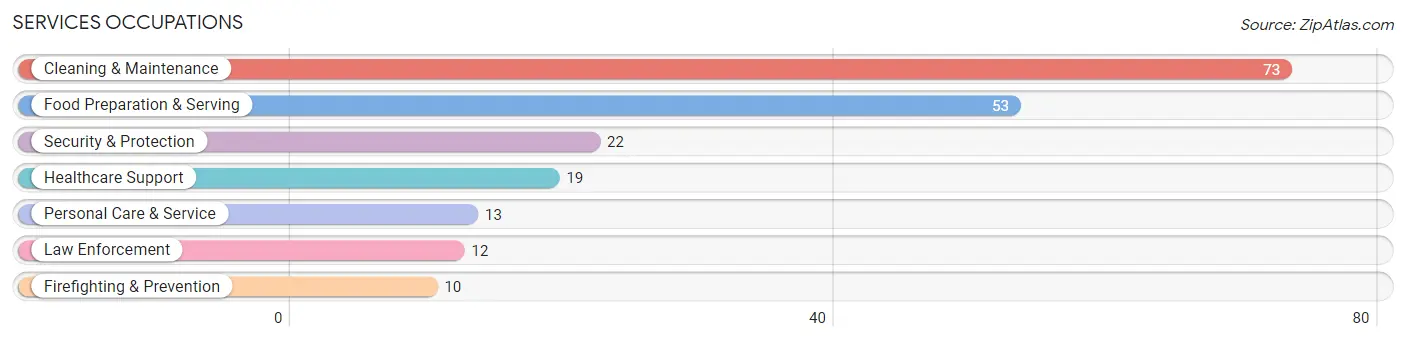
Services Occupations
The most common Services occupations in Earle are Cleaning & Maintenance (73 | 13.3%), Food Preparation & Serving (53 | 9.6%), Security & Protection (22 | 4.0%), Healthcare Support (19 | 3.5%), and Personal Care & Service (13 | 2.4%).
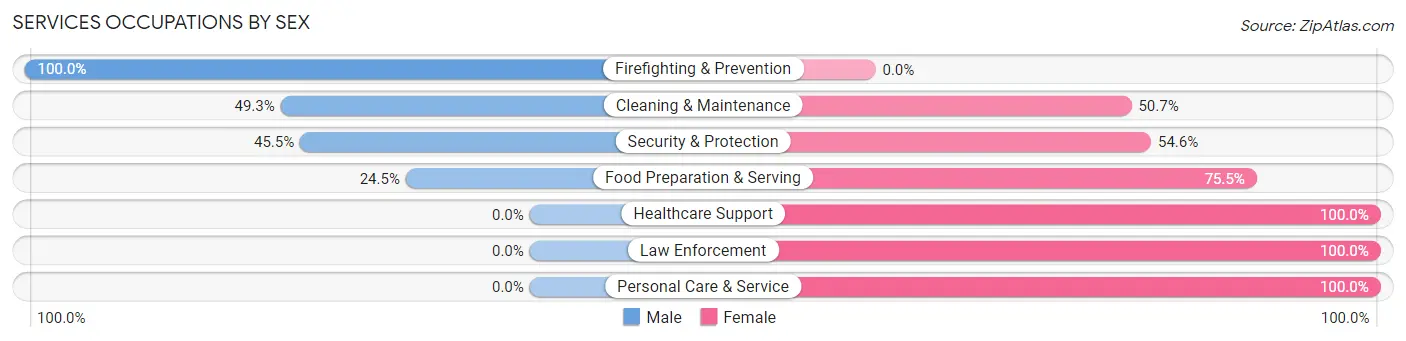
Services Occupations by Sex
Within the Services occupations in Earle, the most male-oriented occupations are Firefighting & Prevention (100.0%), Cleaning & Maintenance (49.3%), and Security & Protection (45.5%), while the most female-oriented occupations are Healthcare Support (100.0%), Law Enforcement (100.0%), and Personal Care & Service (100.0%).
| Occupation | Male | Female |
| Healthcare Support | 0 (0.0%) | 19 (100.0%) |
| Security & Protection | 10 (45.5%) | 12 (54.5%) |
| Firefighting & Prevention | 10 (100.0%) | 0 (0.0%) |
| Law Enforcement | 0 (0.0%) | 12 (100.0%) |
| Food Preparation & Serving | 13 (24.5%) | 40 (75.5%) |
| Cleaning & Maintenance | 36 (49.3%) | 37 (50.7%) |
| Personal Care & Service | 0 (0.0%) | 13 (100.0%) |
| Total (Category) | 59 (32.8%) | 121 (67.2%) |
| Total (Overall) | 273 (49.6%) | 277 (50.4%) |
Sales and Office Occupations
The most common Sales and Office occupations in Earle are Sales & Related (27 | 4.9%), and Office & Administration (25 | 4.5%).

Sales and Office Occupations by Sex

| Occupation | Male | Female |
| Sales & Related | 0 (0.0%) | 27 (100.0%) |
| Office & Administration | 11 (44.0%) | 14 (56.0%) |
| Total (Category) | 11 (21.1%) | 41 (78.8%) |
| Total (Overall) | 273 (49.6%) | 277 (50.4%) |
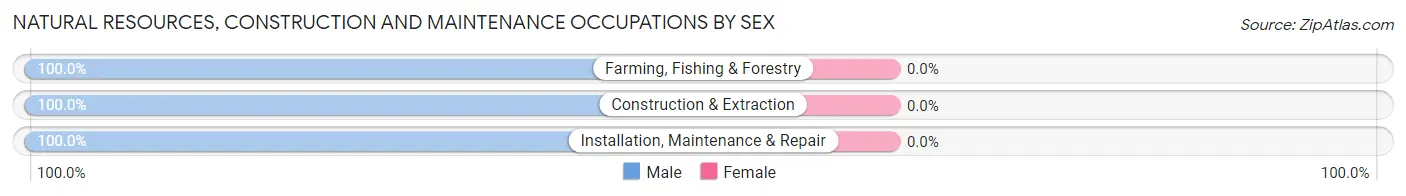
Natural Resources, Construction and Maintenance Occupations
The most common Natural Resources, Construction and Maintenance occupations in Earle are Installation, Maintenance & Repair (27 | 4.9%), Farming, Fishing & Forestry (6 | 1.1%), and Construction & Extraction (4 | 0.7%).

Natural Resources, Construction and Maintenance Occupations by Sex
| Occupation | Male | Female |
| Farming, Fishing & Forestry | 6 (100.0%) | 0 (0.0%) |
| Construction & Extraction | 4 (100.0%) | 0 (0.0%) |
| Installation, Maintenance & Repair | 27 (100.0%) | 0 (0.0%) |
| Total (Category) | 37 (100.0%) | 0 (0.0%) |
| Total (Overall) | 273 (49.6%) | 277 (50.4%) |
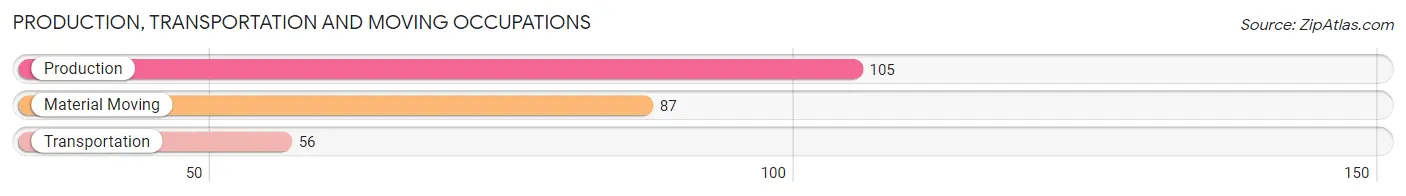
Production, Transportation and Moving Occupations
The most common Production, Transportation and Moving occupations in Earle are Production (105 | 19.1%), Material Moving (87 | 15.8%), and Transportation (56 | 10.2%).
Production, Transportation and Moving Occupations by Sex
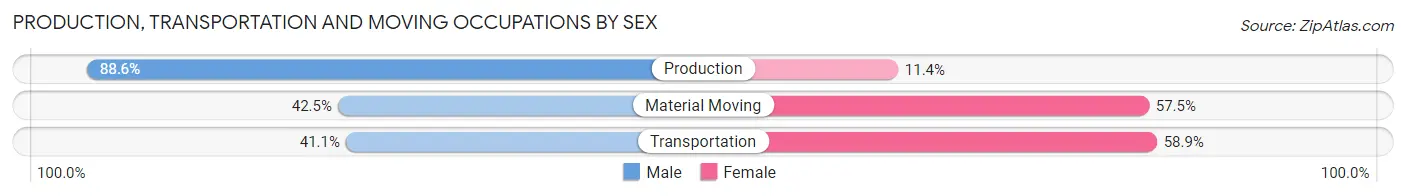
| Occupation | Male | Female |
| Production | 93 (88.6%) | 12 (11.4%) |
| Transportation | 23 (41.1%) | 33 (58.9%) |
| Material Moving | 37 (42.5%) | 50 (57.5%) |
| Total (Category) | 153 (61.7%) | 95 (38.3%) |
| Total (Overall) | 273 (49.6%) | 277 (50.4%) |
Employment Industries by Sex in Earle
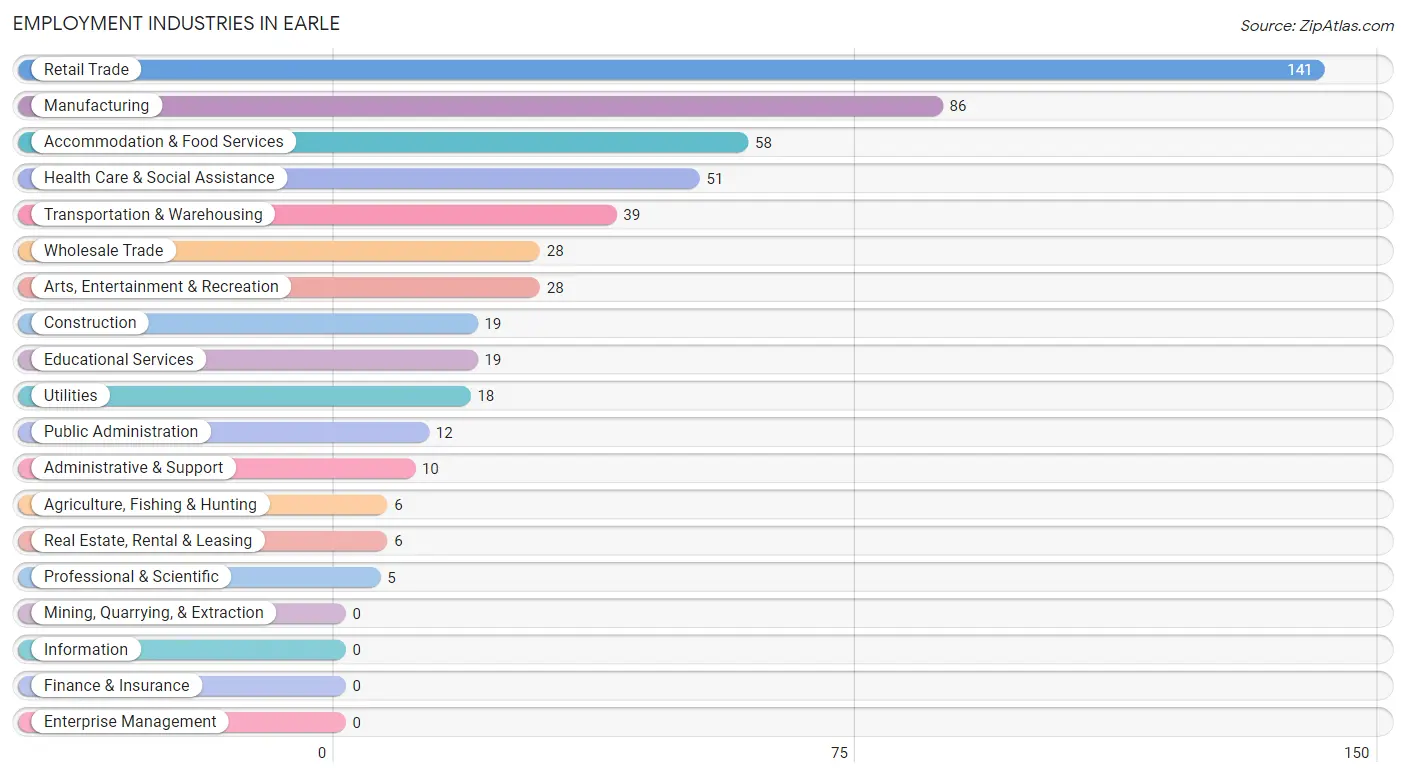
Employment Industries in Earle
The major employment industries in Earle include Retail Trade (141 | 25.6%), Manufacturing (86 | 15.6%), Accommodation & Food Services (58 | 10.5%), Health Care & Social Assistance (51 | 9.3%), and Transportation & Warehousing (39 | 7.1%).
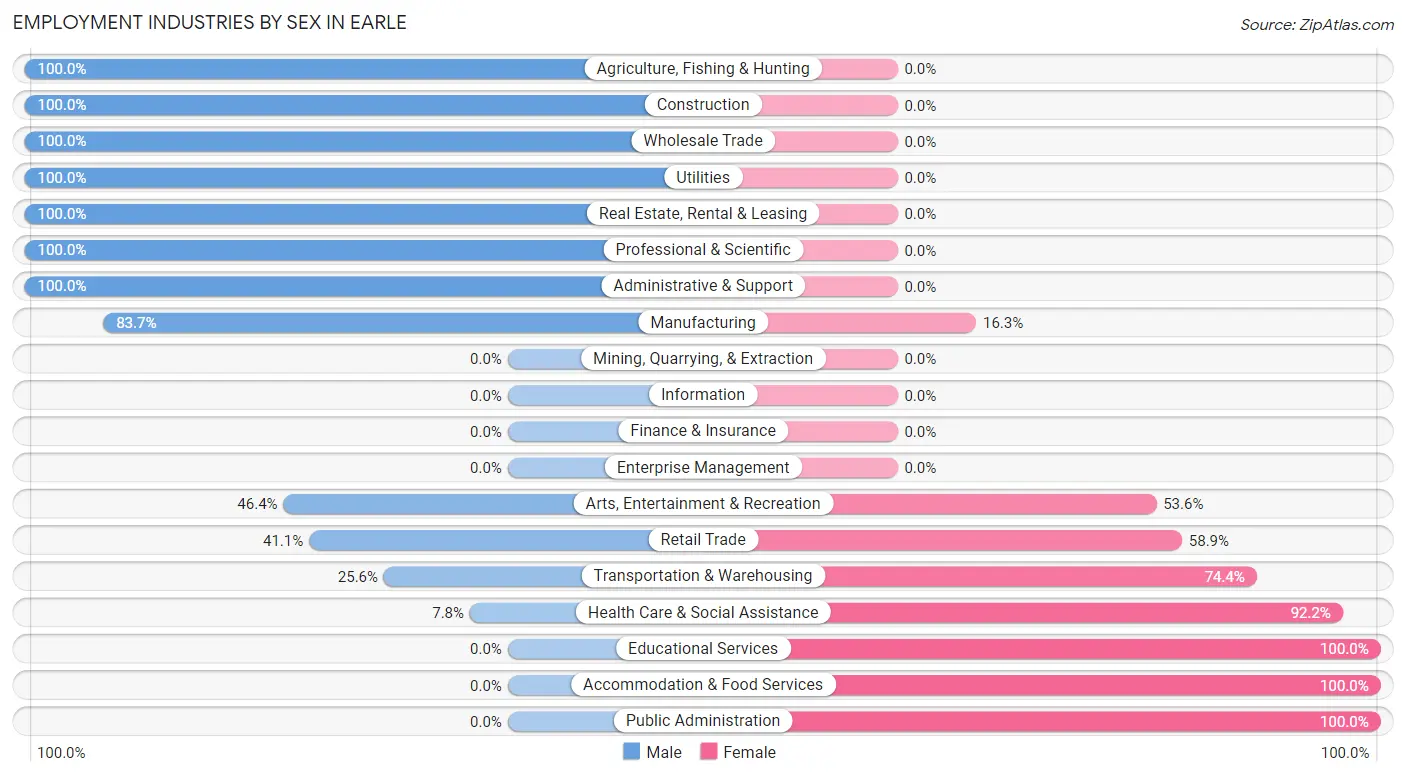
Employment Industries by Sex in Earle
The Earle industries that see more men than women are Agriculture, Fishing & Hunting (100.0%), Construction (100.0%), and Wholesale Trade (100.0%), whereas the industries that tend to have a higher number of women are Educational Services (100.0%), Accommodation & Food Services (100.0%), and Public Administration (100.0%).
| Industry | Male | Female |
| Agriculture, Fishing & Hunting | 6 (100.0%) | 0 (0.0%) |
| Mining, Quarrying, & Extraction | 0 (0.0%) | 0 (0.0%) |
| Construction | 19 (100.0%) | 0 (0.0%) |
| Manufacturing | 72 (83.7%) | 14 (16.3%) |
| Wholesale Trade | 28 (100.0%) | 0 (0.0%) |
| Retail Trade | 58 (41.1%) | 83 (58.9%) |
| Transportation & Warehousing | 10 (25.6%) | 29 (74.4%) |
| Utilities | 18 (100.0%) | 0 (0.0%) |
| Information | 0 (0.0%) | 0 (0.0%) |
| Finance & Insurance | 0 (0.0%) | 0 (0.0%) |
| Real Estate, Rental & Leasing | 6 (100.0%) | 0 (0.0%) |
| Professional & Scientific | 5 (100.0%) | 0 (0.0%) |
| Enterprise Management | 0 (0.0%) | 0 (0.0%) |
| Administrative & Support | 10 (100.0%) | 0 (0.0%) |
| Educational Services | 0 (0.0%) | 19 (100.0%) |
| Health Care & Social Assistance | 4 (7.8%) | 47 (92.2%) |
| Arts, Entertainment & Recreation | 13 (46.4%) | 15 (53.6%) |
| Accommodation & Food Services | 0 (0.0%) | 58 (100.0%) |
| Public Administration | 0 (0.0%) | 12 (100.0%) |
| Total | 273 (49.6%) | 277 (50.4%) |
Education in Earle
School Enrollment in Earle
The most common levels of schooling among the 400 students in Earle are high school (151 | 37.8%), middle school (89 | 22.3%), and elementary school (80 | 20.0%).
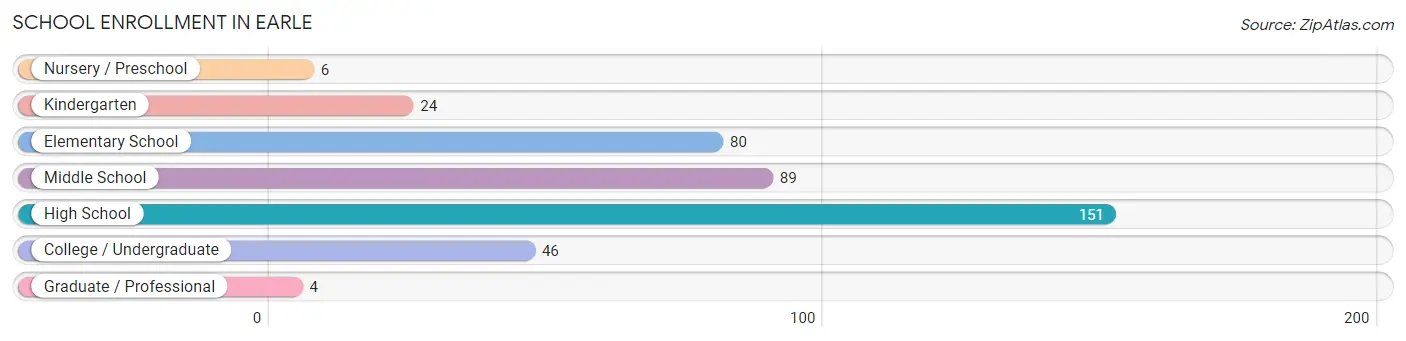
| School Level | # Students | % Students |
| Nursery / Preschool | 6 | 1.5% |
| Kindergarten | 24 | 6.0% |
| Elementary School | 80 | 20.0% |
| Middle School | 89 | 22.3% |
| High School | 151 | 37.8% |
| College / Undergraduate | 46 | 11.5% |
| Graduate / Professional | 4 | 1.0% |
| Total | 400 | 100.0% |
School Enrollment by Age by Funding Source in Earle
Out of a total of 400 students who are enrolled in schools in Earle, 46 (11.5%) attend a private institution, while the remaining 354 (88.5%) are enrolled in public schools. The age group of 20 to 24 year olds has the highest likelihood of being enrolled in private schools, with 29 (100.0% in the age bracket) enrolled. Conversely, the age group of 3 to 4 year olds has the lowest likelihood of being enrolled in a private school, with 6 (100.0% in the age bracket) attending a public institution.
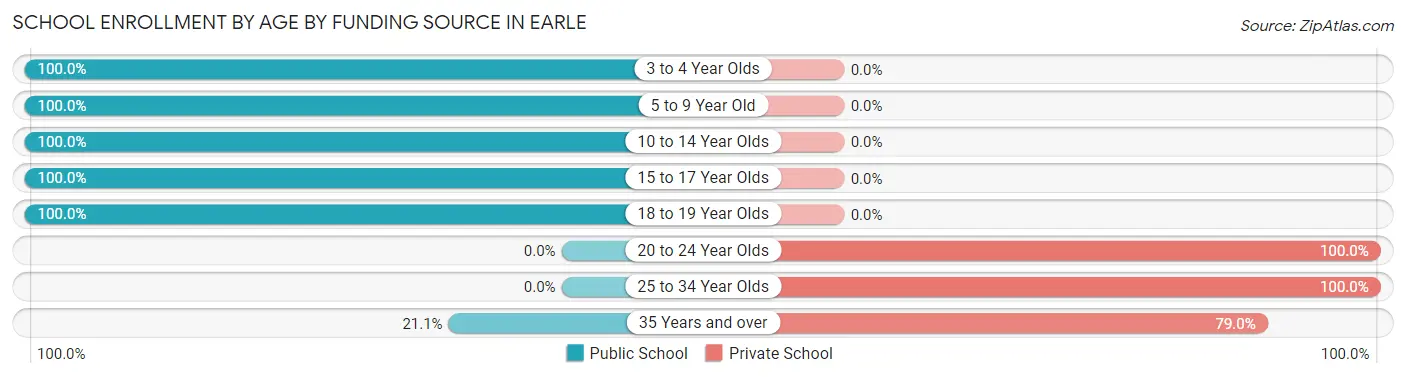
| Age Bracket | Public School | Private School |
| 3 to 4 Year Olds | 6 (100.0%) | 0 (0.0%) |
| 5 to 9 Year Old | 97 (100.0%) | 0 (0.0%) |
| 10 to 14 Year Olds | 96 (100.0%) | 0 (0.0%) |
| 15 to 17 Year Olds | 117 (100.0%) | 0 (0.0%) |
| 18 to 19 Year Olds | 34 (100.0%) | 0 (0.0%) |
| 20 to 24 Year Olds | 0 (0.0%) | 29 (100.0%) |
| 25 to 34 Year Olds | 0 (0.0%) | 2 (100.0%) |
| 35 Years and over | 4 (21.0%) | 15 (78.9%) |
| Total | 354 (88.5%) | 46 (11.5%) |
Educational Attainment by Field of Study in Earle
Communications (65 | 52.8%), arts & humanities (24 | 19.5%), business (17 | 13.8%), social sciences (12 | 9.8%), and science & technology (5 | 4.1%) are the most common fields of study among 123 individuals in Earle who have obtained a bachelor's degree or higher.
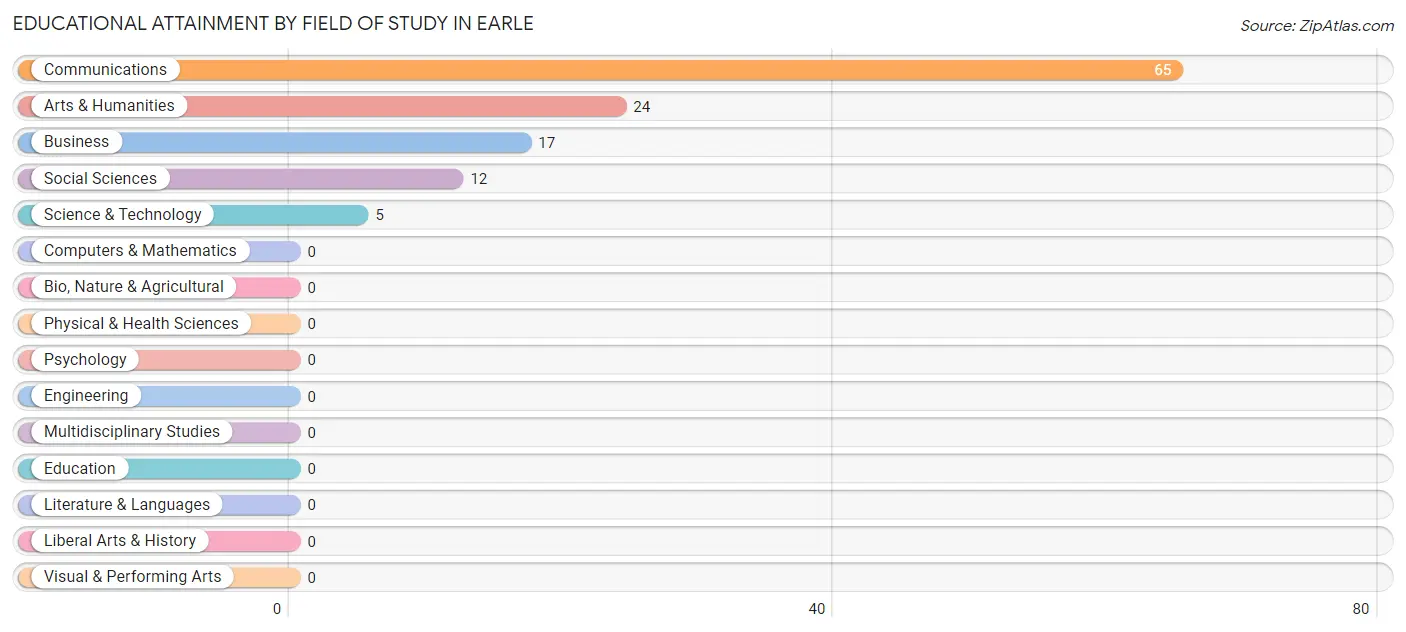
| Field of Study | # Graduates | % Graduates |
| Computers & Mathematics | 0 | 0.0% |
| Bio, Nature & Agricultural | 0 | 0.0% |
| Physical & Health Sciences | 0 | 0.0% |
| Psychology | 0 | 0.0% |
| Social Sciences | 12 | 9.8% |
| Engineering | 0 | 0.0% |
| Multidisciplinary Studies | 0 | 0.0% |
| Science & Technology | 5 | 4.1% |
| Business | 17 | 13.8% |
| Education | 0 | 0.0% |
| Literature & Languages | 0 | 0.0% |
| Liberal Arts & History | 0 | 0.0% |
| Visual & Performing Arts | 0 | 0.0% |
| Communications | 65 | 52.8% |
| Arts & Humanities | 24 | 19.5% |
| Total | 123 | 100.0% |
Transportation & Commute in Earle
Vehicle Availability by Sex in Earle
The most prevalent vehicle ownership categories in Earle are males with 2 vehicles (130, accounting for 49.2%) and females with 2 vehicles (146, making up 46.9%).
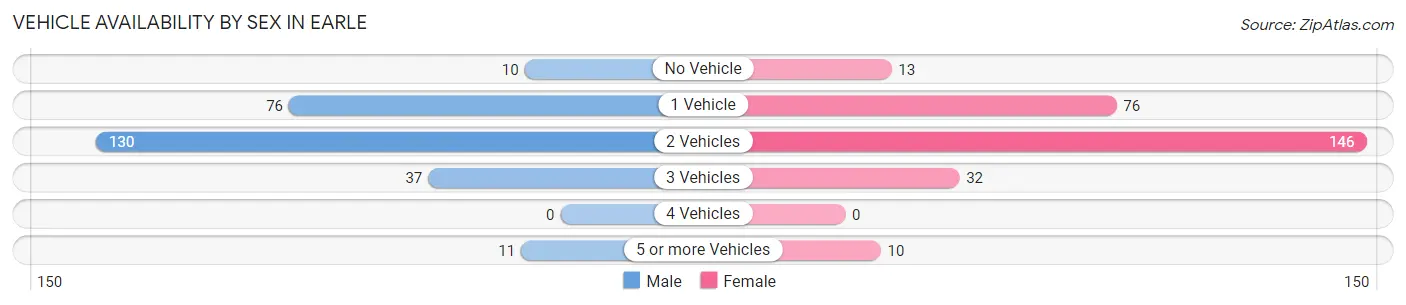
| Vehicles Available | Male | Female |
| No Vehicle | 10 (3.8%) | 13 (4.7%) |
| 1 Vehicle | 76 (28.8%) | 76 (27.4%) |
| 2 Vehicles | 130 (49.2%) | 146 (52.7%) |
| 3 Vehicles | 37 (14.0%) | 32 (11.6%) |
| 4 Vehicles | 0 (0.0%) | 0 (0.0%) |
| 5 or more Vehicles | 11 (4.2%) | 10 (3.6%) |
| Total | 264 (100.0%) | 277 (100.0%) |
Commute Time in Earle
The most frequently occuring commute durations in Earle are 10 to 14 minutes (105 commuters, 19.3%), 15 to 19 minutes (74 commuters, 13.6%), and 30 to 34 minutes (69 commuters, 12.7%).
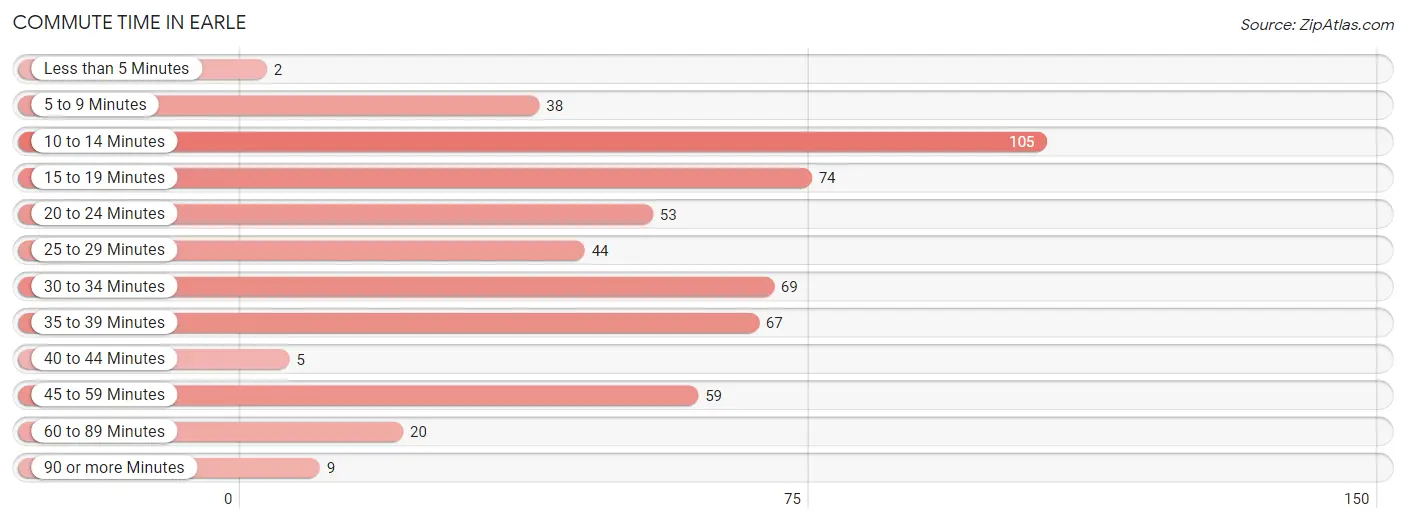
| Commute Time | # Commuters | % Commuters |
| Less than 5 Minutes | 2 | 0.4% |
| 5 to 9 Minutes | 38 | 7.0% |
| 10 to 14 Minutes | 105 | 19.3% |
| 15 to 19 Minutes | 74 | 13.6% |
| 20 to 24 Minutes | 53 | 9.7% |
| 25 to 29 Minutes | 44 | 8.1% |
| 30 to 34 Minutes | 69 | 12.7% |
| 35 to 39 Minutes | 67 | 12.3% |
| 40 to 44 Minutes | 5 | 0.9% |
| 45 to 59 Minutes | 59 | 10.8% |
| 60 to 89 Minutes | 20 | 3.7% |
| 90 or more Minutes | 9 | 1.7% |
Commute Time by Sex in Earle
The most common commute times in Earle are 10 to 14 minutes (62 commuters, 23.1%) for males and 20 to 24 minutes (50 commuters, 18.0%) for females.
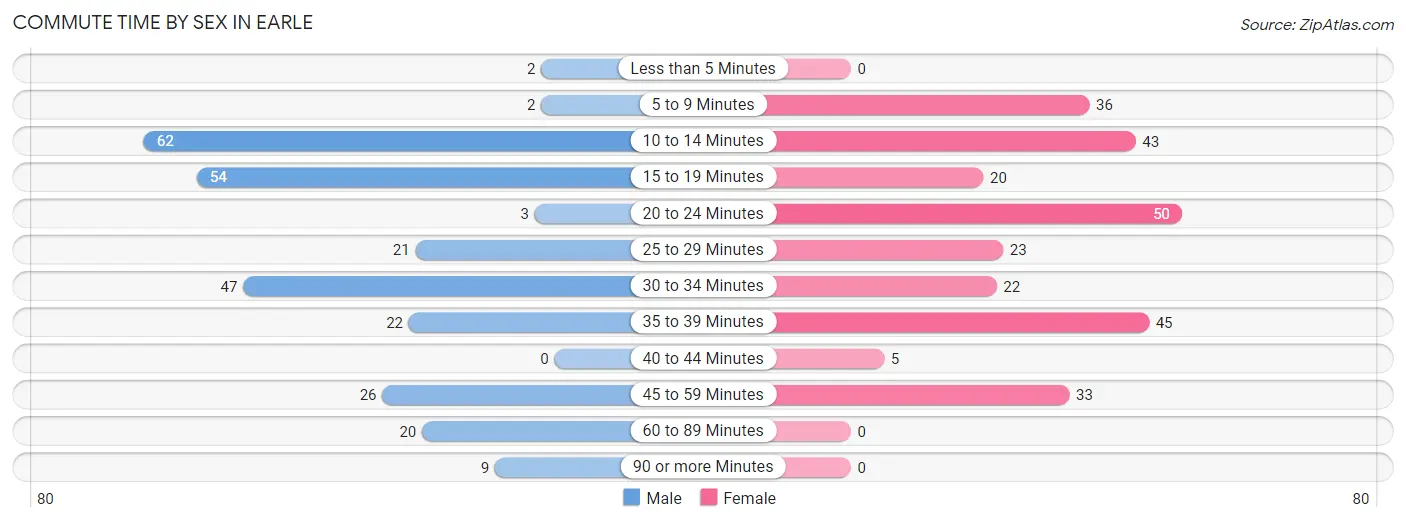
| Commute Time | Male | Female |
| Less than 5 Minutes | 2 (0.7%) | 0 (0.0%) |
| 5 to 9 Minutes | 2 (0.7%) | 36 (13.0%) |
| 10 to 14 Minutes | 62 (23.1%) | 43 (15.5%) |
| 15 to 19 Minutes | 54 (20.2%) | 20 (7.2%) |
| 20 to 24 Minutes | 3 (1.1%) | 50 (18.0%) |
| 25 to 29 Minutes | 21 (7.8%) | 23 (8.3%) |
| 30 to 34 Minutes | 47 (17.5%) | 22 (7.9%) |
| 35 to 39 Minutes | 22 (8.2%) | 45 (16.3%) |
| 40 to 44 Minutes | 0 (0.0%) | 5 (1.8%) |
| 45 to 59 Minutes | 26 (9.7%) | 33 (11.9%) |
| 60 to 89 Minutes | 20 (7.5%) | 0 (0.0%) |
| 90 or more Minutes | 9 (3.4%) | 0 (0.0%) |
Time of Departure to Work by Sex in Earle
The most frequent times of departure to work in Earle are 4:00 PM to 11:59 PM (56, 20.9%) for males and 7:00 AM to 7:29 AM (74, 26.7%) for females.
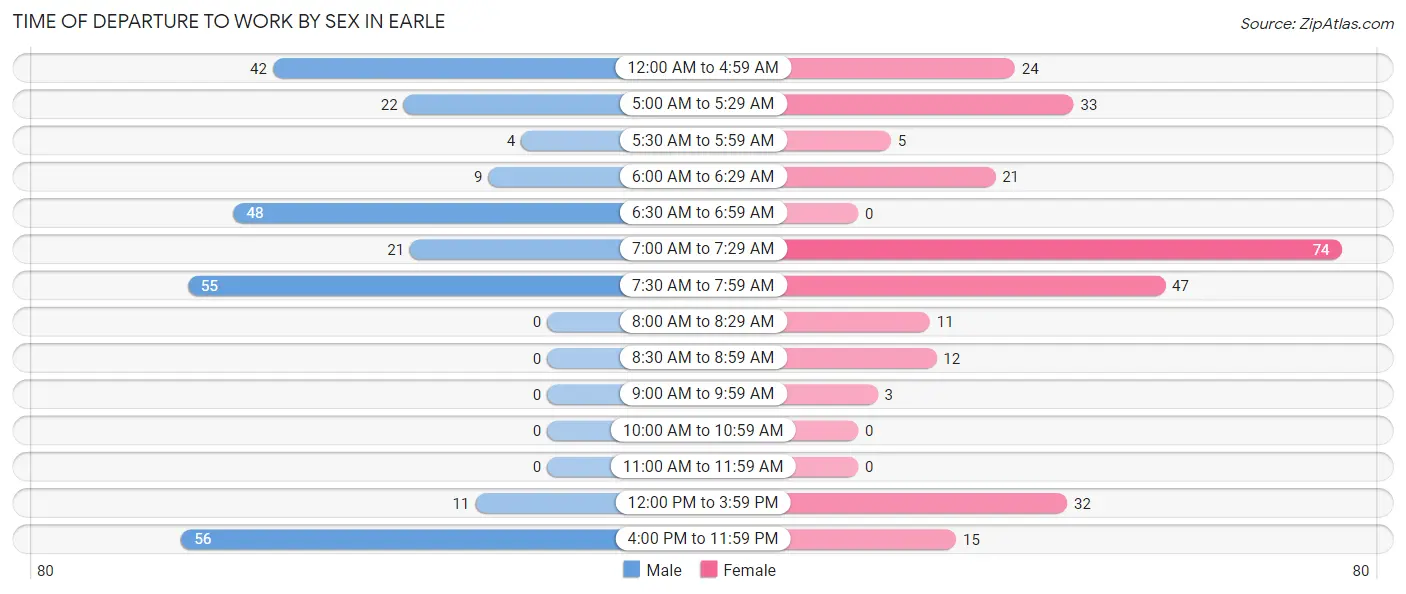
| Time of Departure | Male | Female |
| 12:00 AM to 4:59 AM | 42 (15.7%) | 24 (8.7%) |
| 5:00 AM to 5:29 AM | 22 (8.2%) | 33 (11.9%) |
| 5:30 AM to 5:59 AM | 4 (1.5%) | 5 (1.8%) |
| 6:00 AM to 6:29 AM | 9 (3.4%) | 21 (7.6%) |
| 6:30 AM to 6:59 AM | 48 (17.9%) | 0 (0.0%) |
| 7:00 AM to 7:29 AM | 21 (7.8%) | 74 (26.7%) |
| 7:30 AM to 7:59 AM | 55 (20.5%) | 47 (17.0%) |
| 8:00 AM to 8:29 AM | 0 (0.0%) | 11 (4.0%) |
| 8:30 AM to 8:59 AM | 0 (0.0%) | 12 (4.3%) |
| 9:00 AM to 9:59 AM | 0 (0.0%) | 3 (1.1%) |
| 10:00 AM to 10:59 AM | 0 (0.0%) | 0 (0.0%) |
| 11:00 AM to 11:59 AM | 0 (0.0%) | 0 (0.0%) |
| 12:00 PM to 3:59 PM | 11 (4.1%) | 32 (11.6%) |
| 4:00 PM to 11:59 PM | 56 (20.9%) | 15 (5.4%) |
| Total | 268 (100.0%) | 277 (100.0%) |
Housing Occupancy in Earle
Occupancy by Ownership in Earle
Of the total 617 dwellings in Earle, owner-occupied units account for 261 (42.3%), while renter-occupied units make up 356 (57.7%).
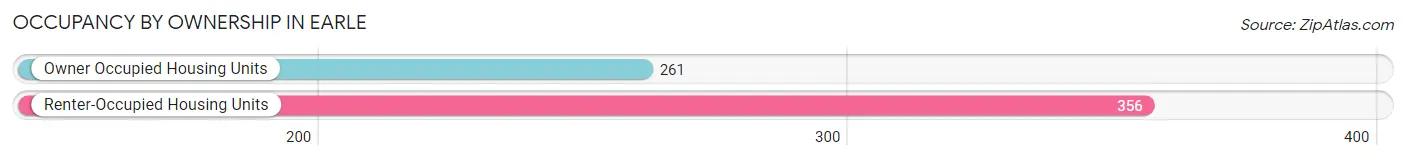
| Occupancy | # Housing Units | % Housing Units |
| Owner Occupied Housing Units | 261 | 42.3% |
| Renter-Occupied Housing Units | 356 | 57.7% |
| Total Occupied Housing Units | 617 | 100.0% |
Occupancy by Household Size in Earle
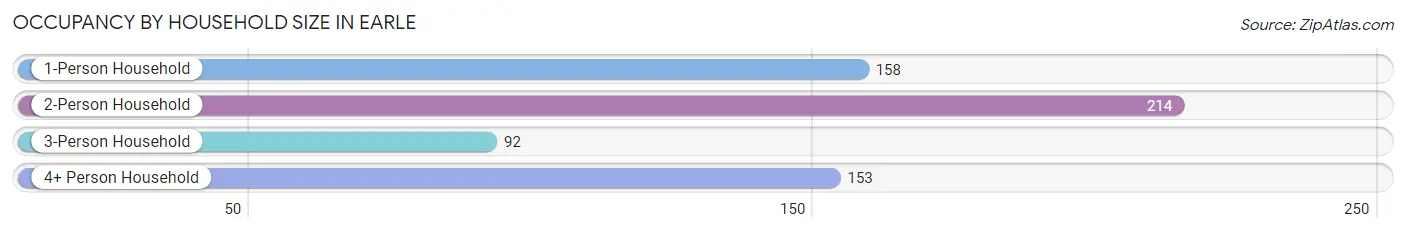
| Household Size | # Housing Units | % Housing Units |
| 1-Person Household | 158 | 25.6% |
| 2-Person Household | 214 | 34.7% |
| 3-Person Household | 92 | 14.9% |
| 4+ Person Household | 153 | 24.8% |
| Total Housing Units | 617 | 100.0% |
Occupancy by Ownership by Household Size in Earle
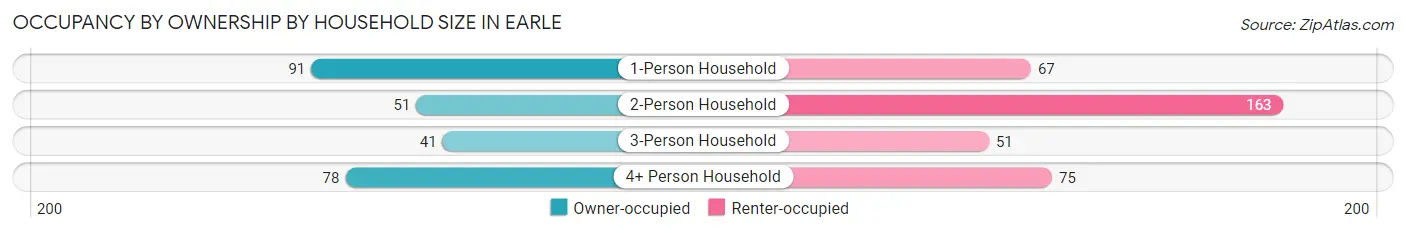
| Household Size | Owner-occupied | Renter-occupied |
| 1-Person Household | 91 (57.6%) | 67 (42.4%) |
| 2-Person Household | 51 (23.8%) | 163 (76.2%) |
| 3-Person Household | 41 (44.6%) | 51 (55.4%) |
| 4+ Person Household | 78 (51.0%) | 75 (49.0%) |
| Total Housing Units | 261 (42.3%) | 356 (57.7%) |
Occupancy by Educational Attainment in Earle
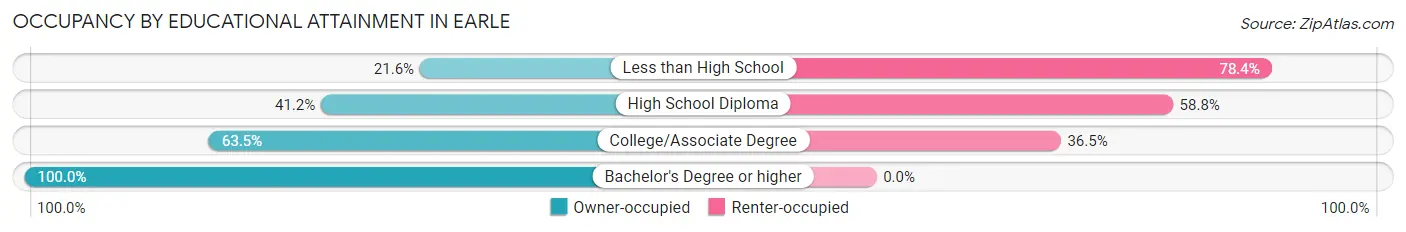
| Household Size | Owner-occupied | Renter-occupied |
| Less than High School | 48 (21.6%) | 174 (78.4%) |
| High School Diploma | 101 (41.2%) | 144 (58.8%) |
| College/Associate Degree | 66 (63.5%) | 38 (36.5%) |
| Bachelor's Degree or higher | 46 (100.0%) | 0 (0.0%) |
Occupancy by Age of Householder in Earle
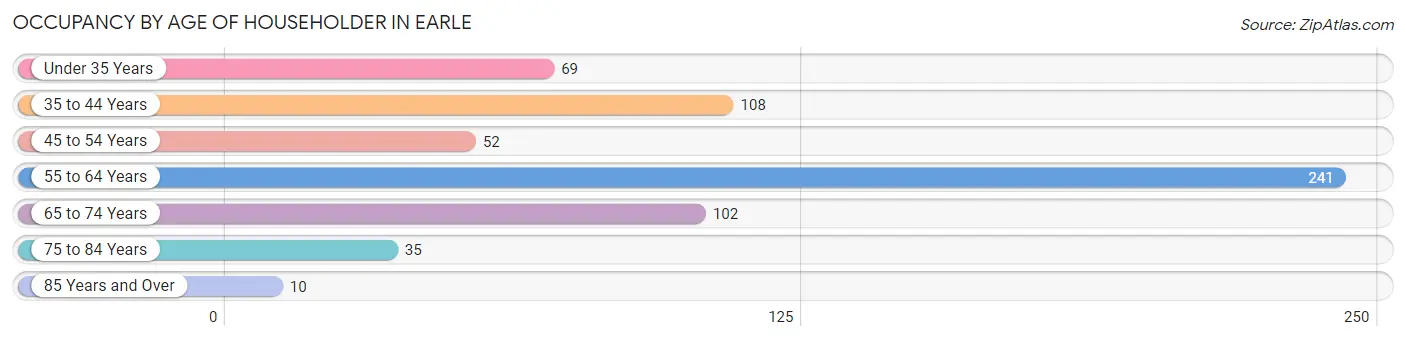
| Age Bracket | # Households | % Households |
| Under 35 Years | 69 | 11.2% |
| 35 to 44 Years | 108 | 17.5% |
| 45 to 54 Years | 52 | 8.4% |
| 55 to 64 Years | 241 | 39.1% |
| 65 to 74 Years | 102 | 16.5% |
| 75 to 84 Years | 35 | 5.7% |
| 85 Years and Over | 10 | 1.6% |
| Total | 617 | 100.0% |
Housing Finances in Earle
Median Income by Occupancy in Earle
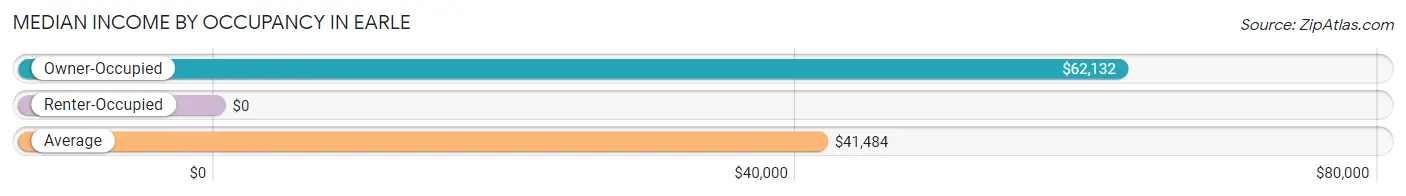
| Occupancy Type | # Households | Median Income |
| Owner-Occupied | 261 (42.3%) | $62,132 |
| Renter-Occupied | 356 (57.7%) | $0 |
| Average | 617 (100.0%) | $41,484 |
Occupancy by Householder Income Bracket in Earle
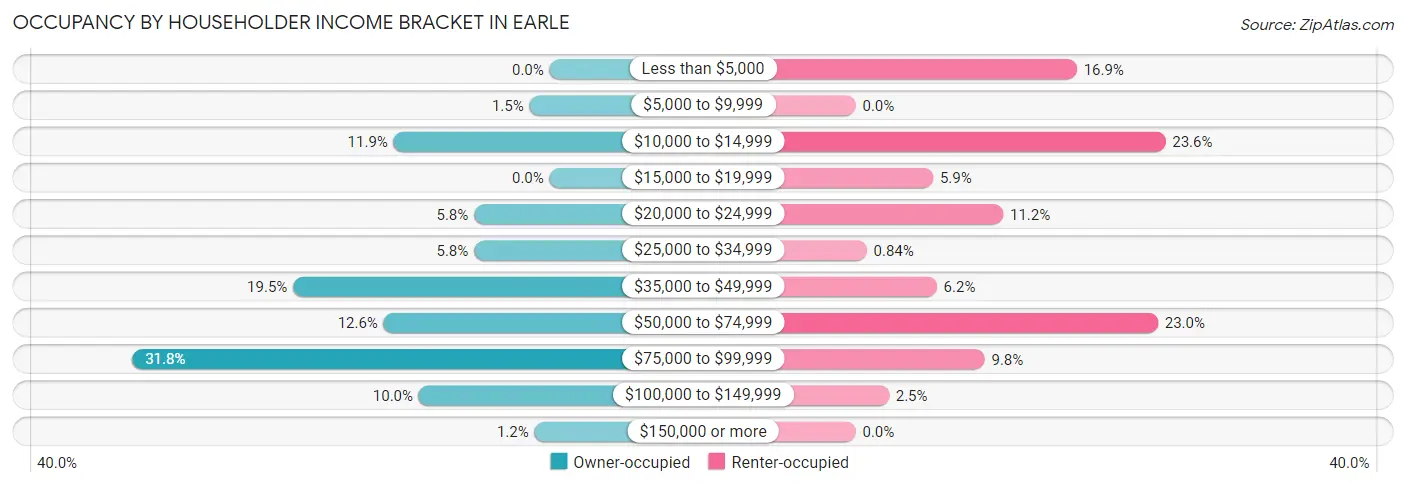
| Income Bracket | Owner-occupied | Renter-occupied |
| Less than $5,000 | 0 (0.0%) | 60 (16.9%) |
| $5,000 to $9,999 | 4 (1.5%) | 0 (0.0%) |
| $10,000 to $14,999 | 31 (11.9%) | 84 (23.6%) |
| $15,000 to $19,999 | 0 (0.0%) | 21 (5.9%) |
| $20,000 to $24,999 | 15 (5.8%) | 40 (11.2%) |
| $25,000 to $34,999 | 15 (5.8%) | 3 (0.8%) |
| $35,000 to $49,999 | 51 (19.5%) | 22 (6.2%) |
| $50,000 to $74,999 | 33 (12.6%) | 82 (23.0%) |
| $75,000 to $99,999 | 83 (31.8%) | 35 (9.8%) |
| $100,000 to $149,999 | 26 (10.0%) | 9 (2.5%) |
| $150,000 or more | 3 (1.1%) | 0 (0.0%) |
| Total | 261 (100.0%) | 356 (100.0%) |
Monthly Housing Cost Tiers in Earle
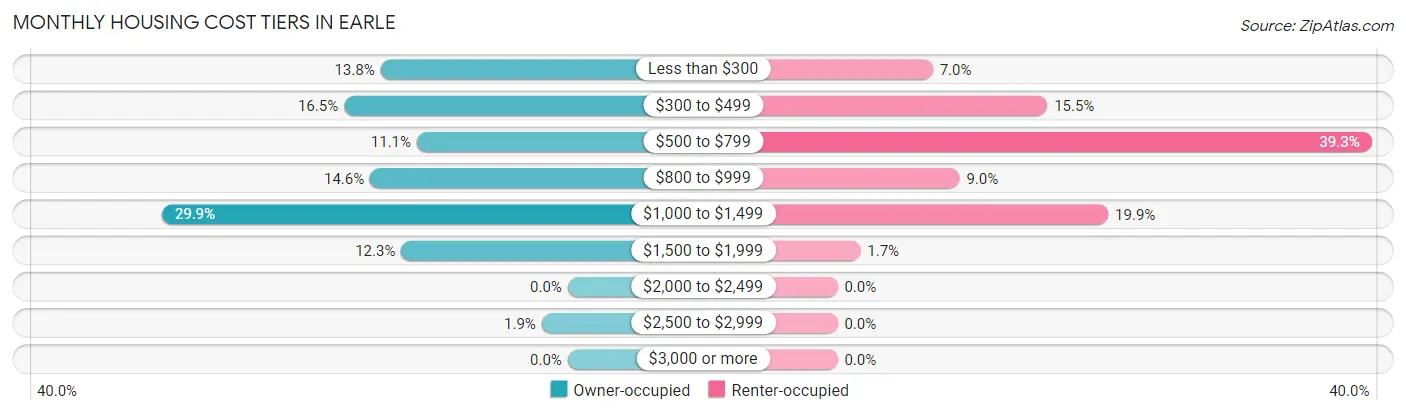
| Monthly Cost | Owner-occupied | Renter-occupied |
| Less than $300 | 36 (13.8%) | 25 (7.0%) |
| $300 to $499 | 43 (16.5%) | 55 (15.4%) |
| $500 to $799 | 29 (11.1%) | 140 (39.3%) |
| $800 to $999 | 38 (14.6%) | 32 (9.0%) |
| $1,000 to $1,499 | 78 (29.9%) | 71 (19.9%) |
| $1,500 to $1,999 | 32 (12.3%) | 6 (1.7%) |
| $2,000 to $2,499 | 0 (0.0%) | 0 (0.0%) |
| $2,500 to $2,999 | 5 (1.9%) | 0 (0.0%) |
| $3,000 or more | 0 (0.0%) | 0 (0.0%) |
| Total | 261 (100.0%) | 356 (100.0%) |
Physical Housing Characteristics in Earle
Housing Structures in Earle
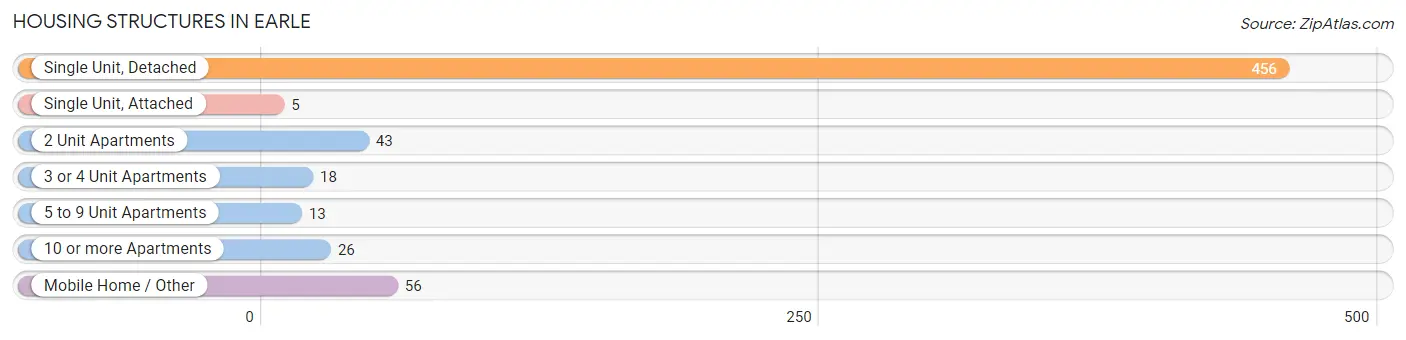
| Structure Type | # Housing Units | % Housing Units |
| Single Unit, Detached | 456 | 73.9% |
| Single Unit, Attached | 5 | 0.8% |
| 2 Unit Apartments | 43 | 7.0% |
| 3 or 4 Unit Apartments | 18 | 2.9% |
| 5 to 9 Unit Apartments | 13 | 2.1% |
| 10 or more Apartments | 26 | 4.2% |
| Mobile Home / Other | 56 | 9.1% |
| Total | 617 | 100.0% |
Housing Structures by Occupancy in Earle
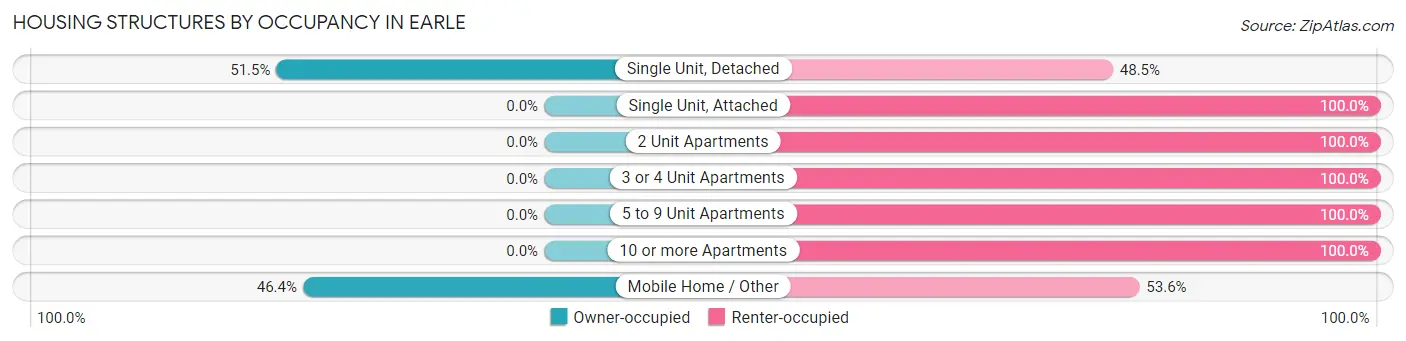
| Structure Type | Owner-occupied | Renter-occupied |
| Single Unit, Detached | 235 (51.5%) | 221 (48.5%) |
| Single Unit, Attached | 0 (0.0%) | 5 (100.0%) |
| 2 Unit Apartments | 0 (0.0%) | 43 (100.0%) |
| 3 or 4 Unit Apartments | 0 (0.0%) | 18 (100.0%) |
| 5 to 9 Unit Apartments | 0 (0.0%) | 13 (100.0%) |
| 10 or more Apartments | 0 (0.0%) | 26 (100.0%) |
| Mobile Home / Other | 26 (46.4%) | 30 (53.6%) |
| Total | 261 (42.3%) | 356 (57.7%) |
Housing Structures by Number of Rooms in Earle
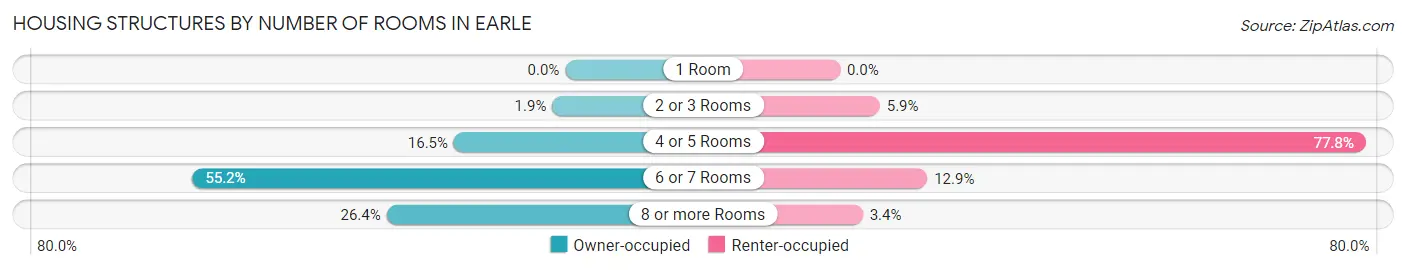
| Number of Rooms | Owner-occupied | Renter-occupied |
| 1 Room | 0 (0.0%) | 0 (0.0%) |
| 2 or 3 Rooms | 5 (1.9%) | 21 (5.9%) |
| 4 or 5 Rooms | 43 (16.5%) | 277 (77.8%) |
| 6 or 7 Rooms | 144 (55.2%) | 46 (12.9%) |
| 8 or more Rooms | 69 (26.4%) | 12 (3.4%) |
| Total | 261 (100.0%) | 356 (100.0%) |
Housing Structure by Heating Type in Earle
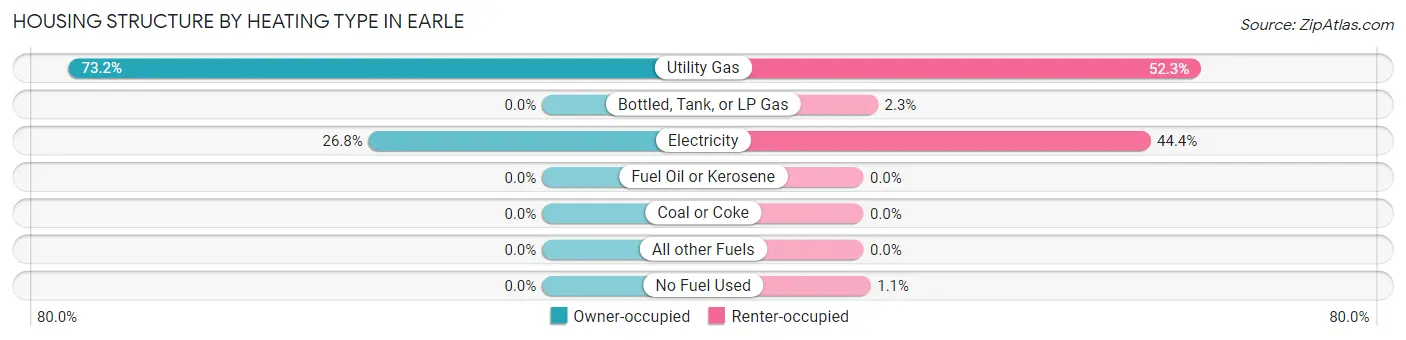
| Heating Type | Owner-occupied | Renter-occupied |
| Utility Gas | 191 (73.2%) | 186 (52.2%) |
| Bottled, Tank, or LP Gas | 0 (0.0%) | 8 (2.2%) |
| Electricity | 70 (26.8%) | 158 (44.4%) |
| Fuel Oil or Kerosene | 0 (0.0%) | 0 (0.0%) |
| Coal or Coke | 0 (0.0%) | 0 (0.0%) |
| All other Fuels | 0 (0.0%) | 0 (0.0%) |
| No Fuel Used | 0 (0.0%) | 4 (1.1%) |
| Total | 261 (100.0%) | 356 (100.0%) |
Household Vehicle Usage in Earle
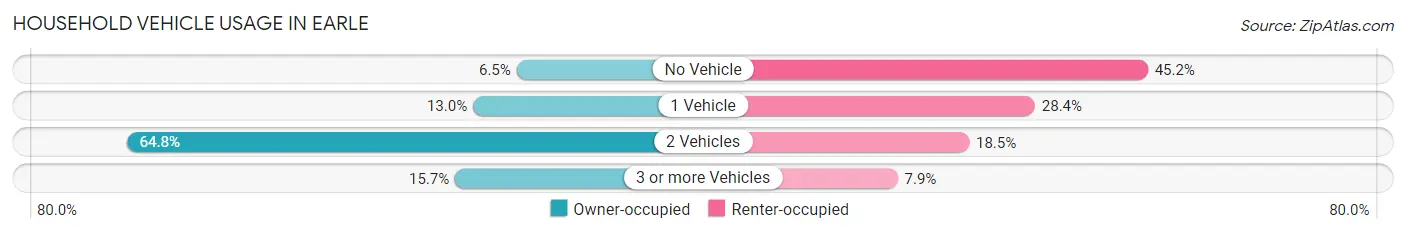
| Vehicles per Household | Owner-occupied | Renter-occupied |
| No Vehicle | 17 (6.5%) | 161 (45.2%) |
| 1 Vehicle | 34 (13.0%) | 101 (28.4%) |
| 2 Vehicles | 169 (64.7%) | 66 (18.5%) |
| 3 or more Vehicles | 41 (15.7%) | 28 (7.9%) |
| Total | 261 (100.0%) | 356 (100.0%) |
Real Estate & Mortgages in Earle
Real Estate and Mortgage Overview in Earle
| Characteristic | Without Mortgage | With Mortgage |
| Housing Units | 120 | 141 |
| Median Property Value | $75,600 | $90,300 |
| Median Household Income | - | - |
| Monthly Housing Costs | $429 | $0 |
| Real Estate Taxes | $370 | $13 |
Property Value by Mortgage Status in Earle
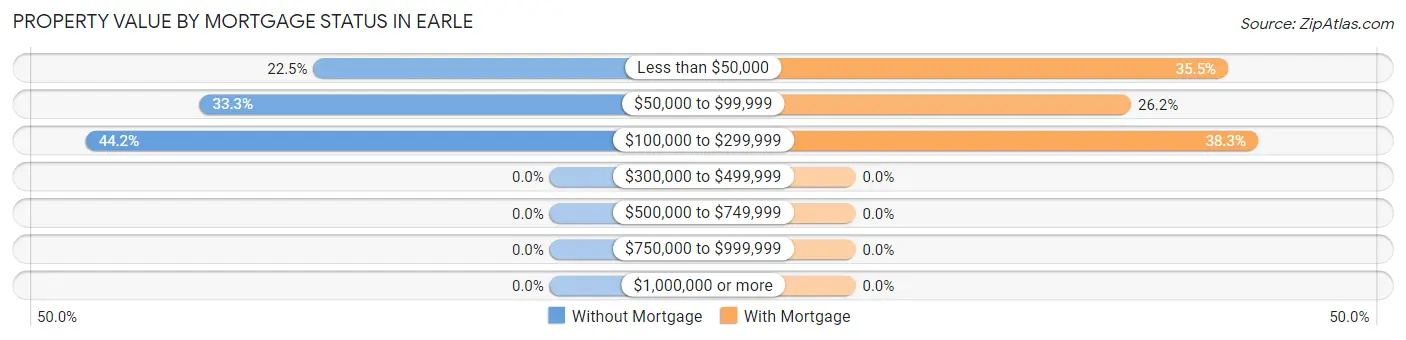
| Property Value | Without Mortgage | With Mortgage |
| Less than $50,000 | 27 (22.5%) | 50 (35.5%) |
| $50,000 to $99,999 | 40 (33.3%) | 37 (26.2%) |
| $100,000 to $299,999 | 53 (44.2%) | 54 (38.3%) |
| $300,000 to $499,999 | 0 (0.0%) | 0 (0.0%) |
| $500,000 to $749,999 | 0 (0.0%) | 0 (0.0%) |
| $750,000 to $999,999 | 0 (0.0%) | 0 (0.0%) |
| $1,000,000 or more | 0 (0.0%) | 0 (0.0%) |
| Total | 120 (100.0%) | 141 (100.0%) |
Household Income by Mortgage Status in Earle
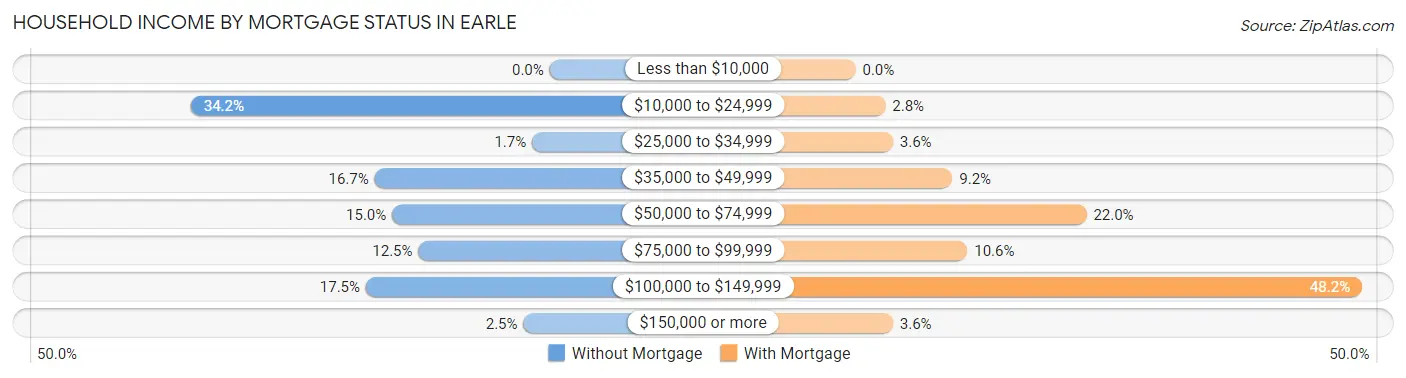
| Household Income | Without Mortgage | With Mortgage |
| Less than $10,000 | 0 (0.0%) | 0 (0.0%) |
| $10,000 to $24,999 | 41 (34.2%) | 4 (2.8%) |
| $25,000 to $34,999 | 2 (1.7%) | 5 (3.5%) |
| $35,000 to $49,999 | 20 (16.7%) | 13 (9.2%) |
| $50,000 to $74,999 | 18 (15.0%) | 31 (22.0%) |
| $75,000 to $99,999 | 15 (12.5%) | 15 (10.6%) |
| $100,000 to $149,999 | 21 (17.5%) | 68 (48.2%) |
| $150,000 or more | 3 (2.5%) | 5 (3.5%) |
| Total | 120 (100.0%) | 141 (100.0%) |
Property Value to Household Income Ratio in Earle
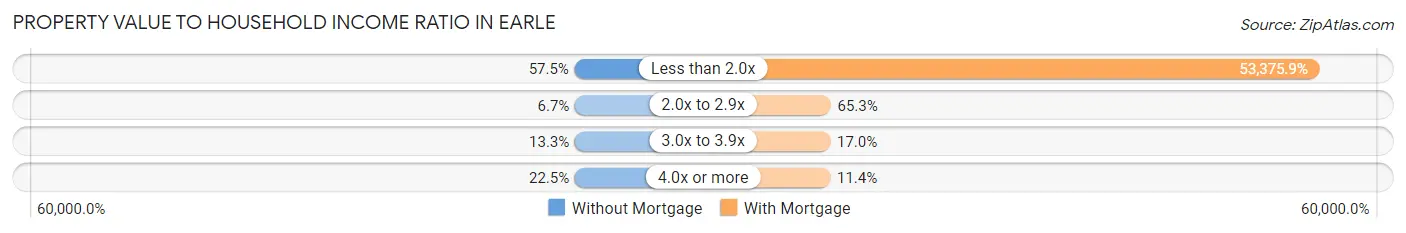
| Value-to-Income Ratio | Without Mortgage | With Mortgage |
| Less than 2.0x | 69 (57.5%) | 75,260 (53,375.9%) |
| 2.0x to 2.9x | 8 (6.7%) | 92 (65.2%) |
| 3.0x to 3.9x | 16 (13.3%) | 24 (17.0%) |
| 4.0x or more | 27 (22.5%) | 16 (11.4%) |
| Total | 120 (100.0%) | 141 (100.0%) |
Real Estate Taxes by Mortgage Status in Earle
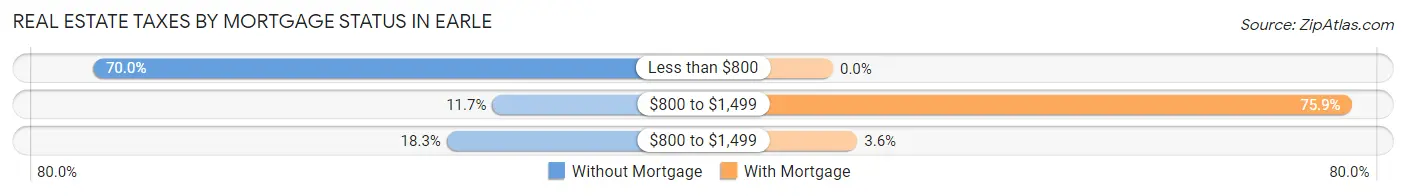
| Property Taxes | Without Mortgage | With Mortgage |
| Less than $800 | 84 (70.0%) | 0 (0.0%) |
| $800 to $1,499 | 14 (11.7%) | 107 (75.9%) |
| $800 to $1,499 | 22 (18.3%) | 5 (3.5%) |
| Total | 120 (100.0%) | 141 (100.0%) |
Health & Disability in Earle
Health Insurance Coverage by Age in Earle
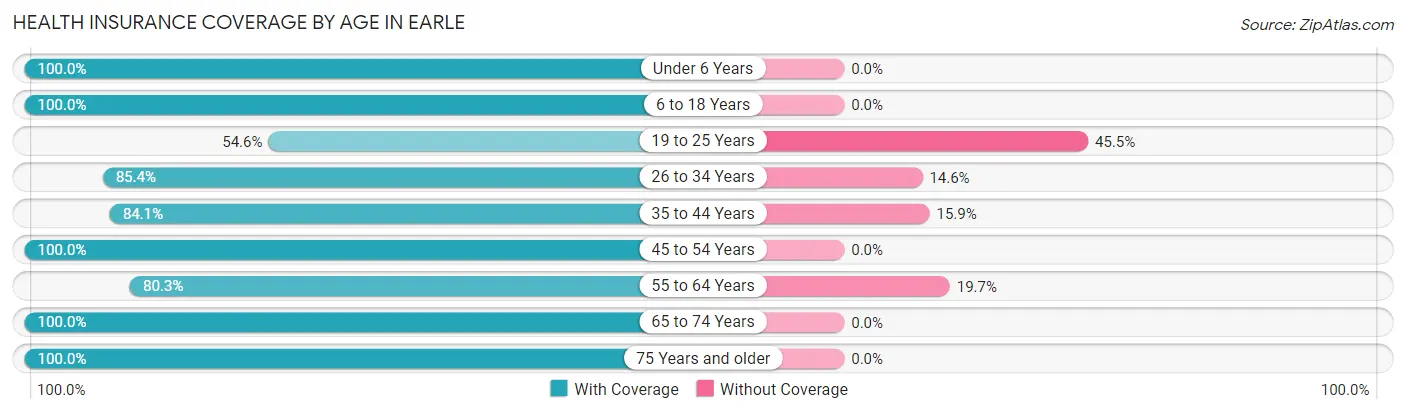
| Age Bracket | With Coverage | Without Coverage |
| Under 6 Years | 199 (100.0%) | 0 (0.0%) |
| 6 to 18 Years | 387 (100.0%) | 0 (0.0%) |
| 19 to 25 Years | 66 (54.5%) | 55 (45.5%) |
| 26 to 34 Years | 129 (85.4%) | 22 (14.6%) |
| 35 to 44 Years | 164 (84.1%) | 31 (15.9%) |
| 45 to 54 Years | 132 (100.0%) | 0 (0.0%) |
| 55 to 64 Years | 241 (80.3%) | 59 (19.7%) |
| 65 to 74 Years | 204 (100.0%) | 0 (0.0%) |
| 75 Years and older | 70 (100.0%) | 0 (0.0%) |
| Total | 1,592 (90.5%) | 167 (9.5%) |
Health Insurance Coverage by Citizenship Status in Earle

| Citizenship Status | With Coverage | Without Coverage |
| Native Born | 199 (100.0%) | 0 (0.0%) |
| Foreign Born, Citizen | 387 (100.0%) | 0 (0.0%) |
| Foreign Born, not a Citizen | 66 (54.5%) | 55 (45.5%) |
Health Insurance Coverage by Household Income in Earle
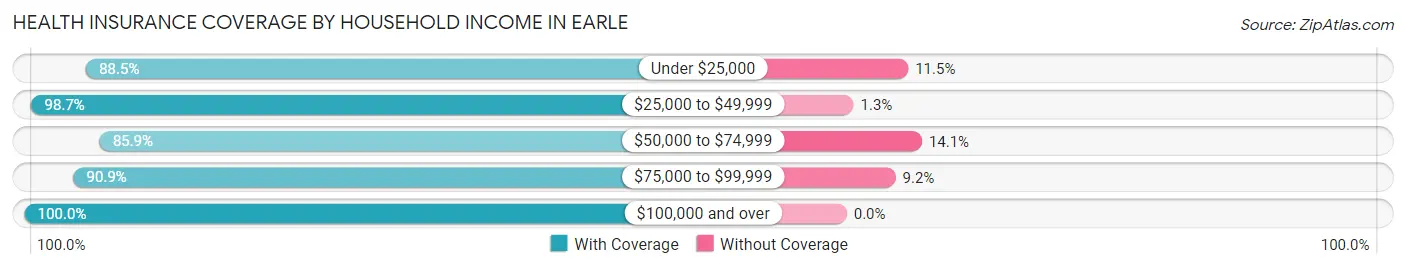
| Household Income | With Coverage | Without Coverage |
| Under $25,000 | 446 (88.5%) | 58 (11.5%) |
| $25,000 to $49,999 | 232 (98.7%) | 3 (1.3%) |
| $50,000 to $74,999 | 366 (85.9%) | 60 (14.1%) |
| $75,000 to $99,999 | 407 (90.8%) | 41 (9.1%) |
| $100,000 and over | 126 (100.0%) | 0 (0.0%) |
Public vs Private Health Insurance Coverage by Age in Earle
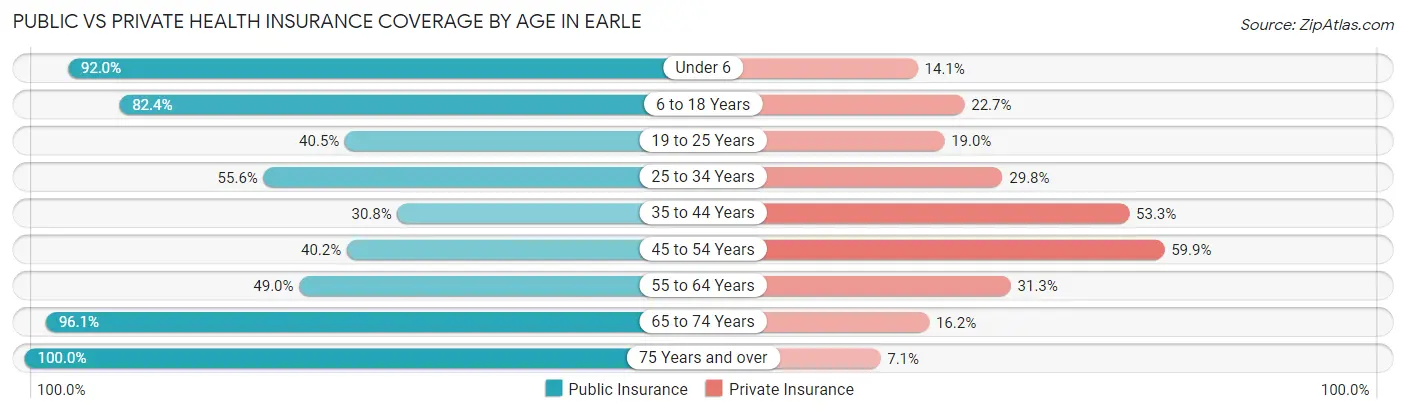
| Age Bracket | Public Insurance | Private Insurance |
| Under 6 | 183 (92.0%) | 28 (14.1%) |
| 6 to 18 Years | 319 (82.4%) | 88 (22.7%) |
| 19 to 25 Years | 49 (40.5%) | 23 (19.0%) |
| 25 to 34 Years | 84 (55.6%) | 45 (29.8%) |
| 35 to 44 Years | 60 (30.8%) | 104 (53.3%) |
| 45 to 54 Years | 53 (40.2%) | 79 (59.9%) |
| 55 to 64 Years | 147 (49.0%) | 94 (31.3%) |
| 65 to 74 Years | 196 (96.1%) | 33 (16.2%) |
| 75 Years and over | 70 (100.0%) | 5 (7.1%) |
| Total | 1,161 (66.0%) | 499 (28.4%) |
Disability Status by Sex by Age in Earle
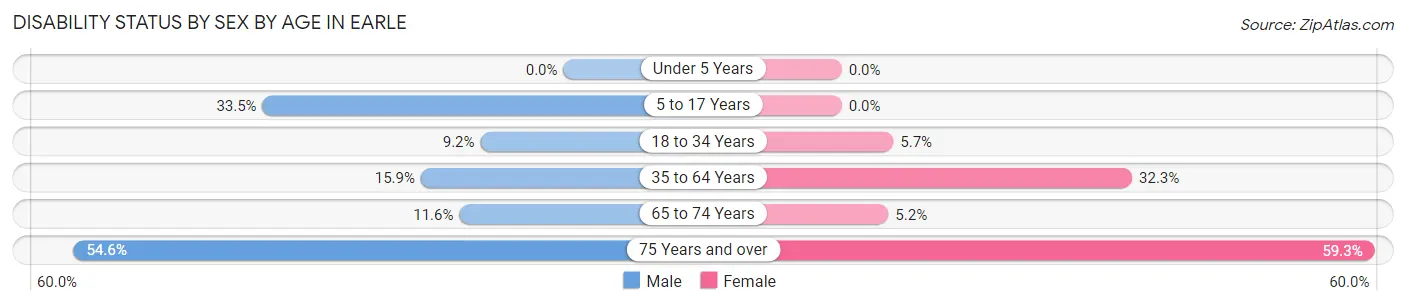
| Age Bracket | Male | Female |
| Under 5 Years | 0 (0.0%) | 0 (0.0%) |
| 5 to 17 Years | 64 (33.5%) | 0 (0.0%) |
| 18 to 34 Years | 17 (9.2%) | 7 (5.7%) |
| 35 to 64 Years | 47 (15.9%) | 107 (32.3%) |
| 65 to 74 Years | 8 (11.6%) | 7 (5.2%) |
| 75 Years and over | 6 (54.5%) | 35 (59.3%) |
Disability Class by Sex by Age in Earle
Disability Class: Hearing Difficulty
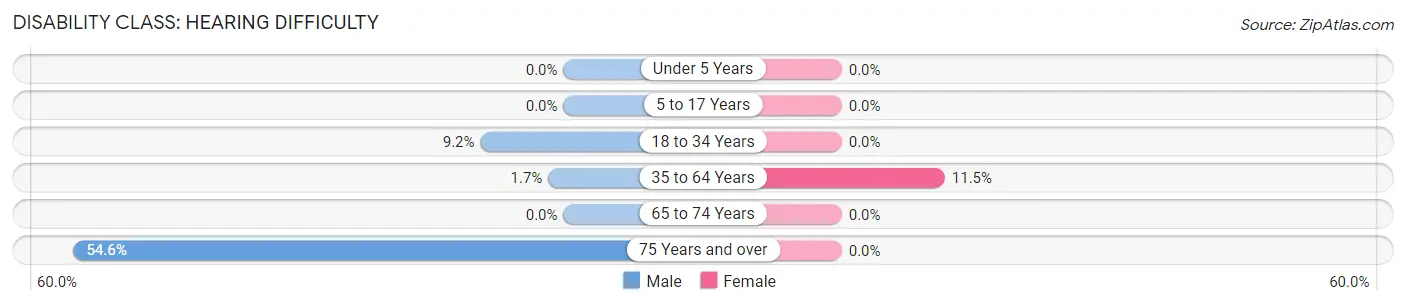
| Age Bracket | Male | Female |
| Under 5 Years | 0 (0.0%) | 0 (0.0%) |
| 5 to 17 Years | 0 (0.0%) | 0 (0.0%) |
| 18 to 34 Years | 17 (9.2%) | 0 (0.0%) |
| 35 to 64 Years | 5 (1.7%) | 38 (11.5%) |
| 65 to 74 Years | 0 (0.0%) | 0 (0.0%) |
| 75 Years and over | 6 (54.5%) | 0 (0.0%) |
Disability Class: Vision Difficulty
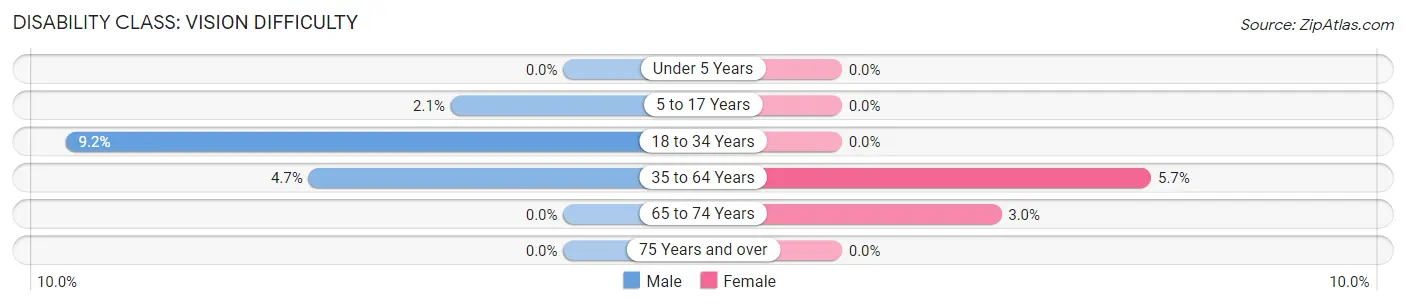
| Age Bracket | Male | Female |
| Under 5 Years | 0 (0.0%) | 0 (0.0%) |
| 5 to 17 Years | 4 (2.1%) | 0 (0.0%) |
| 18 to 34 Years | 17 (9.2%) | 0 (0.0%) |
| 35 to 64 Years | 14 (4.7%) | 19 (5.7%) |
| 65 to 74 Years | 0 (0.0%) | 4 (3.0%) |
| 75 Years and over | 0 (0.0%) | 0 (0.0%) |
Disability Class: Cognitive Difficulty
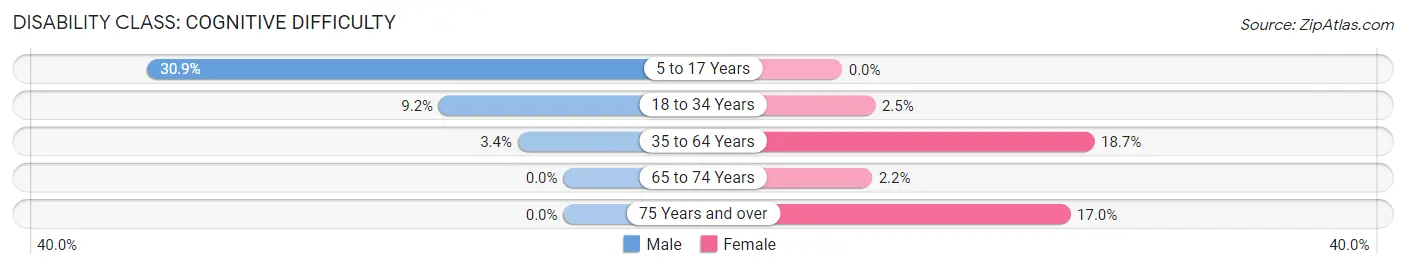
| Age Bracket | Male | Female |
| 5 to 17 Years | 59 (30.9%) | 0 (0.0%) |
| 18 to 34 Years | 17 (9.2%) | 3 (2.5%) |
| 35 to 64 Years | 10 (3.4%) | 62 (18.7%) |
| 65 to 74 Years | 0 (0.0%) | 3 (2.2%) |
| 75 Years and over | 0 (0.0%) | 10 (17.0%) |
Disability Class: Ambulatory Difficulty
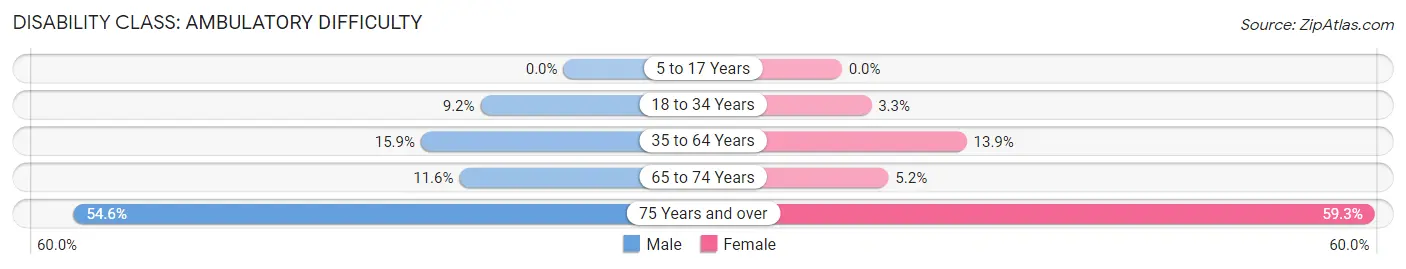
| Age Bracket | Male | Female |
| 5 to 17 Years | 0 (0.0%) | 0 (0.0%) |
| 18 to 34 Years | 17 (9.2%) | 4 (3.3%) |
| 35 to 64 Years | 47 (15.9%) | 46 (13.9%) |
| 65 to 74 Years | 8 (11.6%) | 7 (5.2%) |
| 75 Years and over | 6 (54.5%) | 35 (59.3%) |
Disability Class: Self-Care Difficulty
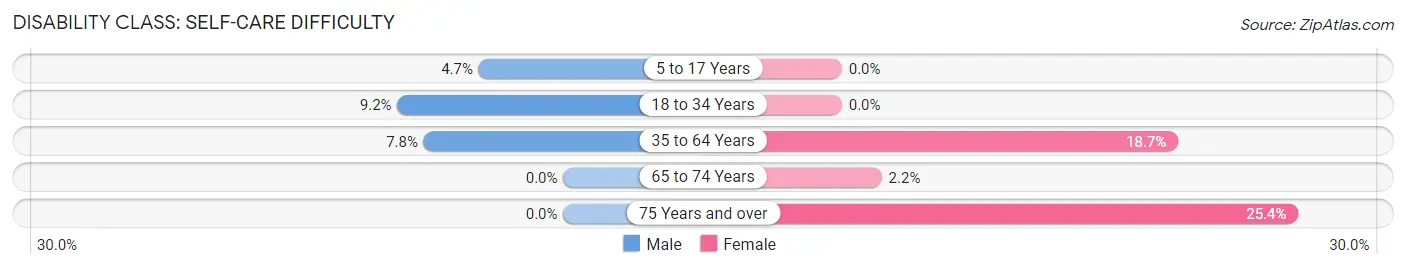
| Age Bracket | Male | Female |
| 5 to 17 Years | 9 (4.7%) | 0 (0.0%) |
| 18 to 34 Years | 17 (9.2%) | 0 (0.0%) |
| 35 to 64 Years | 23 (7.8%) | 62 (18.7%) |
| 65 to 74 Years | 0 (0.0%) | 3 (2.2%) |
| 75 Years and over | 0 (0.0%) | 15 (25.4%) |
Technology Access in Earle
Computing Device Access in Earle
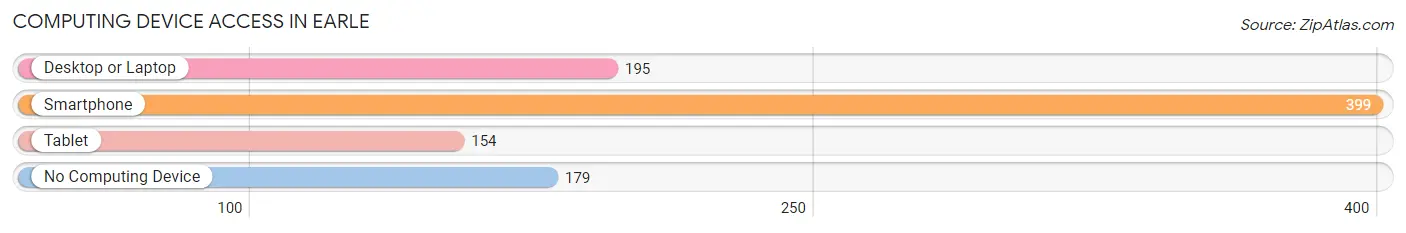
| Device Type | # Households | % Households |
| Desktop or Laptop | 195 | 31.6% |
| Smartphone | 399 | 64.7% |
| Tablet | 154 | 25.0% |
| No Computing Device | 179 | 29.0% |
| Total | 617 | 100.0% |
Internet Access in Earle
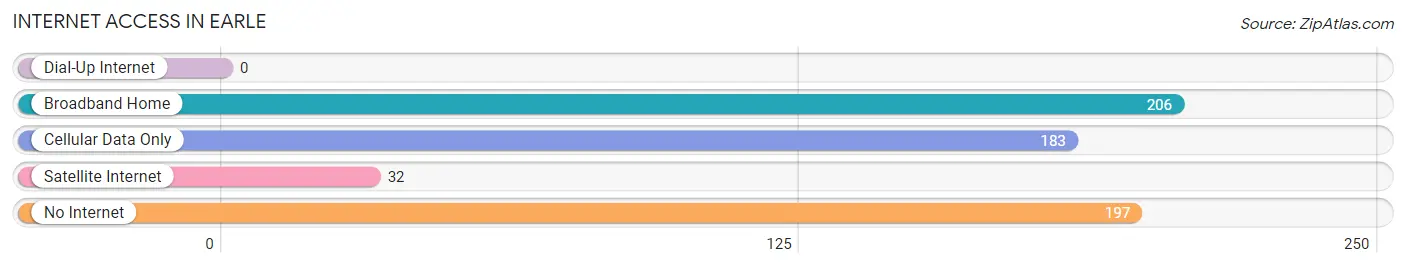
| Internet Type | # Households | % Households |
| Dial-Up Internet | 0 | 0.0% |
| Broadband Home | 206 | 33.4% |
| Cellular Data Only | 183 | 29.7% |
| Satellite Internet | 32 | 5.2% |
| No Internet | 197 | 31.9% |
| Total | 617 | 100.0% |
Earle Summary
Earle is a city located in Crittenden County, Arkansas, United States. The population was 2,414 at the 2010 census, an increase of 8.3 percent from 2,227 at the 2000 census. Earle is located in the eastern part of the county, along U.S. Route 64, which leads east 8 miles (13 km) to Wynne and west 10 miles (16 km) to Marion.
History
Earle was founded in 1881 by the St. Louis, Iron Mountain and Southern Railway. The city was named for the railroad's president, William Earle. The Earle post office opened in 1882. The city was incorporated in 1887.
Geography
Earle is located in eastern Crittenden County at 35°14′25″N 90°25′17″W (35.240278, -90.421389). U.S. Route 64 passes through the city, leading east 8 miles (13 km) to Wynne and west 10 miles (16 km) to Marion.
According to the United States Census Bureau, Earle has a total area of 2.2 square miles (5.7 km2), all land.
Demographics
As of the census of 2000, there were 2,227 people, 845 households, and 590 families residing in the city. The population density was 1,006.2 people per square mile (389.2/km2). There were 945 housing units at an average density of 428.3 per square mile (165.3/km2). The racial makeup of the city was 57.45% White, 40.90% Black or African American, 0.18% Native American, 0.09% Asian, 0.04% Pacific Islander, 0.45% from other races, and 0.89% from two or more races. 1.08% of the population were Hispanic or Latino of any race.
Economy
The economy of Earle is largely based on agriculture and manufacturing. The city is home to several manufacturing plants, including a Tyson Foods poultry processing plant, a Georgia-Pacific lumber mill, and a Cargill grain elevator. The city also has a number of small businesses, including restaurants, retail stores, and service providers.
The city is served by the Earle School District, which includes Earle Elementary School, Earle Middle School, and Earle High School. The district also operates a Head Start program. The city is also home to a branch of the Crittenden County Library.
Conclusion
Earle is a small city located in Crittenden County, Arkansas. The city was founded in 1881 and has a population of 2,414 as of the 2010 census. The economy of Earle is largely based on agriculture and manufacturing, and the city is served by the Earle School District. Earle is a small city with a rich history and a bright future.
Common Questions
What is Per Capita Income in Earle?
Per Capita income in Earle is $17,308.
What is the Median Family Income in Earle?
Median Family Income in Earle is $47,250.
What is the Median Household income in Earle?
Median Household Income in Earle is $41,484.
What is Income or Wage Gap in Earle?
Income or Wage Gap in Earle is 4.9%.
Women in Earle earn 95.1 cents for every dollar earned by a man.
What is Family Income Deficit in Earle?
Family Income Deficit in Earle is $14,454.
Families that are below poverty line in Earle earn $14,454 less on average than the poverty threshold level.
What is Inequality or Gini Index in Earle?
Inequality or Gini Index in Earle is 0.48.
What is the Total Population of Earle?
Total Population of Earle is 1,759.
What is the Total Male Population of Earle?
Total Male Population of Earle is 819.
What is the Total Female Population of Earle?
Total Female Population of Earle is 940.
What is the Ratio of Males per 100 Females in Earle?
There are 87.13 Males per 100 Females in Earle.
What is the Ratio of Females per 100 Males in Earle?
There are 114.77 Females per 100 Males in Earle.
What is the Median Population Age in Earle?
Median Population Age in Earle is 36.3 Years.
What is the Average Family Size in Earle
Average Family Size in Earle is 3.9 People.
What is the Average Household Size in Earle
Average Household Size in Earle is 2.8 People.
How Large is the Labor Force in Earle?
There are 663 People in the Labor Forcein in Earle.
What is the Percentage of People in the Labor Force in Earle?
50.7% of People are in the Labor Force in Earle.
What is the Unemployment Rate in Earle?
Unemployment Rate in Earle is 17.0%.