Gordonville, PA Map & Demographics
Gordonville Map
Gordonville Overview
$19,644
PER CAPITA INCOME
$85,040
AVG FAMILY INCOME
$56,406
AVG HOUSEHOLD INCOME
86.0%
WAGE / INCOME GAP [ % ]
14.0¢/ $1
WAGE / INCOME GAP [ $ ]
0.32
INEQUALITY / GINI INDEX
643
TOTAL POPULATION
292
MALE POPULATION
351
FEMALE POPULATION
83.19
MALES / 100 FEMALES
120.21
FEMALES / 100 MALES
30.9
MEDIAN AGE
4.2
AVG FAMILY SIZE
3.3
AVG HOUSEHOLD SIZE
243
LABOR FORCE [ PEOPLE ]
55.6%
PERCENT IN LABOR FORCE
Gordonville Zip Codes
Gordonville Area Codes
Income in Gordonville
Income Overview in Gordonville
Per Capita Income in Gordonville is $19,644, while median incomes of families and households are $85,040 and $56,406 respectively.
| Characteristic | Number | Measure |
| Per Capita Income | 643 | $19,644 |
| Median Family Income | 141 | $85,040 |
| Mean Family Income | 141 | $76,155 |
| Median Household Income | 197 | $56,406 |
| Mean Household Income | 197 | $63,321 |
| Income Deficit | 141 | $0 |
| Wage / Income Gap (%) | 643 | 85.99% |
| Wage / Income Gap ($) | 643 | 14.01¢ per $1 |
| Gini / Inequality Index | 643 | 0.32 |
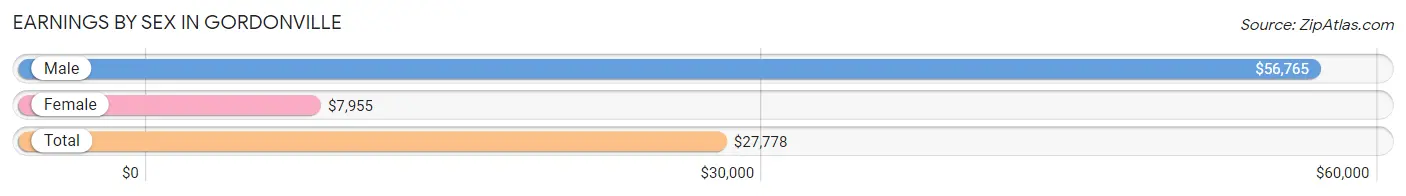
Earnings by Sex in Gordonville
Average Earnings in Gordonville are $27,778, $56,765 for men and $7,955 for women, a difference of 86.0%.
| Sex | Number | Average Earnings |
| Male | 148 (58.7%) | $56,765 |
| Female | 104 (41.3%) | $7,955 |
| Total | 252 (100.0%) | $27,778 |
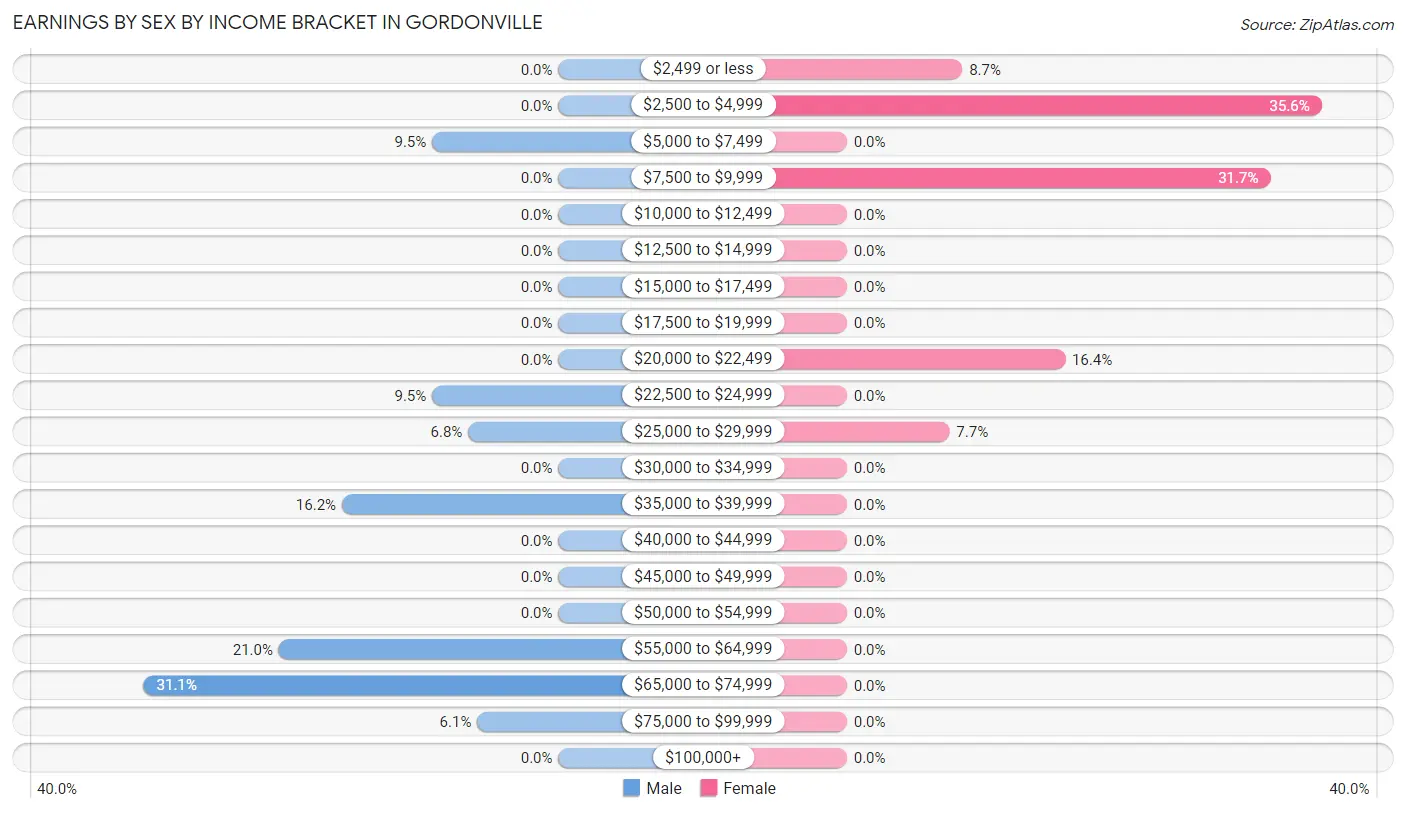
Earnings by Sex by Income Bracket in Gordonville
The most common earnings brackets in Gordonville are $65,000 to $74,999 for men (46 | 31.1%) and $2,500 to $4,999 for women (37 | 35.6%).
| Income | Male | Female |
| $2,499 or less | 0 (0.0%) | 9 (8.6%) |
| $2,500 to $4,999 | 0 (0.0%) | 37 (35.6%) |
| $5,000 to $7,499 | 14 (9.5%) | 0 (0.0%) |
| $7,500 to $9,999 | 0 (0.0%) | 33 (31.7%) |
| $10,000 to $12,499 | 0 (0.0%) | 0 (0.0%) |
| $12,500 to $14,999 | 0 (0.0%) | 0 (0.0%) |
| $15,000 to $17,499 | 0 (0.0%) | 0 (0.0%) |
| $17,500 to $19,999 | 0 (0.0%) | 0 (0.0%) |
| $20,000 to $22,499 | 0 (0.0%) | 17 (16.4%) |
| $22,500 to $24,999 | 14 (9.5%) | 0 (0.0%) |
| $25,000 to $29,999 | 10 (6.8%) | 8 (7.7%) |
| $30,000 to $34,999 | 0 (0.0%) | 0 (0.0%) |
| $35,000 to $39,999 | 24 (16.2%) | 0 (0.0%) |
| $40,000 to $44,999 | 0 (0.0%) | 0 (0.0%) |
| $45,000 to $49,999 | 0 (0.0%) | 0 (0.0%) |
| $50,000 to $54,999 | 0 (0.0%) | 0 (0.0%) |
| $55,000 to $64,999 | 31 (20.9%) | 0 (0.0%) |
| $65,000 to $74,999 | 46 (31.1%) | 0 (0.0%) |
| $75,000 to $99,999 | 9 (6.1%) | 0 (0.0%) |
| $100,000+ | 0 (0.0%) | 0 (0.0%) |
| Total | 148 (100.0%) | 104 (100.0%) |
Earnings by Sex by Educational Attainment in Gordonville
| Educational Attainment | Male Income | Female Income |
| Less than High School | - | - |
| High School Diploma | - | - |
| College or Associate's Degree | - | - |
| Bachelor's Degree | - | - |
| Graduate Degree | - | - |
| Total | $67,908 | $0 |
Family Income in Gordonville
Family Income Brackets in Gordonville
According to the Gordonville family income data, there are 47 families falling into the $75,000 to $99,999 income range, which is the most common income bracket and makes up 33.3% of all families.
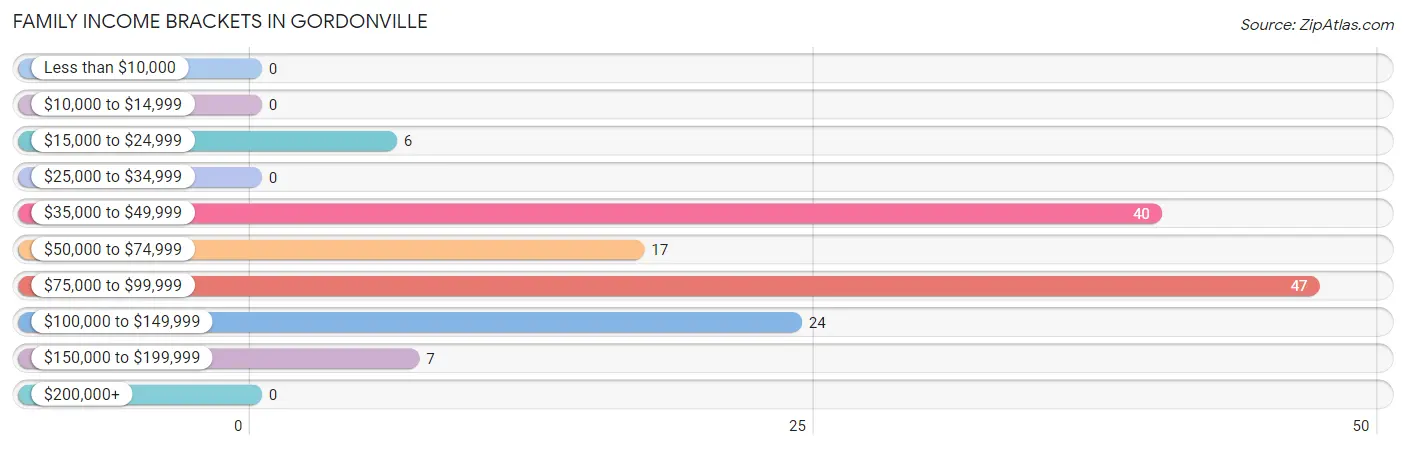
| Income Bracket | # Families | % Families |
| Less than $10,000 | 0 | 0.0% |
| $10,000 to $14,999 | 0 | 0.0% |
| $15,000 to $24,999 | 6 | 4.3% |
| $25,000 to $34,999 | 0 | 0.0% |
| $35,000 to $49,999 | 40 | 28.4% |
| $50,000 to $74,999 | 17 | 12.1% |
| $75,000 to $99,999 | 47 | 33.3% |
| $100,000 to $149,999 | 24 | 17.0% |
| $150,000 to $199,999 | 7 | 5.0% |
| $200,000+ | 0 | 0.0% |
Family Income by Famaliy Size in Gordonville
2-person families (86 | 61.0%) account for the highest median family income in Gordonville with $44,063 per family, while 2-person families (86 | 61.0%) have the highest median income of $22,032 per family member.
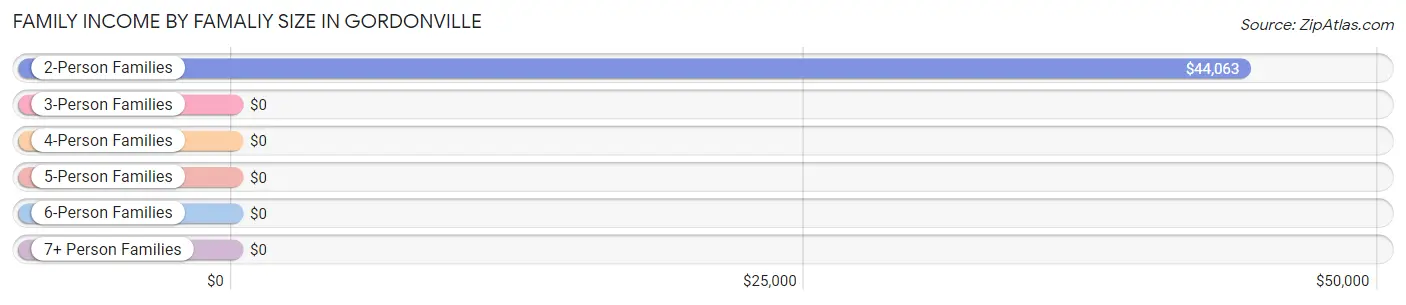
| Income Bracket | # Families | Median Income |
| 2-Person Families | 86 (61.0%) | $44,063 |
| 3-Person Families | 0 (0.0%) | $0 |
| 4-Person Families | 0 (0.0%) | $0 |
| 5-Person Families | 0 (0.0%) | $0 |
| 6-Person Families | 9 (6.4%) | $0 |
| 7+ Person Families | 46 (32.6%) | $0 |
| Total | 141 (100.0%) | $85,040 |
Family Income by Number of Earners in Gordonville
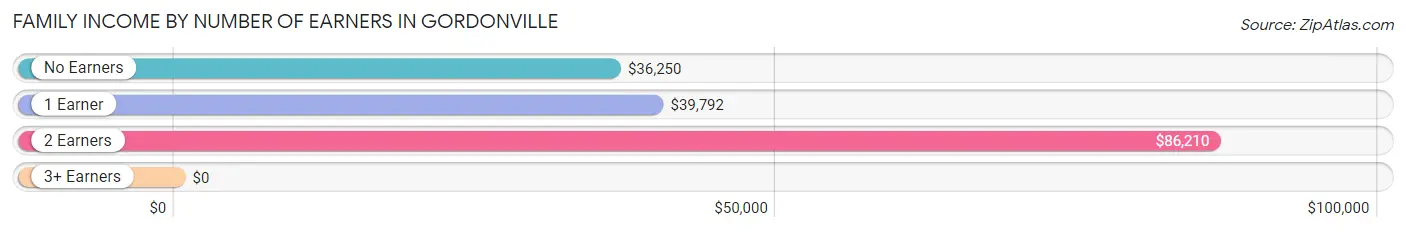
| Number of Earners | # Families | Median Income |
| No Earners | 20 (14.2%) | $36,250 |
| 1 Earner | 33 (23.4%) | $39,792 |
| 2 Earners | 64 (45.4%) | $86,210 |
| 3+ Earners | 24 (17.0%) | $0 |
| Total | 141 (100.0%) | $85,040 |
Household Income in Gordonville
Household Income Brackets in Gordonville
With 47 households falling in the category, the $35,000 to $49,999 income range is the most frequent in Gordonville, accounting for 23.9% of all households.
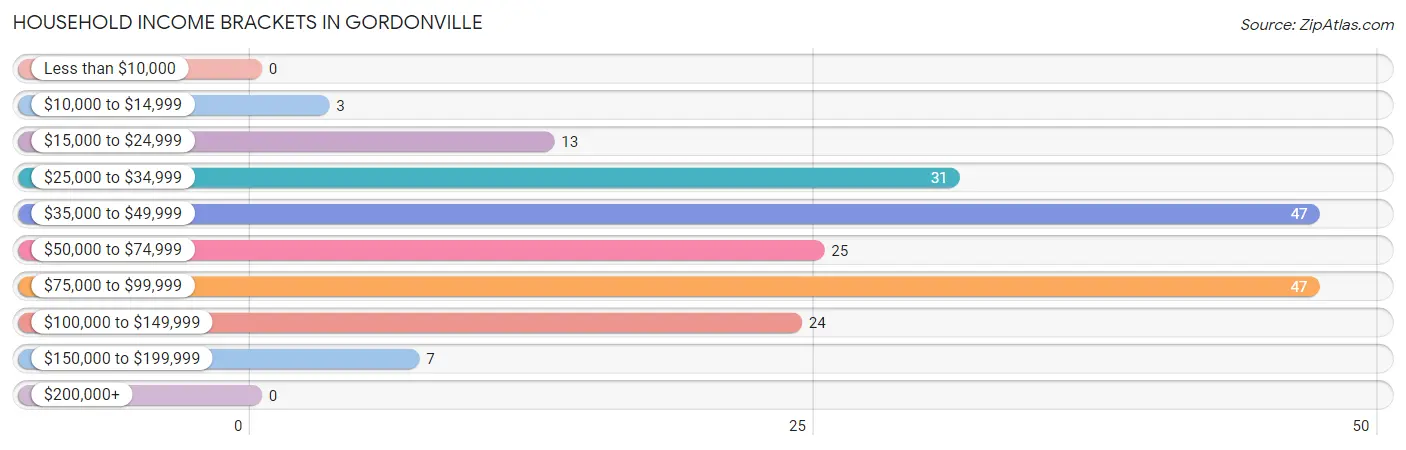
| Income Bracket | # Households | % Households |
| Less than $10,000 | 0 | 0.0% |
| $10,000 to $14,999 | 3 | 1.5% |
| $15,000 to $24,999 | 13 | 6.6% |
| $25,000 to $34,999 | 31 | 15.7% |
| $35,000 to $49,999 | 47 | 23.9% |
| $50,000 to $74,999 | 25 | 12.7% |
| $75,000 to $99,999 | 47 | 23.9% |
| $100,000 to $149,999 | 24 | 12.2% |
| $150,000 to $199,999 | 7 | 3.6% |
| $200,000+ | 0 | 0.0% |
Household Income by Householder Age in Gordonville
The median household income in Gordonville is $56,406, with the highest median household income of $103,750 found in the 45 to 64 years age bracket for the primary householder. A total of 48 households (24.4%) fall into this category.
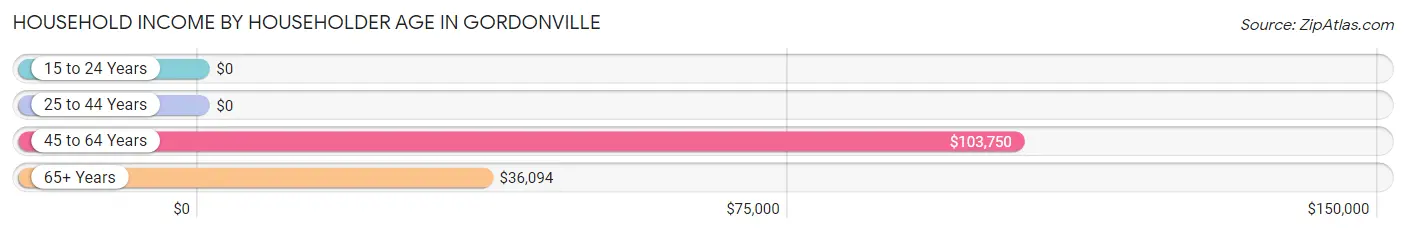
| Income Bracket | # Households | Median Income |
| 15 to 24 Years | 0 (0.0%) | $0 |
| 25 to 44 Years | 48 (24.4%) | $0 |
| 45 to 64 Years | 48 (24.4%) | $103,750 |
| 65+ Years | 101 (51.3%) | $36,094 |
| Total | 197 (100.0%) | $56,406 |
Poverty in Gordonville
Income Below Poverty by Sex and Age in Gordonville
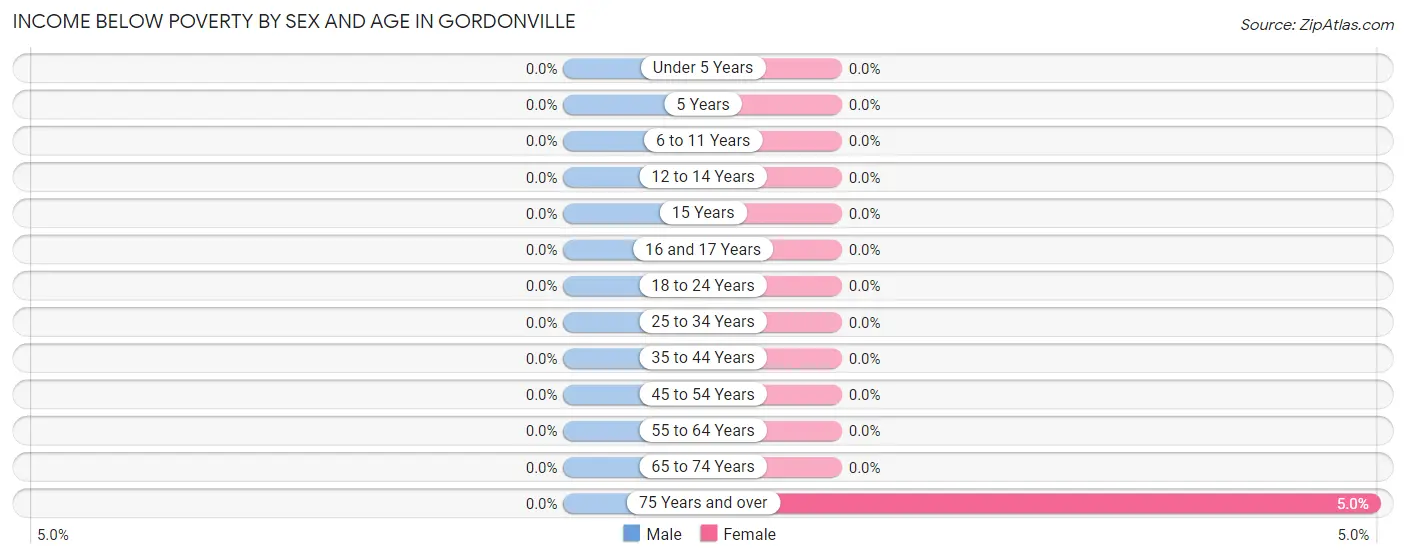
| Age Bracket | Male | Female |
| Under 5 Years | 0 (0.0%) | 0 (0.0%) |
| 5 Years | 0 (0.0%) | 0 (0.0%) |
| 6 to 11 Years | 0 (0.0%) | 0 (0.0%) |
| 12 to 14 Years | 0 (0.0%) | 0 (0.0%) |
| 15 Years | 0 (0.0%) | 0 (0.0%) |
| 16 and 17 Years | 0 (0.0%) | 0 (0.0%) |
| 18 to 24 Years | 0 (0.0%) | 0 (0.0%) |
| 25 to 34 Years | 0 (0.0%) | 0 (0.0%) |
| 35 to 44 Years | 0 (0.0%) | 0 (0.0%) |
| 45 to 54 Years | 0 (0.0%) | 0 (0.0%) |
| 55 to 64 Years | 0 (0.0%) | 0 (0.0%) |
| 65 to 74 Years | 0 (0.0%) | 0 (0.0%) |
| 75 Years and over | 0 (0.0%) | 3 (5.0%) |
| Total | 0 (0.0%) | 3 (0.9%) |
Income Above Poverty by Sex and Age in Gordonville
According to the poverty statistics in Gordonville, males aged under 5 years and females aged 6 to 11 years are the age groups that are most secure financially, with 100.0% of males and 100.0% of females in these age groups living above the poverty line.
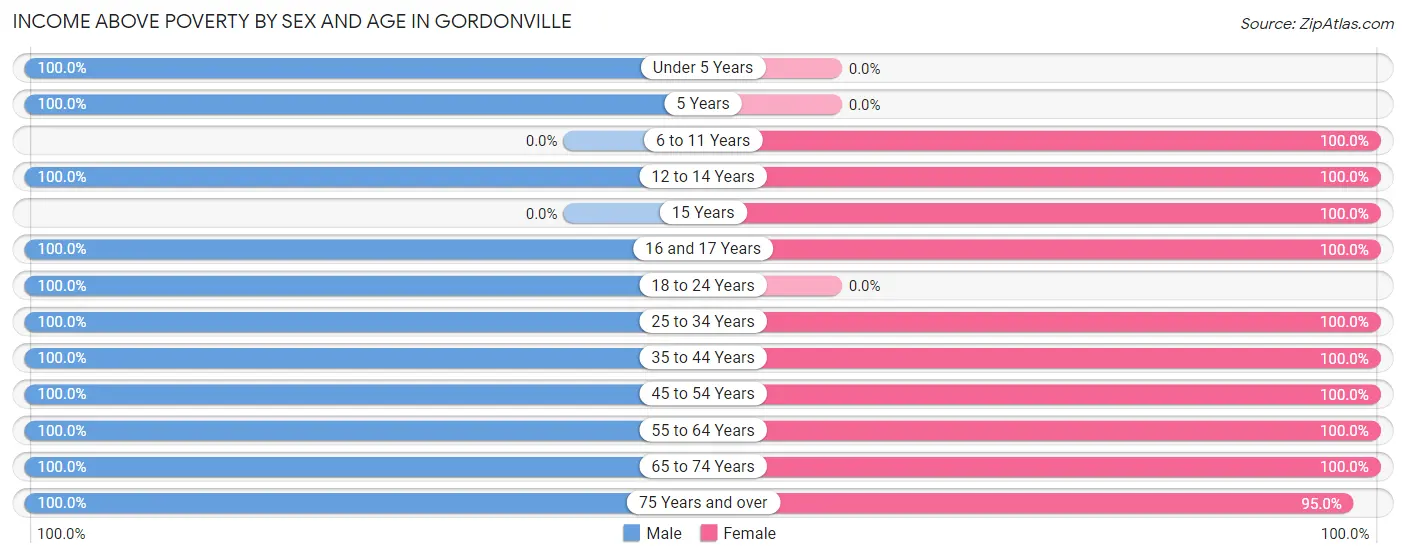
| Age Bracket | Male | Female |
| Under 5 Years | 30 (100.0%) | 0 (0.0%) |
| 5 Years | 30 (100.0%) | 0 (0.0%) |
| 6 to 11 Years | 0 (0.0%) | 44 (100.0%) |
| 12 to 14 Years | 24 (100.0%) | 44 (100.0%) |
| 15 Years | 0 (0.0%) | 34 (100.0%) |
| 16 and 17 Years | 14 (100.0%) | 48 (100.0%) |
| 18 to 24 Years | 39 (100.0%) | 0 (0.0%) |
| 25 to 34 Years | 17 (100.0%) | 16 (100.0%) |
| 35 to 44 Years | 31 (100.0%) | 29 (100.0%) |
| 45 to 54 Years | 15 (100.0%) | 27 (100.0%) |
| 55 to 64 Years | 34 (100.0%) | 41 (100.0%) |
| 65 to 74 Years | 25 (100.0%) | 8 (100.0%) |
| 75 Years and over | 33 (100.0%) | 57 (95.0%) |
| Total | 292 (100.0%) | 348 (99.2%) |
Income Below Poverty Among Married-Couple Families in Gordonville
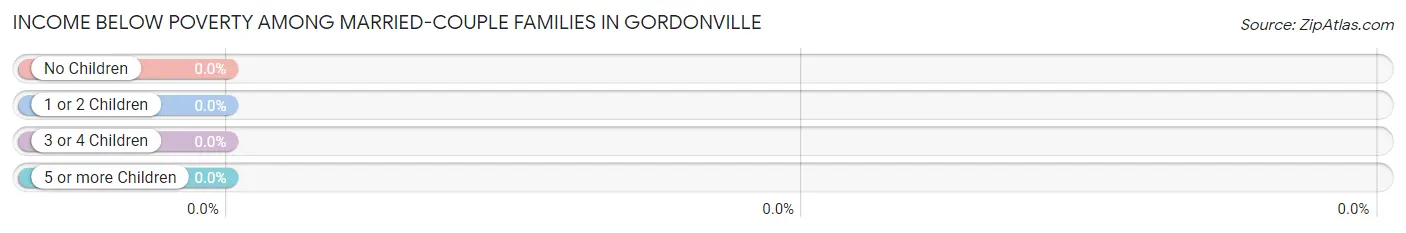
| Children | Above Poverty | Below Poverty |
| No Children | 86 (100.0%) | 0 (0.0%) |
| 1 or 2 Children | 9 (100.0%) | 0 (0.0%) |
| 3 or 4 Children | 15 (100.0%) | 0 (0.0%) |
| 5 or more Children | 31 (100.0%) | 0 (0.0%) |
| Total | 141 (100.0%) | 0 (0.0%) |
Income Below Poverty Among Single-Parent Households in Gordonville
| Children | Single Father | Single Mother |
| No Children | 0 (0.0%) | 0 (0.0%) |
| 1 or 2 Children | 0 (0.0%) | 0 (0.0%) |
| 3 or 4 Children | 0 (0.0%) | 0 (0.0%) |
| 5 or more Children | 0 (0.0%) | 0 (0.0%) |
| Total | 0 (0.0%) | 0 (0.0%) |
Income Below Poverty Among Married-Couple vs Single-Parent Households in Gordonville
| Children | Married-Couple Families | Single-Parent Households |
| No Children | 0 (0.0%) | 0 (0.0%) |
| 1 or 2 Children | 0 (0.0%) | 0 (0.0%) |
| 3 or 4 Children | 0 (0.0%) | 0 (0.0%) |
| 5 or more Children | 0 (0.0%) | 0 (0.0%) |
| Total | 0 (0.0%) | 0 (0.0%) |
Race in Gordonville
The most populous races in Gordonville are , and White / Caucasian (643 | 100.0%).
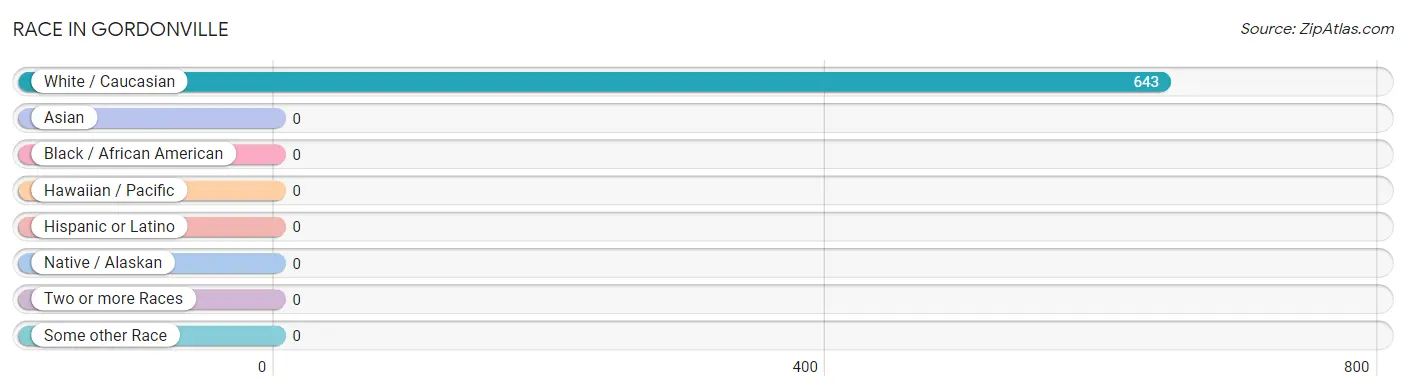
| Race | # Population | % Population |
| Asian | 0 | 0.0% |
| Black / African American | 0 | 0.0% |
| Hawaiian / Pacific | 0 | 0.0% |
| Hispanic or Latino | 0 | 0.0% |
| Native / Alaskan | 0 | 0.0% |
| White / Caucasian | 643 | 100.0% |
| Two or more Races | 0 | 0.0% |
| Some other Race | 0 | 0.0% |
| Total | 643 | 100.0% |
Ancestry in Gordonville
The most populous ancestries reported in Gordonville are American (85 | 13.2%), German (66 | 10.3%), Irish (26 | 4.0%), Ukrainian (23 | 3.6%), and Scottish (9 | 1.4%), together accounting for 32.5% of all Gordonville residents.
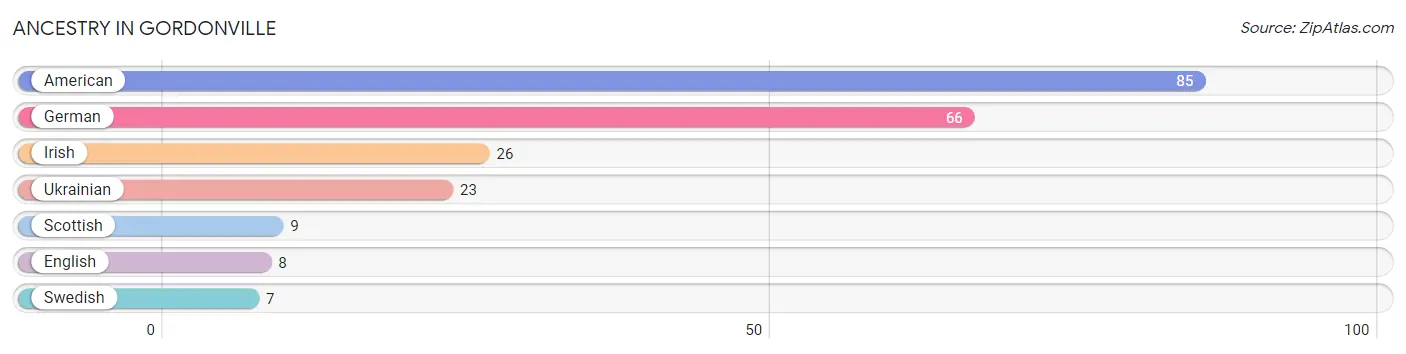
| Ancestry | # Population | % Population |
| American | 85 | 13.2% |
| English | 8 | 1.2% |
| German | 66 | 10.3% |
| Irish | 26 | 4.0% |
| Scottish | 9 | 1.4% |
| Swedish | 7 | 1.1% |
| Ukrainian | 23 | 3.6% | View All 7 Rows |
Immigrants in Gordonville

| Immigration Origin | # Population | % Population | View All 0 Rows |
Sex and Age in Gordonville
Sex and Age in Gordonville
The most populous age groups in Gordonville are 15 to 19 Years (43 | 14.7%) for men and 15 to 19 Years (82 | 23.4%) for women.
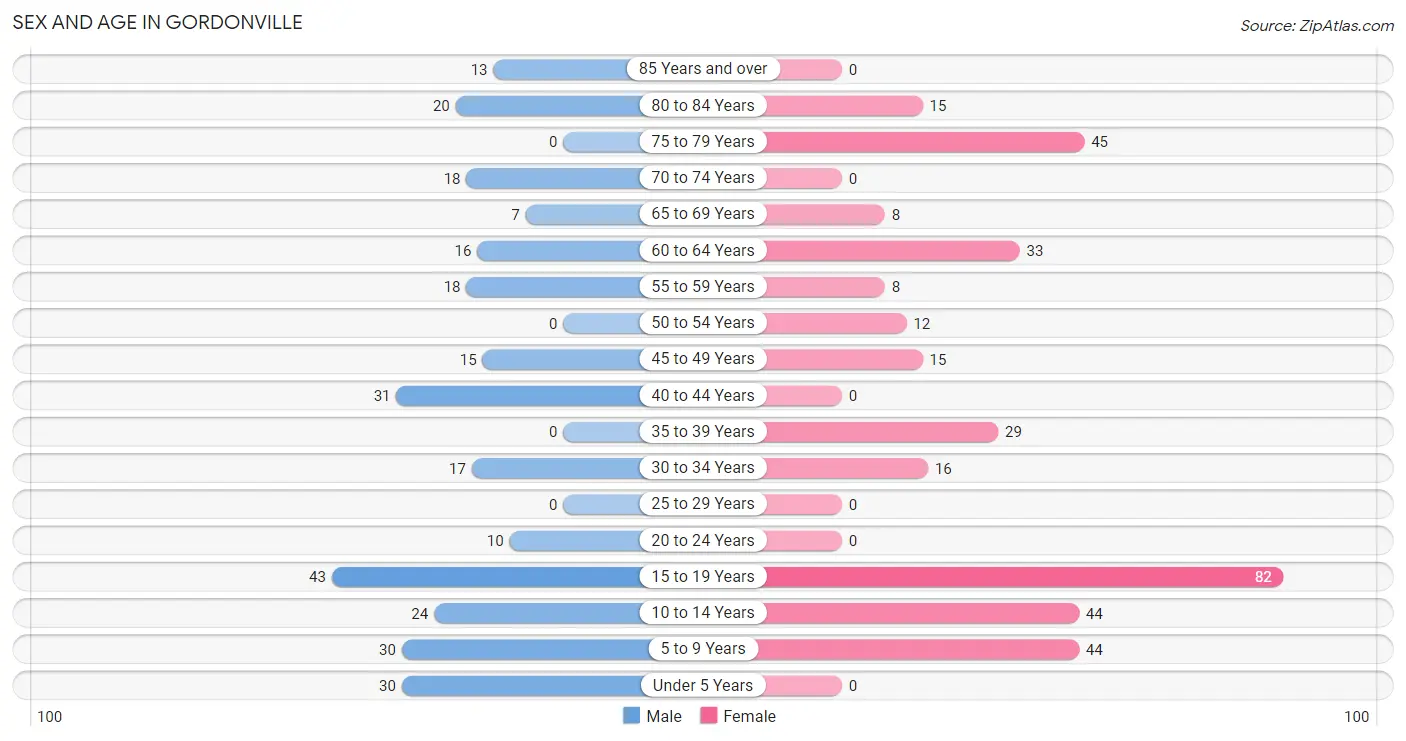
| Age Bracket | Male | Female |
| Under 5 Years | 30 (10.3%) | 0 (0.0%) |
| 5 to 9 Years | 30 (10.3%) | 44 (12.5%) |
| 10 to 14 Years | 24 (8.2%) | 44 (12.5%) |
| 15 to 19 Years | 43 (14.7%) | 82 (23.4%) |
| 20 to 24 Years | 10 (3.4%) | 0 (0.0%) |
| 25 to 29 Years | 0 (0.0%) | 0 (0.0%) |
| 30 to 34 Years | 17 (5.8%) | 16 (4.6%) |
| 35 to 39 Years | 0 (0.0%) | 29 (8.3%) |
| 40 to 44 Years | 31 (10.6%) | 0 (0.0%) |
| 45 to 49 Years | 15 (5.1%) | 15 (4.3%) |
| 50 to 54 Years | 0 (0.0%) | 12 (3.4%) |
| 55 to 59 Years | 18 (6.2%) | 8 (2.3%) |
| 60 to 64 Years | 16 (5.5%) | 33 (9.4%) |
| 65 to 69 Years | 7 (2.4%) | 8 (2.3%) |
| 70 to 74 Years | 18 (6.2%) | 0 (0.0%) |
| 75 to 79 Years | 0 (0.0%) | 45 (12.8%) |
| 80 to 84 Years | 20 (6.9%) | 15 (4.3%) |
| 85 Years and over | 13 (4.4%) | 0 (0.0%) |
| Total | 292 (100.0%) | 351 (100.0%) |
Families and Households in Gordonville
Median Family Size in Gordonville
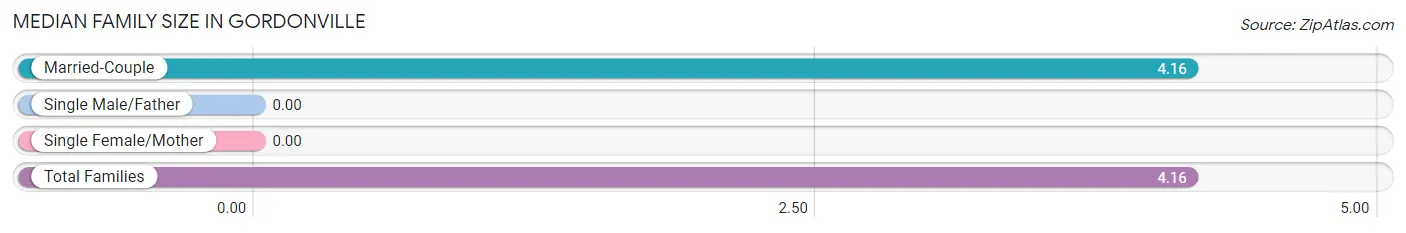
| Family Type | # Families | Family Size |
| Married-Couple | 141 (100.0%) | 4.16 |
| Single Male/Father | 0 (0.0%) | - |
| Single Female/Mother | 0 (0.0%) | - |
| Total Families | 141 (100.0%) | 4.16 |
Median Household Size in Gordonville
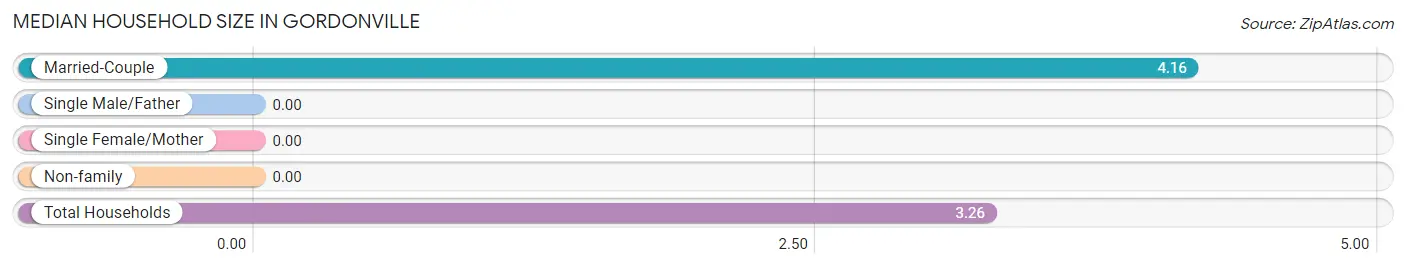
| Household Type | # Households | Household Size |
| Married-Couple | 141 (71.6%) | 4.16 |
| Single Male/Father | 0 (0.0%) | - |
| Single Female/Mother | 0 (0.0%) | - |
| Non-family | 56 (28.4%) | - |
| Total Households | 197 (100.0%) | 3.26 |
Household Size by Marriage Status in Gordonville
Out of a total of 197 households in Gordonville, 141 (71.6%) are family households, while 56 (28.4%) are nonfamily households. The most numerous type of family households are 2-person households, comprising 86, and the most common type of nonfamily households are 1-person households, comprising 56.
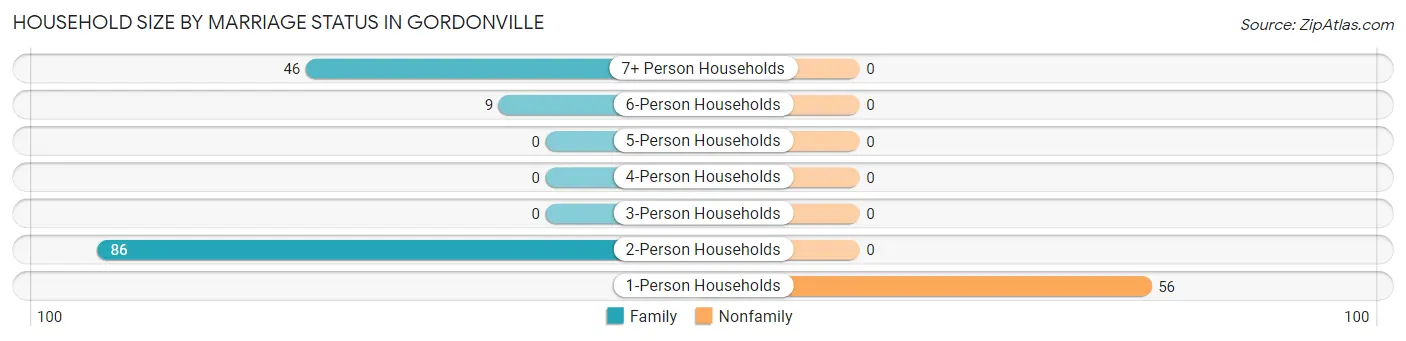
| Household Size | Family Households | Nonfamily Households |
| 1-Person Households | - | 56 (28.4%) |
| 2-Person Households | 86 (43.6%) | 0 (0.0%) |
| 3-Person Households | 0 (0.0%) | 0 (0.0%) |
| 4-Person Households | 0 (0.0%) | 0 (0.0%) |
| 5-Person Households | 0 (0.0%) | 0 (0.0%) |
| 6-Person Households | 9 (4.6%) | 0 (0.0%) |
| 7+ Person Households | 46 (23.4%) | 0 (0.0%) |
| Total | 141 (71.6%) | 56 (28.4%) |
Female Fertility in Gordonville
Fertility by Age in Gordonville
| Age Bracket | Women with Births | Births / 1,000 Women |
| 15 to 19 years | 0 (0.0%) | 0.0 |
| 20 to 34 years | 0 (0.0%) | 0.0 |
| 35 to 50 years | 0 (0.0%) | 0.0 |
| Total | 0 (0.0%) | 0.0 |
Fertility by Age by Marriage Status in Gordonville
| Age Bracket | Married | Unmarried |
| 15 to 19 years | 0 (0.0%) | 0 (0.0%) |
| 20 to 34 years | 0 (0.0%) | 0 (0.0%) |
| 35 to 50 years | 0 (0.0%) | 0 (0.0%) |
| Total | 0 (0.0%) | 0 (0.0%) |
Fertility by Education in Gordonville
| Educational Attainment | Women with Births | Births / 1,000 Women |
| Less than High School | 0 (0.0%) | 0.0 |
| High School Diploma | 0 (0.0%) | 0.0 |
| College or Associate's Degree | 0 (0.0%) | 0.0 |
| Bachelor's Degree | 0 (0.0%) | 0.0 |
| Graduate Degree | 0 (0.0%) | 0.0 |
| Total | 0 (0.0%) | 0.0 |
Fertility by Education by Marriage Status in Gordonville
| Educational Attainment | Married | Unmarried |
| Less than High School | 0 (0.0%) | 0 (0.0%) |
| High School Diploma | 0 (0.0%) | 0 (0.0%) |
| College or Associate's Degree | 0 (0.0%) | 0 (0.0%) |
| Bachelor's Degree | 0 (0.0%) | 0 (0.0%) |
| Graduate Degree | 0 (0.0%) | 0 (0.0%) |
| Total | 0 (0.0%) | 0 (0.0%) |
Employment Characteristics in Gordonville
Employment by Class of Employer in Gordonville
Among the 237 employed individuals in Gordonville, private company employees (181 | 76.4%), self-employed (not incorporated) (41 | 17.3%), and local government employees (15 | 6.3%) make up the most common classes of employment.
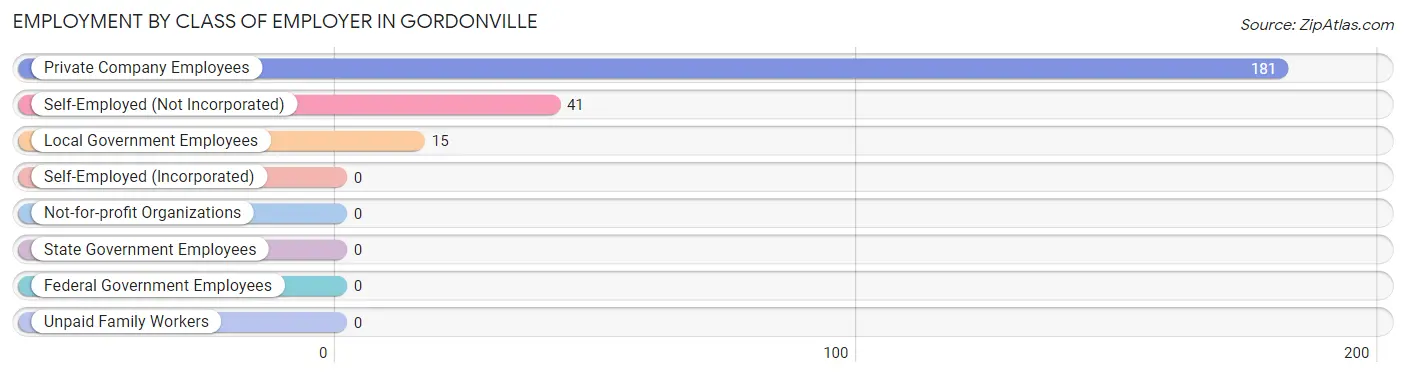
| Employer Class | # Employees | % Employees |
| Private Company Employees | 181 | 76.4% |
| Self-Employed (Incorporated) | 0 | 0.0% |
| Self-Employed (Not Incorporated) | 41 | 17.3% |
| Not-for-profit Organizations | 0 | 0.0% |
| Local Government Employees | 15 | 6.3% |
| State Government Employees | 0 | 0.0% |
| Federal Government Employees | 0 | 0.0% |
| Unpaid Family Workers | 0 | 0.0% |
| Total | 237 | 100.0% |
Employment Status by Age in Gordonville
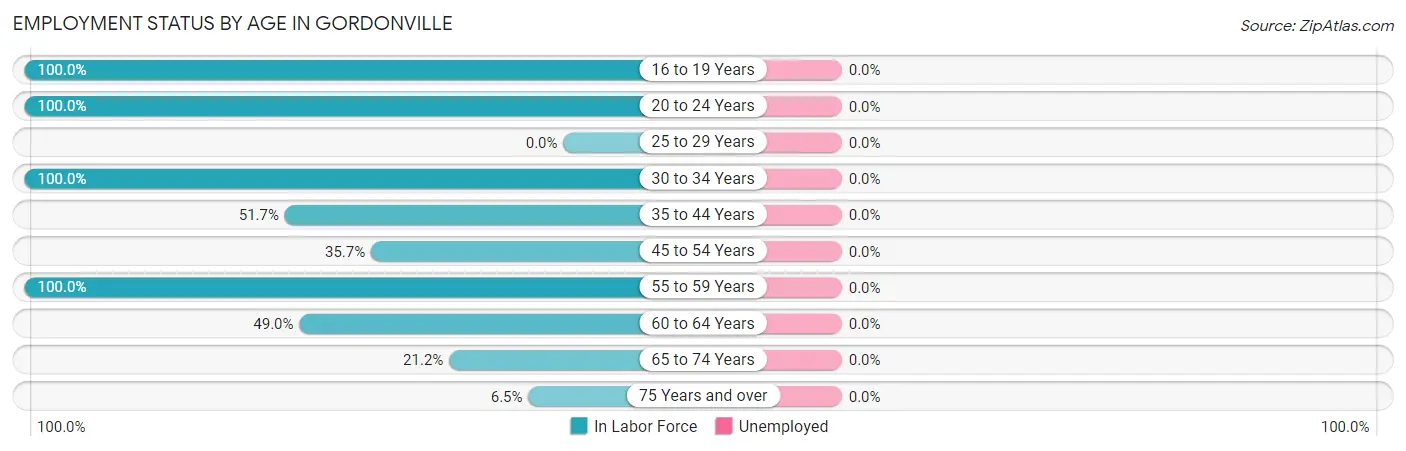
| Age Bracket | In Labor Force | Unemployed |
| 16 to 19 Years | 91 (100.0%) | 0 (0.0%) |
| 20 to 24 Years | 10 (100.0%) | 0 (0.0%) |
| 25 to 29 Years | 0 (0.0%) | 0 (0.0%) |
| 30 to 34 Years | 33 (100.0%) | 0 (0.0%) |
| 35 to 44 Years | 31 (51.7%) | 0 (0.0%) |
| 45 to 54 Years | 15 (35.7%) | 0 (0.0%) |
| 55 to 59 Years | 26 (100.0%) | 0 (0.0%) |
| 60 to 64 Years | 24 (49.0%) | 0 (0.0%) |
| 65 to 74 Years | 7 (21.2%) | 0 (0.0%) |
| 75 Years and over | 6 (6.5%) | 0 (0.0%) |
| Total | 243 (55.6%) | 0 (0.0%) |
Employment Status by Educational Attainment in Gordonville
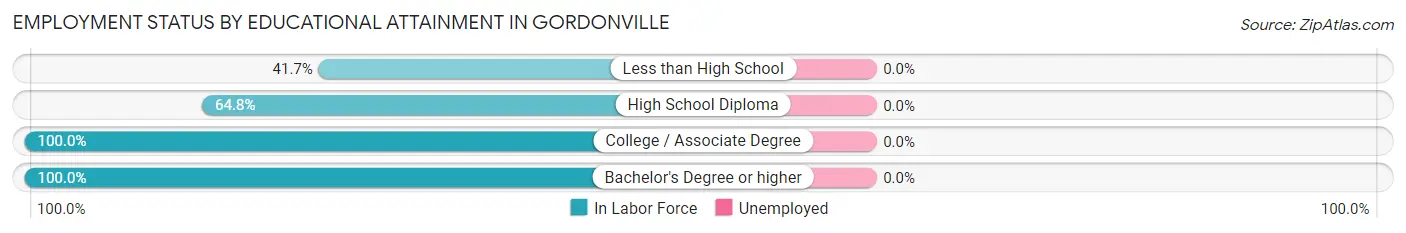
| Educational Attainment | In Labor Force | Unemployed |
| Less than High School | 40 (41.7%) | 0 (0.0%) |
| High School Diploma | 46 (64.8%) | 0 (0.0%) |
| College / Associate Degree | 26 (100.0%) | 0 (0.0%) |
| Bachelor's Degree or higher | 17 (100.0%) | 0 (0.0%) |
| Total | 129 (61.4%) | 0 (0.0%) |
Employment Occupations by Sex in Gordonville
Management, Business, Science and Arts Occupations
The most common Management, Business, Science and Arts occupations in Gordonville are Management (7 | 2.9%), Community & Social Service (6 | 2.5%), and Arts, Media & Entertainment (6 | 2.5%).
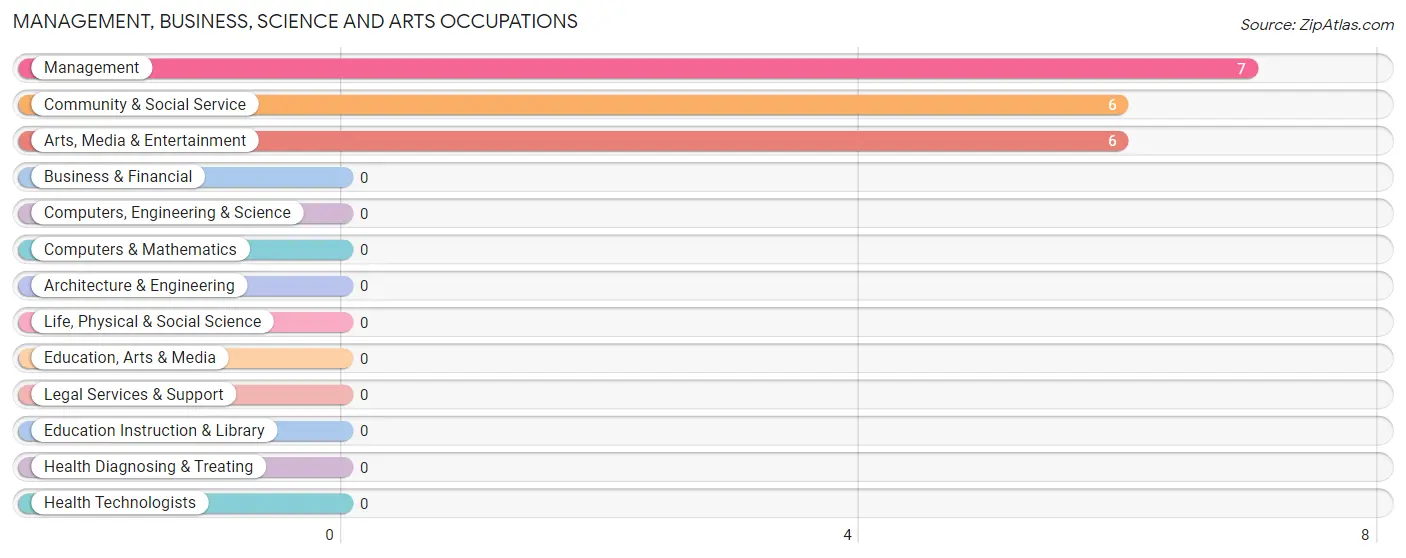
Management, Business, Science and Arts Occupations by Sex
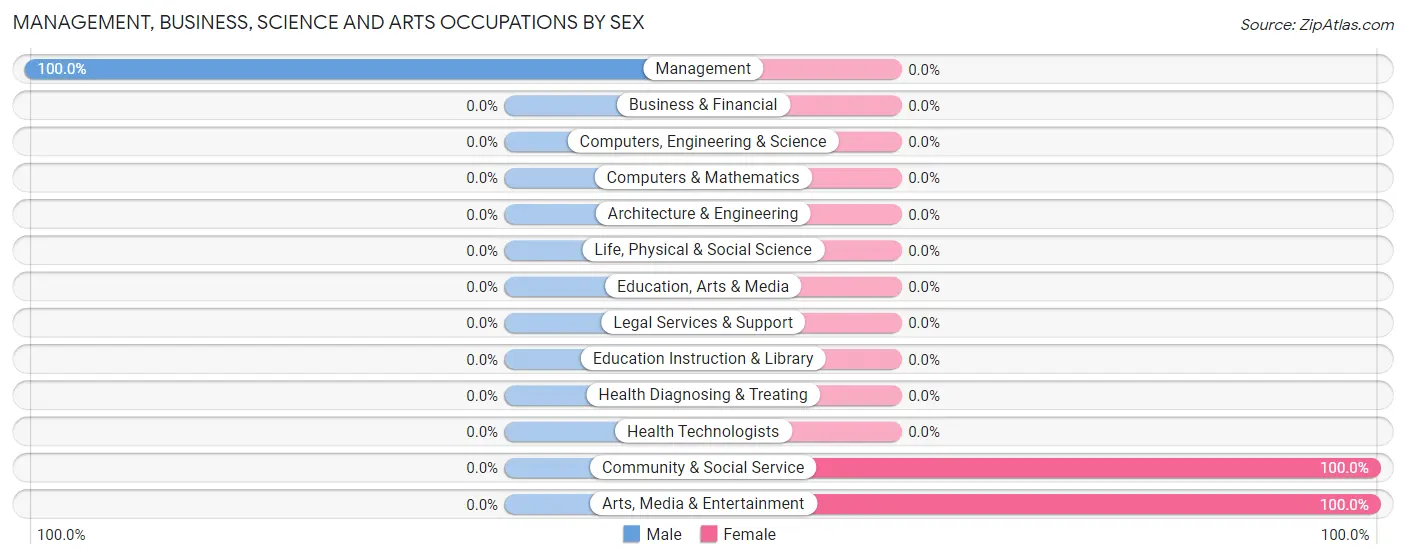
| Occupation | Male | Female |
| Management | 7 (100.0%) | 0 (0.0%) |
| Business & Financial | 0 (0.0%) | 0 (0.0%) |
| Computers, Engineering & Science | 0 (0.0%) | 0 (0.0%) |
| Computers & Mathematics | 0 (0.0%) | 0 (0.0%) |
| Architecture & Engineering | 0 (0.0%) | 0 (0.0%) |
| Life, Physical & Social Science | 0 (0.0%) | 0 (0.0%) |
| Community & Social Service | 0 (0.0%) | 6 (100.0%) |
| Education, Arts & Media | 0 (0.0%) | 0 (0.0%) |
| Legal Services & Support | 0 (0.0%) | 0 (0.0%) |
| Education Instruction & Library | 0 (0.0%) | 0 (0.0%) |
| Arts, Media & Entertainment | 0 (0.0%) | 6 (100.0%) |
| Health Diagnosing & Treating | 0 (0.0%) | 0 (0.0%) |
| Health Technologists | 0 (0.0%) | 0 (0.0%) |
| Total (Category) | 7 (53.8%) | 6 (46.2%) |
| Total (Overall) | 148 (60.9%) | 95 (39.1%) |
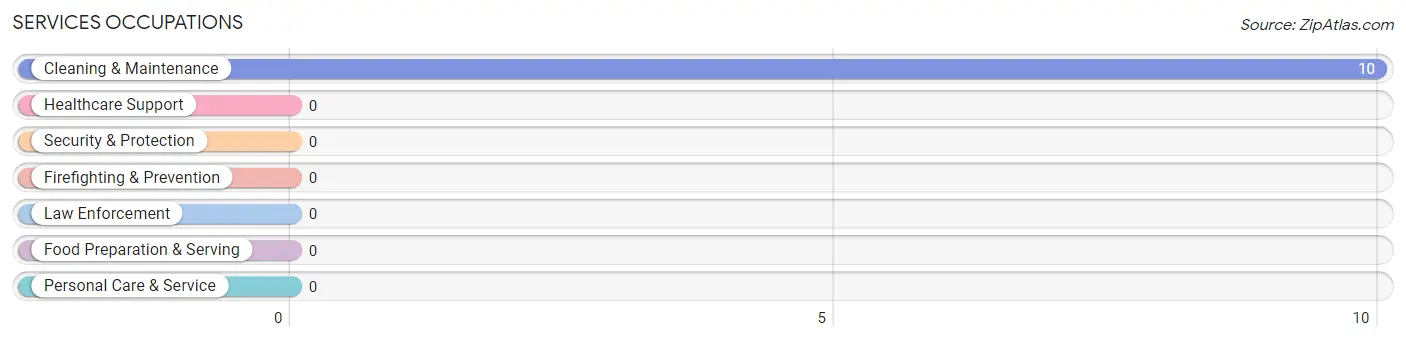
Services Occupations
The most common Services occupations in Gordonville are , and Cleaning & Maintenance (10 | 4.1%).
Services Occupations by Sex
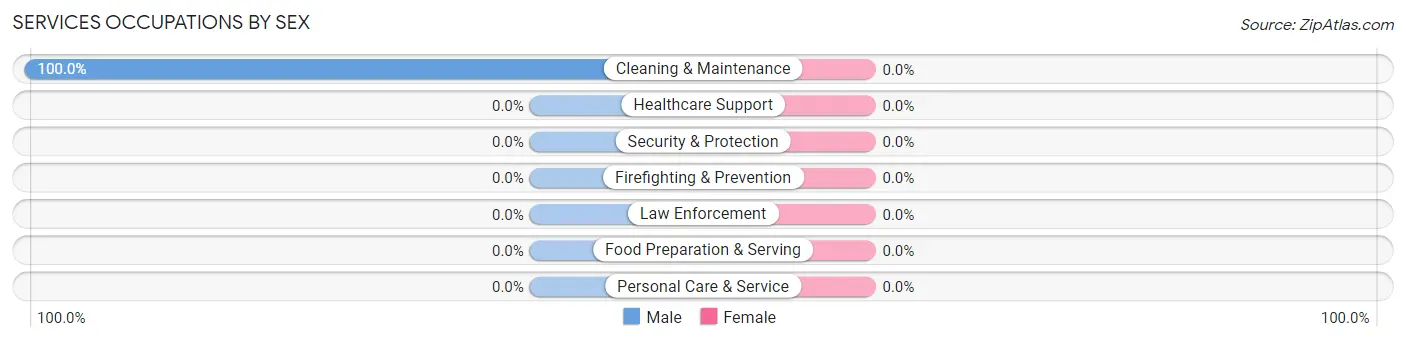
| Occupation | Male | Female |
| Healthcare Support | 0 (0.0%) | 0 (0.0%) |
| Security & Protection | 0 (0.0%) | 0 (0.0%) |
| Firefighting & Prevention | 0 (0.0%) | 0 (0.0%) |
| Law Enforcement | 0 (0.0%) | 0 (0.0%) |
| Food Preparation & Serving | 0 (0.0%) | 0 (0.0%) |
| Cleaning & Maintenance | 10 (100.0%) | 0 (0.0%) |
| Personal Care & Service | 0 (0.0%) | 0 (0.0%) |
| Total (Category) | 10 (100.0%) | 0 (0.0%) |
| Total (Overall) | 148 (60.9%) | 95 (39.1%) |
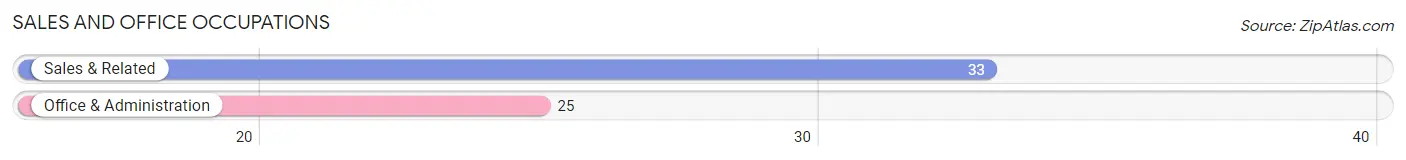
Sales and Office Occupations
The most common Sales and Office occupations in Gordonville are Sales & Related (33 | 13.6%), and Office & Administration (25 | 10.3%).
Sales and Office Occupations by Sex
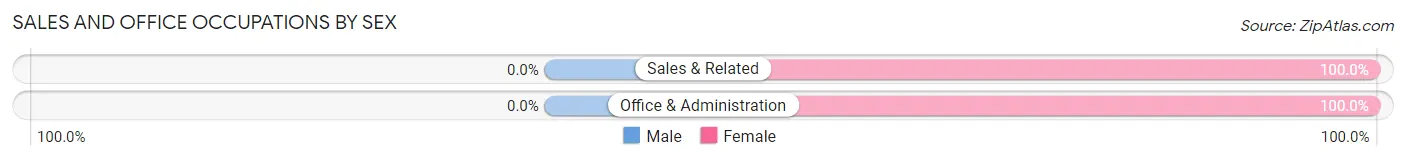
| Occupation | Male | Female |
| Sales & Related | 0 (0.0%) | 33 (100.0%) |
| Office & Administration | 0 (0.0%) | 25 (100.0%) |
| Total (Category) | 0 (0.0%) | 58 (100.0%) |
| Total (Overall) | 148 (60.9%) | 95 (39.1%) |
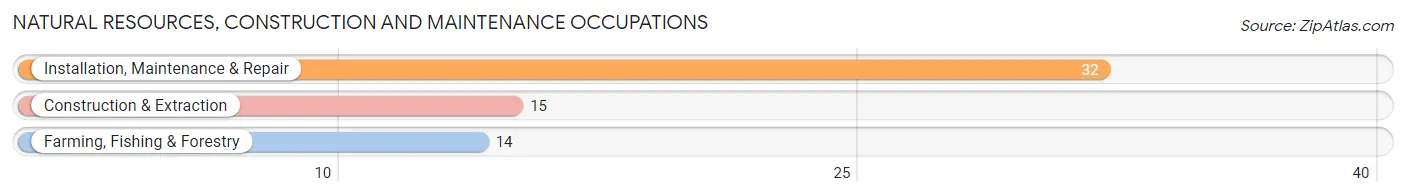
Natural Resources, Construction and Maintenance Occupations
The most common Natural Resources, Construction and Maintenance occupations in Gordonville are Installation, Maintenance & Repair (32 | 13.2%), Construction & Extraction (15 | 6.2%), and Farming, Fishing & Forestry (14 | 5.8%).
Natural Resources, Construction and Maintenance Occupations by Sex
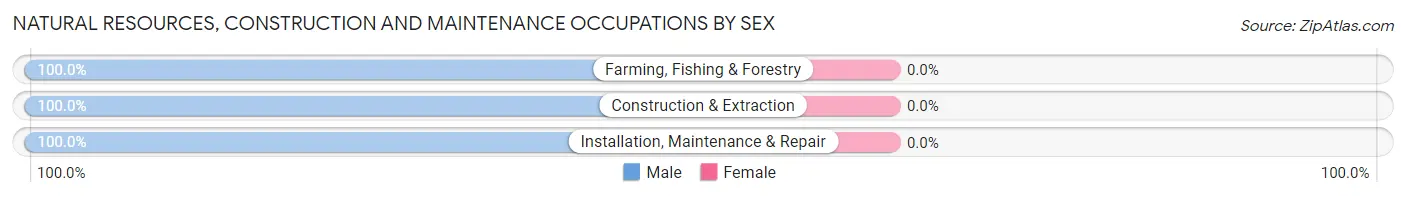
| Occupation | Male | Female |
| Farming, Fishing & Forestry | 14 (100.0%) | 0 (0.0%) |
| Construction & Extraction | 15 (100.0%) | 0 (0.0%) |
| Installation, Maintenance & Repair | 32 (100.0%) | 0 (0.0%) |
| Total (Category) | 61 (100.0%) | 0 (0.0%) |
| Total (Overall) | 148 (60.9%) | 95 (39.1%) |
Production, Transportation and Moving Occupations
The most common Production, Transportation and Moving occupations in Gordonville are Production (85 | 35.0%), and Transportation (16 | 6.6%).
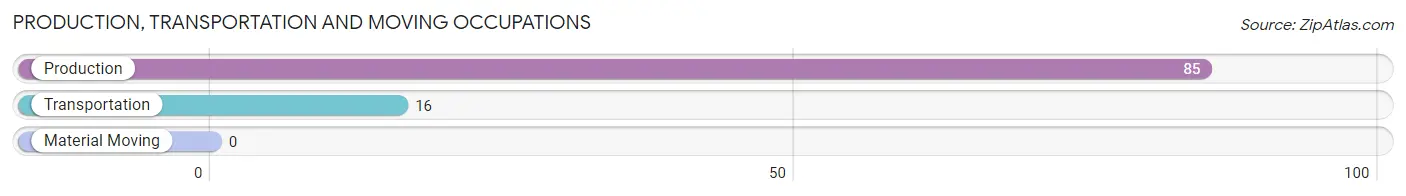
Production, Transportation and Moving Occupations by Sex
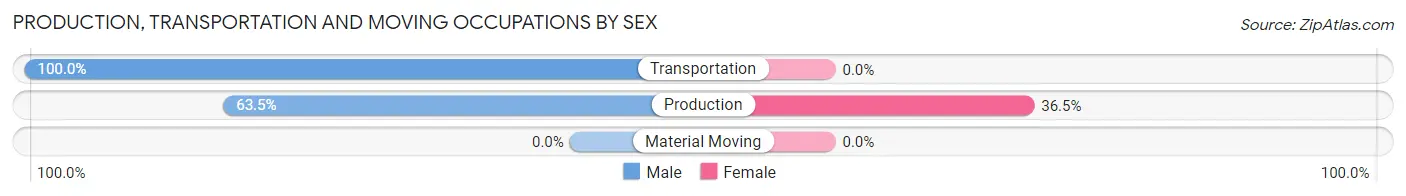
| Occupation | Male | Female |
| Production | 54 (63.5%) | 31 (36.5%) |
| Transportation | 16 (100.0%) | 0 (0.0%) |
| Material Moving | 0 (0.0%) | 0 (0.0%) |
| Total (Category) | 70 (69.3%) | 31 (30.7%) |
| Total (Overall) | 148 (60.9%) | 95 (39.1%) |
Employment Industries by Sex in Gordonville
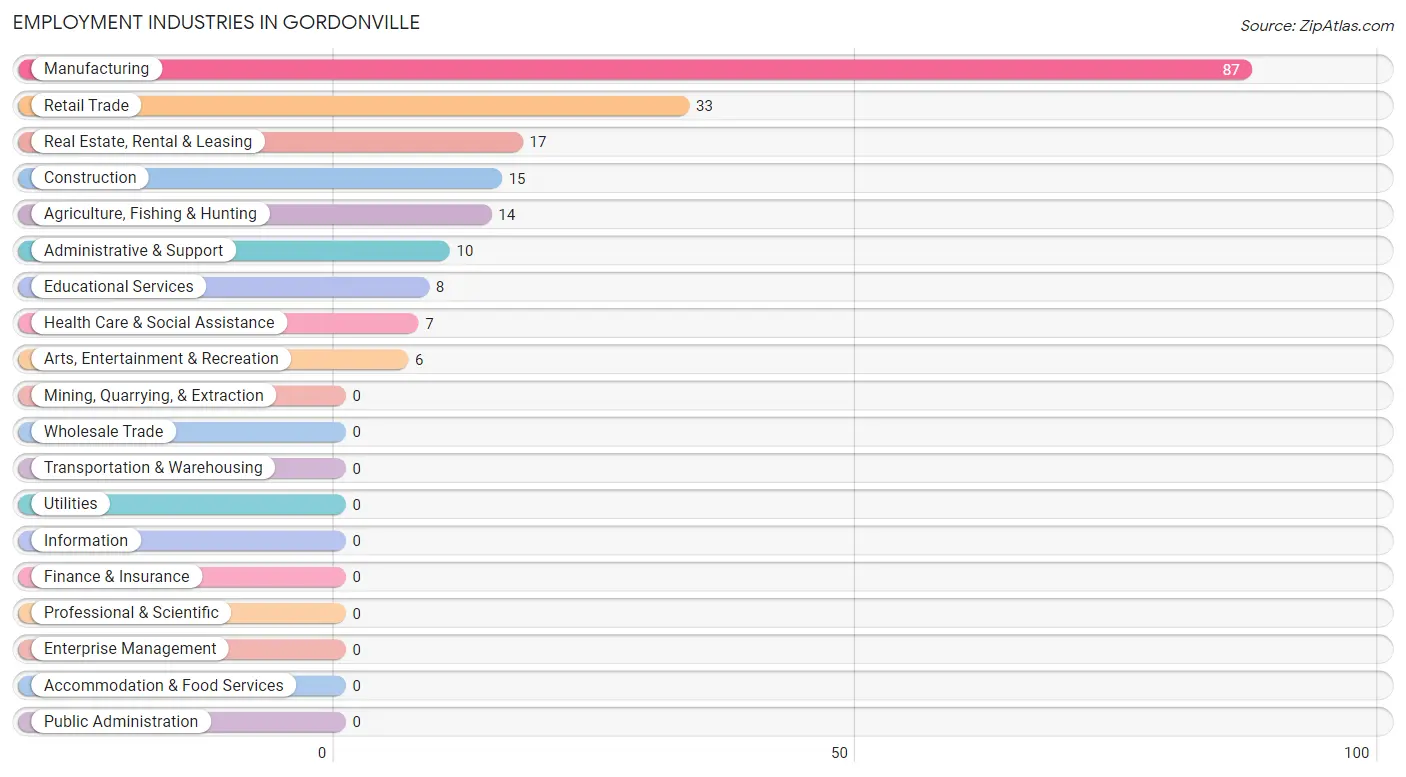
Employment Industries in Gordonville
The major employment industries in Gordonville include Manufacturing (87 | 35.8%), Retail Trade (33 | 13.6%), Real Estate, Rental & Leasing (17 | 7.0%), Construction (15 | 6.2%), and Agriculture, Fishing & Hunting (14 | 5.8%).
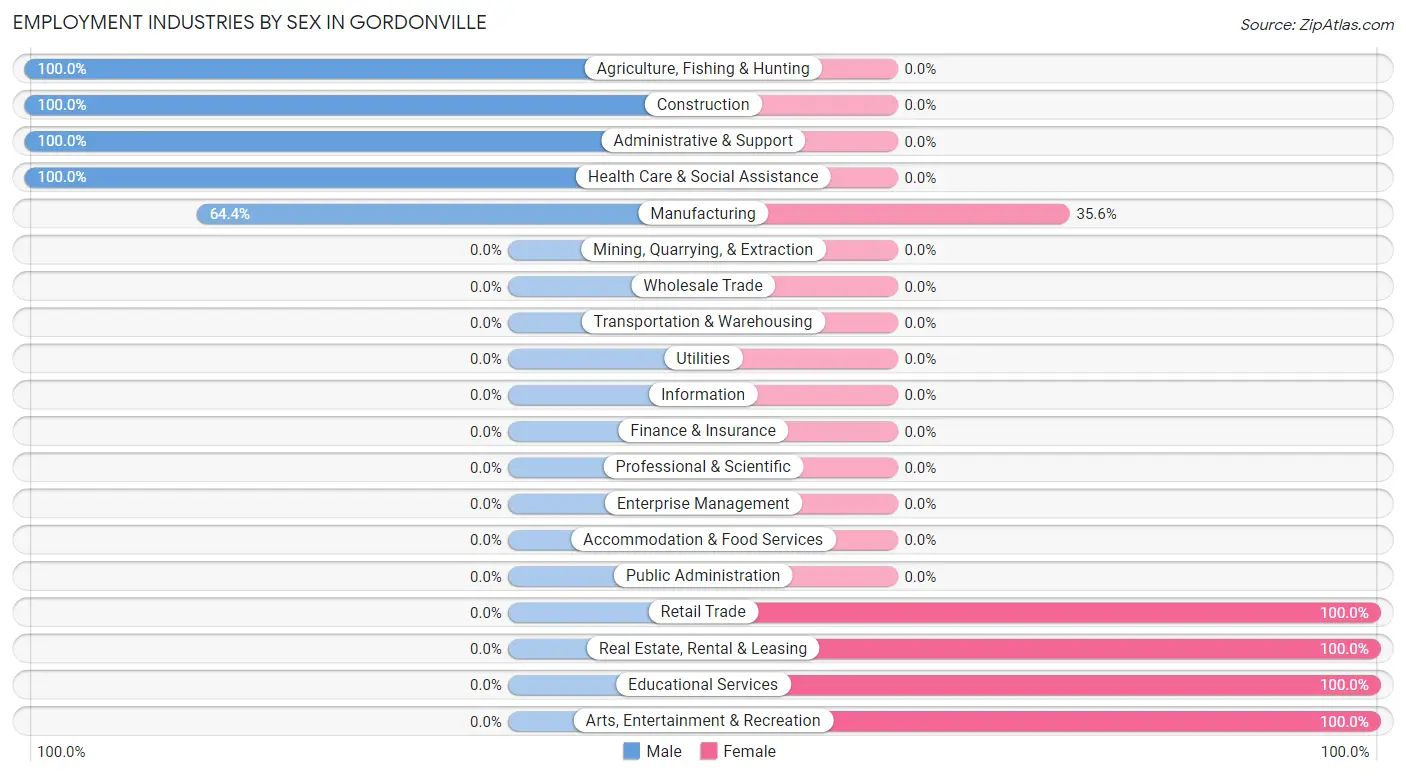
Employment Industries by Sex in Gordonville
The Gordonville industries that see more men than women are Agriculture, Fishing & Hunting (100.0%), Construction (100.0%), and Administrative & Support (100.0%), whereas the industries that tend to have a higher number of women are Retail Trade (100.0%), Real Estate, Rental & Leasing (100.0%), and Educational Services (100.0%).
| Industry | Male | Female |
| Agriculture, Fishing & Hunting | 14 (100.0%) | 0 (0.0%) |
| Mining, Quarrying, & Extraction | 0 (0.0%) | 0 (0.0%) |
| Construction | 15 (100.0%) | 0 (0.0%) |
| Manufacturing | 56 (64.4%) | 31 (35.6%) |
| Wholesale Trade | 0 (0.0%) | 0 (0.0%) |
| Retail Trade | 0 (0.0%) | 33 (100.0%) |
| Transportation & Warehousing | 0 (0.0%) | 0 (0.0%) |
| Utilities | 0 (0.0%) | 0 (0.0%) |
| Information | 0 (0.0%) | 0 (0.0%) |
| Finance & Insurance | 0 (0.0%) | 0 (0.0%) |
| Real Estate, Rental & Leasing | 0 (0.0%) | 17 (100.0%) |
| Professional & Scientific | 0 (0.0%) | 0 (0.0%) |
| Enterprise Management | 0 (0.0%) | 0 (0.0%) |
| Administrative & Support | 10 (100.0%) | 0 (0.0%) |
| Educational Services | 0 (0.0%) | 8 (100.0%) |
| Health Care & Social Assistance | 7 (100.0%) | 0 (0.0%) |
| Arts, Entertainment & Recreation | 0 (0.0%) | 6 (100.0%) |
| Accommodation & Food Services | 0 (0.0%) | 0 (0.0%) |
| Public Administration | 0 (0.0%) | 0 (0.0%) |
| Total | 148 (60.9%) | 95 (39.1%) |
Education in Gordonville
School Enrollment in Gordonville
The most common levels of schooling among the 199 students in Gordonville are middle school (106 | 53.3%), high school (33 | 16.6%), and nursery / preschool (30 | 15.1%).
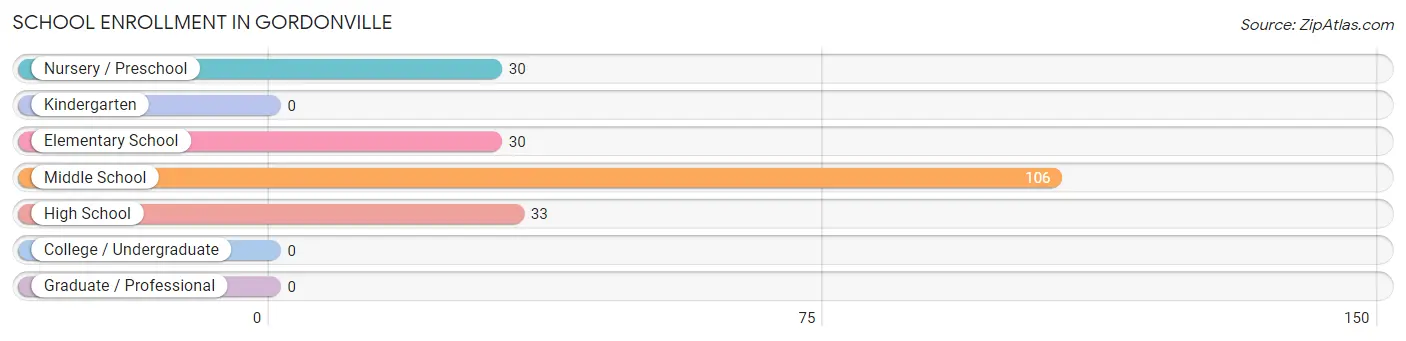
| School Level | # Students | % Students |
| Nursery / Preschool | 30 | 15.1% |
| Kindergarten | 0 | 0.0% |
| Elementary School | 30 | 15.1% |
| Middle School | 106 | 53.3% |
| High School | 33 | 16.6% |
| College / Undergraduate | 0 | 0.0% |
| Graduate / Professional | 0 | 0.0% |
| Total | 199 | 100.0% |
School Enrollment by Age by Funding Source in Gordonville
Out of a total of 199 students who are enrolled in schools in Gordonville, 135 (67.8%) attend a private institution, while the remaining 64 (32.2%) are enrolled in public schools. The age group of 10 to 14 year olds has the highest likelihood of being enrolled in private schools, with 58 (100.0% in the age bracket) enrolled. Conversely, the age group of 15 to 17 year olds has the lowest likelihood of being enrolled in a private school, with 34 (50.7% in the age bracket) attending a public institution.
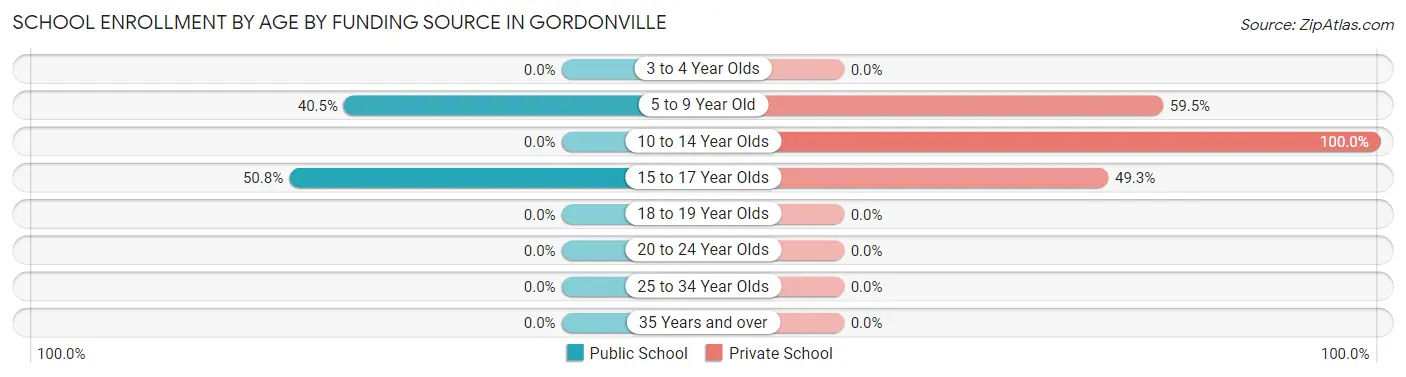
| Age Bracket | Public School | Private School |
| 3 to 4 Year Olds | 0 (0.0%) | 0 (0.0%) |
| 5 to 9 Year Old | 30 (40.5%) | 44 (59.5%) |
| 10 to 14 Year Olds | 0 (0.0%) | 58 (100.0%) |
| 15 to 17 Year Olds | 34 (50.7%) | 33 (49.2%) |
| 18 to 19 Year Olds | 0 (0.0%) | 0 (0.0%) |
| 20 to 24 Year Olds | 0 (0.0%) | 0 (0.0%) |
| 25 to 34 Year Olds | 0 (0.0%) | 0 (0.0%) |
| 35 Years and over | 0 (0.0%) | 0 (0.0%) |
| Total | 64 (32.2%) | 135 (67.8%) |
Educational Attainment by Field of Study in Gordonville
Communications (17 | 54.8%), education (7 | 22.6%), and liberal arts & history (7 | 22.6%) are the most common fields of study among 31 individuals in Gordonville who have obtained a bachelor's degree or higher.
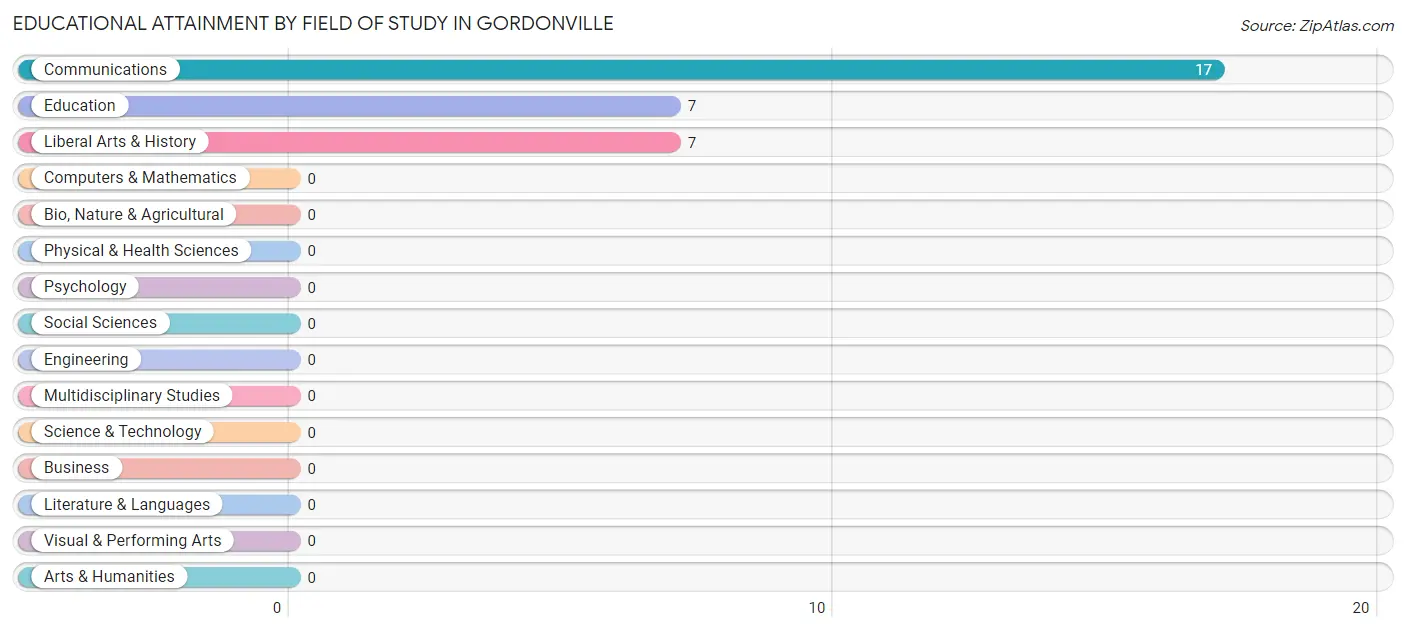
| Field of Study | # Graduates | % Graduates |
| Computers & Mathematics | 0 | 0.0% |
| Bio, Nature & Agricultural | 0 | 0.0% |
| Physical & Health Sciences | 0 | 0.0% |
| Psychology | 0 | 0.0% |
| Social Sciences | 0 | 0.0% |
| Engineering | 0 | 0.0% |
| Multidisciplinary Studies | 0 | 0.0% |
| Science & Technology | 0 | 0.0% |
| Business | 0 | 0.0% |
| Education | 7 | 22.6% |
| Literature & Languages | 0 | 0.0% |
| Liberal Arts & History | 7 | 22.6% |
| Visual & Performing Arts | 0 | 0.0% |
| Communications | 17 | 54.8% |
| Arts & Humanities | 0 | 0.0% |
| Total | 31 | 100.0% |
Transportation & Commute in Gordonville
Vehicle Availability by Sex in Gordonville
The most prevalent vehicle ownership categories in Gordonville are males with no vehicle (84, accounting for 56.8%) and females with no vehicle (32, making up 94.4%).
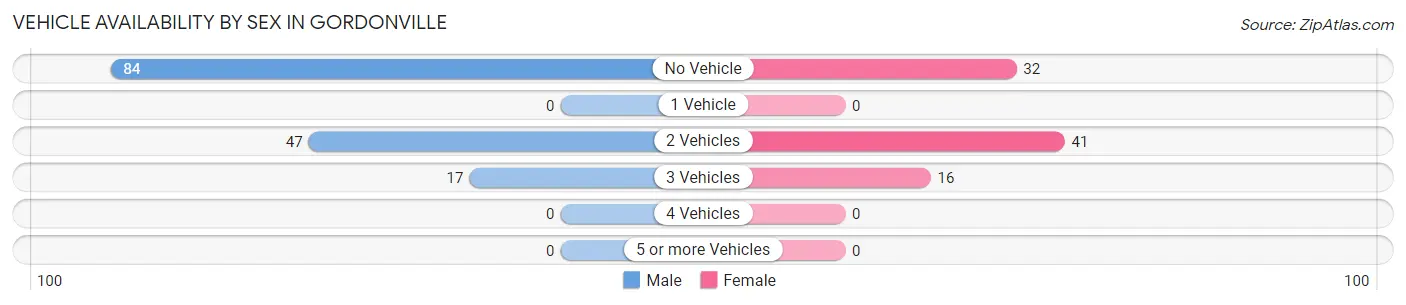
| Vehicles Available | Male | Female |
| No Vehicle | 84 (56.8%) | 32 (36.0%) |
| 1 Vehicle | 0 (0.0%) | 0 (0.0%) |
| 2 Vehicles | 47 (31.8%) | 41 (46.1%) |
| 3 Vehicles | 17 (11.5%) | 16 (18.0%) |
| 4 Vehicles | 0 (0.0%) | 0 (0.0%) |
| 5 or more Vehicles | 0 (0.0%) | 0 (0.0%) |
| Total | 148 (100.0%) | 89 (100.0%) |
Commute Time in Gordonville
The most frequently occuring commute durations in Gordonville are 15 to 19 minutes (70 commuters, 29.5%), 25 to 29 minutes (62 commuters, 26.2%), and 5 to 9 minutes (24 commuters, 10.1%).
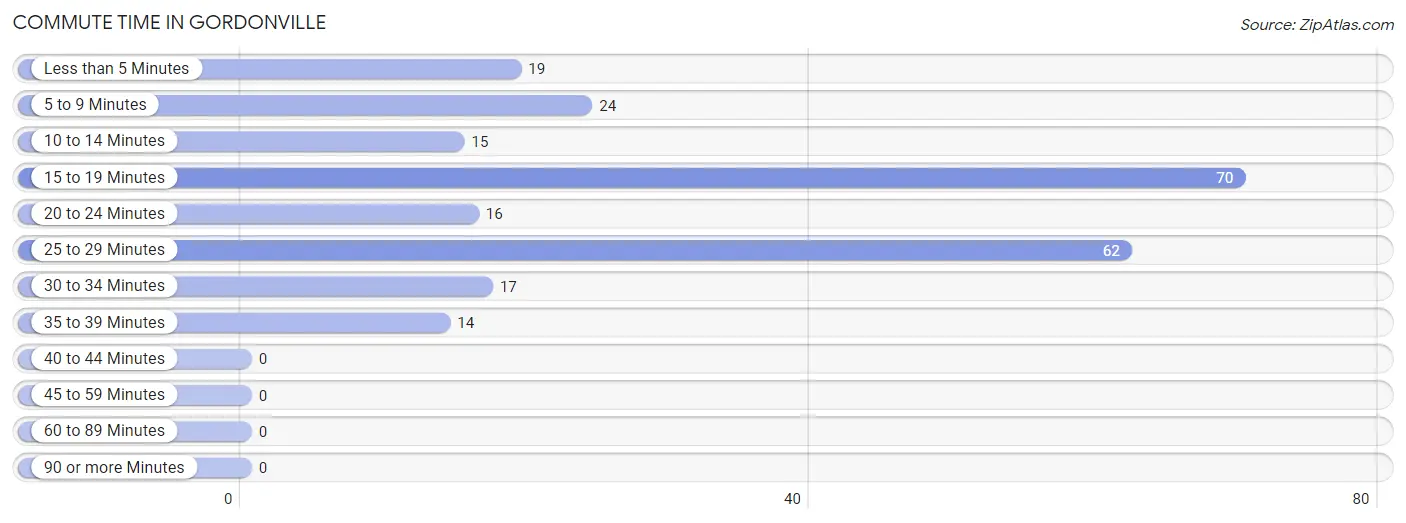
| Commute Time | # Commuters | % Commuters |
| Less than 5 Minutes | 19 | 8.0% |
| 5 to 9 Minutes | 24 | 10.1% |
| 10 to 14 Minutes | 15 | 6.3% |
| 15 to 19 Minutes | 70 | 29.5% |
| 20 to 24 Minutes | 16 | 6.8% |
| 25 to 29 Minutes | 62 | 26.2% |
| 30 to 34 Minutes | 17 | 7.2% |
| 35 to 39 Minutes | 14 | 5.9% |
| 40 to 44 Minutes | 0 | 0.0% |
| 45 to 59 Minutes | 0 | 0.0% |
| 60 to 89 Minutes | 0 | 0.0% |
| 90 or more Minutes | 0 | 0.0% |
Commute Time by Sex in Gordonville
The most common commute times in Gordonville are 25 to 29 minutes (62 commuters, 41.9%) for males and 15 to 19 minutes (41 commuters, 46.1%) for females.
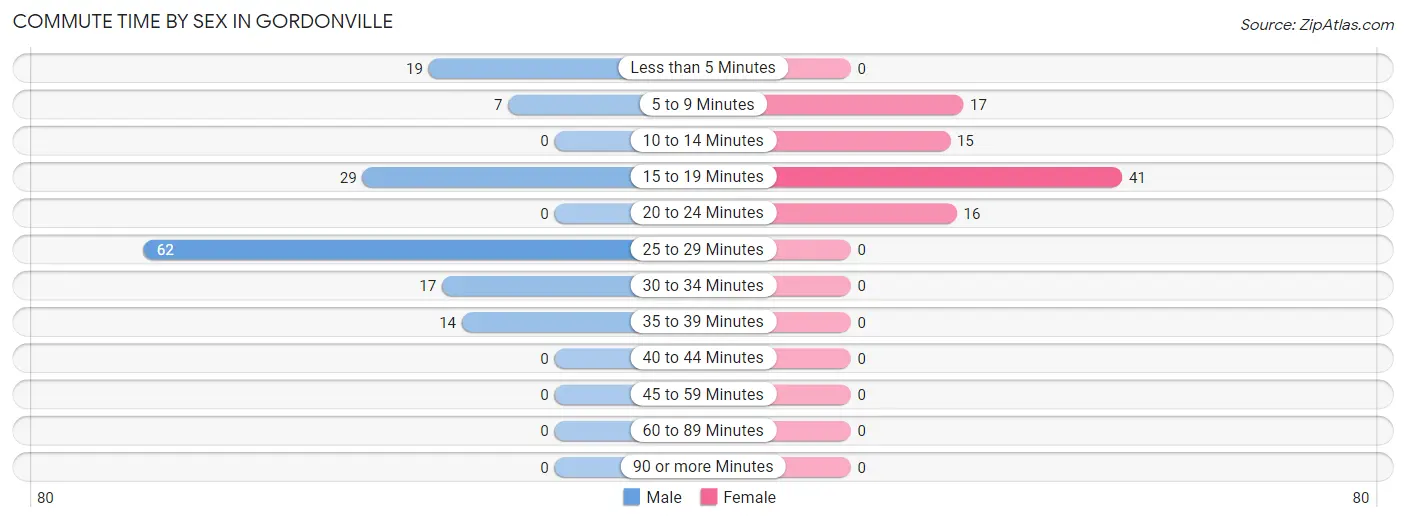
| Commute Time | Male | Female |
| Less than 5 Minutes | 19 (12.8%) | 0 (0.0%) |
| 5 to 9 Minutes | 7 (4.7%) | 17 (19.1%) |
| 10 to 14 Minutes | 0 (0.0%) | 15 (16.9%) |
| 15 to 19 Minutes | 29 (19.6%) | 41 (46.1%) |
| 20 to 24 Minutes | 0 (0.0%) | 16 (18.0%) |
| 25 to 29 Minutes | 62 (41.9%) | 0 (0.0%) |
| 30 to 34 Minutes | 17 (11.5%) | 0 (0.0%) |
| 35 to 39 Minutes | 14 (9.5%) | 0 (0.0%) |
| 40 to 44 Minutes | 0 (0.0%) | 0 (0.0%) |
| 45 to 59 Minutes | 0 (0.0%) | 0 (0.0%) |
| 60 to 89 Minutes | 0 (0.0%) | 0 (0.0%) |
| 90 or more Minutes | 0 (0.0%) | 0 (0.0%) |
Time of Departure to Work by Sex in Gordonville
The most frequent times of departure to work in Gordonville are 12:00 AM to 4:59 AM (38, 25.7%) for males and 8:00 AM to 8:29 AM (50, 56.2%) for females.
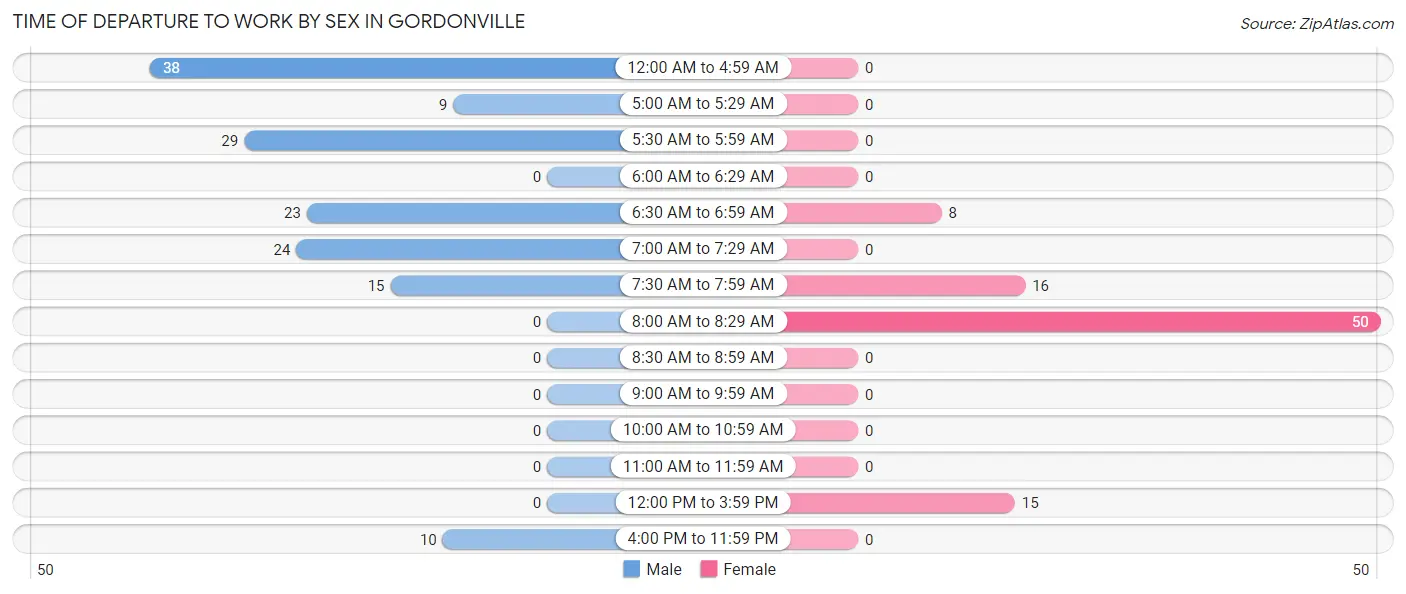
| Time of Departure | Male | Female |
| 12:00 AM to 4:59 AM | 38 (25.7%) | 0 (0.0%) |
| 5:00 AM to 5:29 AM | 9 (6.1%) | 0 (0.0%) |
| 5:30 AM to 5:59 AM | 29 (19.6%) | 0 (0.0%) |
| 6:00 AM to 6:29 AM | 0 (0.0%) | 0 (0.0%) |
| 6:30 AM to 6:59 AM | 23 (15.5%) | 8 (9.0%) |
| 7:00 AM to 7:29 AM | 24 (16.2%) | 0 (0.0%) |
| 7:30 AM to 7:59 AM | 15 (10.1%) | 16 (18.0%) |
| 8:00 AM to 8:29 AM | 0 (0.0%) | 50 (56.2%) |
| 8:30 AM to 8:59 AM | 0 (0.0%) | 0 (0.0%) |
| 9:00 AM to 9:59 AM | 0 (0.0%) | 0 (0.0%) |
| 10:00 AM to 10:59 AM | 0 (0.0%) | 0 (0.0%) |
| 11:00 AM to 11:59 AM | 0 (0.0%) | 0 (0.0%) |
| 12:00 PM to 3:59 PM | 0 (0.0%) | 15 (16.9%) |
| 4:00 PM to 11:59 PM | 10 (6.8%) | 0 (0.0%) |
| Total | 148 (100.0%) | 89 (100.0%) |
Housing Occupancy in Gordonville
Occupancy by Ownership in Gordonville
Of the total 197 dwellings in Gordonville, owner-occupied units account for 173 (87.8%), while renter-occupied units make up 24 (12.2%).
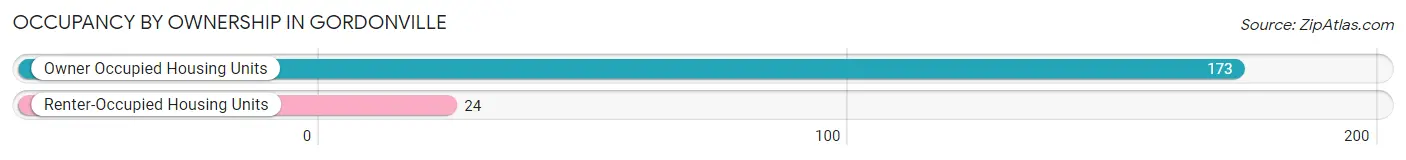
| Occupancy | # Housing Units | % Housing Units |
| Owner Occupied Housing Units | 173 | 87.8% |
| Renter-Occupied Housing Units | 24 | 12.2% |
| Total Occupied Housing Units | 197 | 100.0% |
Occupancy by Household Size in Gordonville

| Household Size | # Housing Units | % Housing Units |
| 1-Person Household | 56 | 28.4% |
| 2-Person Household | 86 | 43.6% |
| 3-Person Household | 0 | 0.0% |
| 4+ Person Household | 55 | 27.9% |
| Total Housing Units | 197 | 100.0% |
Occupancy by Ownership by Household Size in Gordonville
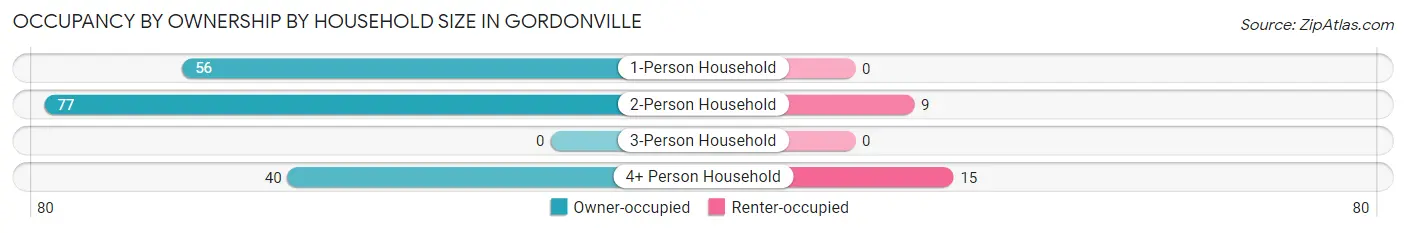
| Household Size | Owner-occupied | Renter-occupied |
| 1-Person Household | 56 (100.0%) | 0 (0.0%) |
| 2-Person Household | 77 (89.5%) | 9 (10.5%) |
| 3-Person Household | 0 (0.0%) | 0 (0.0%) |
| 4+ Person Household | 40 (72.7%) | 15 (27.3%) |
| Total Housing Units | 173 (87.8%) | 24 (12.2%) |
Occupancy by Educational Attainment in Gordonville
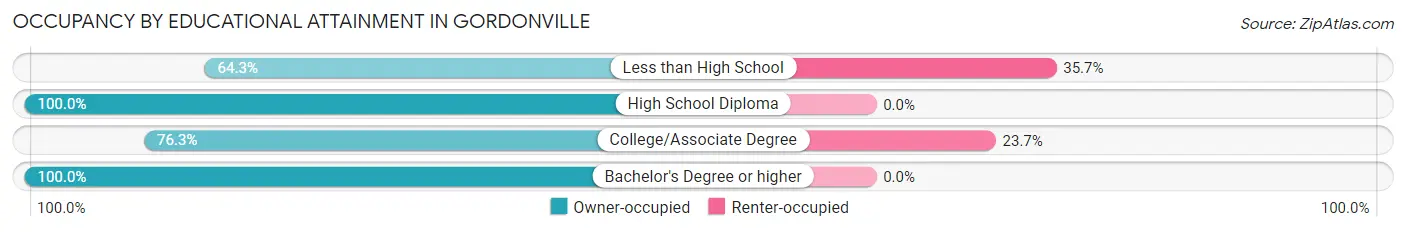
| Household Size | Owner-occupied | Renter-occupied |
| Less than High School | 27 (64.3%) | 15 (35.7%) |
| High School Diploma | 86 (100.0%) | 0 (0.0%) |
| College/Associate Degree | 29 (76.3%) | 9 (23.7%) |
| Bachelor's Degree or higher | 31 (100.0%) | 0 (0.0%) |
Occupancy by Age of Householder in Gordonville
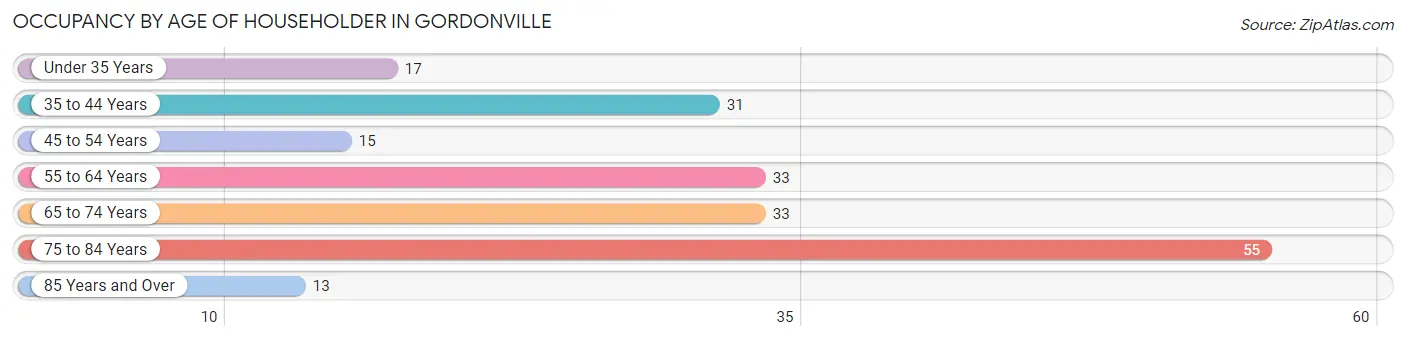
| Age Bracket | # Households | % Households |
| Under 35 Years | 17 | 8.6% |
| 35 to 44 Years | 31 | 15.7% |
| 45 to 54 Years | 15 | 7.6% |
| 55 to 64 Years | 33 | 16.8% |
| 65 to 74 Years | 33 | 16.8% |
| 75 to 84 Years | 55 | 27.9% |
| 85 Years and Over | 13 | 6.6% |
| Total | 197 | 100.0% |
Housing Finances in Gordonville
Median Income by Occupancy in Gordonville
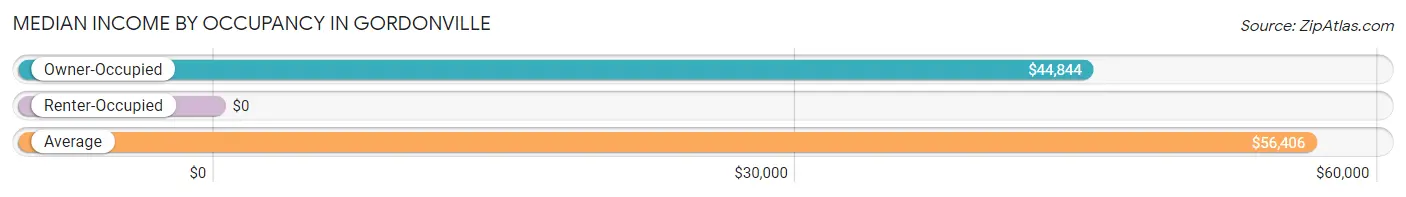
| Occupancy Type | # Households | Median Income |
| Owner-Occupied | 173 (87.8%) | $44,844 |
| Renter-Occupied | 24 (12.2%) | $0 |
| Average | 197 (100.0%) | $56,406 |
Occupancy by Householder Income Bracket in Gordonville
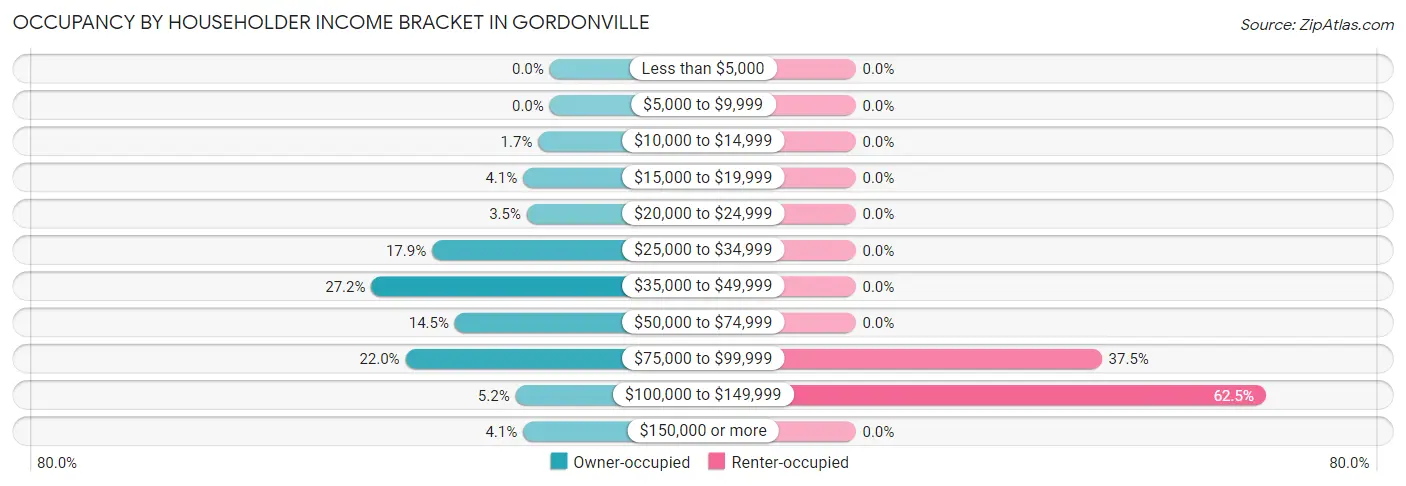
| Income Bracket | Owner-occupied | Renter-occupied |
| Less than $5,000 | 0 (0.0%) | 0 (0.0%) |
| $5,000 to $9,999 | 0 (0.0%) | 0 (0.0%) |
| $10,000 to $14,999 | 3 (1.7%) | 0 (0.0%) |
| $15,000 to $19,999 | 7 (4.1%) | 0 (0.0%) |
| $20,000 to $24,999 | 6 (3.5%) | 0 (0.0%) |
| $25,000 to $34,999 | 31 (17.9%) | 0 (0.0%) |
| $35,000 to $49,999 | 47 (27.2%) | 0 (0.0%) |
| $50,000 to $74,999 | 25 (14.4%) | 0 (0.0%) |
| $75,000 to $99,999 | 38 (22.0%) | 9 (37.5%) |
| $100,000 to $149,999 | 9 (5.2%) | 15 (62.5%) |
| $150,000 or more | 7 (4.1%) | 0 (0.0%) |
| Total | 173 (100.0%) | 24 (100.0%) |
Monthly Housing Cost Tiers in Gordonville
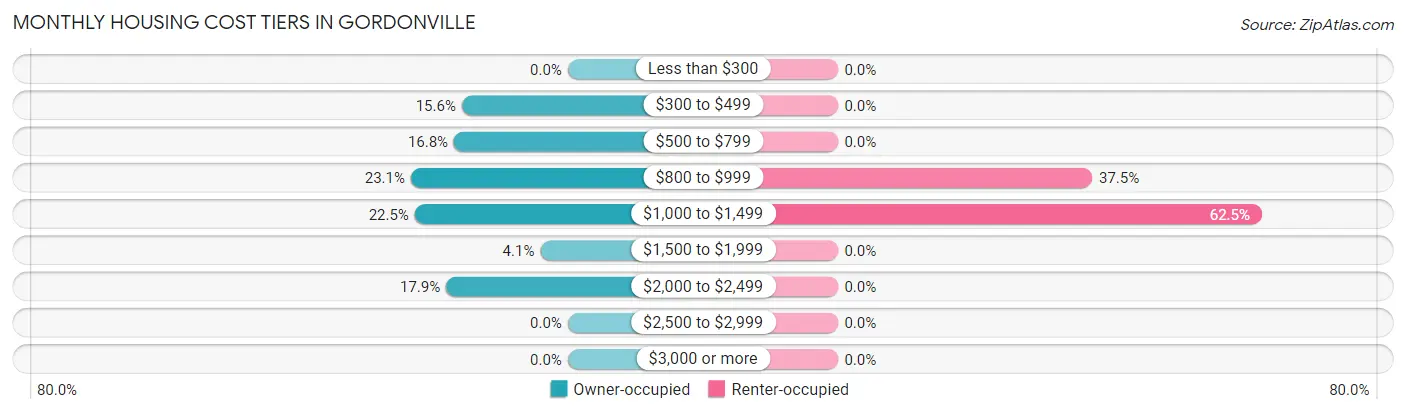
| Monthly Cost | Owner-occupied | Renter-occupied |
| Less than $300 | 0 (0.0%) | 0 (0.0%) |
| $300 to $499 | 27 (15.6%) | 0 (0.0%) |
| $500 to $799 | 29 (16.8%) | 0 (0.0%) |
| $800 to $999 | 40 (23.1%) | 9 (37.5%) |
| $1,000 to $1,499 | 39 (22.5%) | 15 (62.5%) |
| $1,500 to $1,999 | 7 (4.1%) | 0 (0.0%) |
| $2,000 to $2,499 | 31 (17.9%) | 0 (0.0%) |
| $2,500 to $2,999 | 0 (0.0%) | 0 (0.0%) |
| $3,000 or more | 0 (0.0%) | 0 (0.0%) |
| Total | 173 (100.0%) | 24 (100.0%) |
Physical Housing Characteristics in Gordonville
Housing Structures in Gordonville
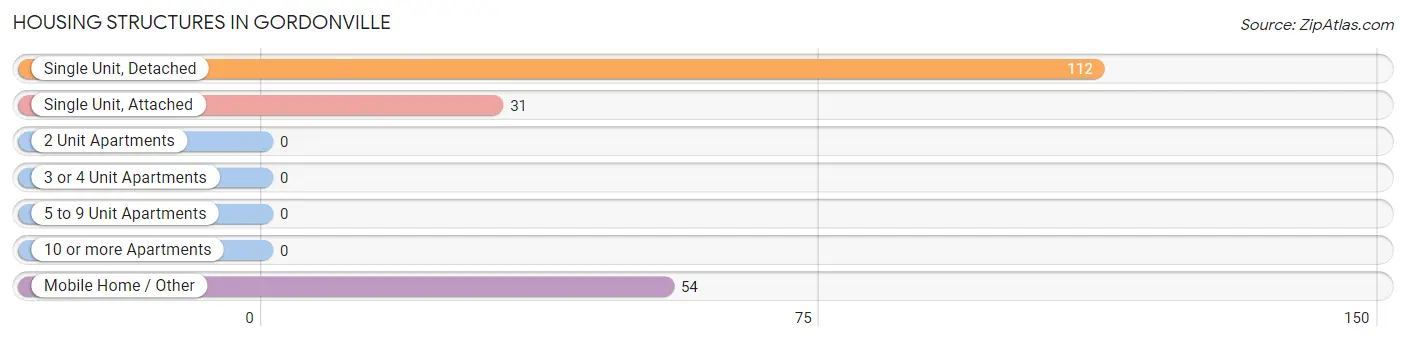
| Structure Type | # Housing Units | % Housing Units |
| Single Unit, Detached | 112 | 56.9% |
| Single Unit, Attached | 31 | 15.7% |
| 2 Unit Apartments | 0 | 0.0% |
| 3 or 4 Unit Apartments | 0 | 0.0% |
| 5 to 9 Unit Apartments | 0 | 0.0% |
| 10 or more Apartments | 0 | 0.0% |
| Mobile Home / Other | 54 | 27.4% |
| Total | 197 | 100.0% |
Housing Structures by Occupancy in Gordonville
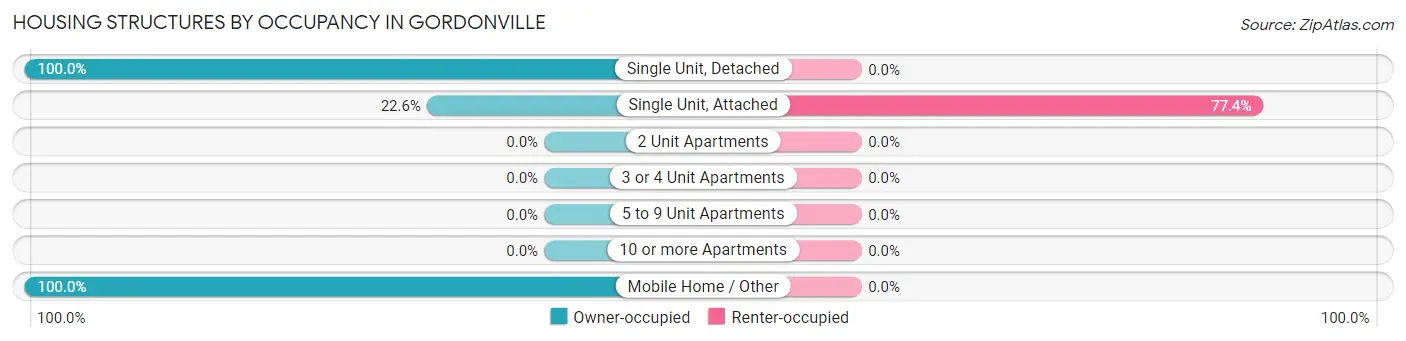
| Structure Type | Owner-occupied | Renter-occupied |
| Single Unit, Detached | 112 (100.0%) | 0 (0.0%) |
| Single Unit, Attached | 7 (22.6%) | 24 (77.4%) |
| 2 Unit Apartments | 0 (0.0%) | 0 (0.0%) |
| 3 or 4 Unit Apartments | 0 (0.0%) | 0 (0.0%) |
| 5 to 9 Unit Apartments | 0 (0.0%) | 0 (0.0%) |
| 10 or more Apartments | 0 (0.0%) | 0 (0.0%) |
| Mobile Home / Other | 54 (100.0%) | 0 (0.0%) |
| Total | 173 (87.8%) | 24 (12.2%) |
Housing Structures by Number of Rooms in Gordonville
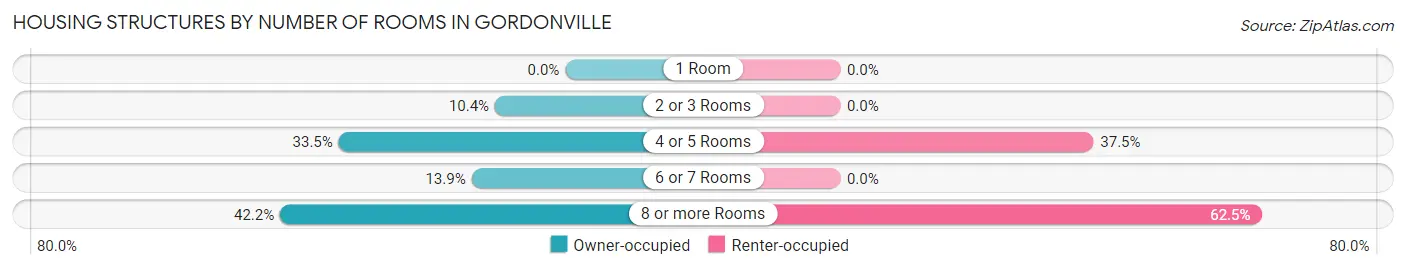
| Number of Rooms | Owner-occupied | Renter-occupied |
| 1 Room | 0 (0.0%) | 0 (0.0%) |
| 2 or 3 Rooms | 18 (10.4%) | 0 (0.0%) |
| 4 or 5 Rooms | 58 (33.5%) | 9 (37.5%) |
| 6 or 7 Rooms | 24 (13.9%) | 0 (0.0%) |
| 8 or more Rooms | 73 (42.2%) | 15 (62.5%) |
| Total | 173 (100.0%) | 24 (100.0%) |
Housing Structure by Heating Type in Gordonville
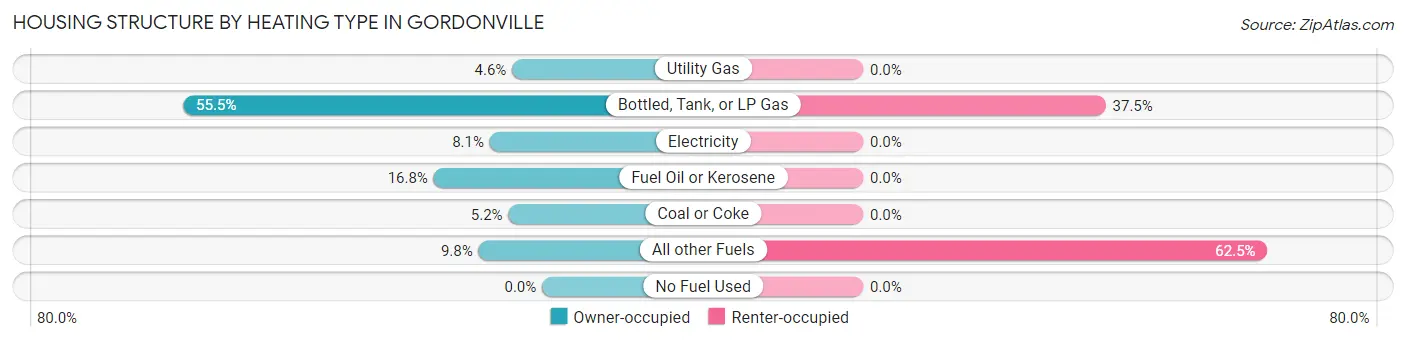
| Heating Type | Owner-occupied | Renter-occupied |
| Utility Gas | 8 (4.6%) | 0 (0.0%) |
| Bottled, Tank, or LP Gas | 96 (55.5%) | 9 (37.5%) |
| Electricity | 14 (8.1%) | 0 (0.0%) |
| Fuel Oil or Kerosene | 29 (16.8%) | 0 (0.0%) |
| Coal or Coke | 9 (5.2%) | 0 (0.0%) |
| All other Fuels | 17 (9.8%) | 15 (62.5%) |
| No Fuel Used | 0 (0.0%) | 0 (0.0%) |
| Total | 173 (100.0%) | 24 (100.0%) |
Household Vehicle Usage in Gordonville
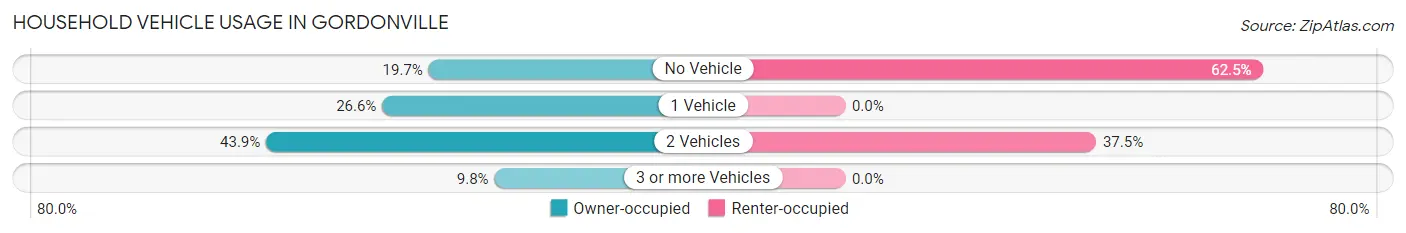
| Vehicles per Household | Owner-occupied | Renter-occupied |
| No Vehicle | 34 (19.7%) | 15 (62.5%) |
| 1 Vehicle | 46 (26.6%) | 0 (0.0%) |
| 2 Vehicles | 76 (43.9%) | 9 (37.5%) |
| 3 or more Vehicles | 17 (9.8%) | 0 (0.0%) |
| Total | 173 (100.0%) | 24 (100.0%) |
Real Estate & Mortgages in Gordonville
Real Estate and Mortgage Overview in Gordonville
| Characteristic | Without Mortgage | With Mortgage |
| Housing Units | 96 | 77 |
| Median Property Value | - | - |
| Median Household Income | $35,313 | $7 |
| Monthly Housing Costs | $765 | $0 |
| Real Estate Taxes | $2,500 | $0 |
Property Value by Mortgage Status in Gordonville
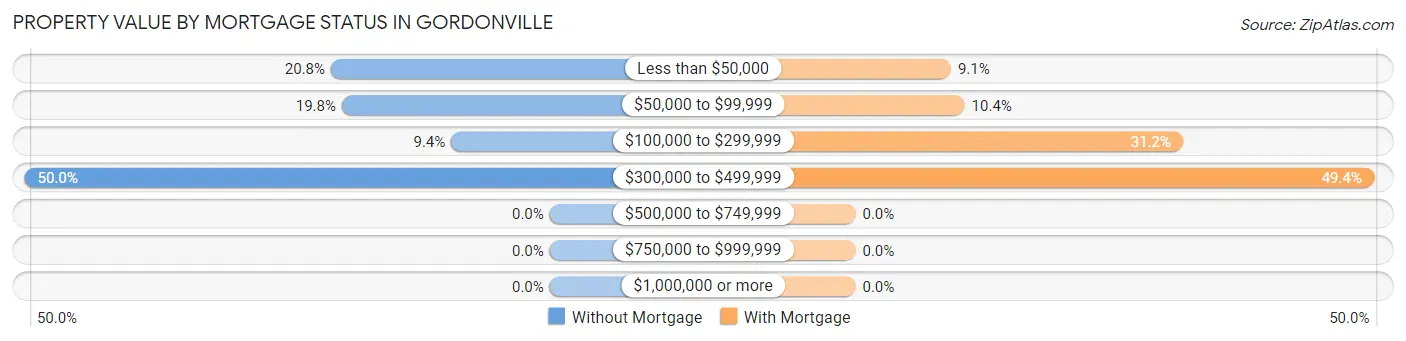
| Property Value | Without Mortgage | With Mortgage |
| Less than $50,000 | 20 (20.8%) | 7 (9.1%) |
| $50,000 to $99,999 | 19 (19.8%) | 8 (10.4%) |
| $100,000 to $299,999 | 9 (9.4%) | 24 (31.2%) |
| $300,000 to $499,999 | 48 (50.0%) | 38 (49.3%) |
| $500,000 to $749,999 | 0 (0.0%) | 0 (0.0%) |
| $750,000 to $999,999 | 0 (0.0%) | 0 (0.0%) |
| $1,000,000 or more | 0 (0.0%) | 0 (0.0%) |
| Total | 96 (100.0%) | 77 (100.0%) |
Household Income by Mortgage Status in Gordonville
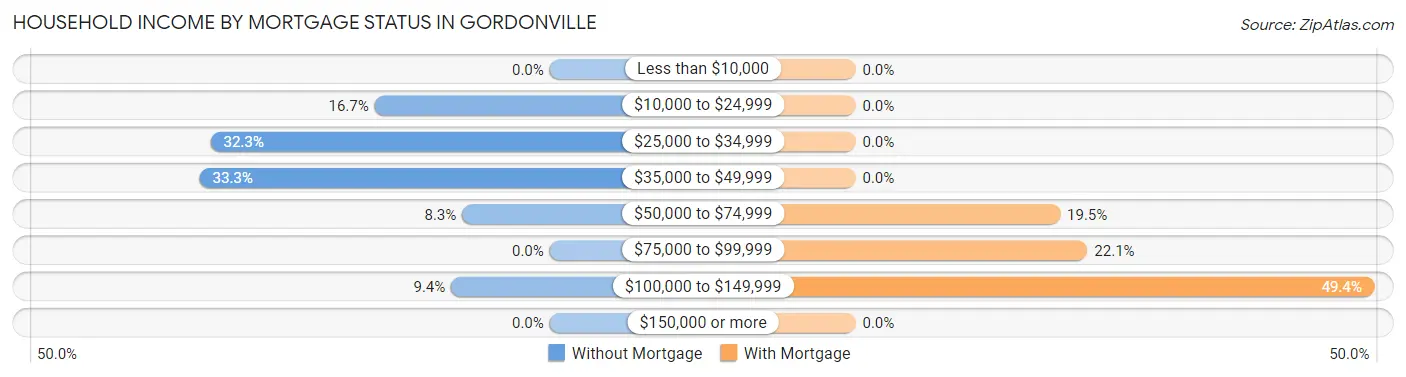
| Household Income | Without Mortgage | With Mortgage |
| Less than $10,000 | 0 (0.0%) | 0 (0.0%) |
| $10,000 to $24,999 | 16 (16.7%) | 0 (0.0%) |
| $25,000 to $34,999 | 31 (32.3%) | 0 (0.0%) |
| $35,000 to $49,999 | 32 (33.3%) | 0 (0.0%) |
| $50,000 to $74,999 | 8 (8.3%) | 15 (19.5%) |
| $75,000 to $99,999 | 0 (0.0%) | 17 (22.1%) |
| $100,000 to $149,999 | 9 (9.4%) | 38 (49.3%) |
| $150,000 or more | 0 (0.0%) | 0 (0.0%) |
| Total | 96 (100.0%) | 77 (100.0%) |
Property Value to Household Income Ratio in Gordonville
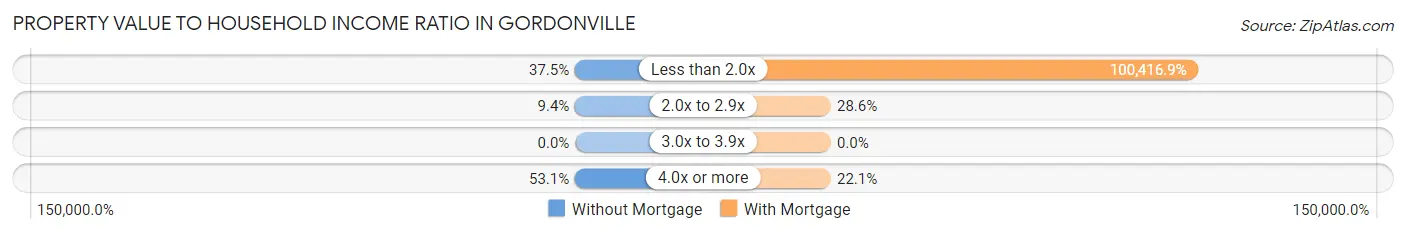
| Value-to-Income Ratio | Without Mortgage | With Mortgage |
| Less than 2.0x | 36 (37.5%) | 77,321 (100,416.9%) |
| 2.0x to 2.9x | 9 (9.4%) | 22 (28.6%) |
| 3.0x to 3.9x | 0 (0.0%) | 0 (0.0%) |
| 4.0x or more | 51 (53.1%) | 17 (22.1%) |
| Total | 96 (100.0%) | 77 (100.0%) |
Real Estate Taxes by Mortgage Status in Gordonville
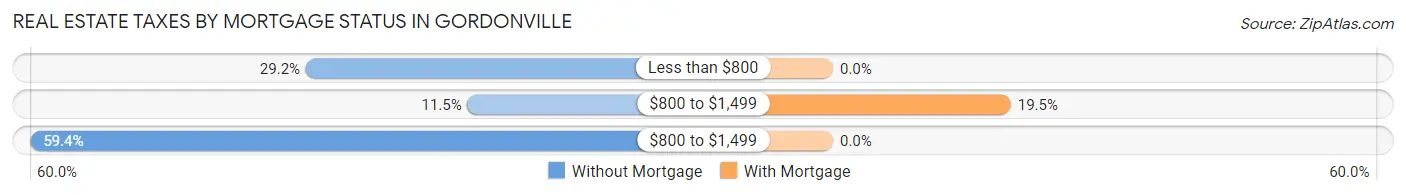
| Property Taxes | Without Mortgage | With Mortgage |
| Less than $800 | 28 (29.2%) | 0 (0.0%) |
| $800 to $1,499 | 11 (11.5%) | 15 (19.5%) |
| $800 to $1,499 | 57 (59.4%) | 0 (0.0%) |
| Total | 96 (100.0%) | 77 (100.0%) |
Health & Disability in Gordonville
Health Insurance Coverage by Age in Gordonville
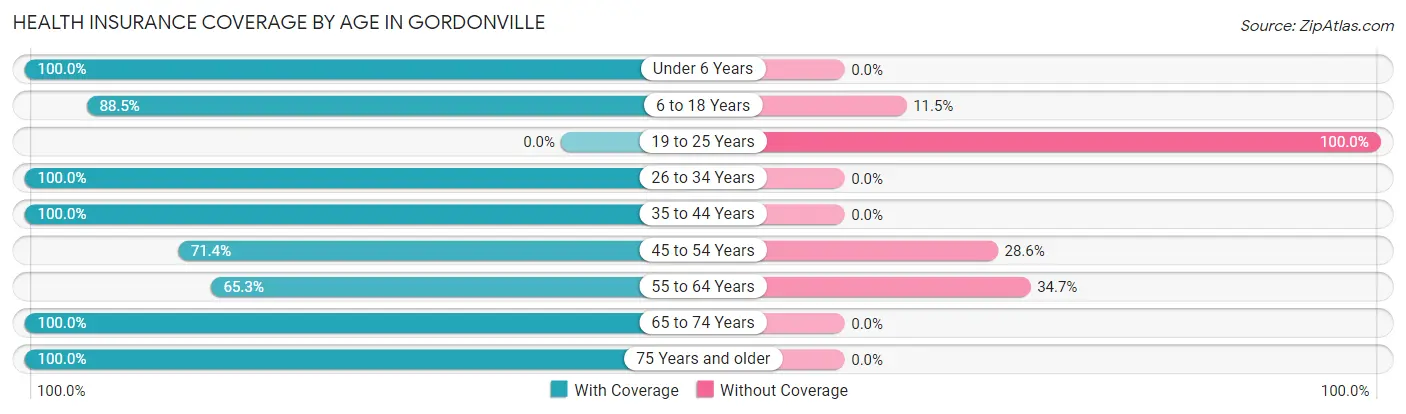
| Age Bracket | With Coverage | Without Coverage |
| Under 6 Years | 60 (100.0%) | 0 (0.0%) |
| 6 to 18 Years | 184 (88.5%) | 24 (11.5%) |
| 19 to 25 Years | 0 (0.0%) | 39 (100.0%) |
| 26 to 34 Years | 33 (100.0%) | 0 (0.0%) |
| 35 to 44 Years | 60 (100.0%) | 0 (0.0%) |
| 45 to 54 Years | 30 (71.4%) | 12 (28.6%) |
| 55 to 64 Years | 49 (65.3%) | 26 (34.7%) |
| 65 to 74 Years | 33 (100.0%) | 0 (0.0%) |
| 75 Years and older | 93 (100.0%) | 0 (0.0%) |
| Total | 542 (84.3%) | 101 (15.7%) |
Health Insurance Coverage by Citizenship Status in Gordonville
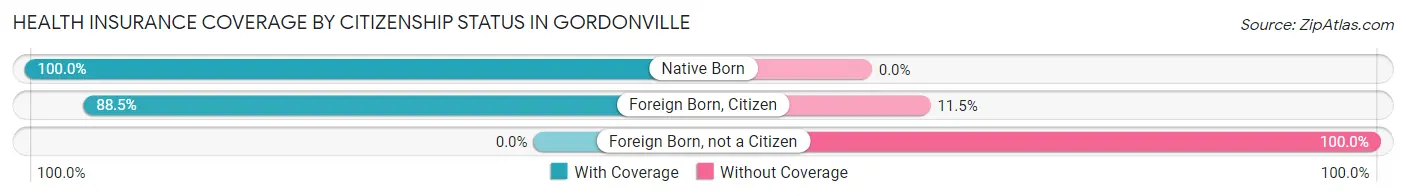
| Citizenship Status | With Coverage | Without Coverage |
| Native Born | 60 (100.0%) | 0 (0.0%) |
| Foreign Born, Citizen | 184 (88.5%) | 24 (11.5%) |
| Foreign Born, not a Citizen | 0 (0.0%) | 39 (100.0%) |
Health Insurance Coverage by Household Income in Gordonville
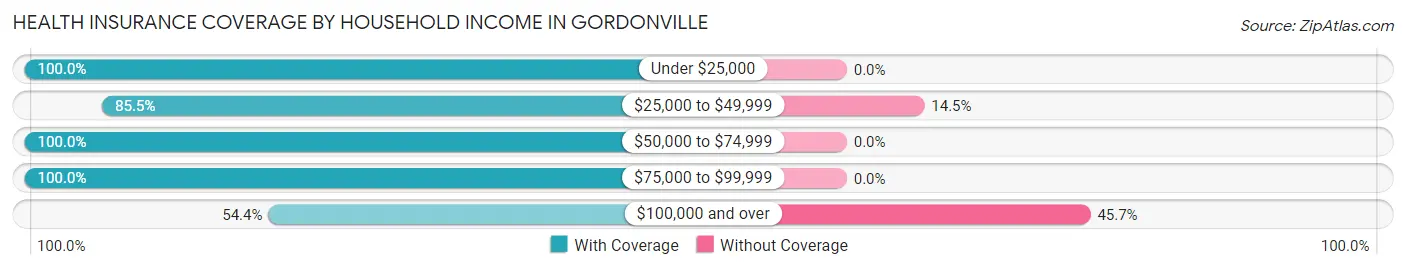
| Household Income | With Coverage | Without Coverage |
| Under $25,000 | 22 (100.0%) | 0 (0.0%) |
| $25,000 to $49,999 | 100 (85.5%) | 17 (14.5%) |
| $50,000 to $74,999 | 41 (100.0%) | 0 (0.0%) |
| $75,000 to $99,999 | 279 (100.0%) | 0 (0.0%) |
| $100,000 and over | 100 (54.3%) | 84 (45.7%) |
Public vs Private Health Insurance Coverage by Age in Gordonville
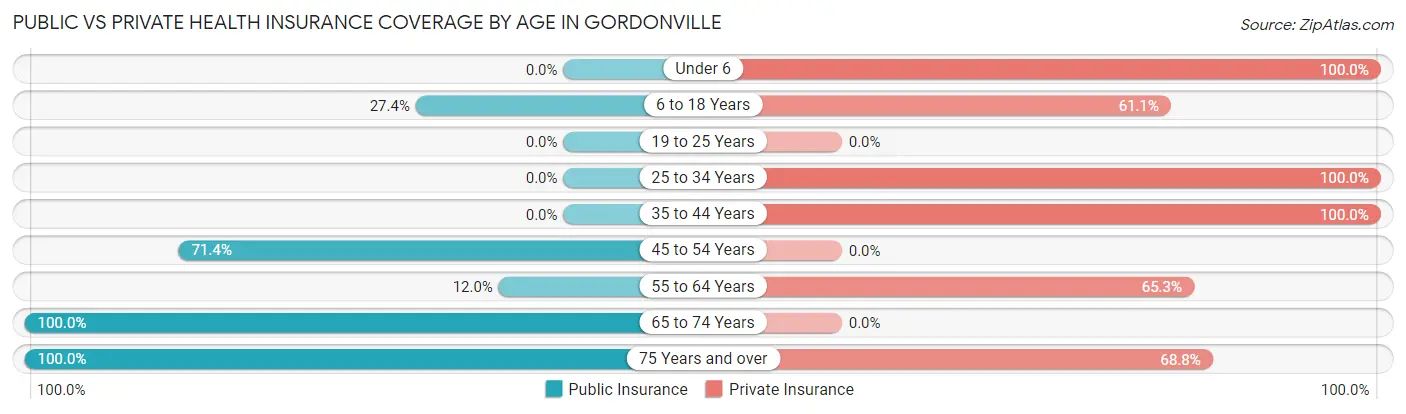
| Age Bracket | Public Insurance | Private Insurance |
| Under 6 | 0 (0.0%) | 60 (100.0%) |
| 6 to 18 Years | 57 (27.4%) | 127 (61.1%) |
| 19 to 25 Years | 0 (0.0%) | 0 (0.0%) |
| 25 to 34 Years | 0 (0.0%) | 33 (100.0%) |
| 35 to 44 Years | 0 (0.0%) | 60 (100.0%) |
| 45 to 54 Years | 30 (71.4%) | 0 (0.0%) |
| 55 to 64 Years | 9 (12.0%) | 49 (65.3%) |
| 65 to 74 Years | 33 (100.0%) | 0 (0.0%) |
| 75 Years and over | 93 (100.0%) | 64 (68.8%) |
| Total | 222 (34.5%) | 393 (61.1%) |
Disability Status by Sex by Age in Gordonville
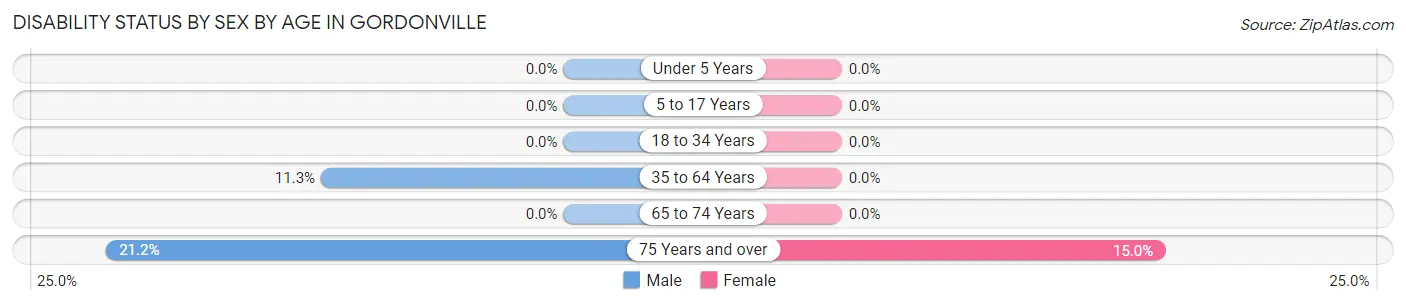
| Age Bracket | Male | Female |
| Under 5 Years | 0 (0.0%) | 0 (0.0%) |
| 5 to 17 Years | 0 (0.0%) | 0 (0.0%) |
| 18 to 34 Years | 0 (0.0%) | 0 (0.0%) |
| 35 to 64 Years | 9 (11.3%) | 0 (0.0%) |
| 65 to 74 Years | 0 (0.0%) | 0 (0.0%) |
| 75 Years and over | 7 (21.2%) | 9 (15.0%) |
Disability Class by Sex by Age in Gordonville
Disability Class: Hearing Difficulty
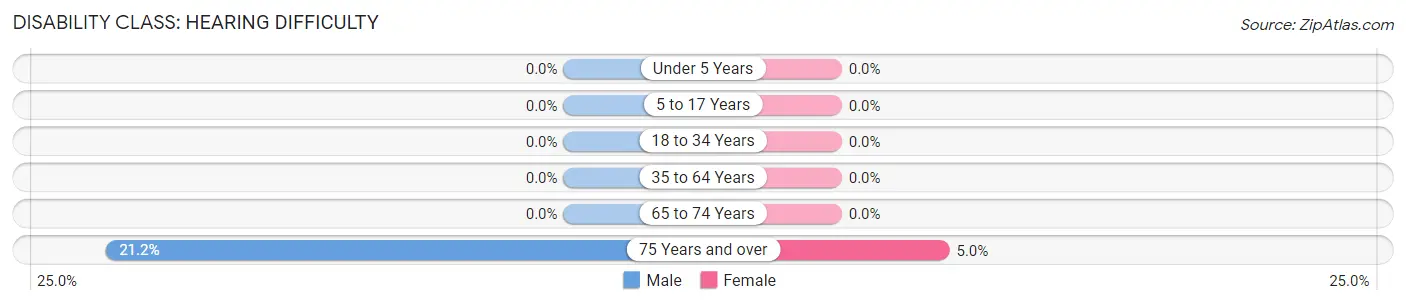
| Age Bracket | Male | Female |
| Under 5 Years | 0 (0.0%) | 0 (0.0%) |
| 5 to 17 Years | 0 (0.0%) | 0 (0.0%) |
| 18 to 34 Years | 0 (0.0%) | 0 (0.0%) |
| 35 to 64 Years | 0 (0.0%) | 0 (0.0%) |
| 65 to 74 Years | 0 (0.0%) | 0 (0.0%) |
| 75 Years and over | 7 (21.2%) | 3 (5.0%) |
Disability Class: Vision Difficulty
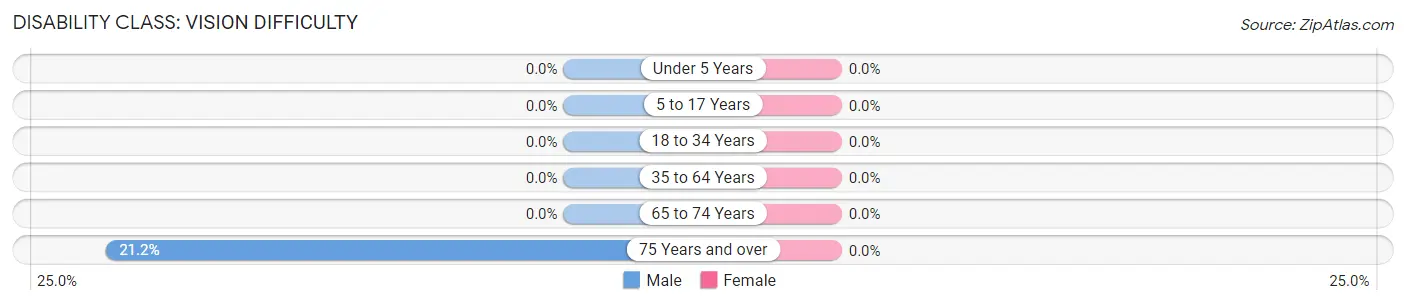
| Age Bracket | Male | Female |
| Under 5 Years | 0 (0.0%) | 0 (0.0%) |
| 5 to 17 Years | 0 (0.0%) | 0 (0.0%) |
| 18 to 34 Years | 0 (0.0%) | 0 (0.0%) |
| 35 to 64 Years | 0 (0.0%) | 0 (0.0%) |
| 65 to 74 Years | 0 (0.0%) | 0 (0.0%) |
| 75 Years and over | 7 (21.2%) | 0 (0.0%) |
Disability Class: Cognitive Difficulty
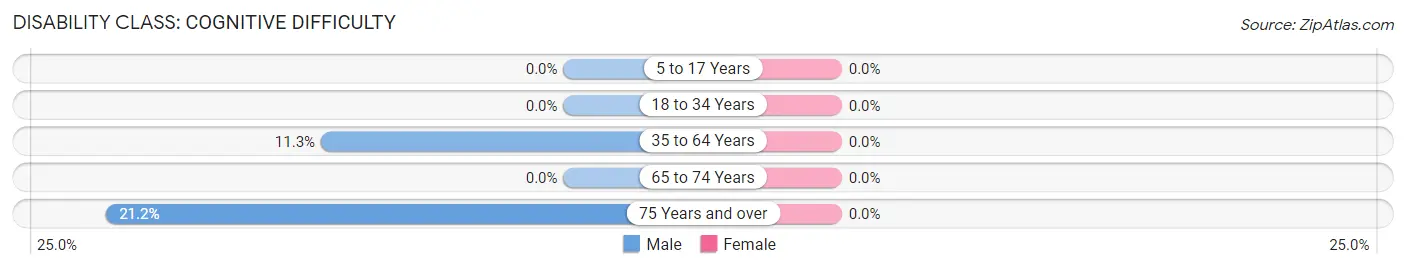
| Age Bracket | Male | Female |
| 5 to 17 Years | 0 (0.0%) | 0 (0.0%) |
| 18 to 34 Years | 0 (0.0%) | 0 (0.0%) |
| 35 to 64 Years | 9 (11.3%) | 0 (0.0%) |
| 65 to 74 Years | 0 (0.0%) | 0 (0.0%) |
| 75 Years and over | 7 (21.2%) | 0 (0.0%) |
Disability Class: Ambulatory Difficulty
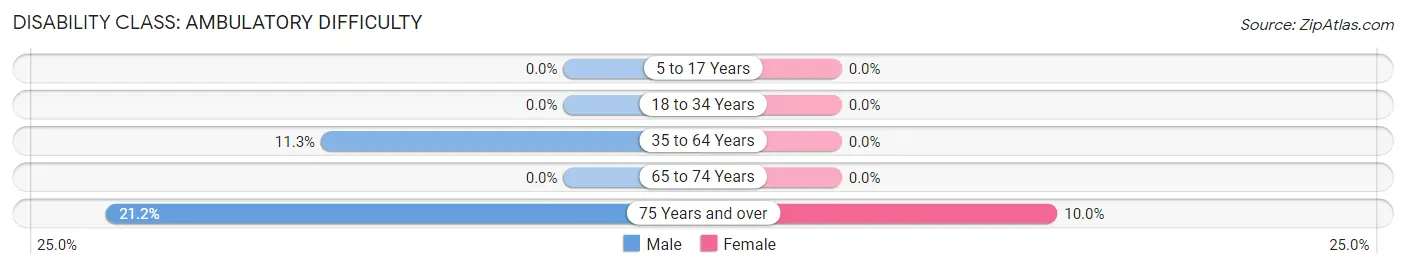
| Age Bracket | Male | Female |
| 5 to 17 Years | 0 (0.0%) | 0 (0.0%) |
| 18 to 34 Years | 0 (0.0%) | 0 (0.0%) |
| 35 to 64 Years | 9 (11.3%) | 0 (0.0%) |
| 65 to 74 Years | 0 (0.0%) | 0 (0.0%) |
| 75 Years and over | 7 (21.2%) | 6 (10.0%) |
Disability Class: Self-Care Difficulty
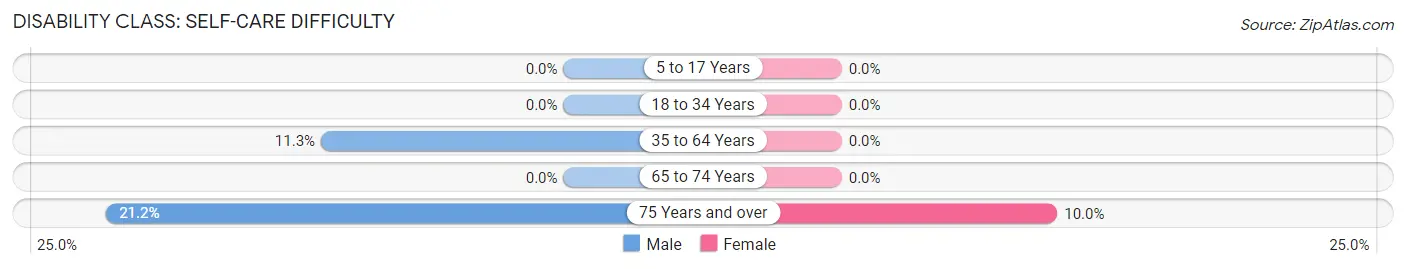
| Age Bracket | Male | Female |
| 5 to 17 Years | 0 (0.0%) | 0 (0.0%) |
| 18 to 34 Years | 0 (0.0%) | 0 (0.0%) |
| 35 to 64 Years | 9 (11.3%) | 0 (0.0%) |
| 65 to 74 Years | 0 (0.0%) | 0 (0.0%) |
| 75 Years and over | 7 (21.2%) | 6 (10.0%) |
Technology Access in Gordonville
Computing Device Access in Gordonville
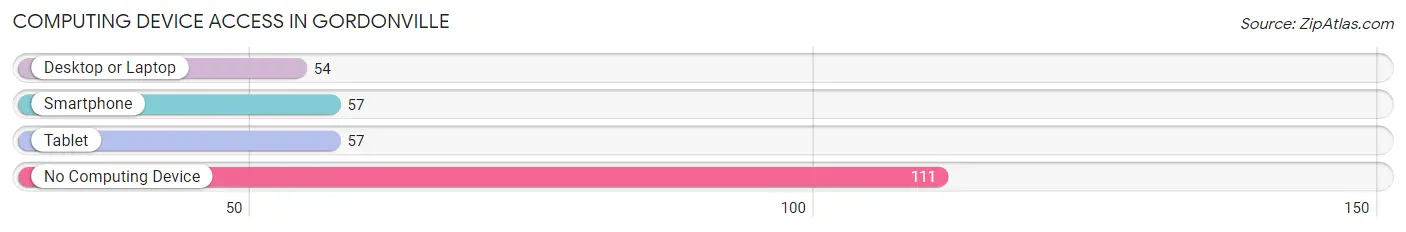
| Device Type | # Households | % Households |
| Desktop or Laptop | 54 | 27.4% |
| Smartphone | 57 | 28.9% |
| Tablet | 57 | 28.9% |
| No Computing Device | 111 | 56.4% |
| Total | 197 | 100.0% |
Internet Access in Gordonville
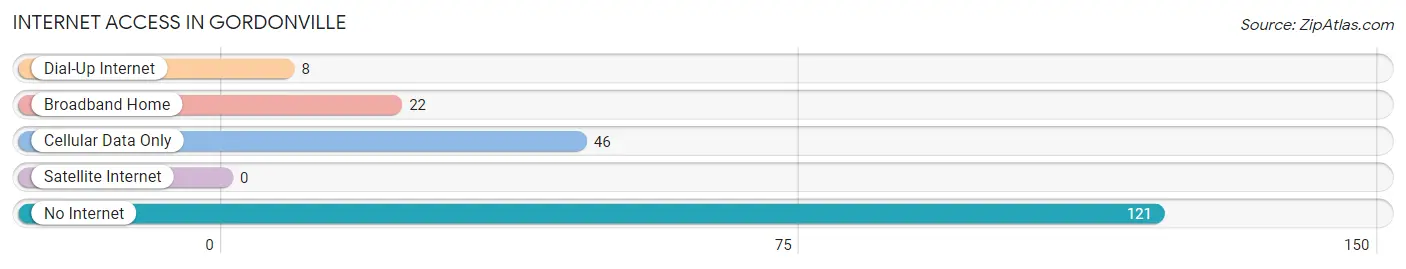
| Internet Type | # Households | % Households |
| Dial-Up Internet | 8 | 4.1% |
| Broadband Home | 22 | 11.2% |
| Cellular Data Only | 46 | 23.4% |
| Satellite Internet | 0 | 0.0% |
| No Internet | 121 | 61.4% |
| Total | 197 | 100.0% |
Gordonville Summary
History
The small town of Gordonville, Pennsylvania is located in the southeastern corner of Lancaster County. It is a rural community with a population of just over 1,000 people. The town was founded in 1737 by William Gordon, a Quaker from Scotland. He purchased the land from the local Native American tribes and named it after himself.
The town was originally a farming community, with the majority of the population being of German descent. The town was also home to a number of small businesses, including a blacksmith, a general store, and a grist mill.
In the late 19th century, the town began to grow and develop. The railroad was extended to Gordonville in 1872, and the town became a popular stop for travelers. The railroad also allowed for the transportation of goods and services to and from the town.
In the early 20th century, the town began to experience a decline in population. This was due to the increasing popularity of the automobile, which allowed people to travel further distances and to larger cities. The town also experienced a decrease in the number of businesses, as many of them moved to larger cities.
Geography
Gordonville is located in the southeastern corner of Lancaster County, Pennsylvania. It is situated in the rolling hills of the Pennsylvania Dutch Country. The town is bordered by the towns of Paradise, Bird-in-Hand, and Intercourse.
The town is located in the Conestoga Valley, which is a fertile agricultural region. The Conestoga River runs through the town, and there are several small creeks and streams in the area. The town is located at an elevation of approximately 500 feet above sea level.
The climate in Gordonville is typical of the region, with hot summers and cold winters. The average temperature in the summer is around 75 degrees Fahrenheit, and the average temperature in the winter is around 30 degrees Fahrenheit.
Economy
The economy of Gordonville is largely based on agriculture. The town is home to several farms, which produce a variety of crops, including corn, soybeans, wheat, and hay. The town is also home to several small businesses, including a general store, a hardware store, and a restaurant.
The town is also home to a number of tourist attractions, including the Gordonville Historic District, the Gordonville Covered Bridge, and the Gordonville Amish Market. These attractions draw visitors from all over the region, and help to support the local economy.
Demographics
As of the 2010 census, the population of Gordonville was 1,072. The racial makeup of the town was 97.3% White, 0.9% African American, 0.2% Native American, 0.2% Asian, 0.2% from other races, and 1.2% from two or more races. Hispanic or Latino of any race were 1.2% of the population.
The median household income in Gordonville was $50,000, and the median family income was $54,000. The per capita income was $21,000. About 8.3% of families and 10.2% of the population were below the poverty line, including 14.3% of those under age 18 and 5.3% of those age 65 or over.
The town is home to a large Amish population, with approximately 25% of the population being Amish. The Amish are a religious group that follows a strict set of beliefs and practices, and they are known for their traditional lifestyle and their commitment to hard work.
Common Questions
What is Per Capita Income in Gordonville?
Per Capita income in Gordonville is $19,644.
What is the Median Family Income in Gordonville?
Median Family Income in Gordonville is $85,040.
What is the Median Household income in Gordonville?
Median Household Income in Gordonville is $56,406.
What is Income or Wage Gap in Gordonville?
Income or Wage Gap in Gordonville is 86.0%.
Women in Gordonville earn 14.0 cents for every dollar earned by a man.
What is Inequality or Gini Index in Gordonville?
Inequality or Gini Index in Gordonville is 0.32.
What is the Total Population of Gordonville?
Total Population of Gordonville is 643.
What is the Total Male Population of Gordonville?
Total Male Population of Gordonville is 292.
What is the Total Female Population of Gordonville?
Total Female Population of Gordonville is 351.
What is the Ratio of Males per 100 Females in Gordonville?
There are 83.19 Males per 100 Females in Gordonville.
What is the Ratio of Females per 100 Males in Gordonville?
There are 120.21 Females per 100 Males in Gordonville.
What is the Median Population Age in Gordonville?
Median Population Age in Gordonville is 30.9 Years.
What is the Average Family Size in Gordonville
Average Family Size in Gordonville is 4.2 People.
What is the Average Household Size in Gordonville
Average Household Size in Gordonville is 3.3 People.
How Large is the Labor Force in Gordonville?
There are 243 People in the Labor Forcein in Gordonville.
What is the Percentage of People in the Labor Force in Gordonville?
55.6% of People are in the Labor Force in Gordonville.