Alden, MI Map & Demographics
Alden Map
Alden Overview
$39,965
PER CAPITA INCOME
$54,063
AVG HOUSEHOLD INCOME
0.43
INEQUALITY / GINI INDEX
112
TOTAL POPULATION
36
MALE POPULATION
76
FEMALE POPULATION
47.37
MALES / 100 FEMALES
211.11
FEMALES / 100 MALES
49.8
MEDIAN AGE
3.0
AVG FAMILY SIZE
2.0
AVG HOUSEHOLD SIZE
50
LABOR FORCE [ PEOPLE ]
51.5%
PERCENT IN LABOR FORCE
Alden Zip Codes
Alden Area Codes
Income in Alden
Income Overview in Alden
| Characteristic | Number | Measure |
| Per Capita Income | 112 | $39,965 |
| Median Family Income | 28 | $0 |
| Mean Family Income | 28 | $117,707 |
| Median Household Income | 55 | $54,063 |
| Mean Household Income | 55 | $80,996 |
| Income Deficit | 28 | $0 |
| Wage / Income Gap (%) | 112 | 0.00% |
| Wage / Income Gap ($) | 112 | 100.00¢ per $1 |
| Gini / Inequality Index | 112 | 0.43 |
Earnings by Sex in Alden
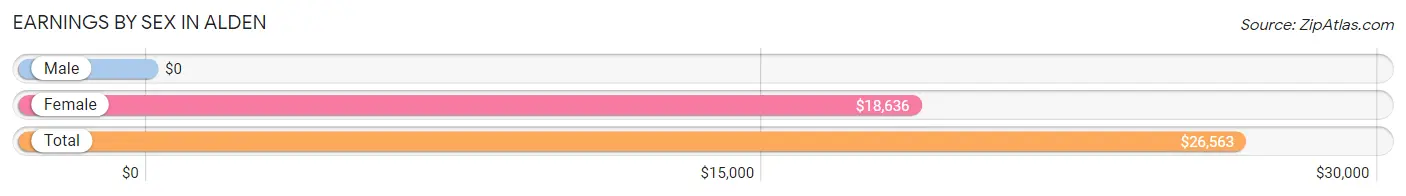
| Sex | Number | Average Earnings |
| Male | 23 (43.4%) | $0 |
| Female | 30 (56.6%) | $18,636 |
| Total | 53 (100.0%) | $26,563 |
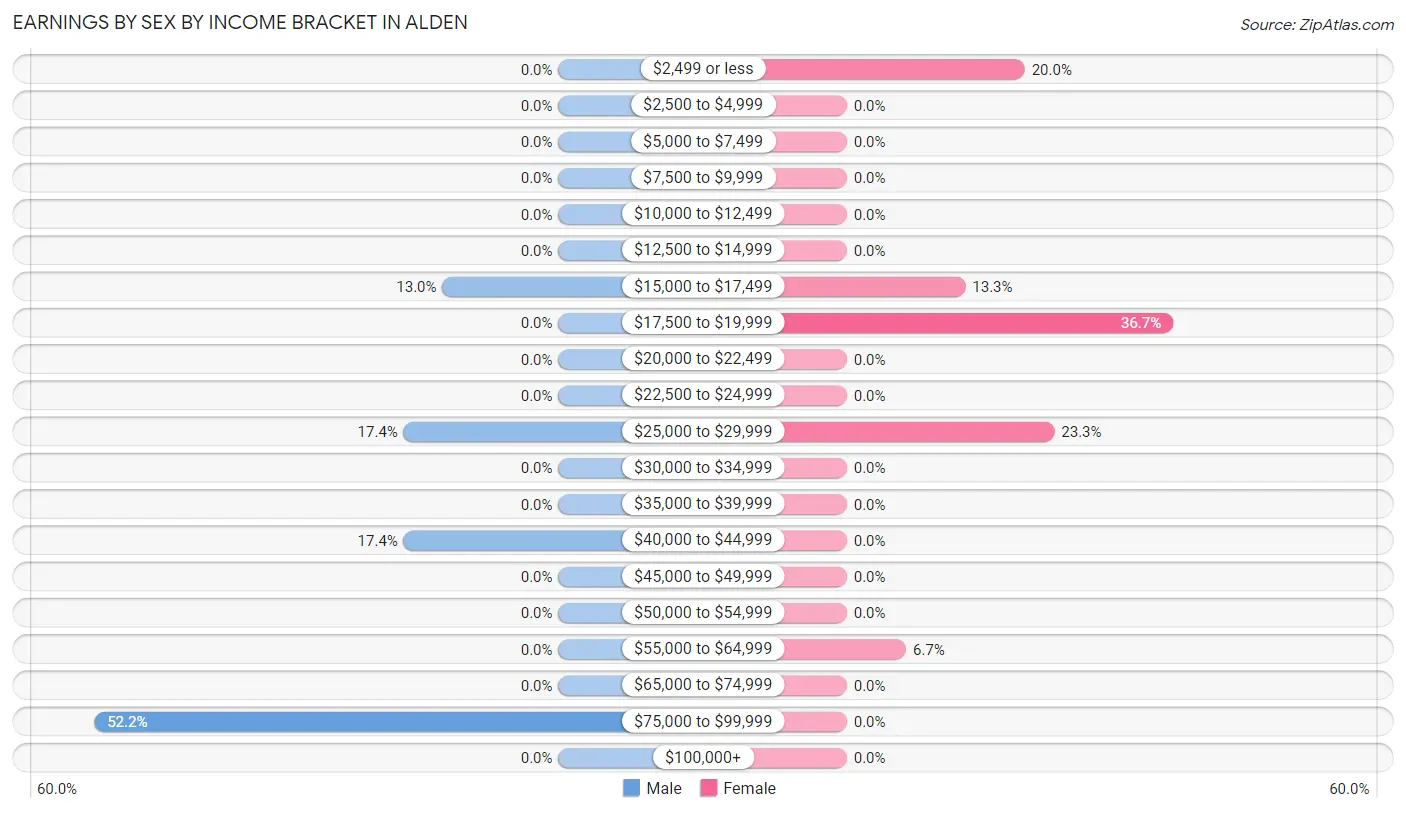
Earnings by Sex by Income Bracket in Alden
The most common earnings brackets in Alden are $75,000 to $99,999 for men (12 | 52.2%) and $17,500 to $19,999 for women (11 | 36.7%).
| Income | Male | Female |
| $2,499 or less | 0 (0.0%) | 6 (20.0%) |
| $2,500 to $4,999 | 0 (0.0%) | 0 (0.0%) |
| $5,000 to $7,499 | 0 (0.0%) | 0 (0.0%) |
| $7,500 to $9,999 | 0 (0.0%) | 0 (0.0%) |
| $10,000 to $12,499 | 0 (0.0%) | 0 (0.0%) |
| $12,500 to $14,999 | 0 (0.0%) | 0 (0.0%) |
| $15,000 to $17,499 | 3 (13.0%) | 4 (13.3%) |
| $17,500 to $19,999 | 0 (0.0%) | 11 (36.7%) |
| $20,000 to $22,499 | 0 (0.0%) | 0 (0.0%) |
| $22,500 to $24,999 | 0 (0.0%) | 0 (0.0%) |
| $25,000 to $29,999 | 4 (17.4%) | 7 (23.3%) |
| $30,000 to $34,999 | 0 (0.0%) | 0 (0.0%) |
| $35,000 to $39,999 | 0 (0.0%) | 0 (0.0%) |
| $40,000 to $44,999 | 4 (17.4%) | 0 (0.0%) |
| $45,000 to $49,999 | 0 (0.0%) | 0 (0.0%) |
| $50,000 to $54,999 | 0 (0.0%) | 0 (0.0%) |
| $55,000 to $64,999 | 0 (0.0%) | 2 (6.7%) |
| $65,000 to $74,999 | 0 (0.0%) | 0 (0.0%) |
| $75,000 to $99,999 | 12 (52.2%) | 0 (0.0%) |
| $100,000+ | 0 (0.0%) | 0 (0.0%) |
| Total | 23 (100.0%) | 30 (100.0%) |
Earnings by Sex by Educational Attainment in Alden
| Educational Attainment | Male Income | Female Income |
| Less than High School | - | - |
| High School Diploma | - | - |
| College or Associate's Degree | - | - |
| Bachelor's Degree | - | - |
| Graduate Degree | - | - |
| Total | - | - |
Family Income in Alden
Family Income Brackets in Alden
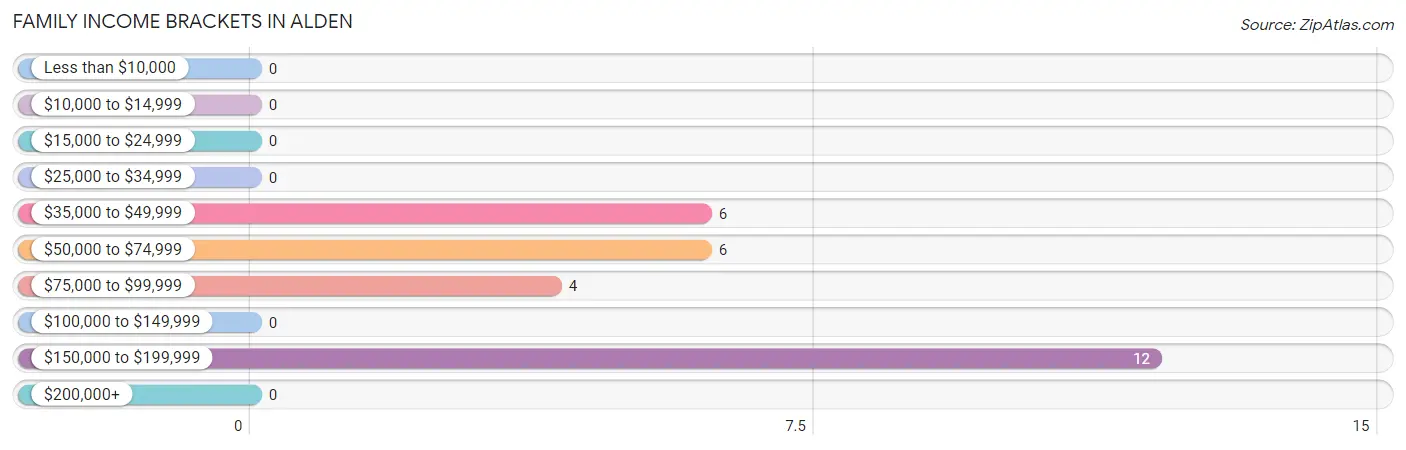
According to the Alden family income data, there are 12 families falling into the $150,000 to $199,999 income range, which is the most common income bracket and makes up 42.9% of all families.
| Income Bracket | # Families | % Families |
| Less than $10,000 | 0 | 0.0% |
| $10,000 to $14,999 | 0 | 0.0% |
| $15,000 to $24,999 | 0 | 0.0% |
| $25,000 to $34,999 | 0 | 0.0% |
| $35,000 to $49,999 | 6 | 21.4% |
| $50,000 to $74,999 | 6 | 21.4% |
| $75,000 to $99,999 | 4 | 14.3% |
| $100,000 to $149,999 | 0 | 0.0% |
| $150,000 to $199,999 | 12 | 42.9% |
| $200,000+ | 0 | 0.0% |
Family Income by Famaliy Size in Alden
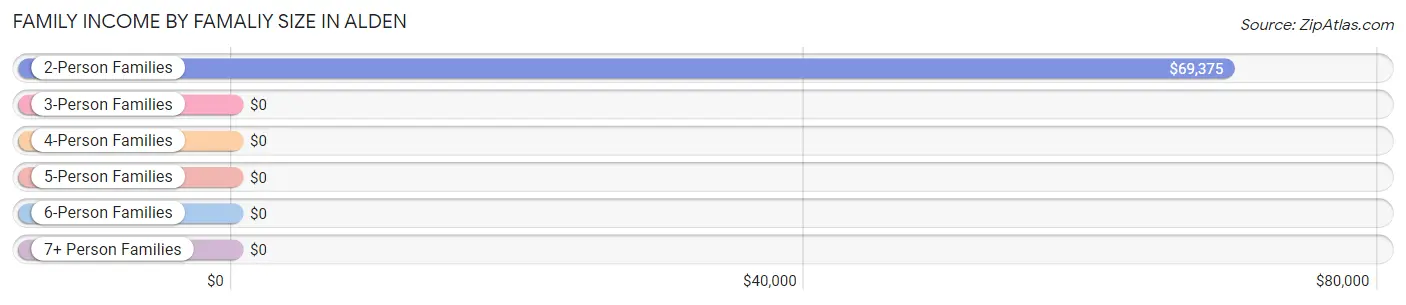
2-person families (9 | 32.1%) account for the highest median family income in Alden with $69,375 per family, while 2-person families (9 | 32.1%) have the highest median income of $34,688 per family member.
| Income Bracket | # Families | Median Income |
| 2-Person Families | 9 (32.1%) | $69,375 |
| 3-Person Families | 3 (10.7%) | $0 |
| 4-Person Families | 16 (57.1%) | $0 |
| 5-Person Families | 0 (0.0%) | $0 |
| 6-Person Families | 0 (0.0%) | $0 |
| 7+ Person Families | 0 (0.0%) | $0 |
| Total | 28 (100.0%) | $0 |
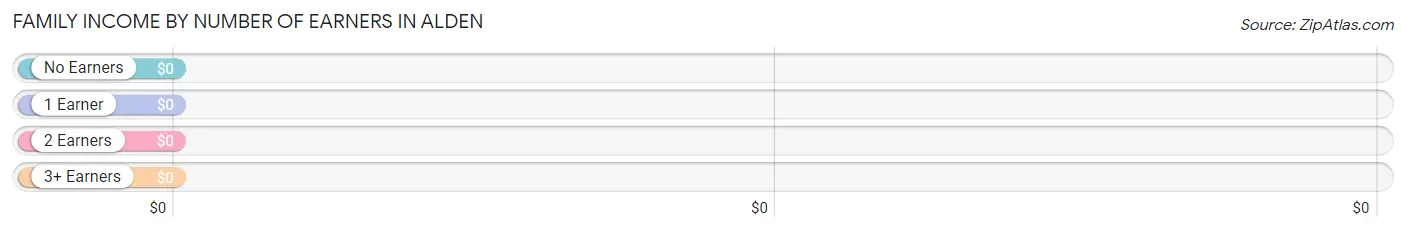
Family Income by Number of Earners in Alden
| Number of Earners | # Families | Median Income |
| No Earners | 0 (0.0%) | $0 |
| 1 Earner | 20 (71.4%) | $0 |
| 2 Earners | 4 (14.3%) | $0 |
| 3+ Earners | 4 (14.3%) | $0 |
| Total | 28 (100.0%) | $0 |
Household Income in Alden
Household Income Brackets in Alden
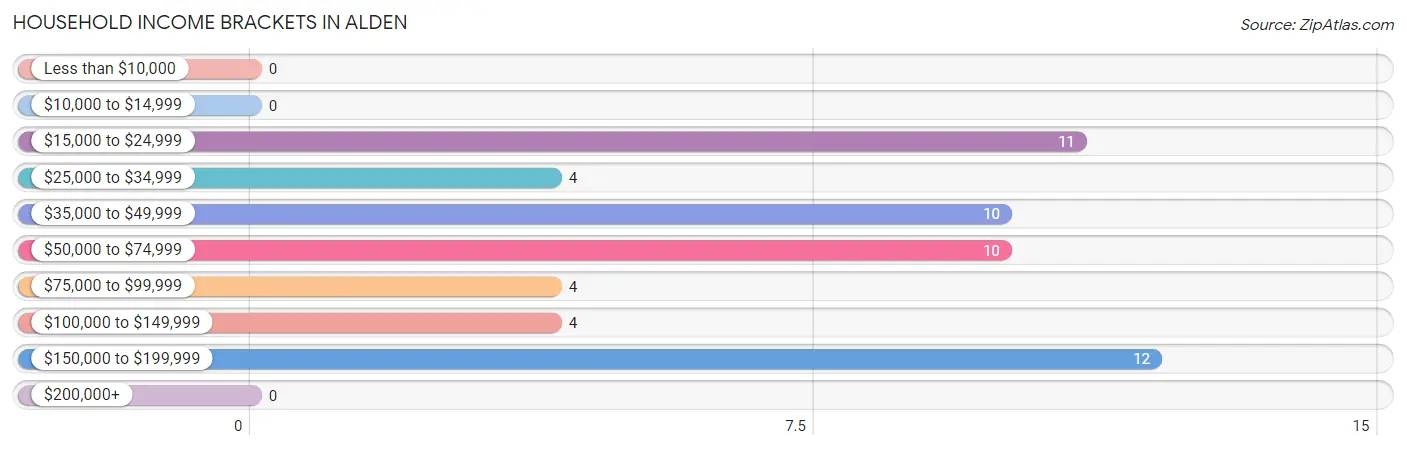
With 12 households falling in the category, the $150,000 to $199,999 income range is the most frequent in Alden, accounting for 21.8% of all households.
| Income Bracket | # Households | % Households |
| Less than $10,000 | 0 | 0.0% |
| $10,000 to $14,999 | 0 | 0.0% |
| $15,000 to $24,999 | 11 | 20.0% |
| $25,000 to $34,999 | 4 | 7.3% |
| $35,000 to $49,999 | 10 | 18.2% |
| $50,000 to $74,999 | 10 | 18.2% |
| $75,000 to $99,999 | 4 | 7.3% |
| $100,000 to $149,999 | 4 | 7.3% |
| $150,000 to $199,999 | 12 | 21.8% |
| $200,000+ | 0 | 0.0% |
Household Income by Householder Age in Alden
The median household income in Alden is $54,063, with the highest median household income of $41,250 found in the 65+ years age bracket for the primary householder. A total of 22 households (40.0%) fall into this category.
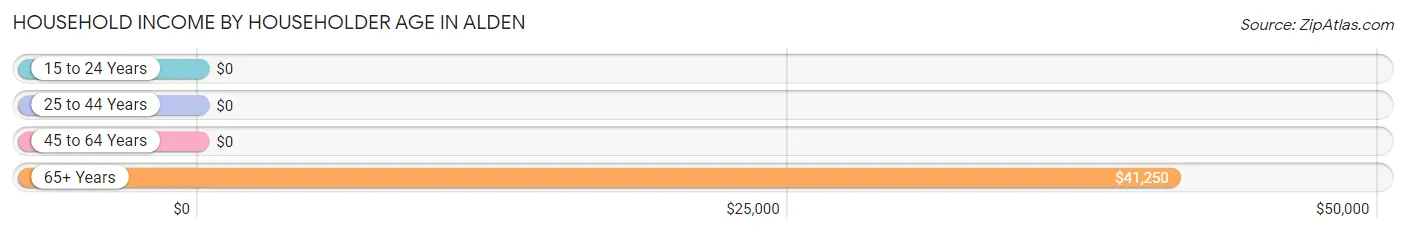
| Income Bracket | # Households | Median Income |
| 15 to 24 Years | 0 (0.0%) | $0 |
| 25 to 44 Years | 15 (27.3%) | $0 |
| 45 to 64 Years | 18 (32.7%) | $0 |
| 65+ Years | 22 (40.0%) | $41,250 |
| Total | 55 (100.0%) | $54,063 |
Poverty in Alden
Income Below Poverty by Sex and Age in Alden
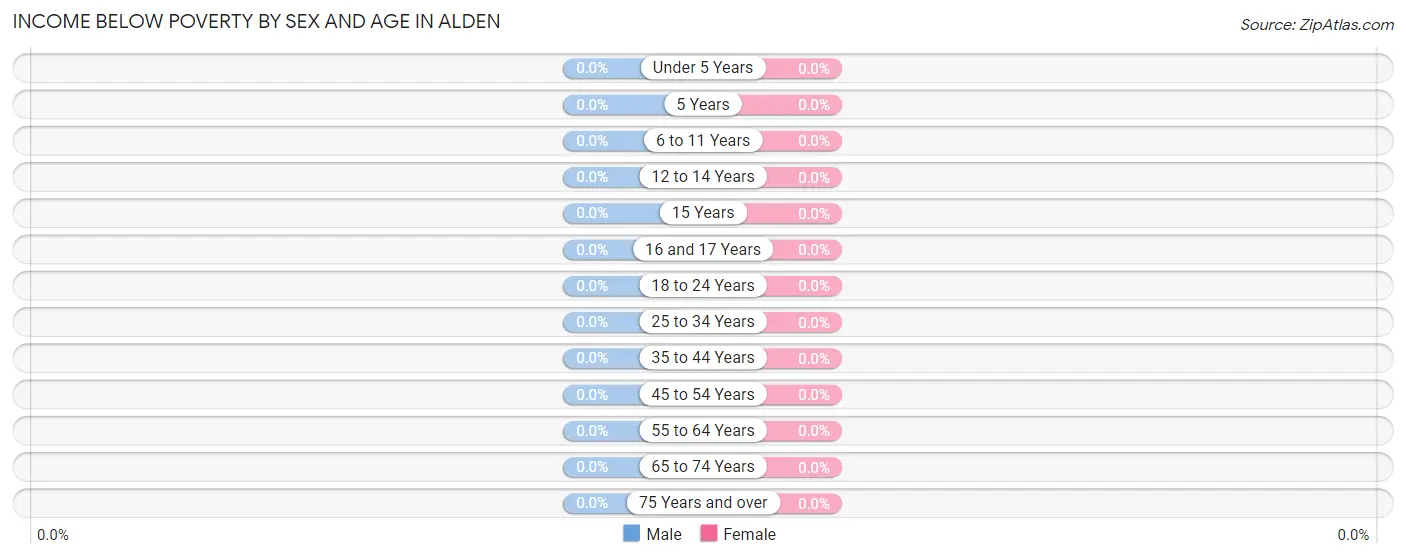
| Age Bracket | Male | Female |
| Under 5 Years | 0 (0.0%) | 0 (0.0%) |
| 5 Years | 0 (0.0%) | 0 (0.0%) |
| 6 to 11 Years | 0 (0.0%) | 0 (0.0%) |
| 12 to 14 Years | 0 (0.0%) | 0 (0.0%) |
| 15 Years | 0 (0.0%) | 0 (0.0%) |
| 16 and 17 Years | 0 (0.0%) | 0 (0.0%) |
| 18 to 24 Years | 0 (0.0%) | 0 (0.0%) |
| 25 to 34 Years | 0 (0.0%) | 0 (0.0%) |
| 35 to 44 Years | 0 (0.0%) | 0 (0.0%) |
| 45 to 54 Years | 0 (0.0%) | 0 (0.0%) |
| 55 to 64 Years | 0 (0.0%) | 0 (0.0%) |
| 65 to 74 Years | 0 (0.0%) | 0 (0.0%) |
| 75 Years and over | 0 (0.0%) | 0 (0.0%) |
| Total | 0 (0.0%) | 0 (0.0%) |
Income Above Poverty by Sex and Age in Alden
According to the poverty statistics in Alden, males aged 12 to 14 years and females aged 15 years are the age groups that are most secure financially, with 100.0% of males and 100.0% of females in these age groups living above the poverty line.
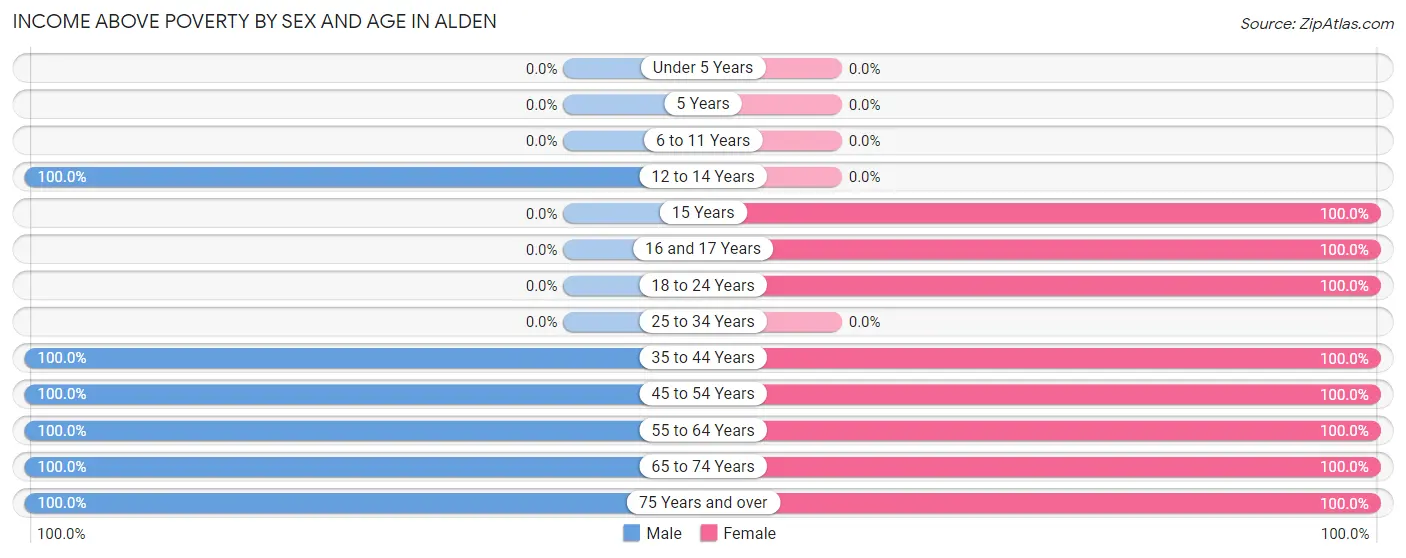
| Age Bracket | Male | Female |
| Under 5 Years | 0 (0.0%) | 0 (0.0%) |
| 5 Years | 0 (0.0%) | 0 (0.0%) |
| 6 to 11 Years | 0 (0.0%) | 0 (0.0%) |
| 12 to 14 Years | 3 (100.0%) | 0 (0.0%) |
| 15 Years | 0 (0.0%) | 12 (100.0%) |
| 16 and 17 Years | 0 (0.0%) | 4 (100.0%) |
| 18 to 24 Years | 0 (0.0%) | 8 (100.0%) |
| 25 to 34 Years | 0 (0.0%) | 0 (0.0%) |
| 35 to 44 Years | 4 (100.0%) | 15 (100.0%) |
| 45 to 54 Years | 12 (100.0%) | 12 (100.0%) |
| 55 to 64 Years | 10 (100.0%) | 6 (100.0%) |
| 65 to 74 Years | 3 (100.0%) | 15 (100.0%) |
| 75 Years and over | 4 (100.0%) | 4 (100.0%) |
| Total | 36 (100.0%) | 76 (100.0%) |
Income Below Poverty Among Married-Couple Families in Alden
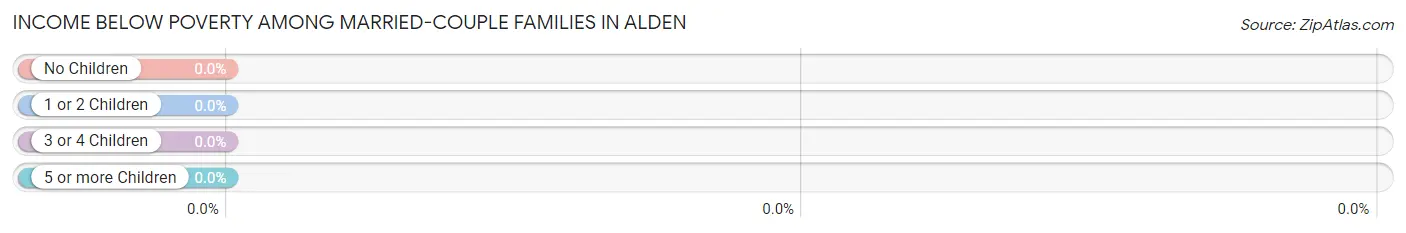
| Children | Above Poverty | Below Poverty |
| No Children | 9 (100.0%) | 0 (0.0%) |
| 1 or 2 Children | 19 (100.0%) | 0 (0.0%) |
| 3 or 4 Children | 0 (0.0%) | 0 (0.0%) |
| 5 or more Children | 0 (0.0%) | 0 (0.0%) |
| Total | 28 (100.0%) | 0 (0.0%) |
Income Below Poverty Among Single-Parent Households in Alden
| Children | Single Father | Single Mother |
| No Children | 0 (0.0%) | 0 (0.0%) |
| 1 or 2 Children | 0 (0.0%) | 0 (0.0%) |
| 3 or 4 Children | 0 (0.0%) | 0 (0.0%) |
| 5 or more Children | 0 (0.0%) | 0 (0.0%) |
| Total | 0 (0.0%) | 0 (0.0%) |
Income Below Poverty Among Married-Couple vs Single-Parent Households in Alden
| Children | Married-Couple Families | Single-Parent Households |
| No Children | 0 (0.0%) | 0 (0.0%) |
| 1 or 2 Children | 0 (0.0%) | 0 (0.0%) |
| 3 or 4 Children | 0 (0.0%) | 0 (0.0%) |
| 5 or more Children | 0 (0.0%) | 0 (0.0%) |
| Total | 0 (0.0%) | 0 (0.0%) |
Race in Alden
The most populous races in Alden are , and White / Caucasian (112 | 100.0%).
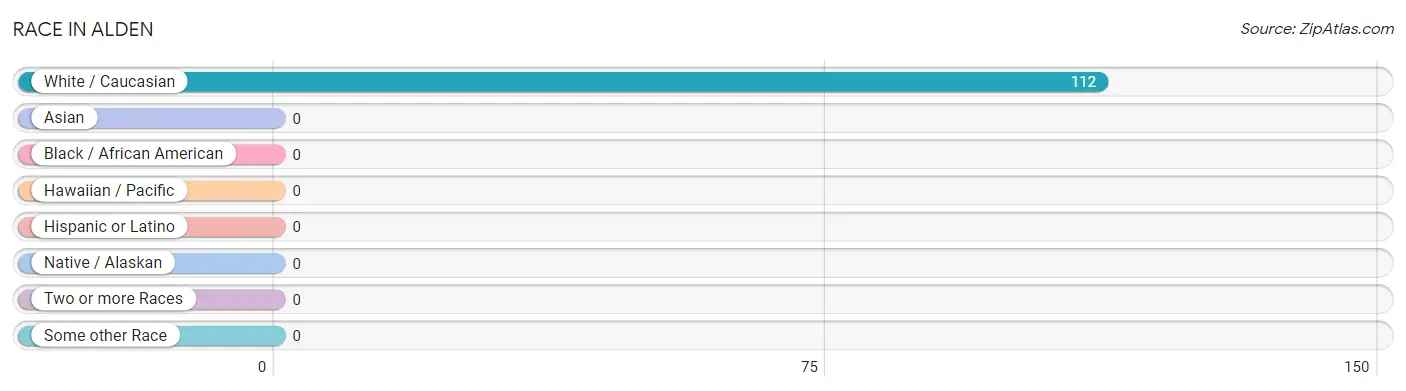
| Race | # Population | % Population |
| Asian | 0 | 0.0% |
| Black / African American | 0 | 0.0% |
| Hawaiian / Pacific | 0 | 0.0% |
| Hispanic or Latino | 0 | 0.0% |
| Native / Alaskan | 0 | 0.0% |
| White / Caucasian | 112 | 100.0% |
| Two or more Races | 0 | 0.0% |
| Some other Race | 0 | 0.0% |
| Total | 112 | 100.0% |
Ancestry in Alden
The most populous ancestries reported in Alden are German (52 | 46.4%), Irish (34 | 30.4%), English (12 | 10.7%), Dutch (11 | 9.8%), and American (9 | 8.0%), together accounting for 105.4% of all Alden residents.
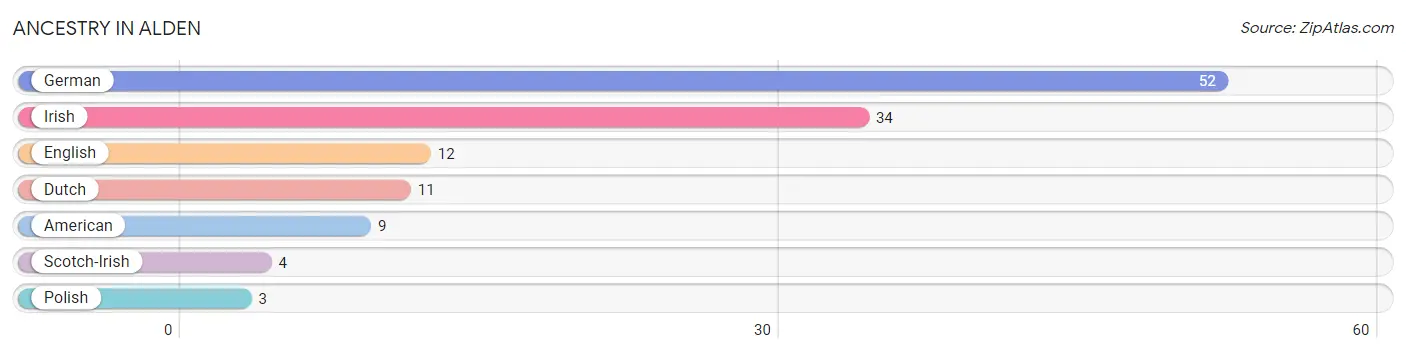
| Ancestry | # Population | % Population |
| American | 9 | 8.0% |
| Dutch | 11 | 9.8% |
| English | 12 | 10.7% |
| German | 52 | 46.4% |
| Irish | 34 | 30.4% |
| Polish | 3 | 2.7% |
| Scotch-Irish | 4 | 3.6% | View All 7 Rows |
Immigrants in Alden

| Immigration Origin | # Population | % Population | View All 0 Rows |
Sex and Age in Alden
Sex and Age in Alden
The most populous age groups in Alden are 50 to 54 Years (12 | 33.3%) for men and 15 to 19 Years (24 | 31.6%) for women.
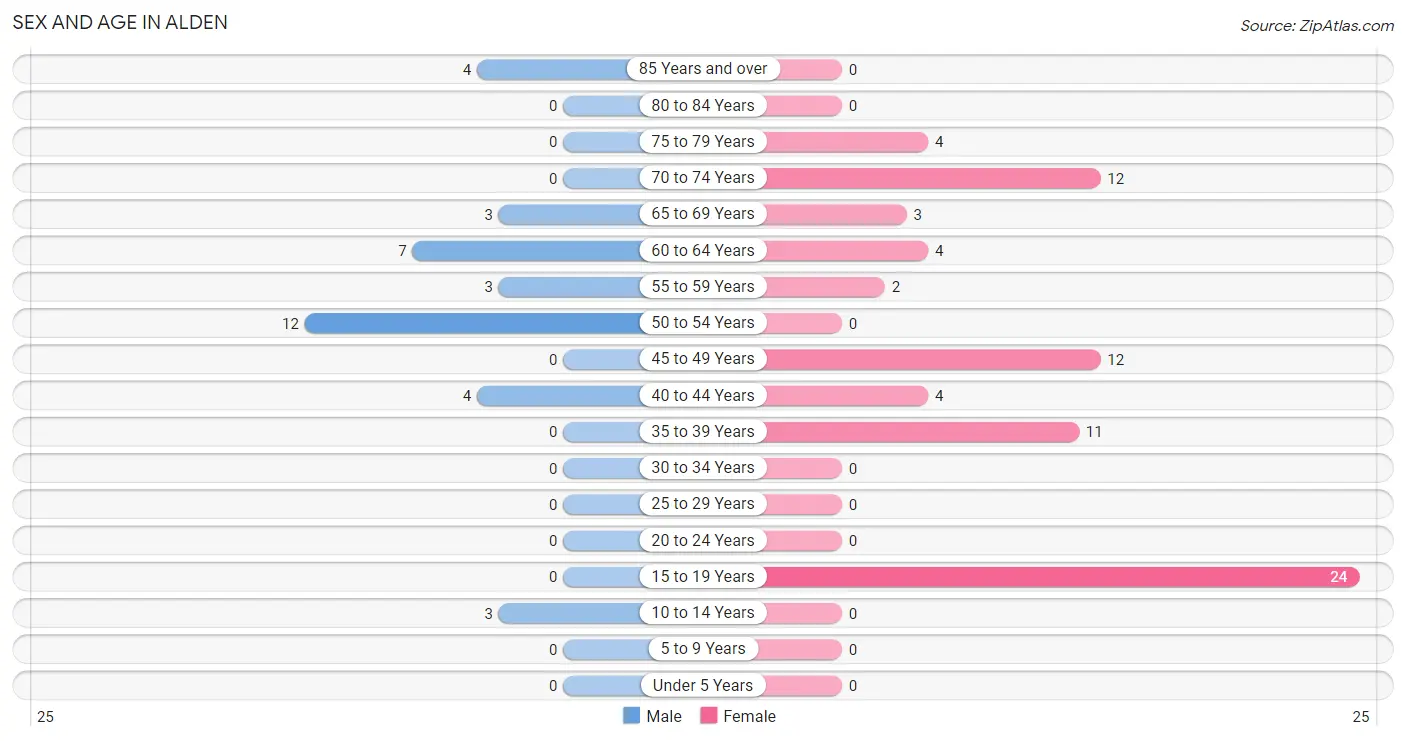
| Age Bracket | Male | Female |
| Under 5 Years | 0 (0.0%) | 0 (0.0%) |
| 5 to 9 Years | 0 (0.0%) | 0 (0.0%) |
| 10 to 14 Years | 3 (8.3%) | 0 (0.0%) |
| 15 to 19 Years | 0 (0.0%) | 24 (31.6%) |
| 20 to 24 Years | 0 (0.0%) | 0 (0.0%) |
| 25 to 29 Years | 0 (0.0%) | 0 (0.0%) |
| 30 to 34 Years | 0 (0.0%) | 0 (0.0%) |
| 35 to 39 Years | 0 (0.0%) | 11 (14.5%) |
| 40 to 44 Years | 4 (11.1%) | 4 (5.3%) |
| 45 to 49 Years | 0 (0.0%) | 12 (15.8%) |
| 50 to 54 Years | 12 (33.3%) | 0 (0.0%) |
| 55 to 59 Years | 3 (8.3%) | 2 (2.6%) |
| 60 to 64 Years | 7 (19.4%) | 4 (5.3%) |
| 65 to 69 Years | 3 (8.3%) | 3 (4.0%) |
| 70 to 74 Years | 0 (0.0%) | 12 (15.8%) |
| 75 to 79 Years | 0 (0.0%) | 4 (5.3%) |
| 80 to 84 Years | 0 (0.0%) | 0 (0.0%) |
| 85 Years and over | 4 (11.1%) | 0 (0.0%) |
| Total | 36 (100.0%) | 76 (100.0%) |
Families and Households in Alden
Median Family Size in Alden
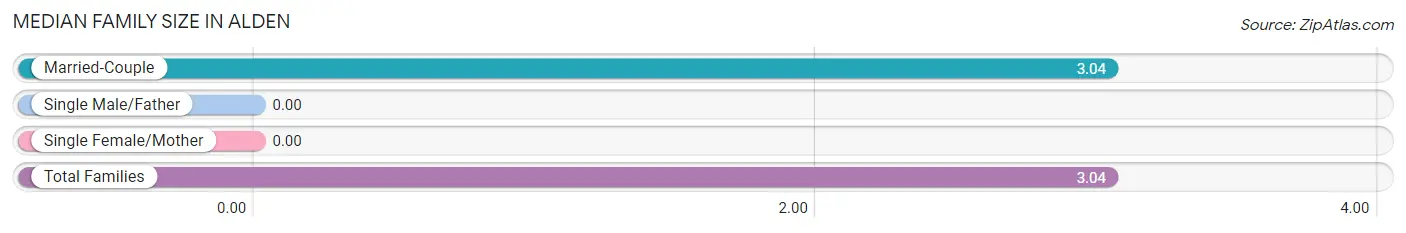
| Family Type | # Families | Family Size |
| Married-Couple | 28 (100.0%) | 3.04 |
| Single Male/Father | 0 (0.0%) | - |
| Single Female/Mother | 0 (0.0%) | - |
| Total Families | 28 (100.0%) | 3.04 |
Median Household Size in Alden
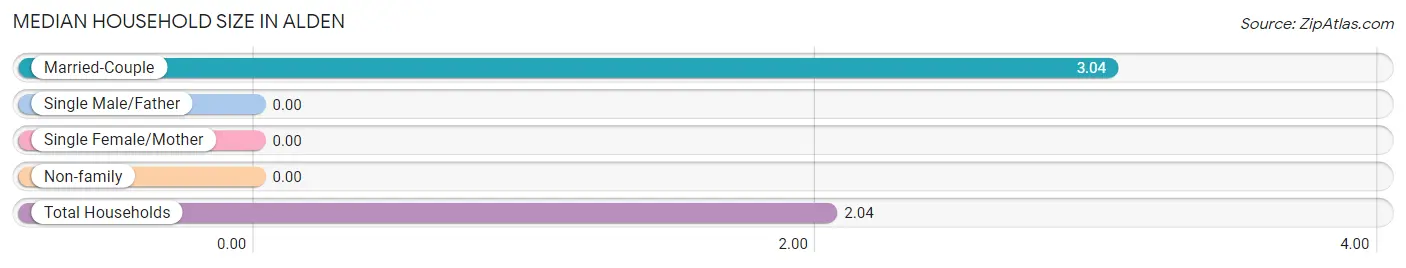
| Household Type | # Households | Household Size |
| Married-Couple | 28 (50.9%) | 3.04 |
| Single Male/Father | 0 (0.0%) | - |
| Single Female/Mother | 0 (0.0%) | - |
| Non-family | 27 (49.1%) | - |
| Total Households | 55 (100.0%) | 2.04 |
Household Size by Marriage Status in Alden
Out of a total of 55 households in Alden, 28 (50.9%) are family households, while 27 (49.1%) are nonfamily households. The most numerous type of family households are 4-person households, comprising 16, and the most common type of nonfamily households are 1-person households, comprising 27.
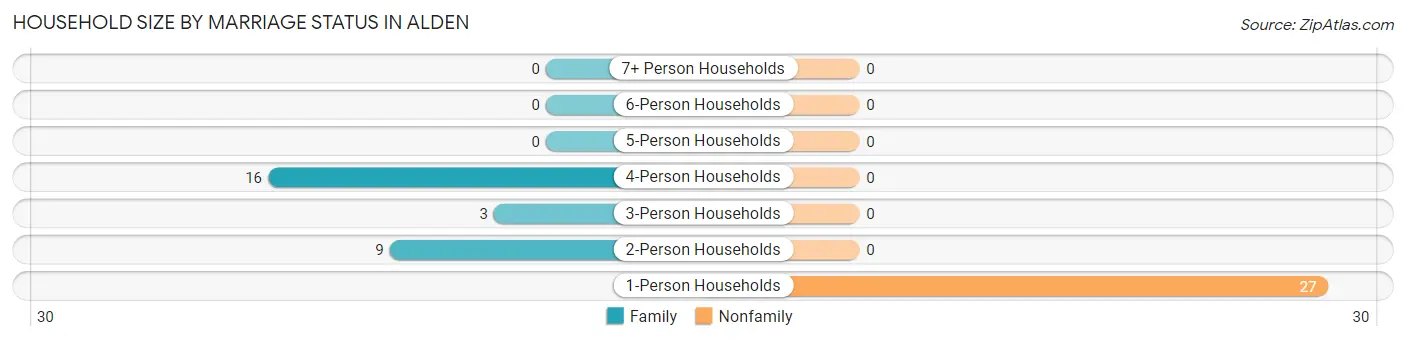
| Household Size | Family Households | Nonfamily Households |
| 1-Person Households | - | 27 (49.1%) |
| 2-Person Households | 9 (16.4%) | 0 (0.0%) |
| 3-Person Households | 3 (5.4%) | 0 (0.0%) |
| 4-Person Households | 16 (29.1%) | 0 (0.0%) |
| 5-Person Households | 0 (0.0%) | 0 (0.0%) |
| 6-Person Households | 0 (0.0%) | 0 (0.0%) |
| 7+ Person Households | 0 (0.0%) | 0 (0.0%) |
| Total | 28 (50.9%) | 27 (49.1%) |
Female Fertility in Alden
Fertility by Age in Alden
| Age Bracket | Women with Births | Births / 1,000 Women |
| 15 to 19 years | 0 (0.0%) | 0.0 |
| 20 to 34 years | 0 (0.0%) | 0.0 |
| 35 to 50 years | 0 (0.0%) | 0.0 |
| Total | 0 (0.0%) | 0.0 |
Fertility by Age by Marriage Status in Alden
| Age Bracket | Married | Unmarried |
| 15 to 19 years | 0 (0.0%) | 0 (0.0%) |
| 20 to 34 years | 0 (0.0%) | 0 (0.0%) |
| 35 to 50 years | 0 (0.0%) | 0 (0.0%) |
| Total | 0 (0.0%) | 0 (0.0%) |
Fertility by Education in Alden
| Educational Attainment | Women with Births | Births / 1,000 Women |
| Less than High School | 0 (0.0%) | 0.0 |
| High School Diploma | 0 (0.0%) | 0.0 |
| College or Associate's Degree | 0 (0.0%) | 0.0 |
| Bachelor's Degree | 0 (0.0%) | 0.0 |
| Graduate Degree | 0 (0.0%) | 0.0 |
| Total | 0 (0.0%) | 0.0 |
Fertility by Education by Marriage Status in Alden
| Educational Attainment | Married | Unmarried |
| Less than High School | 0 (0.0%) | 0 (0.0%) |
| High School Diploma | 0 (0.0%) | 0 (0.0%) |
| College or Associate's Degree | 0 (0.0%) | 0 (0.0%) |
| Bachelor's Degree | 0 (0.0%) | 0 (0.0%) |
| Graduate Degree | 0 (0.0%) | 0 (0.0%) |
| Total | 0 (0.0%) | 0 (0.0%) |
Employment Characteristics in Alden
Employment by Class of Employer in Alden
Among the 50 employed individuals in Alden, private company employees (27 | 54.0%), self-employed (not incorporated) (19 | 38.0%), and local government employees (4 | 8.0%) make up the most common classes of employment.
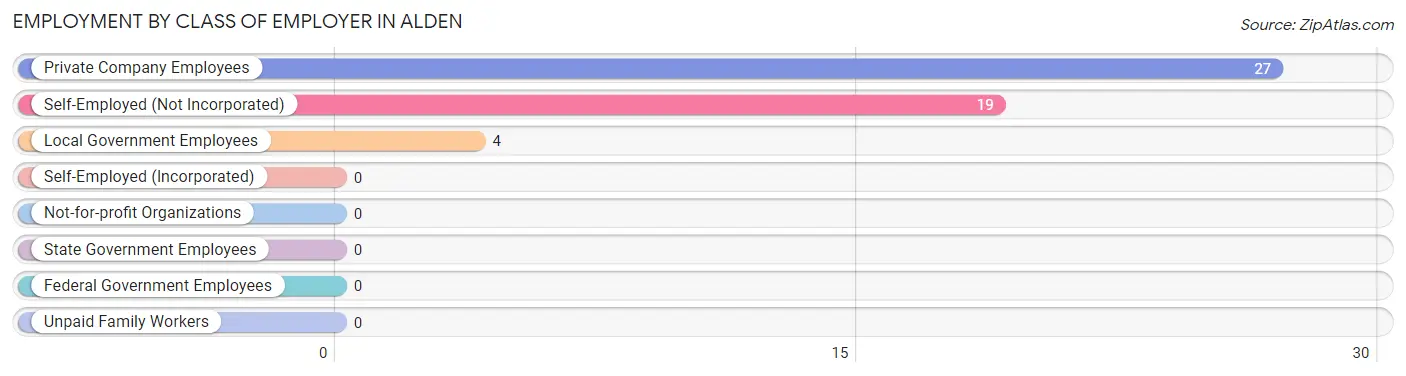
| Employer Class | # Employees | % Employees |
| Private Company Employees | 27 | 54.0% |
| Self-Employed (Incorporated) | 0 | 0.0% |
| Self-Employed (Not Incorporated) | 19 | 38.0% |
| Not-for-profit Organizations | 0 | 0.0% |
| Local Government Employees | 4 | 8.0% |
| State Government Employees | 0 | 0.0% |
| Federal Government Employees | 0 | 0.0% |
| Unpaid Family Workers | 0 | 0.0% |
| Total | 50 | 100.0% |
Employment Status by Age in Alden
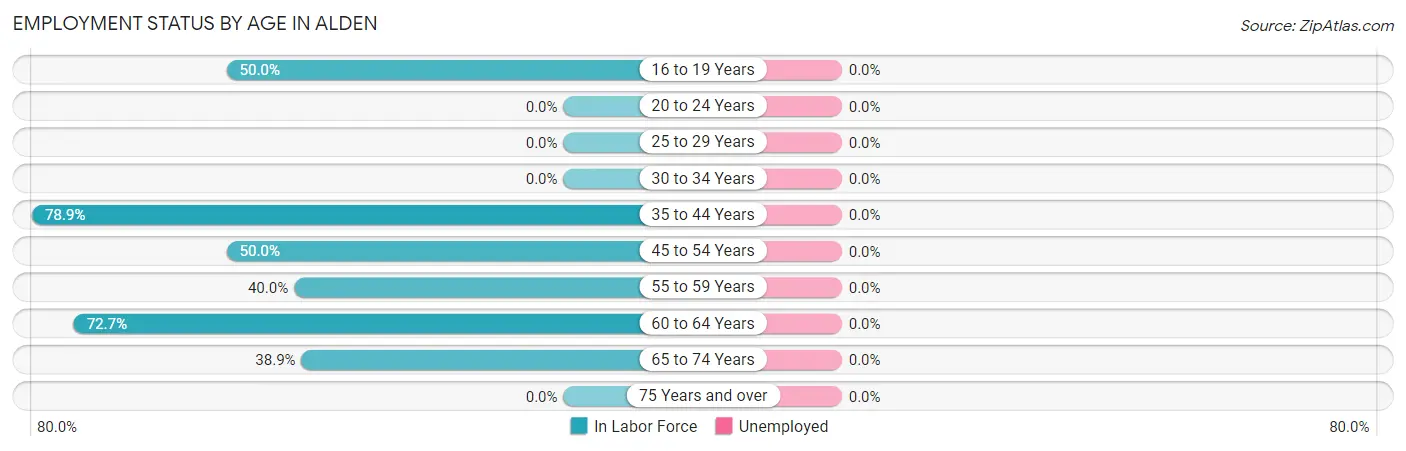
| Age Bracket | In Labor Force | Unemployed |
| 16 to 19 Years | 6 (50.0%) | 0 (0.0%) |
| 20 to 24 Years | 0 (0.0%) | 0 (0.0%) |
| 25 to 29 Years | 0 (0.0%) | 0 (0.0%) |
| 30 to 34 Years | 0 (0.0%) | 0 (0.0%) |
| 35 to 44 Years | 15 (78.9%) | 0 (0.0%) |
| 45 to 54 Years | 12 (50.0%) | 0 (0.0%) |
| 55 to 59 Years | 2 (40.0%) | 0 (0.0%) |
| 60 to 64 Years | 8 (72.7%) | 0 (0.0%) |
| 65 to 74 Years | 7 (38.9%) | 0 (0.0%) |
| 75 Years and over | 0 (0.0%) | 0 (0.0%) |
| Total | 50 (51.5%) | 0 (0.0%) |
Employment Status by Educational Attainment in Alden
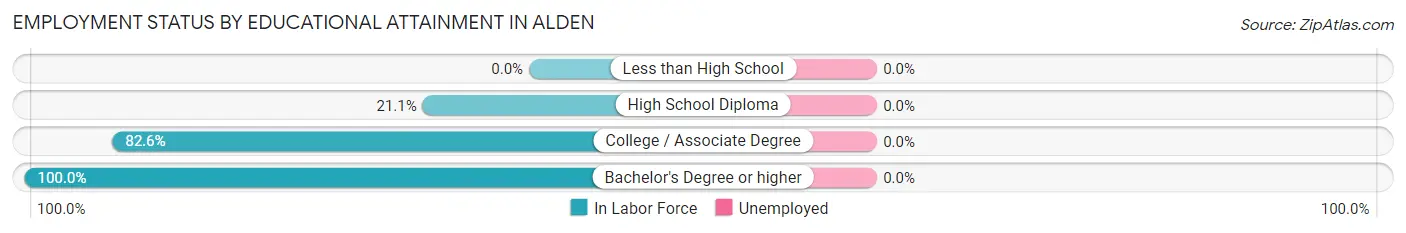
| Educational Attainment | In Labor Force | Unemployed |
| Less than High School | 0 (0.0%) | 0 (0.0%) |
| High School Diploma | 4 (21.1%) | 0 (0.0%) |
| College / Associate Degree | 19 (82.6%) | 0 (0.0%) |
| Bachelor's Degree or higher | 14 (100.0%) | 0 (0.0%) |
| Total | 37 (62.7%) | 0 (0.0%) |
Employment Occupations by Sex in Alden
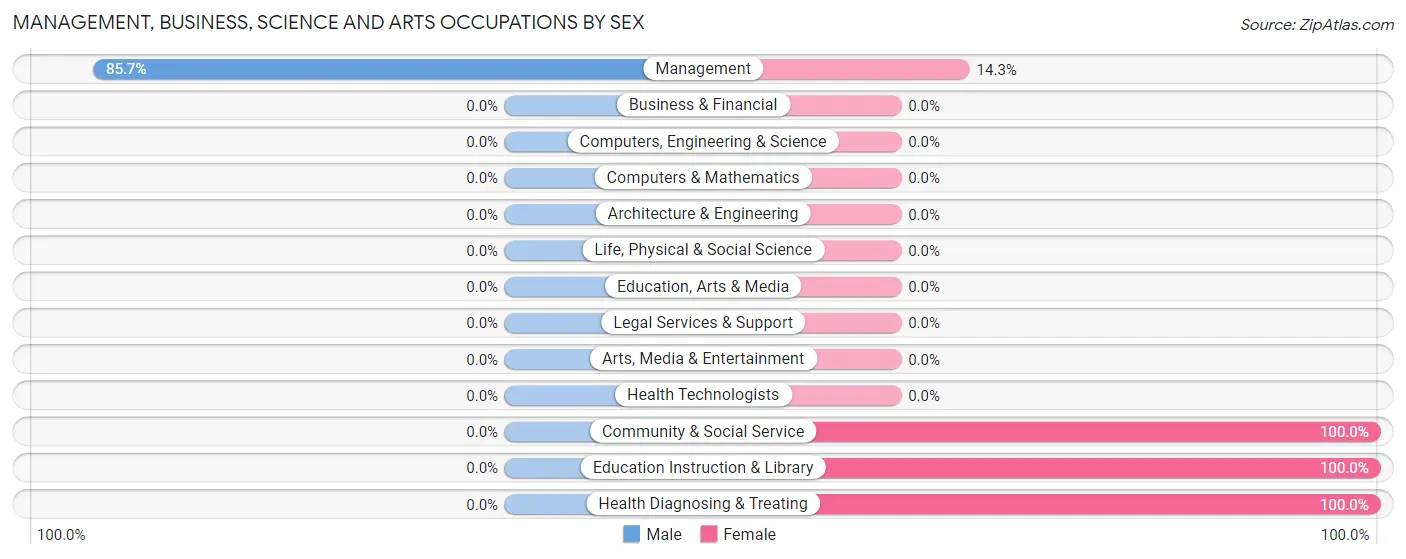
Management, Business, Science and Arts Occupations
The most common Management, Business, Science and Arts occupations in Alden are Management (14 | 28.0%), Community & Social Service (4 | 8.0%), Education Instruction & Library (4 | 8.0%), and Health Diagnosing & Treating (3 | 6.0%).
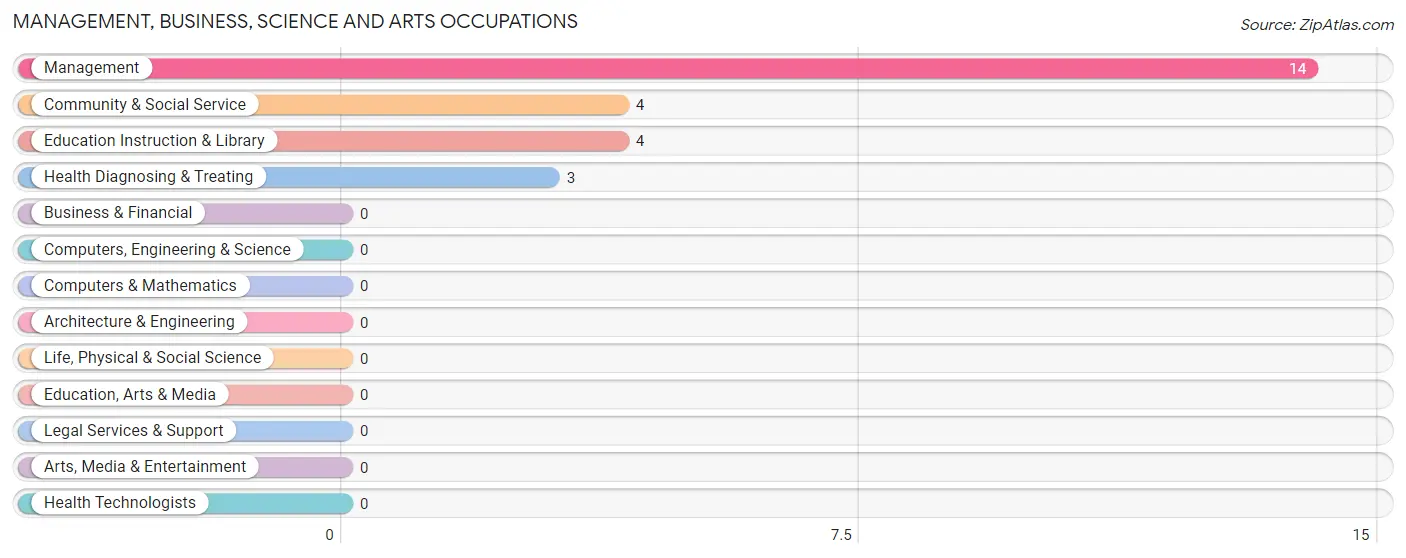
Management, Business, Science and Arts Occupations by Sex
| Occupation | Male | Female |
| Management | 12 (85.7%) | 2 (14.3%) |
| Business & Financial | 0 (0.0%) | 0 (0.0%) |
| Computers, Engineering & Science | 0 (0.0%) | 0 (0.0%) |
| Computers & Mathematics | 0 (0.0%) | 0 (0.0%) |
| Architecture & Engineering | 0 (0.0%) | 0 (0.0%) |
| Life, Physical & Social Science | 0 (0.0%) | 0 (0.0%) |
| Community & Social Service | 0 (0.0%) | 4 (100.0%) |
| Education, Arts & Media | 0 (0.0%) | 0 (0.0%) |
| Legal Services & Support | 0 (0.0%) | 0 (0.0%) |
| Education Instruction & Library | 0 (0.0%) | 4 (100.0%) |
| Arts, Media & Entertainment | 0 (0.0%) | 0 (0.0%) |
| Health Diagnosing & Treating | 0 (0.0%) | 3 (100.0%) |
| Health Technologists | 0 (0.0%) | 0 (0.0%) |
| Total (Category) | 12 (57.1%) | 9 (42.9%) |
| Total (Overall) | 20 (40.0%) | 30 (60.0%) |
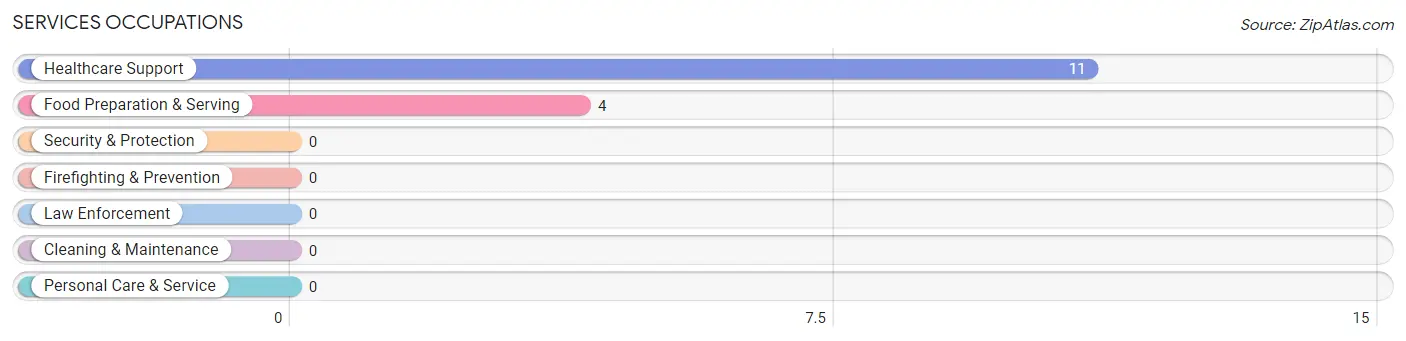
Services Occupations
The most common Services occupations in Alden are Healthcare Support (11 | 22.0%), and Food Preparation & Serving (4 | 8.0%).
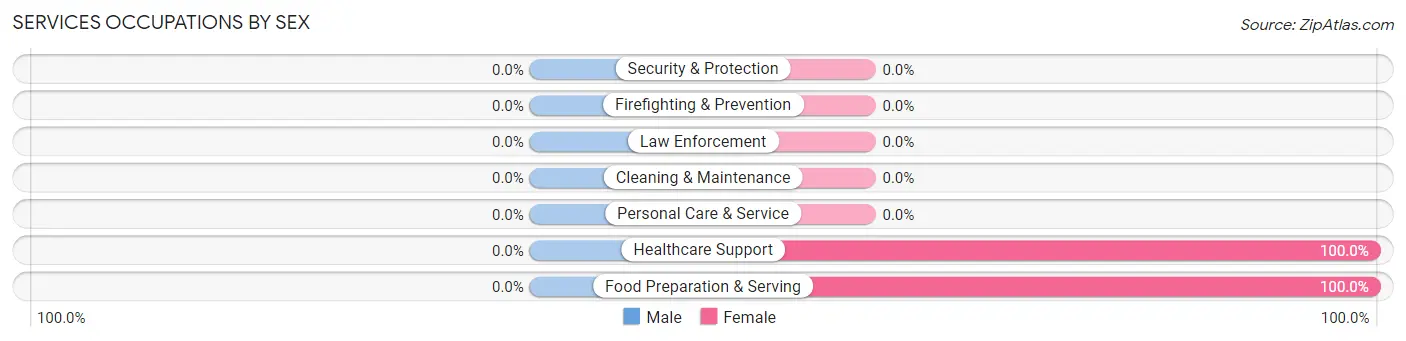
Services Occupations by Sex
| Occupation | Male | Female |
| Healthcare Support | 0 (0.0%) | 11 (100.0%) |
| Security & Protection | 0 (0.0%) | 0 (0.0%) |
| Firefighting & Prevention | 0 (0.0%) | 0 (0.0%) |
| Law Enforcement | 0 (0.0%) | 0 (0.0%) |
| Food Preparation & Serving | 0 (0.0%) | 4 (100.0%) |
| Cleaning & Maintenance | 0 (0.0%) | 0 (0.0%) |
| Personal Care & Service | 0 (0.0%) | 0 (0.0%) |
| Total (Category) | 0 (0.0%) | 15 (100.0%) |
| Total (Overall) | 20 (40.0%) | 30 (60.0%) |
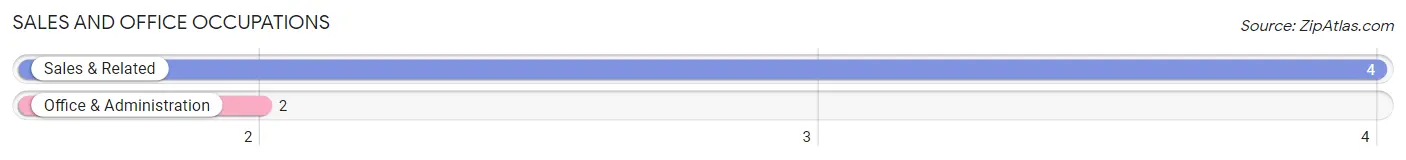
Sales and Office Occupations
The most common Sales and Office occupations in Alden are Sales & Related (4 | 8.0%), and Office & Administration (2 | 4.0%).
Sales and Office Occupations by Sex

| Occupation | Male | Female |
| Sales & Related | 4 (100.0%) | 0 (0.0%) |
| Office & Administration | 0 (0.0%) | 2 (100.0%) |
| Total (Category) | 4 (66.7%) | 2 (33.3%) |
| Total (Overall) | 20 (40.0%) | 30 (60.0%) |
Natural Resources, Construction and Maintenance Occupations
Natural Resources, Construction and Maintenance Occupations by Sex
| Occupation | Male | Female |
| Farming, Fishing & Forestry | 0 (0.0%) | 0 (0.0%) |
| Construction & Extraction | 0 (0.0%) | 0 (0.0%) |
| Installation, Maintenance & Repair | 0 (0.0%) | 0 (0.0%) |
| Total (Category) | 0 (0.0%) | 0 (0.0%) |
| Total (Overall) | 20 (40.0%) | 30 (60.0%) |
Production, Transportation and Moving Occupations
The most common Production, Transportation and Moving occupations in Alden are , and Transportation (8 | 16.0%).
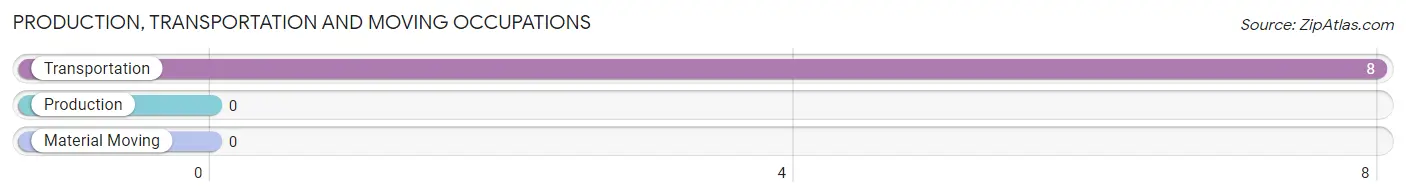
Production, Transportation and Moving Occupations by Sex
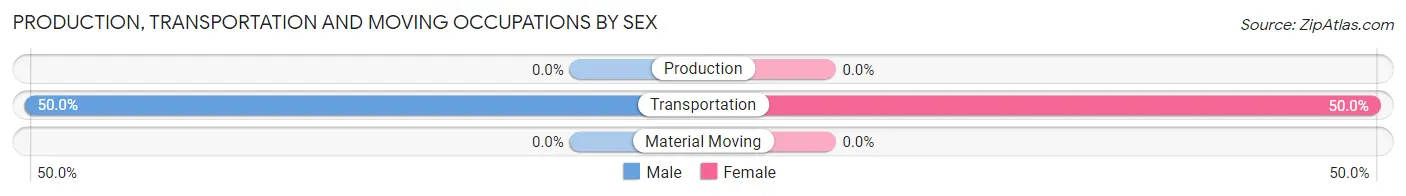
| Occupation | Male | Female |
| Production | 0 (0.0%) | 0 (0.0%) |
| Transportation | 4 (50.0%) | 4 (50.0%) |
| Material Moving | 0 (0.0%) | 0 (0.0%) |
| Total (Category) | 4 (50.0%) | 4 (50.0%) |
| Total (Overall) | 20 (40.0%) | 30 (60.0%) |
Employment Industries by Sex in Alden
Employment Industries in Alden
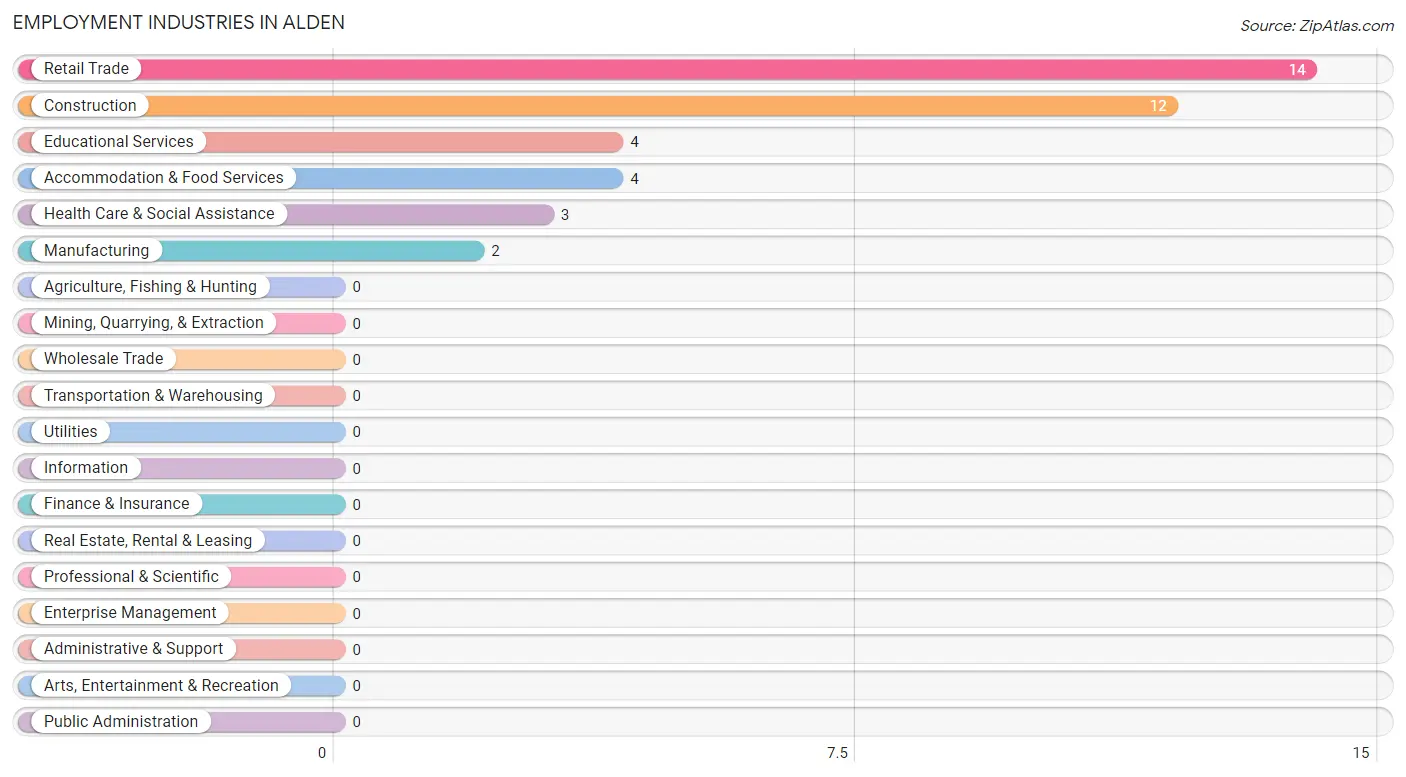
The major employment industries in Alden include Retail Trade (14 | 28.0%), Construction (12 | 24.0%), Educational Services (4 | 8.0%), Accommodation & Food Services (4 | 8.0%), and Health Care & Social Assistance (3 | 6.0%).
Employment Industries by Sex in Alden
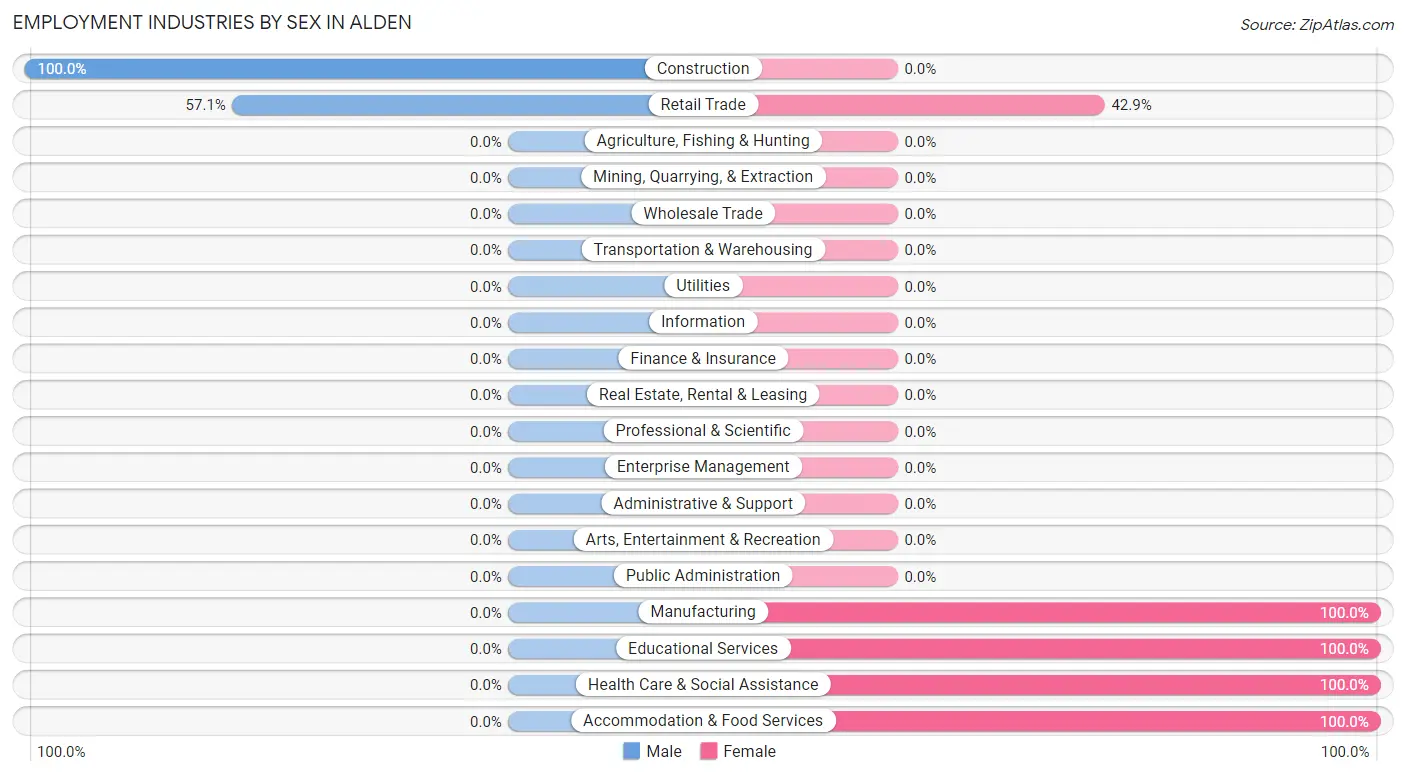
The Alden industries that see more men than women are Construction (100.0%), and Retail Trade (57.1%), whereas the industries that tend to have a higher number of women are Manufacturing (100.0%), Educational Services (100.0%), and Health Care & Social Assistance (100.0%).
| Industry | Male | Female |
| Agriculture, Fishing & Hunting | 0 (0.0%) | 0 (0.0%) |
| Mining, Quarrying, & Extraction | 0 (0.0%) | 0 (0.0%) |
| Construction | 12 (100.0%) | 0 (0.0%) |
| Manufacturing | 0 (0.0%) | 2 (100.0%) |
| Wholesale Trade | 0 (0.0%) | 0 (0.0%) |
| Retail Trade | 8 (57.1%) | 6 (42.9%) |
| Transportation & Warehousing | 0 (0.0%) | 0 (0.0%) |
| Utilities | 0 (0.0%) | 0 (0.0%) |
| Information | 0 (0.0%) | 0 (0.0%) |
| Finance & Insurance | 0 (0.0%) | 0 (0.0%) |
| Real Estate, Rental & Leasing | 0 (0.0%) | 0 (0.0%) |
| Professional & Scientific | 0 (0.0%) | 0 (0.0%) |
| Enterprise Management | 0 (0.0%) | 0 (0.0%) |
| Administrative & Support | 0 (0.0%) | 0 (0.0%) |
| Educational Services | 0 (0.0%) | 4 (100.0%) |
| Health Care & Social Assistance | 0 (0.0%) | 3 (100.0%) |
| Arts, Entertainment & Recreation | 0 (0.0%) | 0 (0.0%) |
| Accommodation & Food Services | 0 (0.0%) | 4 (100.0%) |
| Public Administration | 0 (0.0%) | 0 (0.0%) |
| Total | 20 (40.0%) | 30 (60.0%) |
Education in Alden
School Enrollment in Alden
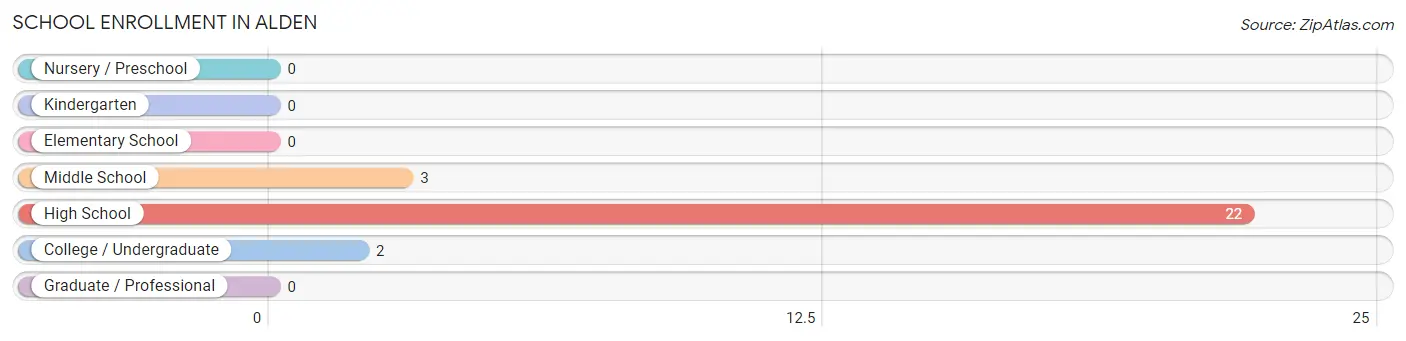
The most common levels of schooling among the 27 students in Alden are high school (22 | 81.5%), middle school (3 | 11.1%), and college / undergraduate (2 | 7.4%).
| School Level | # Students | % Students |
| Nursery / Preschool | 0 | 0.0% |
| Kindergarten | 0 | 0.0% |
| Elementary School | 0 | 0.0% |
| Middle School | 3 | 11.1% |
| High School | 22 | 81.5% |
| College / Undergraduate | 2 | 7.4% |
| Graduate / Professional | 0 | 0.0% |
| Total | 27 | 100.0% |
School Enrollment by Age by Funding Source in Alden
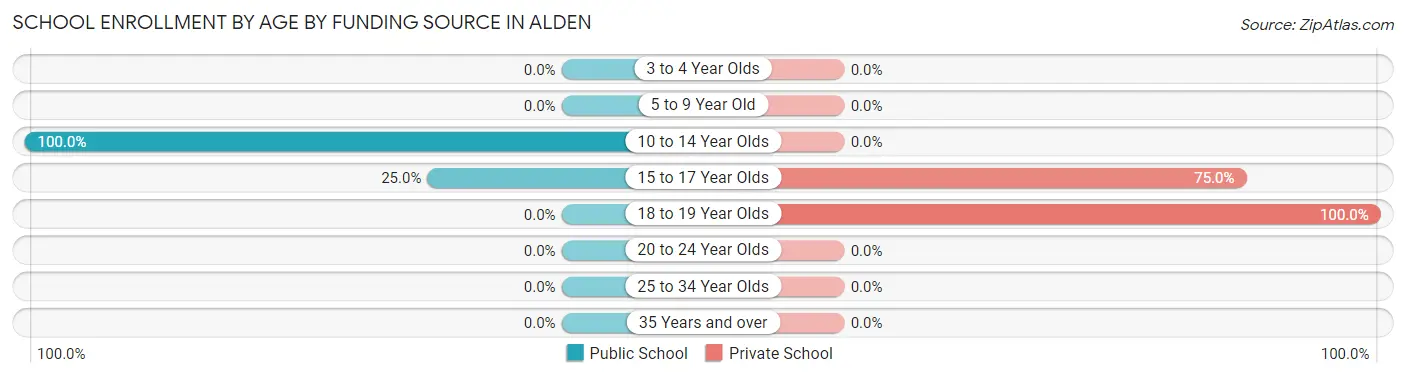
Out of a total of 27 students who are enrolled in schools in Alden, 20 (74.1%) attend a private institution, while the remaining 7 (25.9%) are enrolled in public schools. The age group of 18 to 19 year olds has the highest likelihood of being enrolled in private schools, with 8 (100.0% in the age bracket) enrolled. Conversely, the age group of 10 to 14 year olds has the lowest likelihood of being enrolled in a private school, with 3 (100.0% in the age bracket) attending a public institution.
| Age Bracket | Public School | Private School |
| 3 to 4 Year Olds | 0 (0.0%) | 0 (0.0%) |
| 5 to 9 Year Old | 0 (0.0%) | 0 (0.0%) |
| 10 to 14 Year Olds | 3 (100.0%) | 0 (0.0%) |
| 15 to 17 Year Olds | 4 (25.0%) | 12 (75.0%) |
| 18 to 19 Year Olds | 0 (0.0%) | 8 (100.0%) |
| 20 to 24 Year Olds | 0 (0.0%) | 0 (0.0%) |
| 25 to 34 Year Olds | 0 (0.0%) | 0 (0.0%) |
| 35 Years and over | 0 (0.0%) | 0 (0.0%) |
| Total | 7 (25.9%) | 20 (74.1%) |
Educational Attainment by Field of Study in Alden
Communications (12 | 54.5%), social sciences (4 | 18.2%), education (4 | 18.2%), and science & technology (2 | 9.1%) are the most common fields of study among 22 individuals in Alden who have obtained a bachelor's degree or higher.
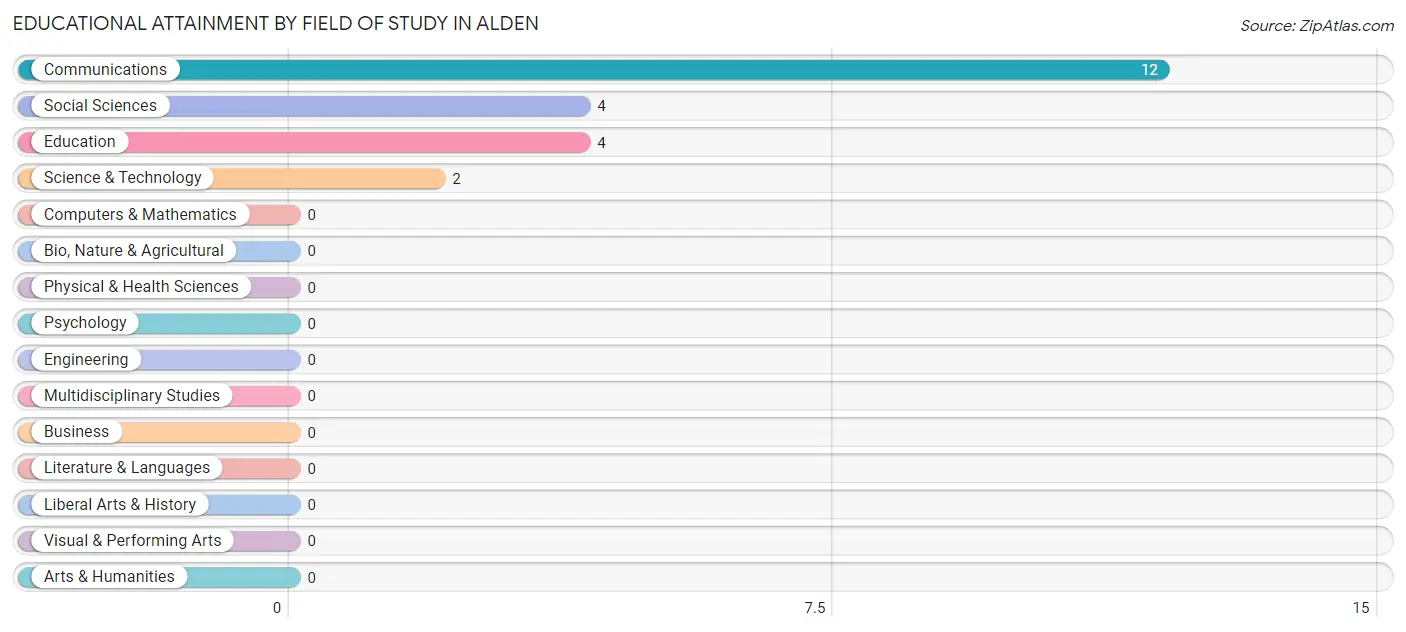
| Field of Study | # Graduates | % Graduates |
| Computers & Mathematics | 0 | 0.0% |
| Bio, Nature & Agricultural | 0 | 0.0% |
| Physical & Health Sciences | 0 | 0.0% |
| Psychology | 0 | 0.0% |
| Social Sciences | 4 | 18.2% |
| Engineering | 0 | 0.0% |
| Multidisciplinary Studies | 0 | 0.0% |
| Science & Technology | 2 | 9.1% |
| Business | 0 | 0.0% |
| Education | 4 | 18.2% |
| Literature & Languages | 0 | 0.0% |
| Liberal Arts & History | 0 | 0.0% |
| Visual & Performing Arts | 0 | 0.0% |
| Communications | 12 | 54.5% |
| Arts & Humanities | 0 | 0.0% |
| Total | 22 | 100.0% |
Transportation & Commute in Alden
Vehicle Availability by Sex in Alden
The most prevalent vehicle ownership categories in Alden are males with 3 vehicles (12, accounting for 60.0%) and females with 3 vehicles (0, making up 40.0%).
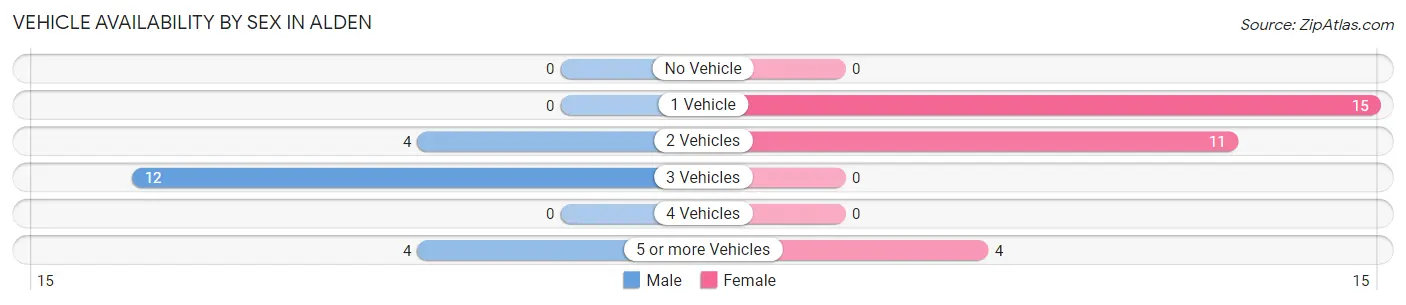
| Vehicles Available | Male | Female |
| No Vehicle | 0 (0.0%) | 0 (0.0%) |
| 1 Vehicle | 0 (0.0%) | 15 (50.0%) |
| 2 Vehicles | 4 (20.0%) | 11 (36.7%) |
| 3 Vehicles | 12 (60.0%) | 0 (0.0%) |
| 4 Vehicles | 0 (0.0%) | 0 (0.0%) |
| 5 or more Vehicles | 4 (20.0%) | 4 (13.3%) |
| Total | 20 (100.0%) | 30 (100.0%) |
Commute Time in Alden
The most frequently occuring commute durations in Alden are less than 5 minutes (15 commuters, 39.5%), 30 to 34 minutes (8 commuters, 21.0%), and 15 to 19 minutes (7 commuters, 18.4%).
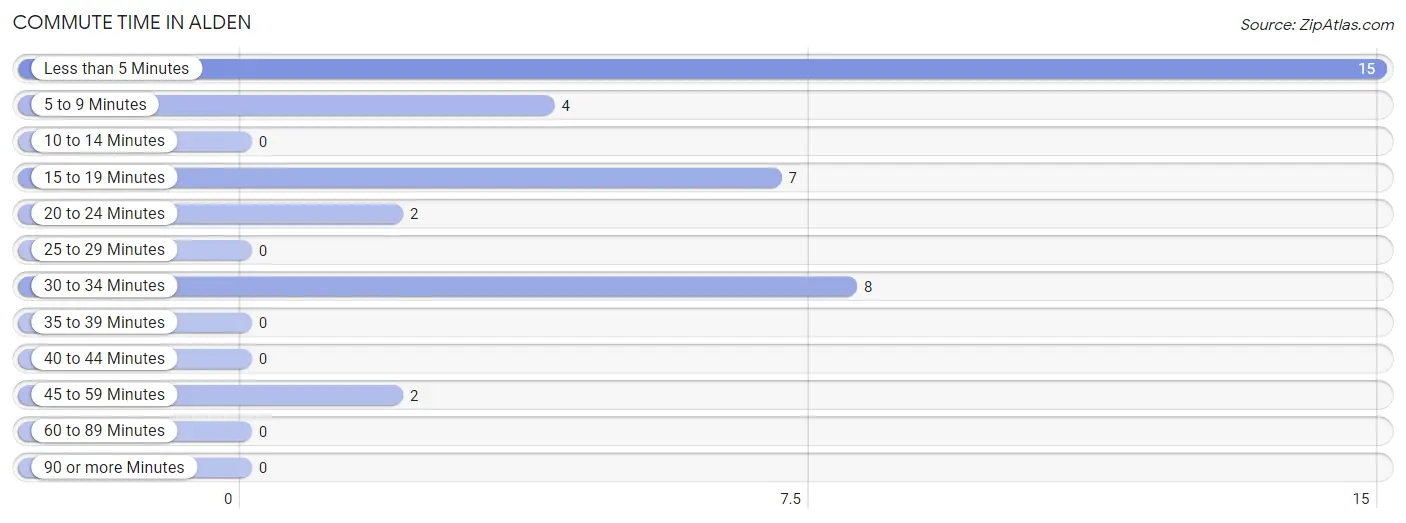
| Commute Time | # Commuters | % Commuters |
| Less than 5 Minutes | 15 | 39.5% |
| 5 to 9 Minutes | 4 | 10.5% |
| 10 to 14 Minutes | 0 | 0.0% |
| 15 to 19 Minutes | 7 | 18.4% |
| 20 to 24 Minutes | 2 | 5.3% |
| 25 to 29 Minutes | 0 | 0.0% |
| 30 to 34 Minutes | 8 | 21.0% |
| 35 to 39 Minutes | 0 | 0.0% |
| 40 to 44 Minutes | 0 | 0.0% |
| 45 to 59 Minutes | 2 | 5.3% |
| 60 to 89 Minutes | 0 | 0.0% |
| 90 or more Minutes | 0 | 0.0% |
Commute Time by Sex in Alden
The most common commute times in Alden are less than 5 minutes (4 commuters, 50.0%) for males and less than 5 minutes (11 commuters, 36.7%) for females.
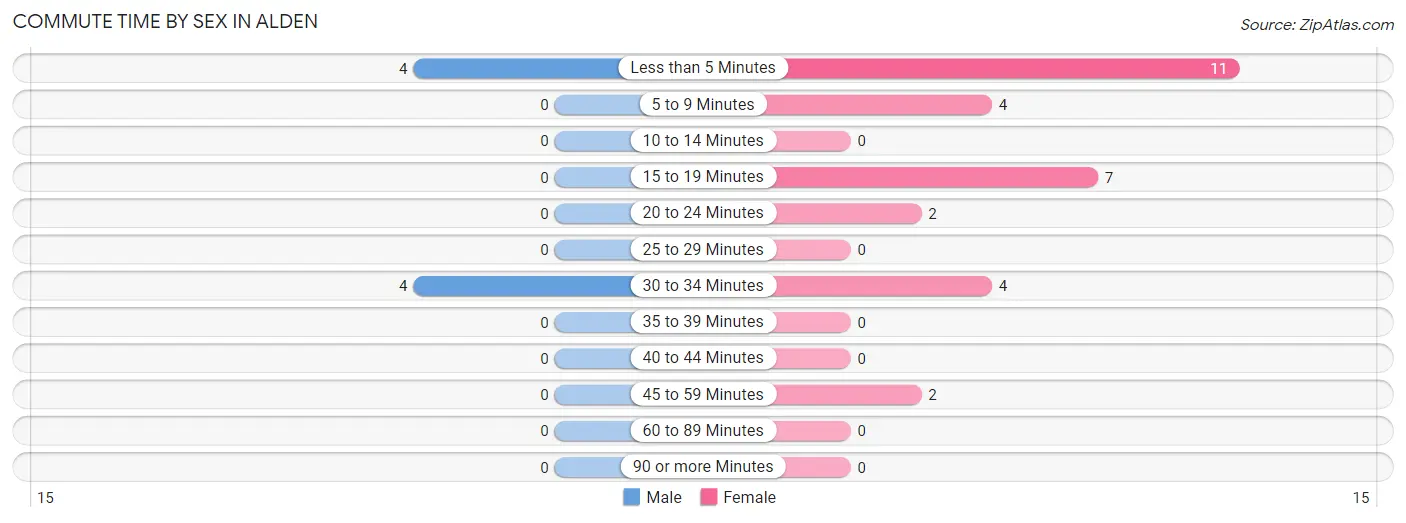
| Commute Time | Male | Female |
| Less than 5 Minutes | 4 (50.0%) | 11 (36.7%) |
| 5 to 9 Minutes | 0 (0.0%) | 4 (13.3%) |
| 10 to 14 Minutes | 0 (0.0%) | 0 (0.0%) |
| 15 to 19 Minutes | 0 (0.0%) | 7 (23.3%) |
| 20 to 24 Minutes | 0 (0.0%) | 2 (6.7%) |
| 25 to 29 Minutes | 0 (0.0%) | 0 (0.0%) |
| 30 to 34 Minutes | 4 (50.0%) | 4 (13.3%) |
| 35 to 39 Minutes | 0 (0.0%) | 0 (0.0%) |
| 40 to 44 Minutes | 0 (0.0%) | 0 (0.0%) |
| 45 to 59 Minutes | 0 (0.0%) | 2 (6.7%) |
| 60 to 89 Minutes | 0 (0.0%) | 0 (0.0%) |
| 90 or more Minutes | 0 (0.0%) | 0 (0.0%) |
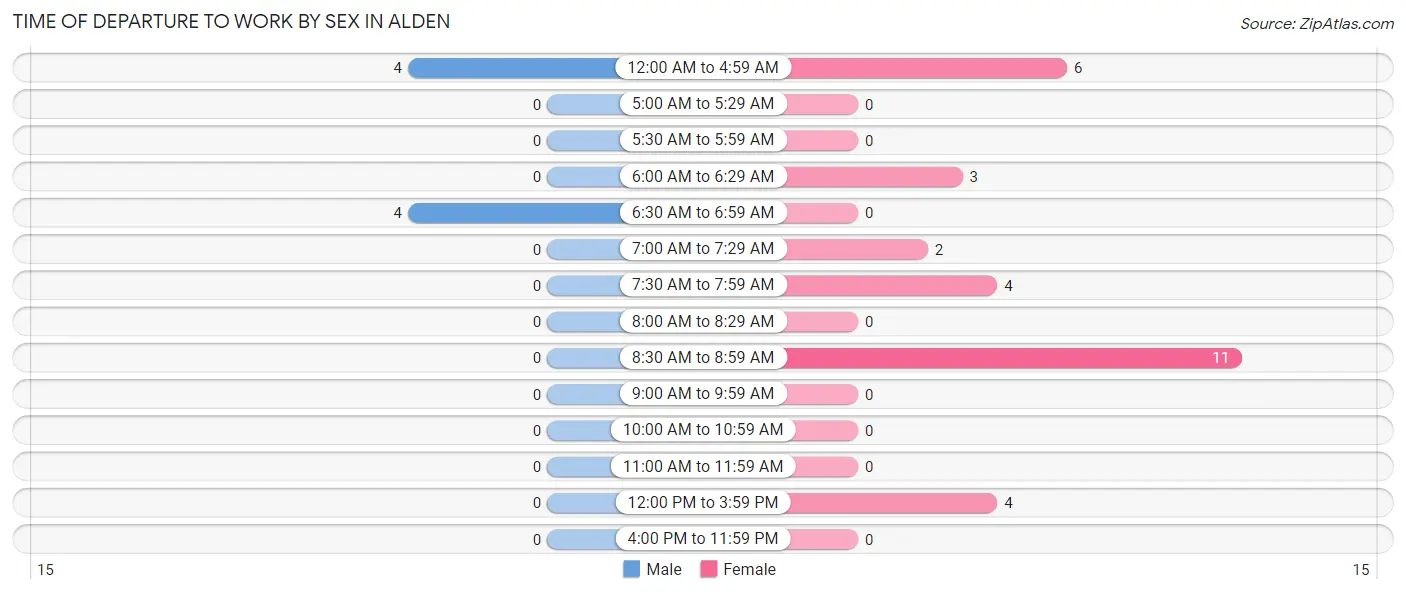
Time of Departure to Work by Sex in Alden
The most frequent times of departure to work in Alden are 12:00 AM to 4:59 AM (4, 50.0%) for males and 8:30 AM to 8:59 AM (11, 36.7%) for females.
| Time of Departure | Male | Female |
| 12:00 AM to 4:59 AM | 4 (50.0%) | 6 (20.0%) |
| 5:00 AM to 5:29 AM | 0 (0.0%) | 0 (0.0%) |
| 5:30 AM to 5:59 AM | 0 (0.0%) | 0 (0.0%) |
| 6:00 AM to 6:29 AM | 0 (0.0%) | 3 (10.0%) |
| 6:30 AM to 6:59 AM | 4 (50.0%) | 0 (0.0%) |
| 7:00 AM to 7:29 AM | 0 (0.0%) | 2 (6.7%) |
| 7:30 AM to 7:59 AM | 0 (0.0%) | 4 (13.3%) |
| 8:00 AM to 8:29 AM | 0 (0.0%) | 0 (0.0%) |
| 8:30 AM to 8:59 AM | 0 (0.0%) | 11 (36.7%) |
| 9:00 AM to 9:59 AM | 0 (0.0%) | 0 (0.0%) |
| 10:00 AM to 10:59 AM | 0 (0.0%) | 0 (0.0%) |
| 11:00 AM to 11:59 AM | 0 (0.0%) | 0 (0.0%) |
| 12:00 PM to 3:59 PM | 0 (0.0%) | 4 (13.3%) |
| 4:00 PM to 11:59 PM | 0 (0.0%) | 0 (0.0%) |
| Total | 8 (100.0%) | 30 (100.0%) |
Housing Occupancy in Alden
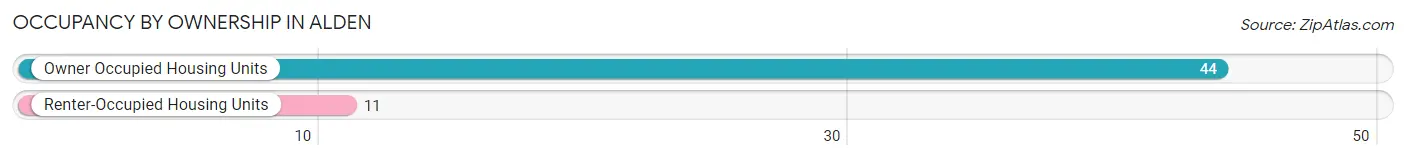
Occupancy by Ownership in Alden
Of the total 55 dwellings in Alden, owner-occupied units account for 44 (80.0%), while renter-occupied units make up 11 (20.0%).
| Occupancy | # Housing Units | % Housing Units |
| Owner Occupied Housing Units | 44 | 80.0% |
| Renter-Occupied Housing Units | 11 | 20.0% |
| Total Occupied Housing Units | 55 | 100.0% |
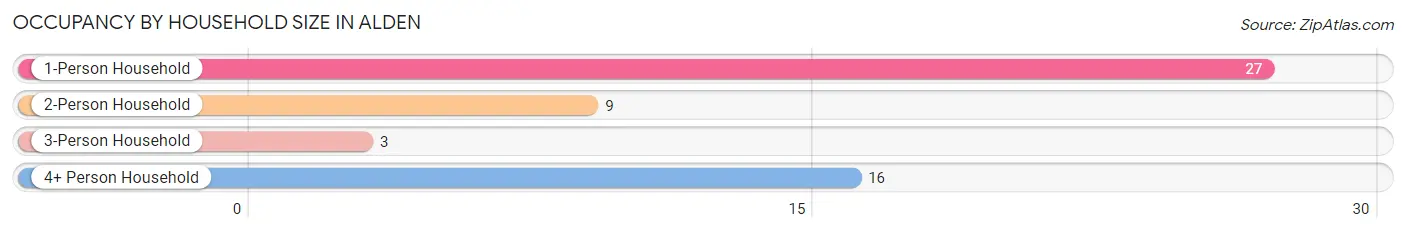
Occupancy by Household Size in Alden
| Household Size | # Housing Units | % Housing Units |
| 1-Person Household | 27 | 49.1% |
| 2-Person Household | 9 | 16.4% |
| 3-Person Household | 3 | 5.4% |
| 4+ Person Household | 16 | 29.1% |
| Total Housing Units | 55 | 100.0% |
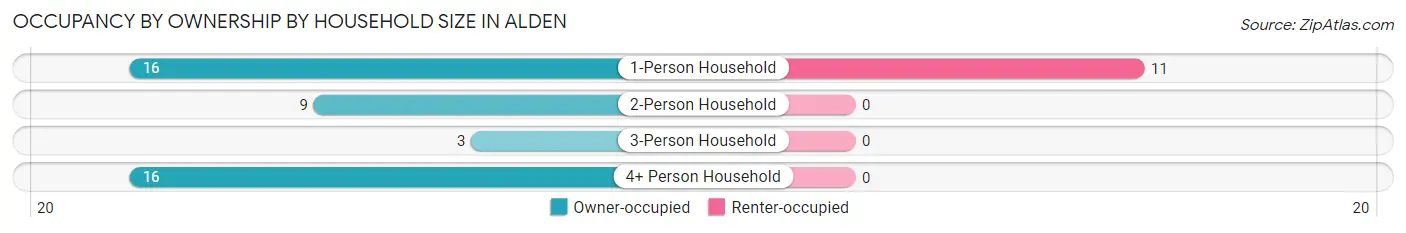
Occupancy by Ownership by Household Size in Alden
| Household Size | Owner-occupied | Renter-occupied |
| 1-Person Household | 16 (59.3%) | 11 (40.7%) |
| 2-Person Household | 9 (100.0%) | 0 (0.0%) |
| 3-Person Household | 3 (100.0%) | 0 (0.0%) |
| 4+ Person Household | 16 (100.0%) | 0 (0.0%) |
| Total Housing Units | 44 (80.0%) | 11 (20.0%) |
Occupancy by Educational Attainment in Alden
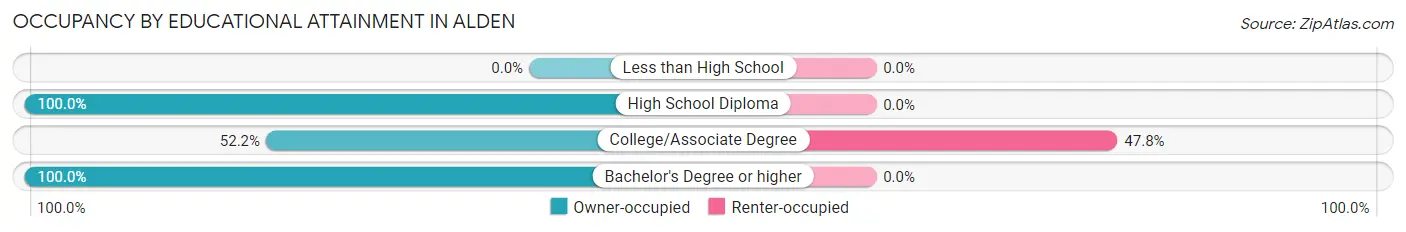
| Household Size | Owner-occupied | Renter-occupied |
| Less than High School | 0 (0.0%) | 0 (0.0%) |
| High School Diploma | 22 (100.0%) | 0 (0.0%) |
| College/Associate Degree | 12 (52.2%) | 11 (47.8%) |
| Bachelor's Degree or higher | 10 (100.0%) | 0 (0.0%) |
Occupancy by Age of Householder in Alden
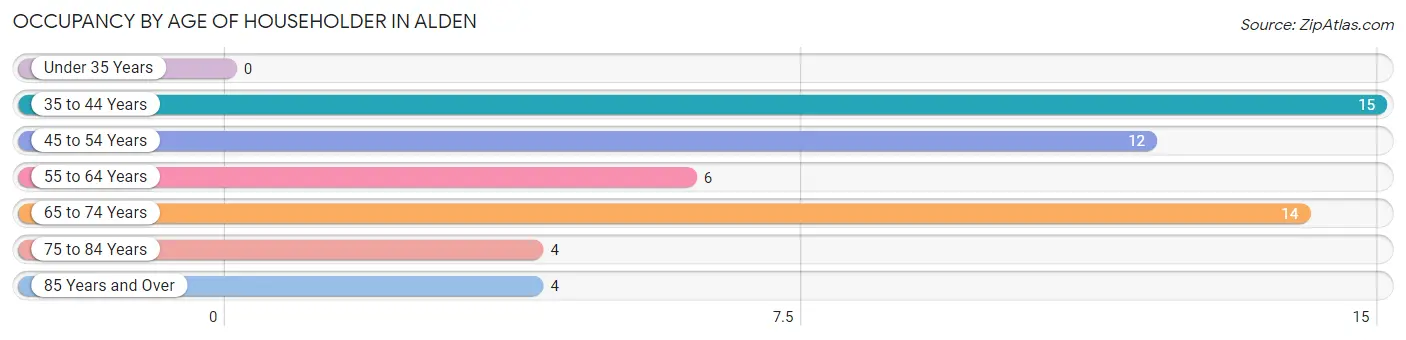
| Age Bracket | # Households | % Households |
| Under 35 Years | 0 | 0.0% |
| 35 to 44 Years | 15 | 27.3% |
| 45 to 54 Years | 12 | 21.8% |
| 55 to 64 Years | 6 | 10.9% |
| 65 to 74 Years | 14 | 25.5% |
| 75 to 84 Years | 4 | 7.3% |
| 85 Years and Over | 4 | 7.3% |
| Total | 55 | 100.0% |
Housing Finances in Alden
Median Income by Occupancy in Alden
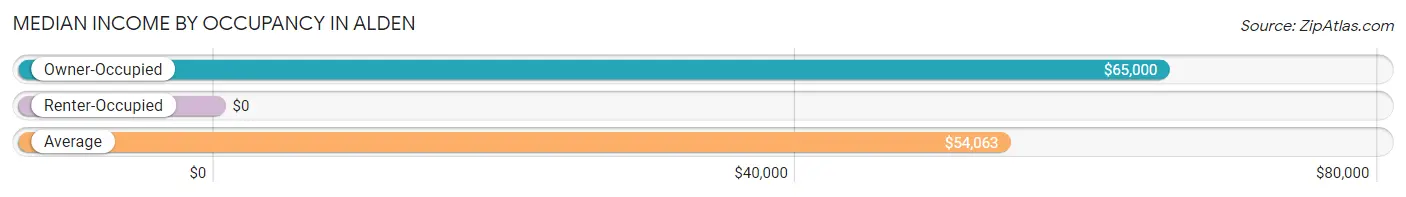
| Occupancy Type | # Households | Median Income |
| Owner-Occupied | 44 (80.0%) | $65,000 |
| Renter-Occupied | 11 (20.0%) | $0 |
| Average | 55 (100.0%) | $54,063 |
Occupancy by Householder Income Bracket in Alden
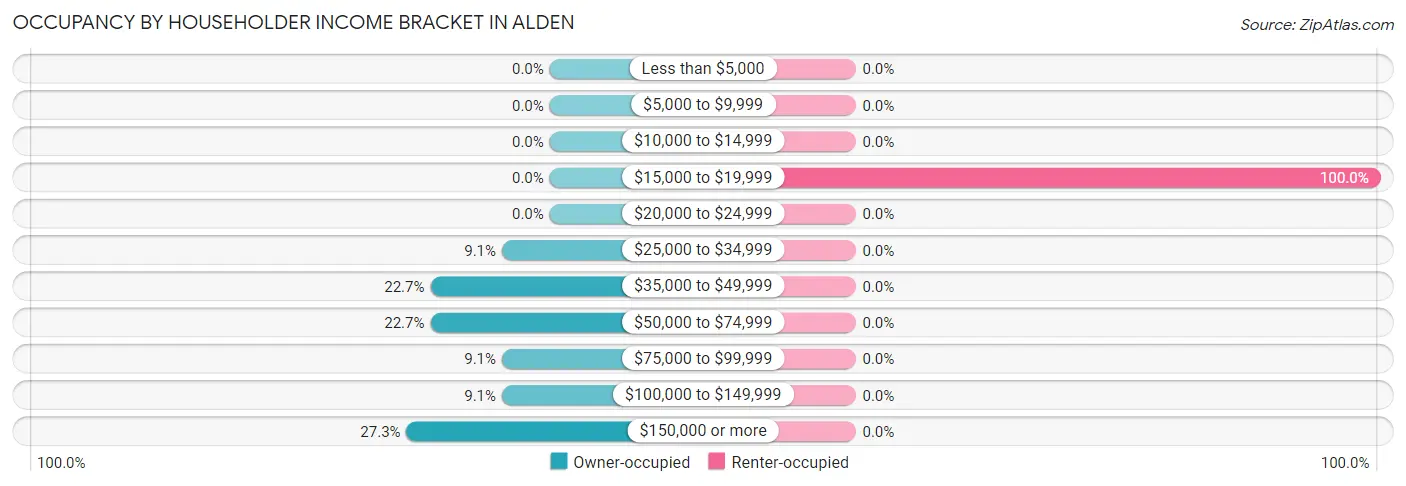
| Income Bracket | Owner-occupied | Renter-occupied |
| Less than $5,000 | 0 (0.0%) | 0 (0.0%) |
| $5,000 to $9,999 | 0 (0.0%) | 0 (0.0%) |
| $10,000 to $14,999 | 0 (0.0%) | 0 (0.0%) |
| $15,000 to $19,999 | 0 (0.0%) | 11 (100.0%) |
| $20,000 to $24,999 | 0 (0.0%) | 0 (0.0%) |
| $25,000 to $34,999 | 4 (9.1%) | 0 (0.0%) |
| $35,000 to $49,999 | 10 (22.7%) | 0 (0.0%) |
| $50,000 to $74,999 | 10 (22.7%) | 0 (0.0%) |
| $75,000 to $99,999 | 4 (9.1%) | 0 (0.0%) |
| $100,000 to $149,999 | 4 (9.1%) | 0 (0.0%) |
| $150,000 or more | 12 (27.3%) | 0 (0.0%) |
| Total | 44 (100.0%) | 11 (100.0%) |
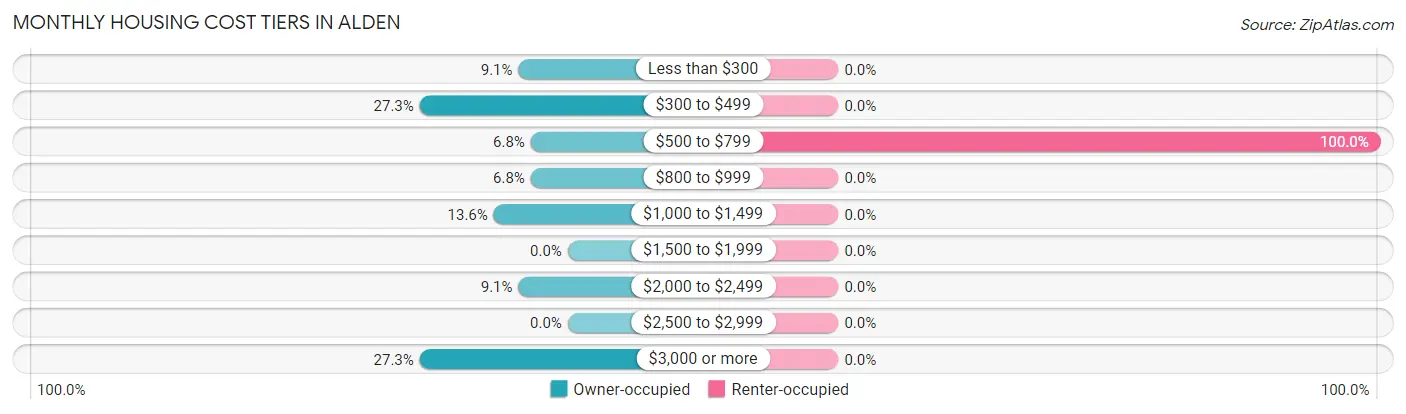
Monthly Housing Cost Tiers in Alden
| Monthly Cost | Owner-occupied | Renter-occupied |
| Less than $300 | 4 (9.1%) | 0 (0.0%) |
| $300 to $499 | 12 (27.3%) | 0 (0.0%) |
| $500 to $799 | 3 (6.8%) | 11 (100.0%) |
| $800 to $999 | 3 (6.8%) | 0 (0.0%) |
| $1,000 to $1,499 | 6 (13.6%) | 0 (0.0%) |
| $1,500 to $1,999 | 0 (0.0%) | 0 (0.0%) |
| $2,000 to $2,499 | 4 (9.1%) | 0 (0.0%) |
| $2,500 to $2,999 | 0 (0.0%) | 0 (0.0%) |
| $3,000 or more | 12 (27.3%) | 0 (0.0%) |
| Total | 44 (100.0%) | 11 (100.0%) |
Physical Housing Characteristics in Alden
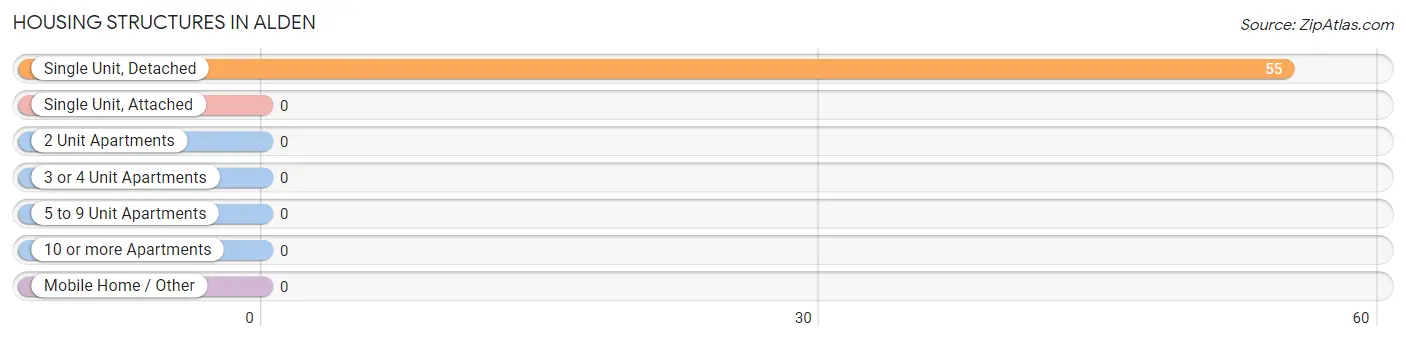
Housing Structures in Alden
| Structure Type | # Housing Units | % Housing Units |
| Single Unit, Detached | 55 | 100.0% |
| Single Unit, Attached | 0 | 0.0% |
| 2 Unit Apartments | 0 | 0.0% |
| 3 or 4 Unit Apartments | 0 | 0.0% |
| 5 to 9 Unit Apartments | 0 | 0.0% |
| 10 or more Apartments | 0 | 0.0% |
| Mobile Home / Other | 0 | 0.0% |
| Total | 55 | 100.0% |
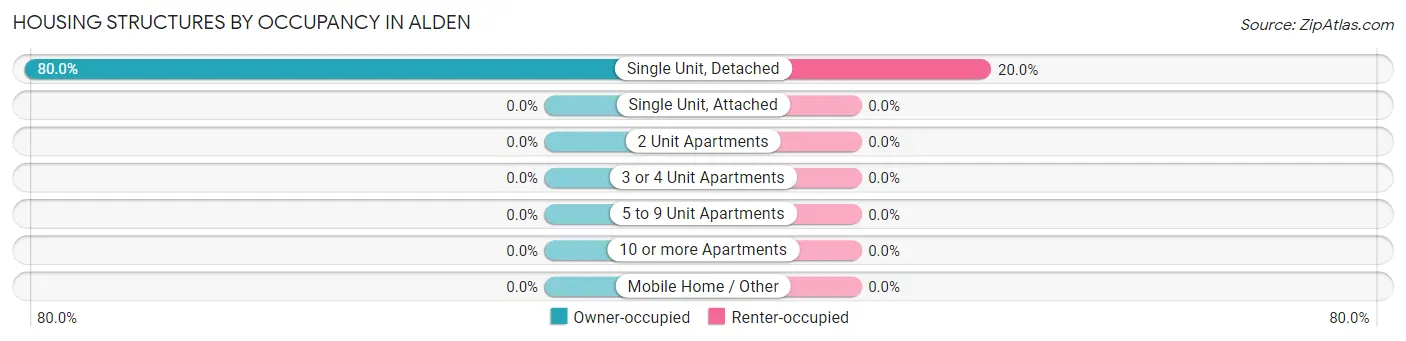
Housing Structures by Occupancy in Alden
| Structure Type | Owner-occupied | Renter-occupied |
| Single Unit, Detached | 44 (80.0%) | 11 (20.0%) |
| Single Unit, Attached | 0 (0.0%) | 0 (0.0%) |
| 2 Unit Apartments | 0 (0.0%) | 0 (0.0%) |
| 3 or 4 Unit Apartments | 0 (0.0%) | 0 (0.0%) |
| 5 to 9 Unit Apartments | 0 (0.0%) | 0 (0.0%) |
| 10 or more Apartments | 0 (0.0%) | 0 (0.0%) |
| Mobile Home / Other | 0 (0.0%) | 0 (0.0%) |
| Total | 44 (80.0%) | 11 (20.0%) |
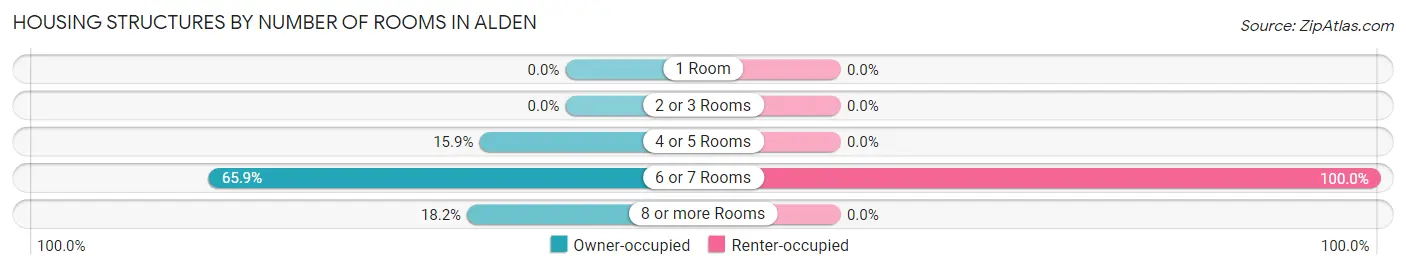
Housing Structures by Number of Rooms in Alden
| Number of Rooms | Owner-occupied | Renter-occupied |
| 1 Room | 0 (0.0%) | 0 (0.0%) |
| 2 or 3 Rooms | 0 (0.0%) | 0 (0.0%) |
| 4 or 5 Rooms | 7 (15.9%) | 0 (0.0%) |
| 6 or 7 Rooms | 29 (65.9%) | 11 (100.0%) |
| 8 or more Rooms | 8 (18.2%) | 0 (0.0%) |
| Total | 44 (100.0%) | 11 (100.0%) |
Housing Structure by Heating Type in Alden
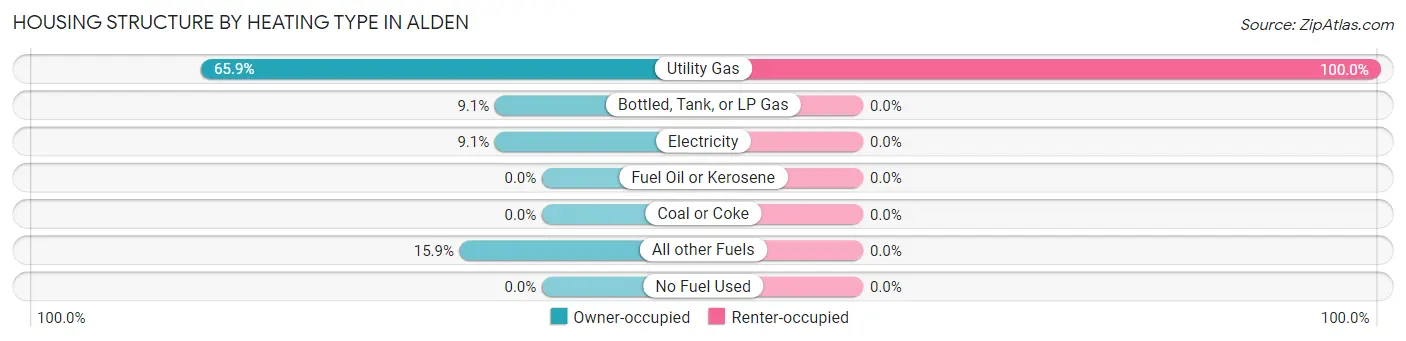
| Heating Type | Owner-occupied | Renter-occupied |
| Utility Gas | 29 (65.9%) | 11 (100.0%) |
| Bottled, Tank, or LP Gas | 4 (9.1%) | 0 (0.0%) |
| Electricity | 4 (9.1%) | 0 (0.0%) |
| Fuel Oil or Kerosene | 0 (0.0%) | 0 (0.0%) |
| Coal or Coke | 0 (0.0%) | 0 (0.0%) |
| All other Fuels | 7 (15.9%) | 0 (0.0%) |
| No Fuel Used | 0 (0.0%) | 0 (0.0%) |
| Total | 44 (100.0%) | 11 (100.0%) |
Household Vehicle Usage in Alden
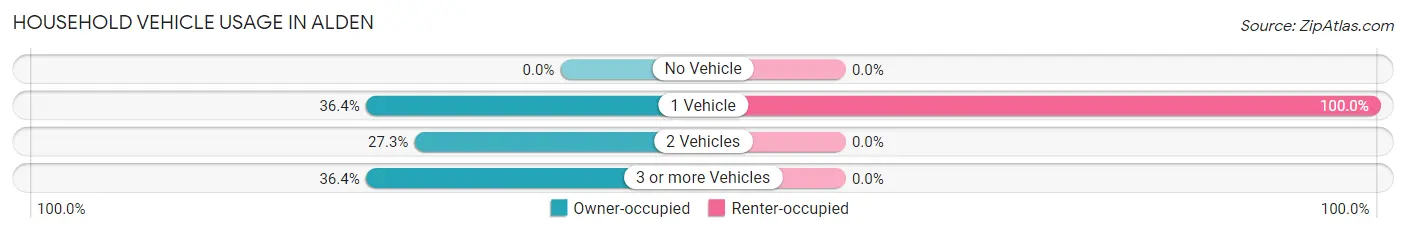
| Vehicles per Household | Owner-occupied | Renter-occupied |
| No Vehicle | 0 (0.0%) | 0 (0.0%) |
| 1 Vehicle | 16 (36.4%) | 11 (100.0%) |
| 2 Vehicles | 12 (27.3%) | 0 (0.0%) |
| 3 or more Vehicles | 16 (36.4%) | 0 (0.0%) |
| Total | 44 (100.0%) | 11 (100.0%) |
Real Estate & Mortgages in Alden
Real Estate and Mortgage Overview in Alden
| Characteristic | Without Mortgage | With Mortgage |
| Housing Units | 16 | 28 |
| Median Property Value | $141,700 | $0 |
| Median Household Income | $45,000 | $12 |
| Monthly Housing Costs | $383 | $12 |
| Real Estate Taxes | $1,750 | $0 |
Property Value by Mortgage Status in Alden
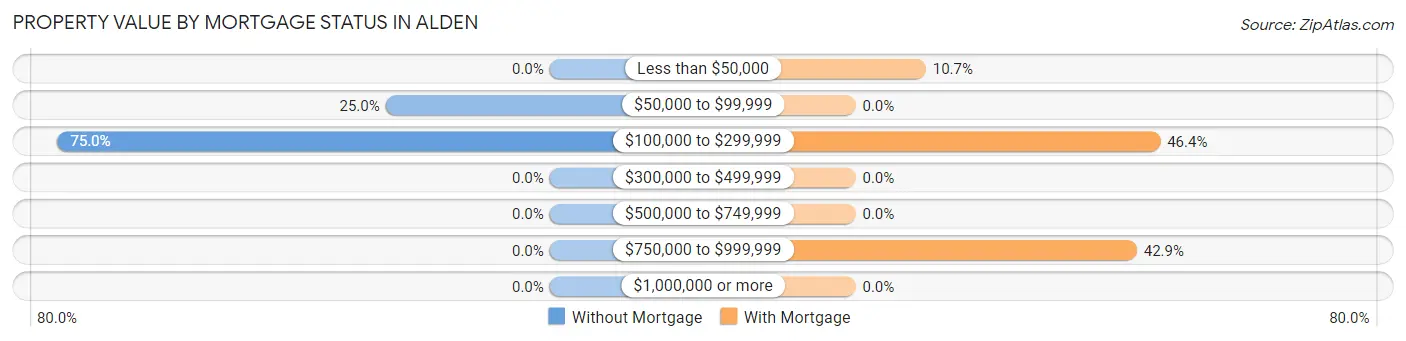
| Property Value | Without Mortgage | With Mortgage |
| Less than $50,000 | 0 (0.0%) | 3 (10.7%) |
| $50,000 to $99,999 | 4 (25.0%) | 0 (0.0%) |
| $100,000 to $299,999 | 12 (75.0%) | 13 (46.4%) |
| $300,000 to $499,999 | 0 (0.0%) | 0 (0.0%) |
| $500,000 to $749,999 | 0 (0.0%) | 0 (0.0%) |
| $750,000 to $999,999 | 0 (0.0%) | 12 (42.9%) |
| $1,000,000 or more | 0 (0.0%) | 0 (0.0%) |
| Total | 16 (100.0%) | 28 (100.0%) |
Household Income by Mortgage Status in Alden
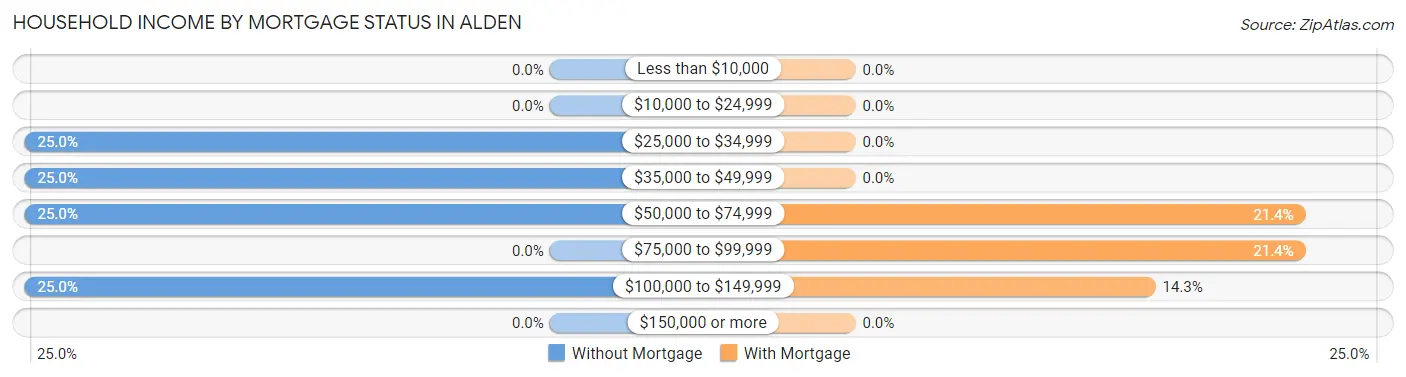
| Household Income | Without Mortgage | With Mortgage |
| Less than $10,000 | 0 (0.0%) | 0 (0.0%) |
| $10,000 to $24,999 | 0 (0.0%) | 0 (0.0%) |
| $25,000 to $34,999 | 4 (25.0%) | 0 (0.0%) |
| $35,000 to $49,999 | 4 (25.0%) | 0 (0.0%) |
| $50,000 to $74,999 | 4 (25.0%) | 6 (21.4%) |
| $75,000 to $99,999 | 0 (0.0%) | 6 (21.4%) |
| $100,000 to $149,999 | 4 (25.0%) | 4 (14.3%) |
| $150,000 or more | 0 (0.0%) | 0 (0.0%) |
| Total | 16 (100.0%) | 28 (100.0%) |
Property Value to Household Income Ratio in Alden
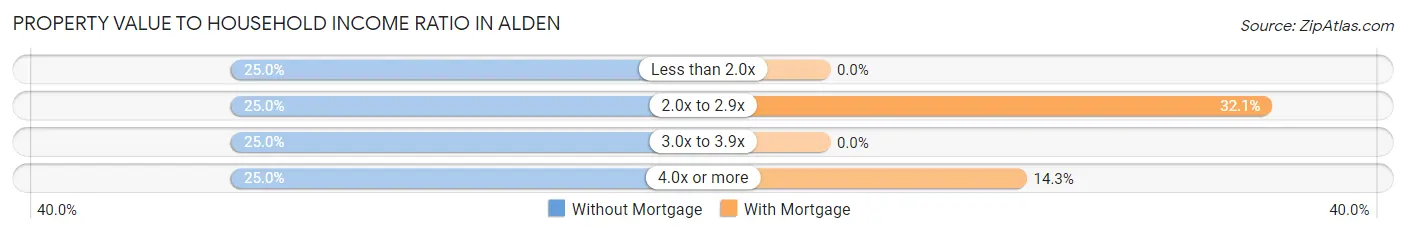
| Value-to-Income Ratio | Without Mortgage | With Mortgage |
| Less than 2.0x | 4 (25.0%) | 0 (0.0%) |
| 2.0x to 2.9x | 4 (25.0%) | 9 (32.1%) |
| 3.0x to 3.9x | 4 (25.0%) | 0 (0.0%) |
| 4.0x or more | 4 (25.0%) | 4 (14.3%) |
| Total | 16 (100.0%) | 28 (100.0%) |
Real Estate Taxes by Mortgage Status in Alden
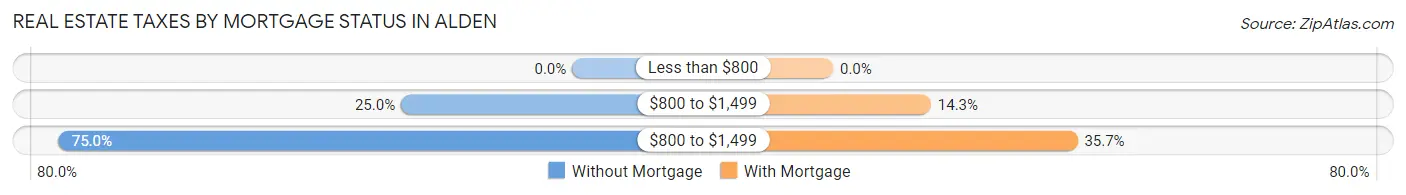
| Property Taxes | Without Mortgage | With Mortgage |
| Less than $800 | 0 (0.0%) | 0 (0.0%) |
| $800 to $1,499 | 4 (25.0%) | 4 (14.3%) |
| $800 to $1,499 | 12 (75.0%) | 10 (35.7%) |
| Total | 16 (100.0%) | 28 (100.0%) |
Health & Disability in Alden
Health Insurance Coverage by Age in Alden
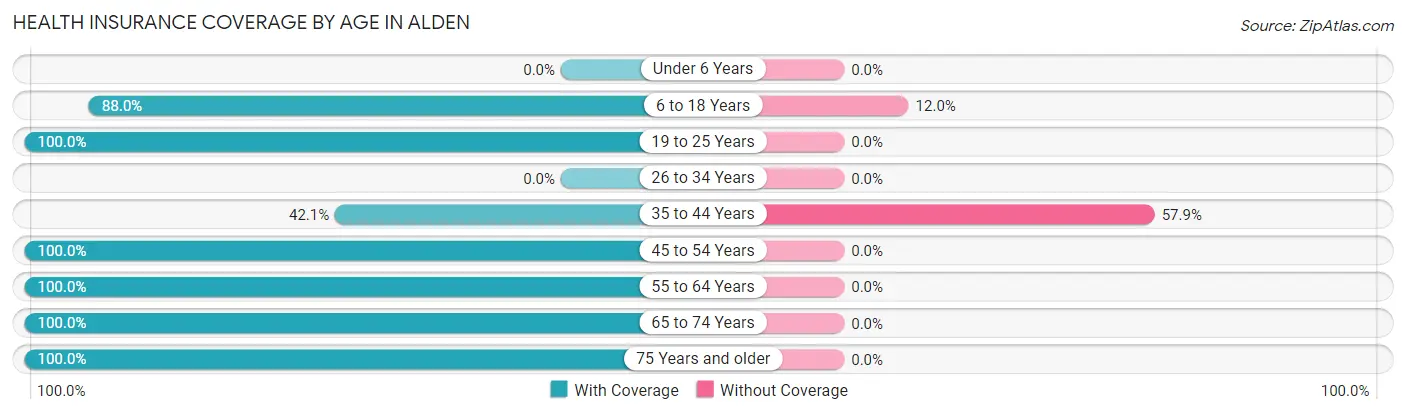
| Age Bracket | With Coverage | Without Coverage |
| Under 6 Years | 0 (0.0%) | 0 (0.0%) |
| 6 to 18 Years | 22 (88.0%) | 3 (12.0%) |
| 19 to 25 Years | 2 (100.0%) | 0 (0.0%) |
| 26 to 34 Years | 0 (0.0%) | 0 (0.0%) |
| 35 to 44 Years | 8 (42.1%) | 11 (57.9%) |
| 45 to 54 Years | 24 (100.0%) | 0 (0.0%) |
| 55 to 64 Years | 16 (100.0%) | 0 (0.0%) |
| 65 to 74 Years | 18 (100.0%) | 0 (0.0%) |
| 75 Years and older | 8 (100.0%) | 0 (0.0%) |
| Total | 98 (87.5%) | 14 (12.5%) |
Health Insurance Coverage by Citizenship Status in Alden
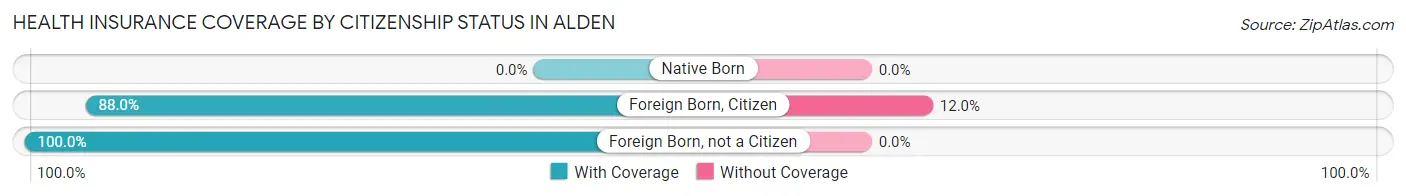
| Citizenship Status | With Coverage | Without Coverage |
| Native Born | 0 (0.0%) | 0 (0.0%) |
| Foreign Born, Citizen | 22 (88.0%) | 3 (12.0%) |
| Foreign Born, not a Citizen | 2 (100.0%) | 0 (0.0%) |
Health Insurance Coverage by Household Income in Alden
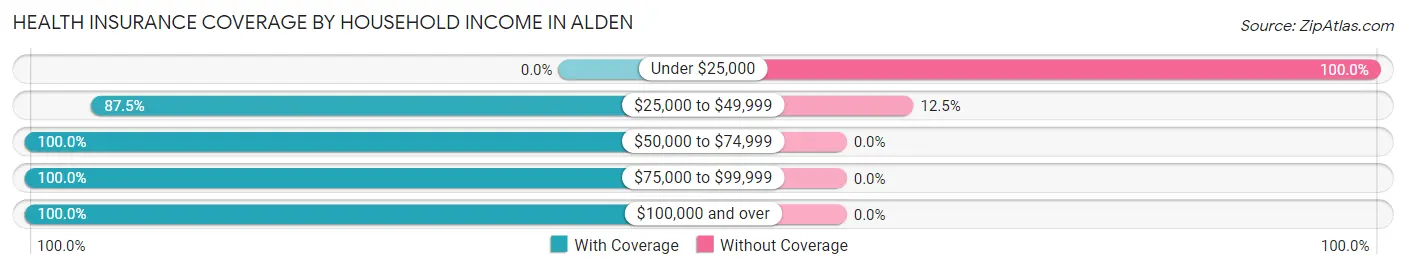
| Household Income | With Coverage | Without Coverage |
| Under $25,000 | 0 (0.0%) | 11 (100.0%) |
| $25,000 to $49,999 | 21 (87.5%) | 3 (12.5%) |
| $50,000 to $74,999 | 23 (100.0%) | 0 (0.0%) |
| $75,000 to $99,999 | 8 (100.0%) | 0 (0.0%) |
| $100,000 and over | 46 (100.0%) | 0 (0.0%) |
Public vs Private Health Insurance Coverage by Age in Alden
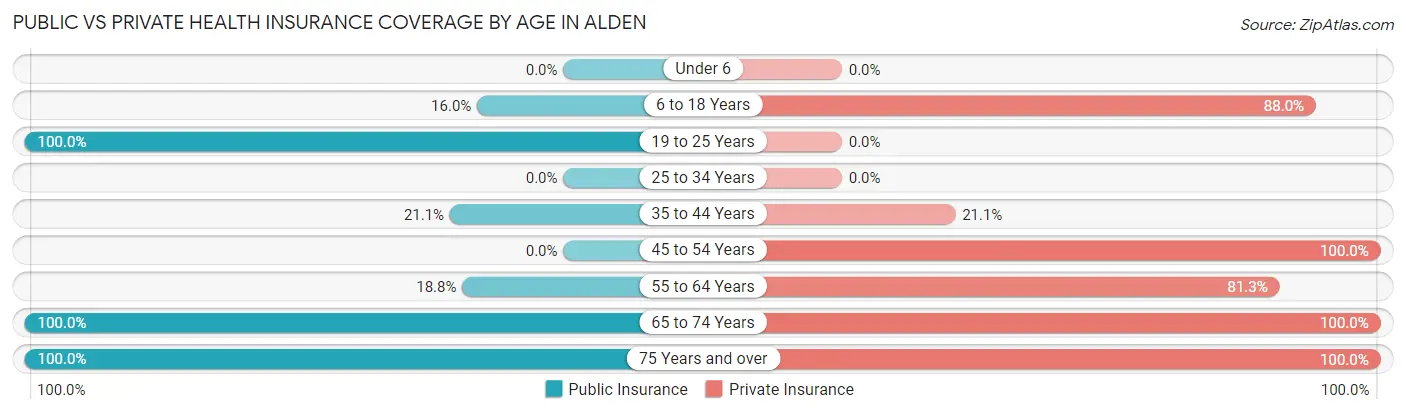
| Age Bracket | Public Insurance | Private Insurance |
| Under 6 | 0 (0.0%) | 0 (0.0%) |
| 6 to 18 Years | 4 (16.0%) | 22 (88.0%) |
| 19 to 25 Years | 2 (100.0%) | 0 (0.0%) |
| 25 to 34 Years | 0 (0.0%) | 0 (0.0%) |
| 35 to 44 Years | 4 (21.0%) | 4 (21.0%) |
| 45 to 54 Years | 0 (0.0%) | 24 (100.0%) |
| 55 to 64 Years | 3 (18.8%) | 13 (81.2%) |
| 65 to 74 Years | 18 (100.0%) | 18 (100.0%) |
| 75 Years and over | 8 (100.0%) | 8 (100.0%) |
| Total | 39 (34.8%) | 89 (79.5%) |
Disability Status by Sex by Age in Alden
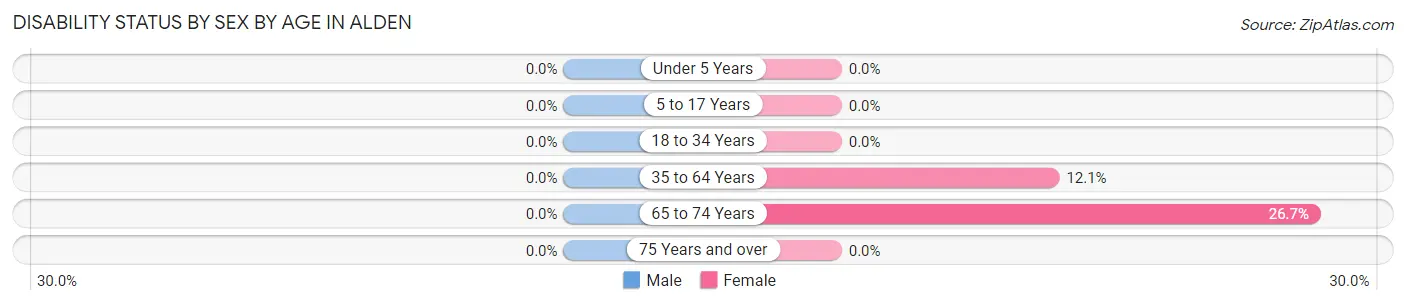
| Age Bracket | Male | Female |
| Under 5 Years | 0 (0.0%) | 0 (0.0%) |
| 5 to 17 Years | 0 (0.0%) | 0 (0.0%) |
| 18 to 34 Years | 0 (0.0%) | 0 (0.0%) |
| 35 to 64 Years | 0 (0.0%) | 4 (12.1%) |
| 65 to 74 Years | 0 (0.0%) | 4 (26.7%) |
| 75 Years and over | 0 (0.0%) | 0 (0.0%) |
Disability Class by Sex by Age in Alden
Disability Class: Hearing Difficulty
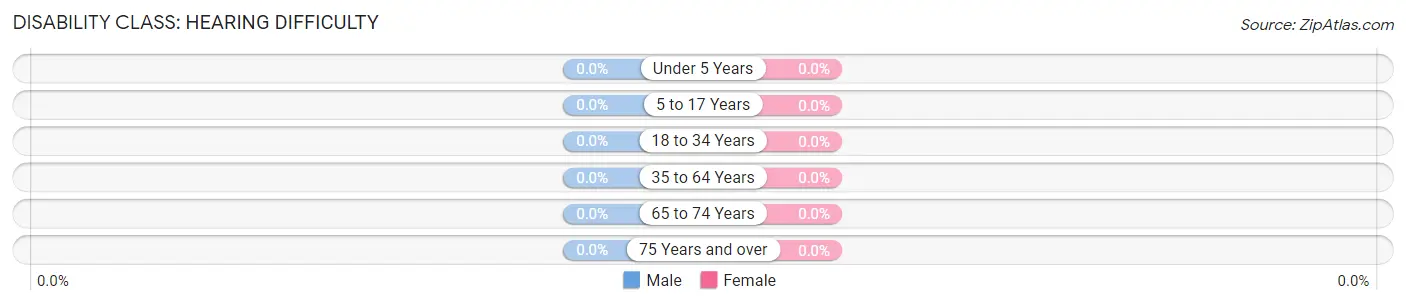
| Age Bracket | Male | Female |
| Under 5 Years | 0 (0.0%) | 0 (0.0%) |
| 5 to 17 Years | 0 (0.0%) | 0 (0.0%) |
| 18 to 34 Years | 0 (0.0%) | 0 (0.0%) |
| 35 to 64 Years | 0 (0.0%) | 0 (0.0%) |
| 65 to 74 Years | 0 (0.0%) | 0 (0.0%) |
| 75 Years and over | 0 (0.0%) | 0 (0.0%) |
Disability Class: Vision Difficulty
| Age Bracket | Male | Female |
| Under 5 Years | 0 (0.0%) | 0 (0.0%) |
| 5 to 17 Years | 0 (0.0%) | 0 (0.0%) |
| 18 to 34 Years | 0 (0.0%) | 0 (0.0%) |
| 35 to 64 Years | 0 (0.0%) | 0 (0.0%) |
| 65 to 74 Years | 0 (0.0%) | 0 (0.0%) |
| 75 Years and over | 0 (0.0%) | 0 (0.0%) |
Disability Class: Cognitive Difficulty
| Age Bracket | Male | Female |
| 5 to 17 Years | 0 (0.0%) | 0 (0.0%) |
| 18 to 34 Years | 0 (0.0%) | 0 (0.0%) |
| 35 to 64 Years | 0 (0.0%) | 0 (0.0%) |
| 65 to 74 Years | 0 (0.0%) | 0 (0.0%) |
| 75 Years and over | 0 (0.0%) | 0 (0.0%) |
Disability Class: Ambulatory Difficulty
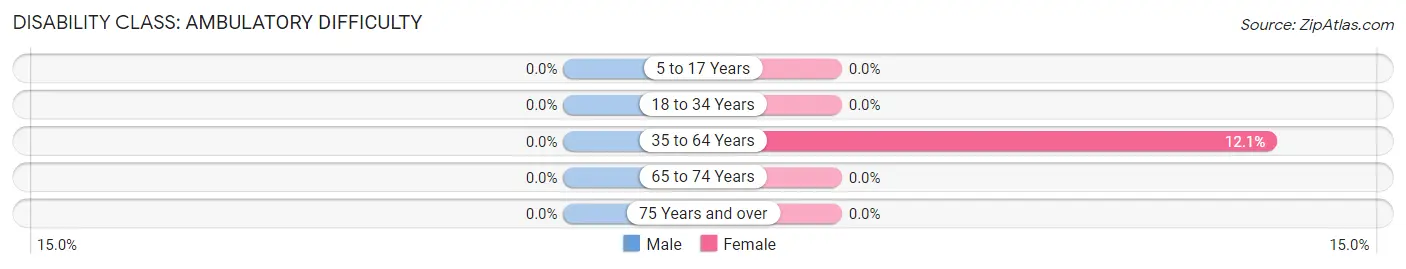
| Age Bracket | Male | Female |
| 5 to 17 Years | 0 (0.0%) | 0 (0.0%) |
| 18 to 34 Years | 0 (0.0%) | 0 (0.0%) |
| 35 to 64 Years | 0 (0.0%) | 4 (12.1%) |
| 65 to 74 Years | 0 (0.0%) | 0 (0.0%) |
| 75 Years and over | 0 (0.0%) | 0 (0.0%) |
Disability Class: Self-Care Difficulty
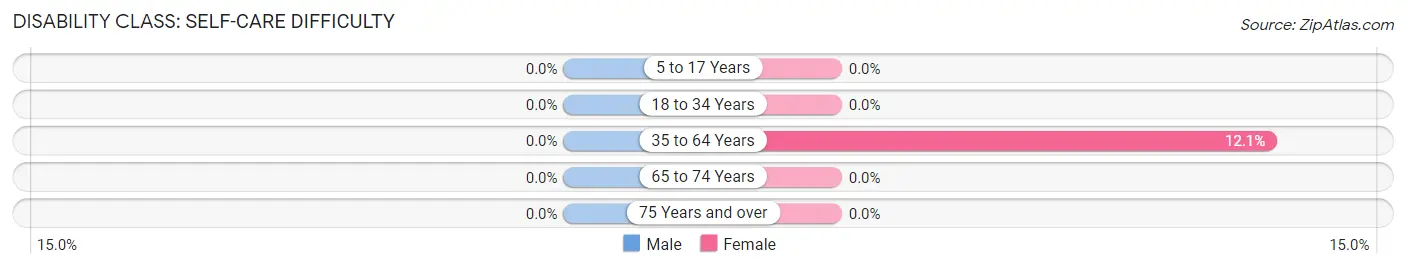
| Age Bracket | Male | Female |
| 5 to 17 Years | 0 (0.0%) | 0 (0.0%) |
| 18 to 34 Years | 0 (0.0%) | 0 (0.0%) |
| 35 to 64 Years | 0 (0.0%) | 4 (12.1%) |
| 65 to 74 Years | 0 (0.0%) | 0 (0.0%) |
| 75 Years and over | 0 (0.0%) | 0 (0.0%) |
Technology Access in Alden
Computing Device Access in Alden
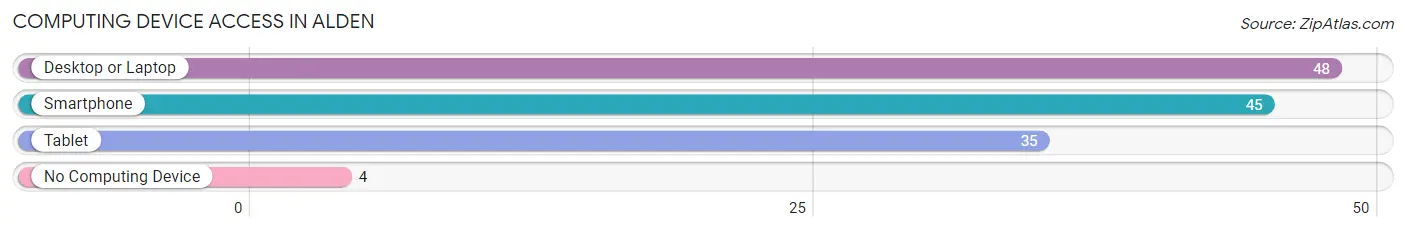
| Device Type | # Households | % Households |
| Desktop or Laptop | 48 | 87.3% |
| Smartphone | 45 | 81.8% |
| Tablet | 35 | 63.6% |
| No Computing Device | 4 | 7.3% |
| Total | 55 | 100.0% |
Internet Access in Alden
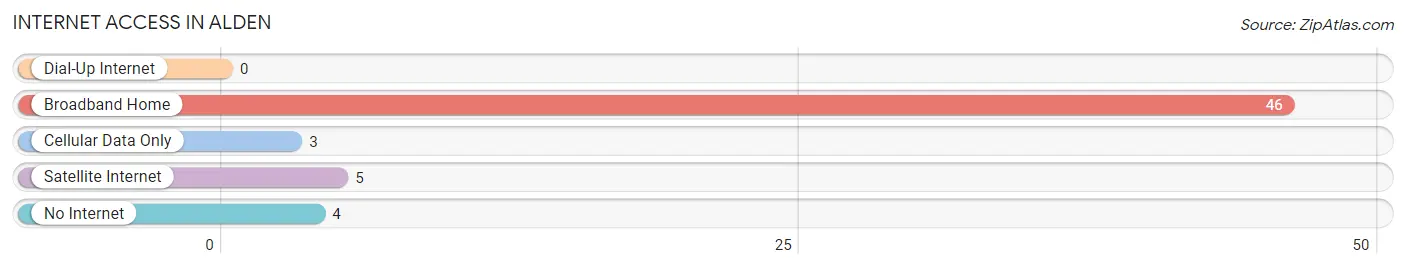
| Internet Type | # Households | % Households |
| Dial-Up Internet | 0 | 0.0% |
| Broadband Home | 46 | 83.6% |
| Cellular Data Only | 3 | 5.4% |
| Satellite Internet | 5 | 9.1% |
| No Internet | 4 | 7.3% |
| Total | 55 | 100.0% |
Alden Summary
Alden, Michigan is a small village located in Antrim County, in the northern part of the state. It is situated on the banks of the Intermediate River, and is surrounded by rolling hills and forests. The village has a population of approximately 1,000 people, and is a popular tourist destination due to its proximity to Torch Lake and the nearby ski resorts.
History
Alden was first settled in 1871 by a group of settlers from New York. The village was named after Alden B. Smith, a prominent local businessman. The village was incorporated in 1887, and the first post office was established in 1891.
The village grew slowly over the years, and by the early 1900s, it had become a popular tourist destination. The village was home to several resorts, including the Alden Hotel, which was built in 1906. The hotel was a popular destination for wealthy tourists, and it was known for its luxurious accommodations and fine dining.
The village was also home to several factories, including a sawmill, a grist mill, and a furniture factory. These factories provided employment for many of the villagers, and helped to make Alden a prosperous community.
Geography
Alden is located in the northern part of Michigan, in Antrim County. It is situated on the banks of the Intermediate River, and is surrounded by rolling hills and forests. The village is located approximately 25 miles north of Traverse City, and is about a two-hour drive from Detroit.
The village is home to several parks, including Alden Park, which is located on the banks of the Intermediate River. The park features a playground, picnic areas, and a walking trail. The village also has several lakes, including Torch Lake, which is a popular destination for fishing and boating.
Economy
Alden’s economy is largely based on tourism. The village is home to several resorts, including the Alden Hotel, which is a popular destination for wealthy tourists. The village also has several restaurants, cafes, and shops, which cater to both tourists and locals.
The village is also home to several factories, including a sawmill, a grist mill, and a furniture factory. These factories provide employment for many of the villagers, and help to make Alden a prosperous community.
Demographics
As of the 2010 census, the population of Alden was 1,000 people. The median age of the population was 44.7 years, and the median household income was $41,250. The village is predominantly white, with 95.2% of the population identifying as white. The remaining 4.8% of the population identified as Hispanic or Latino.
Conclusion
Alden, Michigan is a small village located in Antrim County, in the northern part of the state. It is situated on the banks of the Intermediate River, and is surrounded by rolling hills and forests. The village has a population of approximately 1,000 people, and is a popular tourist destination due to its proximity to Torch Lake and the nearby ski resorts. The village’s economy is largely based on tourism, and it is home to several resorts, restaurants, cafes, and shops. The village is predominantly white, with 95.2% of the population identifying as white. The remaining 4.8% of the population identified as Hispanic or Latino.
Common Questions
What is Per Capita Income in Alden?
Per Capita income in Alden is $39,965.
What is the Median Household income in Alden?
Median Household Income in Alden is $54,063.
What is Inequality or Gini Index in Alden?
Inequality or Gini Index in Alden is 0.43.
What is the Total Population of Alden?
Total Population of Alden is 112.
What is the Total Male Population of Alden?
Total Male Population of Alden is 36.
What is the Total Female Population of Alden?
Total Female Population of Alden is 76.
What is the Ratio of Males per 100 Females in Alden?
There are 47.37 Males per 100 Females in Alden.
What is the Ratio of Females per 100 Males in Alden?
There are 211.11 Females per 100 Males in Alden.
What is the Median Population Age in Alden?
Median Population Age in Alden is 49.8 Years.
What is the Average Family Size in Alden
Average Family Size in Alden is 3.0 People.
What is the Average Household Size in Alden
Average Household Size in Alden is 2.0 People.
How Large is the Labor Force in Alden?
There are 50 People in the Labor Forcein in Alden.
What is the Percentage of People in the Labor Force in Alden?
51.5% of People are in the Labor Force in Alden.