Oldtown, ID Map & Demographics
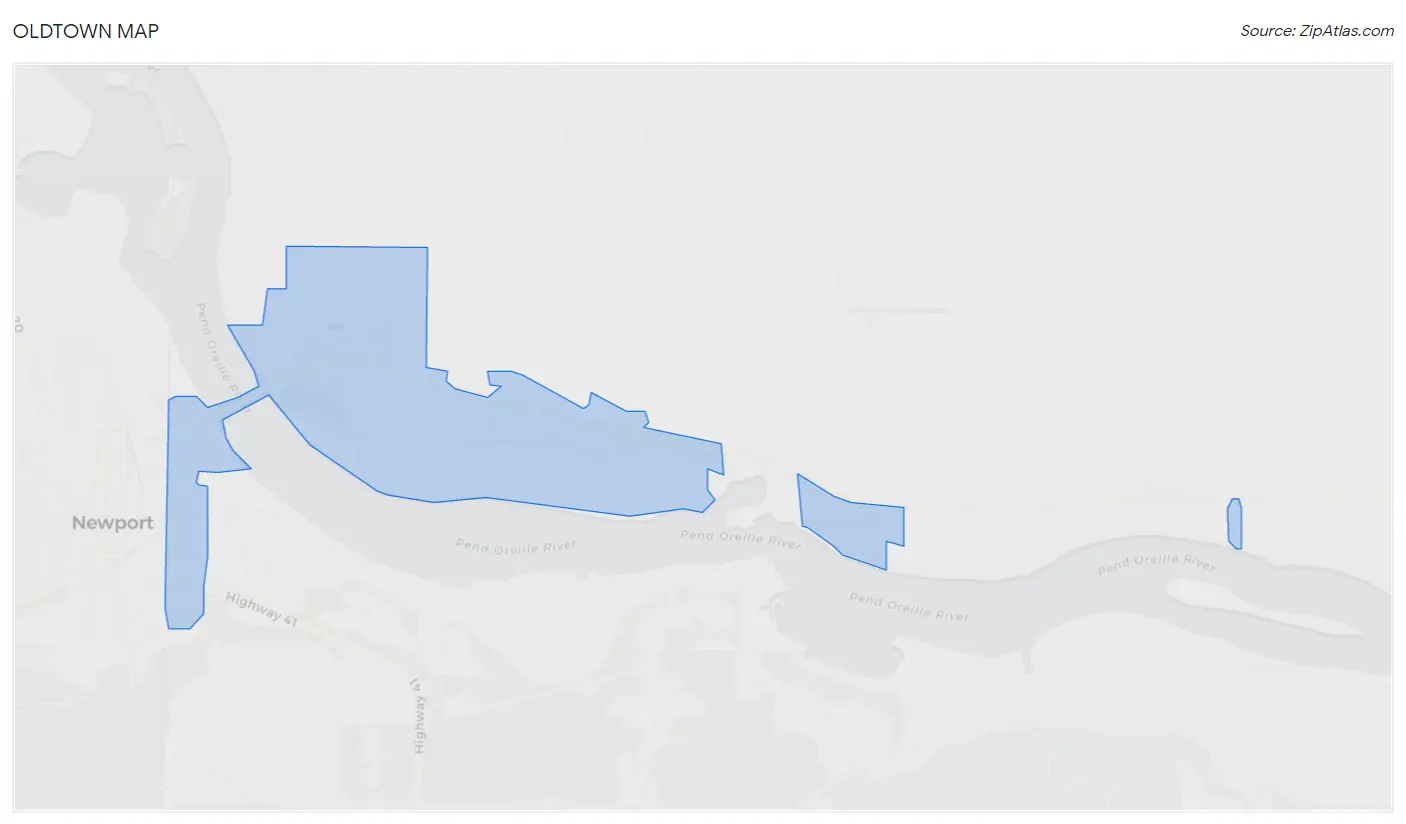
Oldtown Map
Oldtown Overview
$24,314
PER CAPITA INCOME
$67,679
AVG FAMILY INCOME
$54,620
AVG HOUSEHOLD INCOME
32.9%
WAGE / INCOME GAP [ % ]
67.1¢/ $1
WAGE / INCOME GAP [ $ ]
0.38
INEQUALITY / GINI INDEX
480
TOTAL POPULATION
242
MALE POPULATION
238
FEMALE POPULATION
101.68
MALES / 100 FEMALES
98.35
FEMALES / 100 MALES
31.9
MEDIAN AGE
3.8
AVG FAMILY SIZE
2.6
AVG HOUSEHOLD SIZE
227
LABOR FORCE [ PEOPLE ]
62.9%
PERCENT IN LABOR FORCE
15.0%
UNEMPLOYMENT RATE
Oldtown Zip Codes
Oldtown Area Codes
Income in Oldtown
Income Overview in Oldtown
Per Capita Income in Oldtown is $24,314, while median incomes of families and households are $67,679 and $54,620 respectively.
| Characteristic | Number | Measure |
| Per Capita Income | 480 | $24,314 |
| Median Family Income | 81 | $67,679 |
| Mean Family Income | 81 | $68,307 |
| Median Household Income | 183 | $54,620 |
| Mean Household Income | 183 | $59,645 |
| Income Deficit | 81 | $0 |
| Wage / Income Gap (%) | 480 | 32.88% |
| Wage / Income Gap ($) | 480 | 67.12¢ per $1 |
| Gini / Inequality Index | 480 | 0.38 |
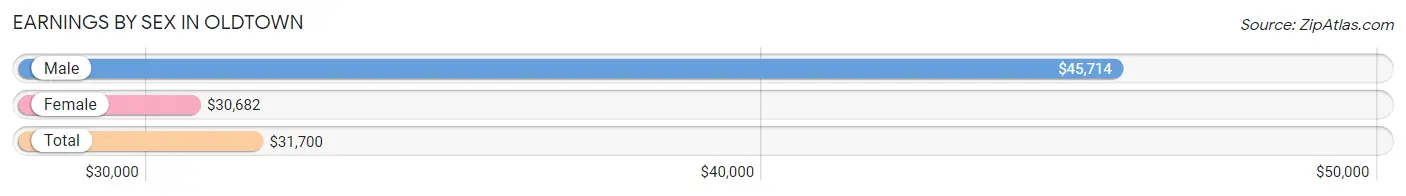
Earnings by Sex in Oldtown
Average Earnings in Oldtown are $31,700, $45,714 for men and $30,682 for women, a difference of 32.9%.
| Sex | Number | Average Earnings |
| Male | 112 (50.0%) | $45,714 |
| Female | 112 (50.0%) | $30,682 |
| Total | 224 (100.0%) | $31,700 |
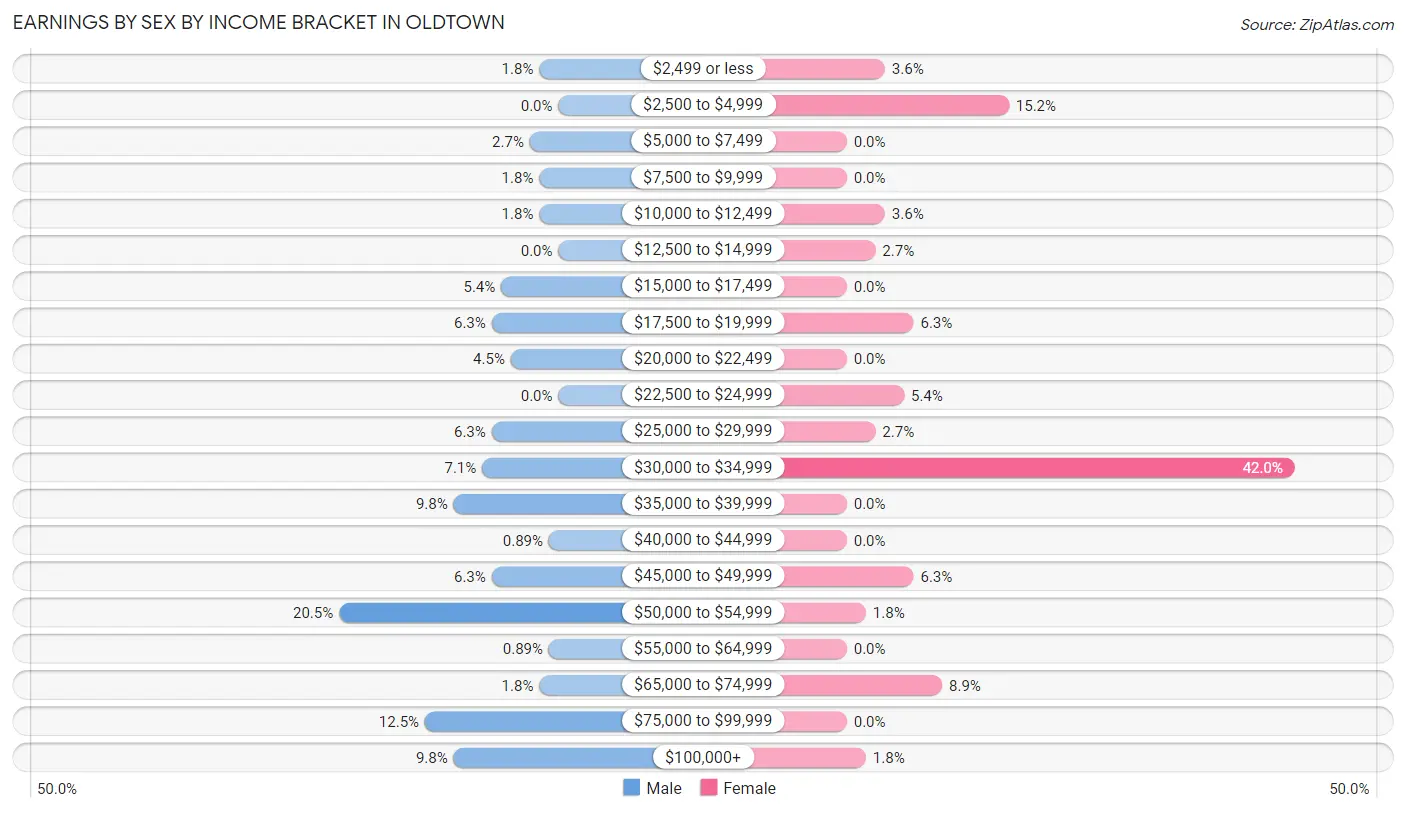
Earnings by Sex by Income Bracket in Oldtown
The most common earnings brackets in Oldtown are $50,000 to $54,999 for men (23 | 20.5%) and $30,000 to $34,999 for women (47 | 42.0%).
| Income | Male | Female |
| $2,499 or less | 2 (1.8%) | 4 (3.6%) |
| $2,500 to $4,999 | 0 (0.0%) | 17 (15.2%) |
| $5,000 to $7,499 | 3 (2.7%) | 0 (0.0%) |
| $7,500 to $9,999 | 2 (1.8%) | 0 (0.0%) |
| $10,000 to $12,499 | 2 (1.8%) | 4 (3.6%) |
| $12,500 to $14,999 | 0 (0.0%) | 3 (2.7%) |
| $15,000 to $17,499 | 6 (5.4%) | 0 (0.0%) |
| $17,500 to $19,999 | 7 (6.2%) | 7 (6.2%) |
| $20,000 to $22,499 | 5 (4.5%) | 0 (0.0%) |
| $22,500 to $24,999 | 0 (0.0%) | 6 (5.4%) |
| $25,000 to $29,999 | 7 (6.2%) | 3 (2.7%) |
| $30,000 to $34,999 | 8 (7.1%) | 47 (42.0%) |
| $35,000 to $39,999 | 11 (9.8%) | 0 (0.0%) |
| $40,000 to $44,999 | 1 (0.9%) | 0 (0.0%) |
| $45,000 to $49,999 | 7 (6.2%) | 7 (6.2%) |
| $50,000 to $54,999 | 23 (20.5%) | 2 (1.8%) |
| $55,000 to $64,999 | 1 (0.9%) | 0 (0.0%) |
| $65,000 to $74,999 | 2 (1.8%) | 10 (8.9%) |
| $75,000 to $99,999 | 14 (12.5%) | 0 (0.0%) |
| $100,000+ | 11 (9.8%) | 2 (1.8%) |
| Total | 112 (100.0%) | 112 (100.0%) |
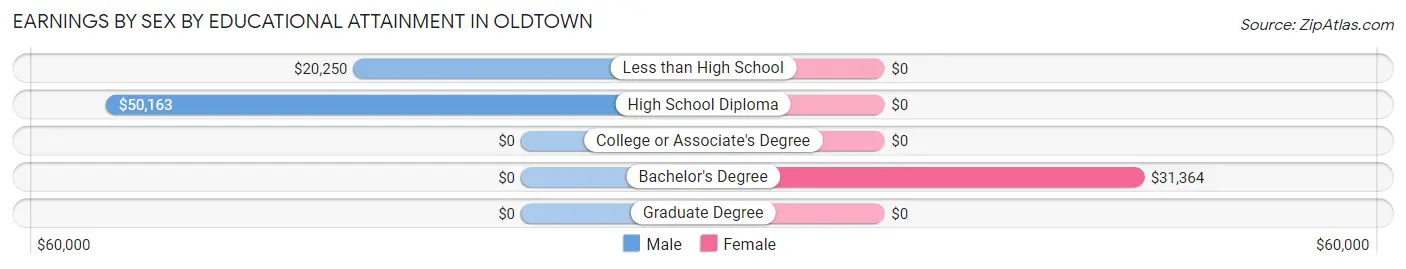
Earnings by Sex by Educational Attainment in Oldtown
Average earnings in Oldtown are $50,054 for men and $30,710 for women, a difference of 38.7%. Men with an educational attainment of high school diploma enjoy the highest average annual earnings of $50,163, while those with less than high school education earn the least with $20,250. Women with an educational attainment of bachelor's degree earn the most with the average annual earnings of $31,364, while those with bachelor's degree education have the smallest earnings of $31,364.
| Educational Attainment | Male Income | Female Income |
| Less than High School | $20,250 | $0 |
| High School Diploma | $50,163 | $0 |
| College or Associate's Degree | - | - |
| Bachelor's Degree | - | - |
| Graduate Degree | - | - |
| Total | $50,054 | $30,710 |
Family Income in Oldtown
Family Income Brackets in Oldtown
According to the Oldtown family income data, there are 18 families falling into the $75,000 to $99,999 income range, which is the most common income bracket and makes up 22.2% of all families. Conversely, the $200,000+ income bracket is the least frequent group with only 1 families (1.2%) belonging to this category.
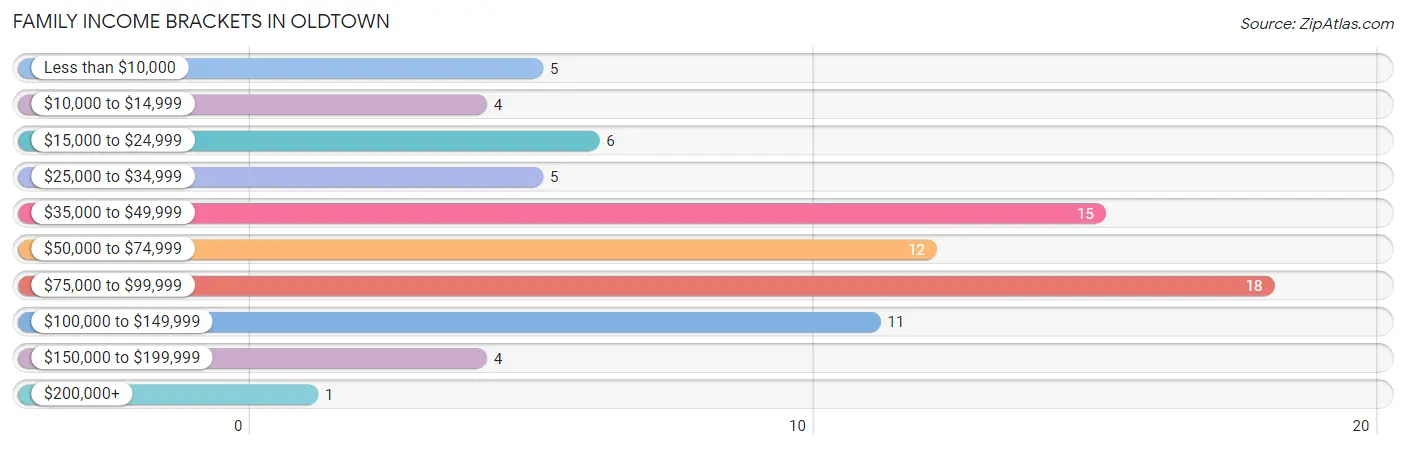
| Income Bracket | # Families | % Families |
| Less than $10,000 | 5 | 6.2% |
| $10,000 to $14,999 | 4 | 4.9% |
| $15,000 to $24,999 | 6 | 7.4% |
| $25,000 to $34,999 | 5 | 6.2% |
| $35,000 to $49,999 | 15 | 18.5% |
| $50,000 to $74,999 | 12 | 14.8% |
| $75,000 to $99,999 | 18 | 22.2% |
| $100,000 to $149,999 | 11 | 13.6% |
| $150,000 to $199,999 | 4 | 4.9% |
| $200,000+ | 1 | 1.2% |
Family Income by Famaliy Size in Oldtown
3-person families (26 | 32.1%) account for the highest median family income in Oldtown with $36,250 per family, while 3-person families (26 | 32.1%) have the highest median income of $12,083 per family member.
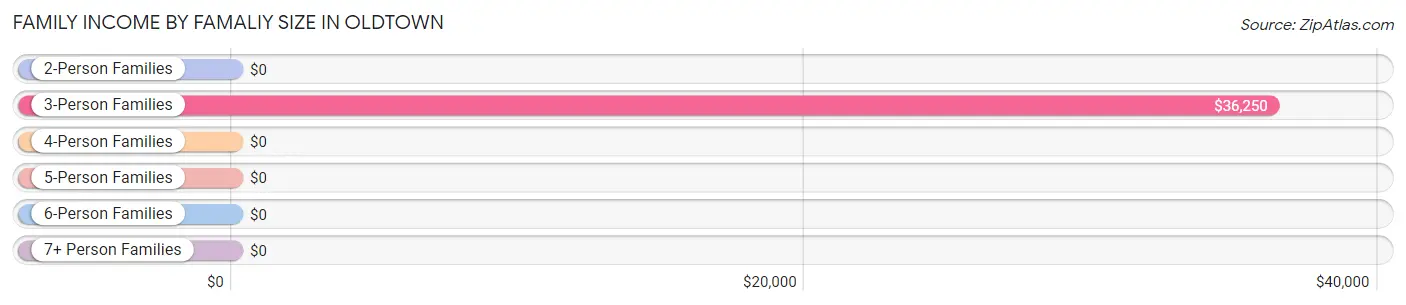
| Income Bracket | # Families | Median Income |
| 2-Person Families | 26 (32.1%) | $0 |
| 3-Person Families | 26 (32.1%) | $36,250 |
| 4-Person Families | 7 (8.6%) | $0 |
| 5-Person Families | 5 (6.2%) | $0 |
| 6-Person Families | 6 (7.4%) | $0 |
| 7+ Person Families | 11 (13.6%) | $0 |
| Total | 81 (100.0%) | $67,679 |
Family Income by Number of Earners in Oldtown
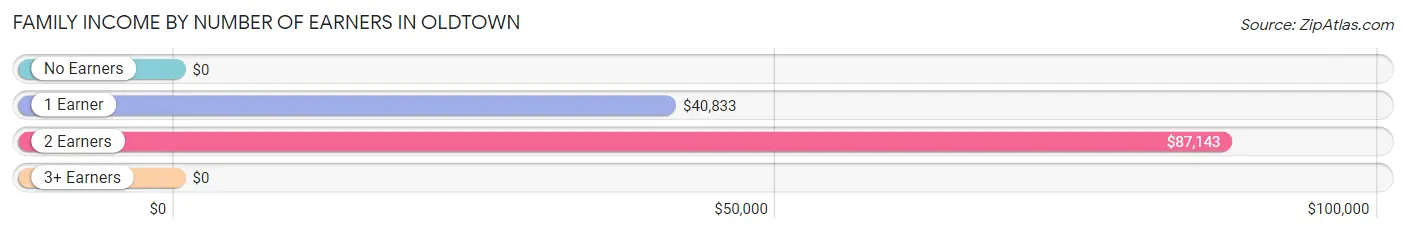
| Number of Earners | # Families | Median Income |
| No Earners | 11 (13.6%) | $0 |
| 1 Earner | 26 (32.1%) | $40,833 |
| 2 Earners | 42 (51.8%) | $87,143 |
| 3+ Earners | 2 (2.5%) | $0 |
| Total | 81 (100.0%) | $67,679 |
Household Income in Oldtown
Household Income Brackets in Oldtown
With 69 households falling in the category, the $50,000 to $74,999 income range is the most frequent in Oldtown, accounting for 37.7% of all households. In contrast, only 2 households (1.1%) fall into the $200,000+ income bracket, making it the least populous group.
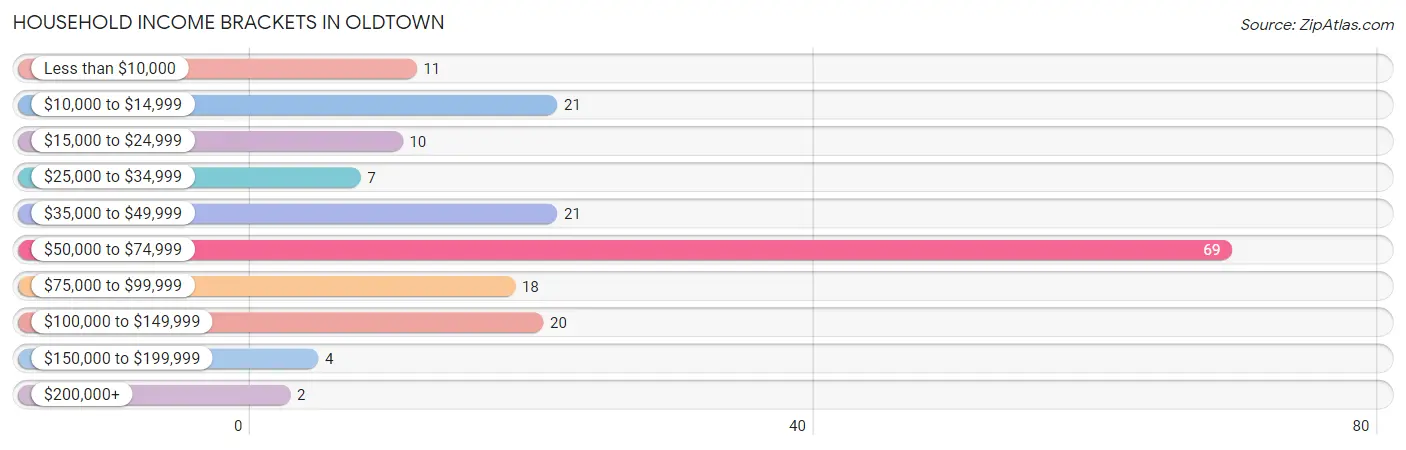
| Income Bracket | # Households | % Households |
| Less than $10,000 | 11 | 6.0% |
| $10,000 to $14,999 | 21 | 11.5% |
| $15,000 to $24,999 | 10 | 5.5% |
| $25,000 to $34,999 | 7 | 3.8% |
| $35,000 to $49,999 | 21 | 11.5% |
| $50,000 to $74,999 | 69 | 37.7% |
| $75,000 to $99,999 | 18 | 9.8% |
| $100,000 to $149,999 | 20 | 10.9% |
| $150,000 to $199,999 | 4 | 2.2% |
| $200,000+ | 2 | 1.1% |
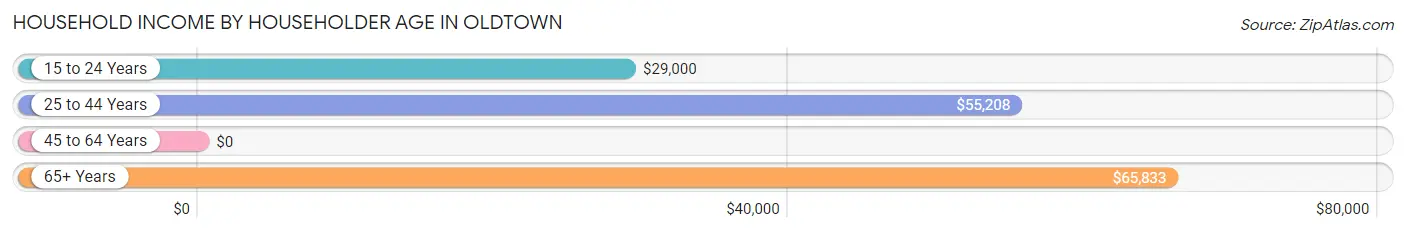
Household Income by Householder Age in Oldtown
The median household income in Oldtown is $54,620, with the highest median household income of $65,833 found in the 65+ years age bracket for the primary householder. A total of 50 households (27.3%) fall into this category. Meanwhile, the 45 to 64 years age bracket for the primary householder has the lowest median household income of $0, with 40 households (21.9%) in this group.
| Income Bracket | # Households | Median Income |
| 15 to 24 Years | 8 (4.4%) | $29,000 |
| 25 to 44 Years | 85 (46.5%) | $55,208 |
| 45 to 64 Years | 40 (21.9%) | $0 |
| 65+ Years | 50 (27.3%) | $65,833 |
| Total | 183 (100.0%) | $54,620 |
Poverty in Oldtown
Income Below Poverty by Sex and Age in Oldtown
With 17.8% poverty level for males and 25.6% for females among the residents of Oldtown, 15 year old males and 65 to 74 year old females are the most vulnerable to poverty, with 4 males (100.0%) and 5 females (71.4%) in their respective age groups living below the poverty level.
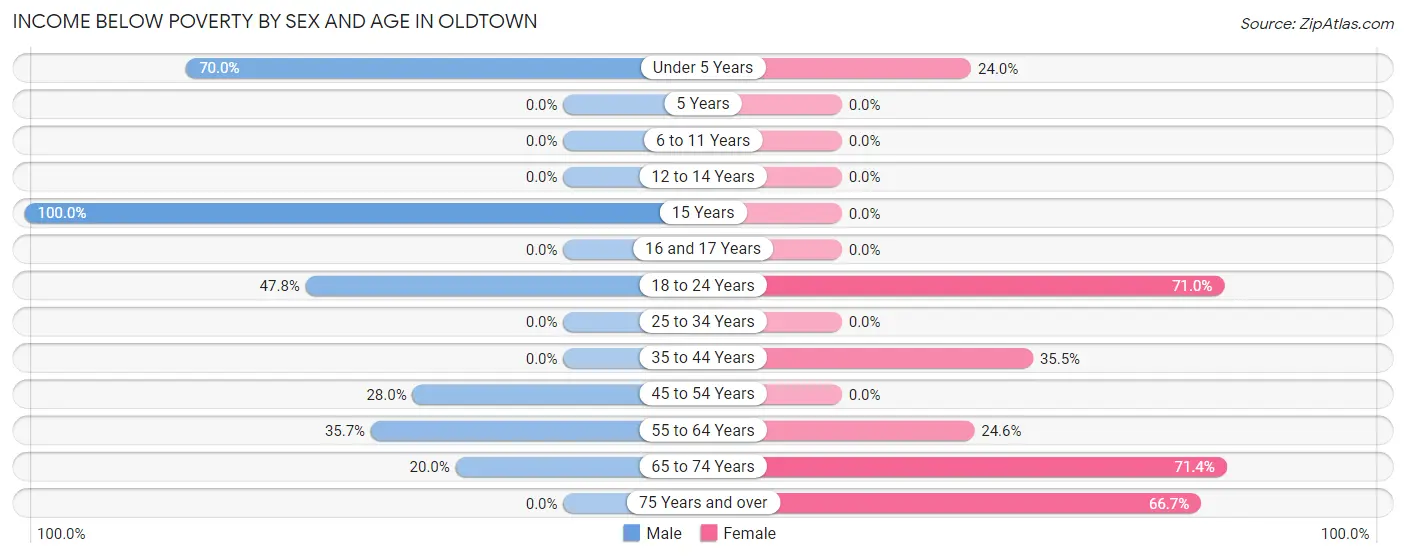
| Age Bracket | Male | Female |
| Under 5 Years | 7 (70.0%) | 6 (24.0%) |
| 5 Years | 0 (0.0%) | 0 (0.0%) |
| 6 to 11 Years | 0 (0.0%) | 0 (0.0%) |
| 12 to 14 Years | 0 (0.0%) | 0 (0.0%) |
| 15 Years | 4 (100.0%) | 0 (0.0%) |
| 16 and 17 Years | 0 (0.0%) | 0 (0.0%) |
| 18 to 24 Years | 11 (47.8%) | 22 (71.0%) |
| 25 to 34 Years | 0 (0.0%) | 0 (0.0%) |
| 35 to 44 Years | 0 (0.0%) | 11 (35.5%) |
| 45 to 54 Years | 7 (28.0%) | 0 (0.0%) |
| 55 to 64 Years | 5 (35.7%) | 15 (24.6%) |
| 65 to 74 Years | 9 (20.0%) | 5 (71.4%) |
| 75 Years and over | 0 (0.0%) | 2 (66.7%) |
| Total | 43 (17.8%) | 61 (25.6%) |
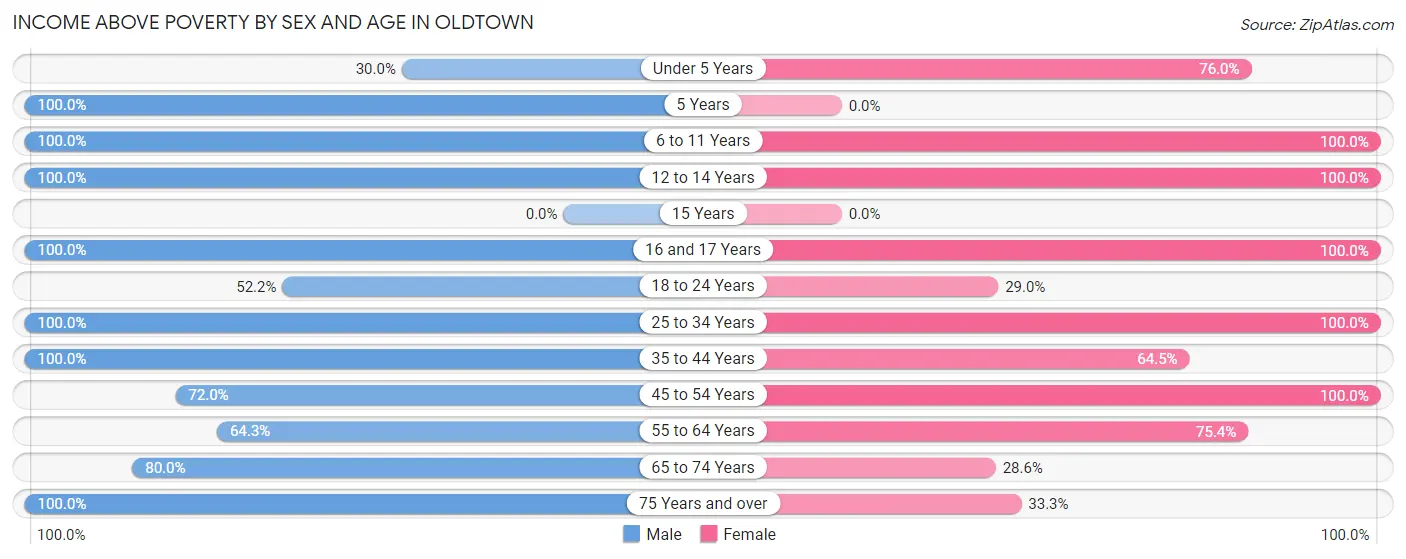
Income Above Poverty by Sex and Age in Oldtown
According to the poverty statistics in Oldtown, males aged 5 years and females aged 6 to 11 years are the age groups that are most secure financially, with 100.0% of males and 100.0% of females in these age groups living above the poverty line.
| Age Bracket | Male | Female |
| Under 5 Years | 3 (30.0%) | 19 (76.0%) |
| 5 Years | 3 (100.0%) | 0 (0.0%) |
| 6 to 11 Years | 34 (100.0%) | 26 (100.0%) |
| 12 to 14 Years | 2 (100.0%) | 15 (100.0%) |
| 15 Years | 0 (0.0%) | 0 (0.0%) |
| 16 and 17 Years | 6 (100.0%) | 2 (100.0%) |
| 18 to 24 Years | 12 (52.2%) | 9 (29.0%) |
| 25 to 34 Years | 69 (100.0%) | 21 (100.0%) |
| 35 to 44 Years | 6 (100.0%) | 20 (64.5%) |
| 45 to 54 Years | 18 (72.0%) | 16 (100.0%) |
| 55 to 64 Years | 9 (64.3%) | 46 (75.4%) |
| 65 to 74 Years | 36 (80.0%) | 2 (28.6%) |
| 75 Years and over | 1 (100.0%) | 1 (33.3%) |
| Total | 199 (82.2%) | 177 (74.4%) |
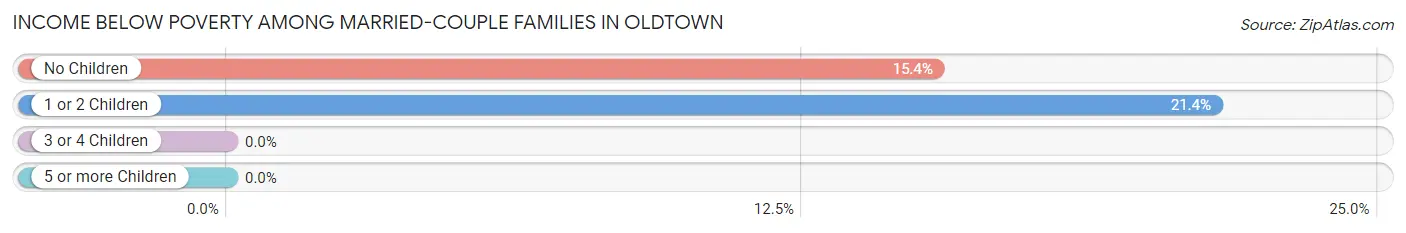
Income Below Poverty Among Married-Couple Families in Oldtown
The poverty statistics for married-couple families in Oldtown show that 14.7% or 10 of the total 68 families live below the poverty line. Families with 1 or 2 children have the highest poverty rate of 21.4%, comprising of 6 families. On the other hand, families with 3 or 4 children have the lowest poverty rate of 0.0%, which includes 0 families.
| Children | Above Poverty | Below Poverty |
| No Children | 22 (84.6%) | 4 (15.4%) |
| 1 or 2 Children | 22 (78.6%) | 6 (21.4%) |
| 3 or 4 Children | 3 (100.0%) | 0 (0.0%) |
| 5 or more Children | 11 (100.0%) | 0 (0.0%) |
| Total | 58 (85.3%) | 10 (14.7%) |
Income Below Poverty Among Single-Parent Households in Oldtown
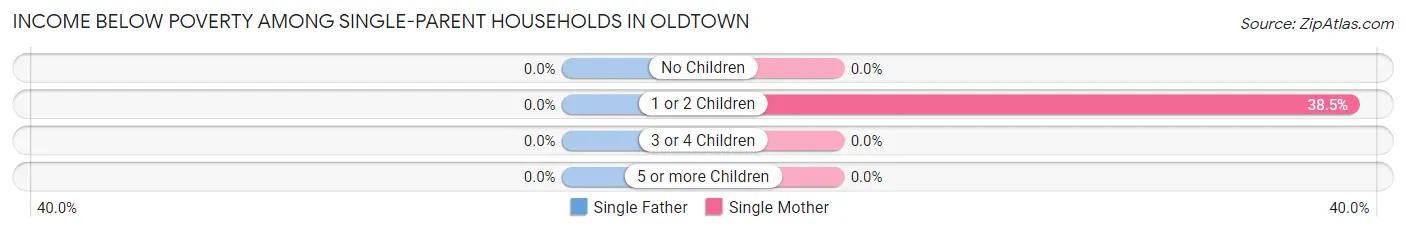
| Children | Single Father | Single Mother |
| No Children | 0 (0.0%) | 0 (0.0%) |
| 1 or 2 Children | 0 (0.0%) | 5 (38.5%) |
| 3 or 4 Children | 0 (0.0%) | 0 (0.0%) |
| 5 or more Children | 0 (0.0%) | 0 (0.0%) |
| Total | 0 (0.0%) | 5 (38.5%) |
Income Below Poverty Among Married-Couple vs Single-Parent Households in Oldtown
The poverty data for Oldtown shows that 10 of the married-couple family households (14.7%) and 5 of the single-parent households (38.5%) are living below the poverty level. Within the married-couple family households, those with 1 or 2 children have the highest poverty rate, with 6 households (21.4%) falling below the poverty line. Among the single-parent households, those with 1 or 2 children have the highest poverty rate, with 5 household (38.5%) living below poverty.
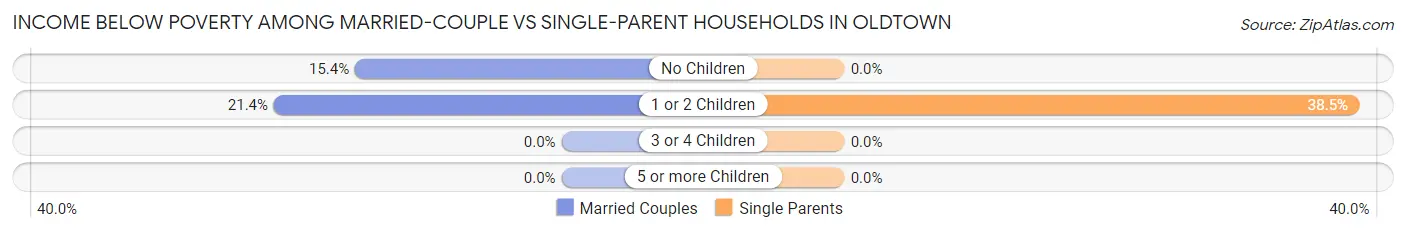
| Children | Married-Couple Families | Single-Parent Households |
| No Children | 4 (15.4%) | 0 (0.0%) |
| 1 or 2 Children | 6 (21.4%) | 5 (38.5%) |
| 3 or 4 Children | 0 (0.0%) | 0 (0.0%) |
| 5 or more Children | 0 (0.0%) | 0 (0.0%) |
| Total | 10 (14.7%) | 5 (38.5%) |
Race in Oldtown
The most populous races in Oldtown are White / Caucasian (441 | 91.9%), Hispanic or Latino (21 | 4.4%), and Two or more Races (17 | 3.5%).
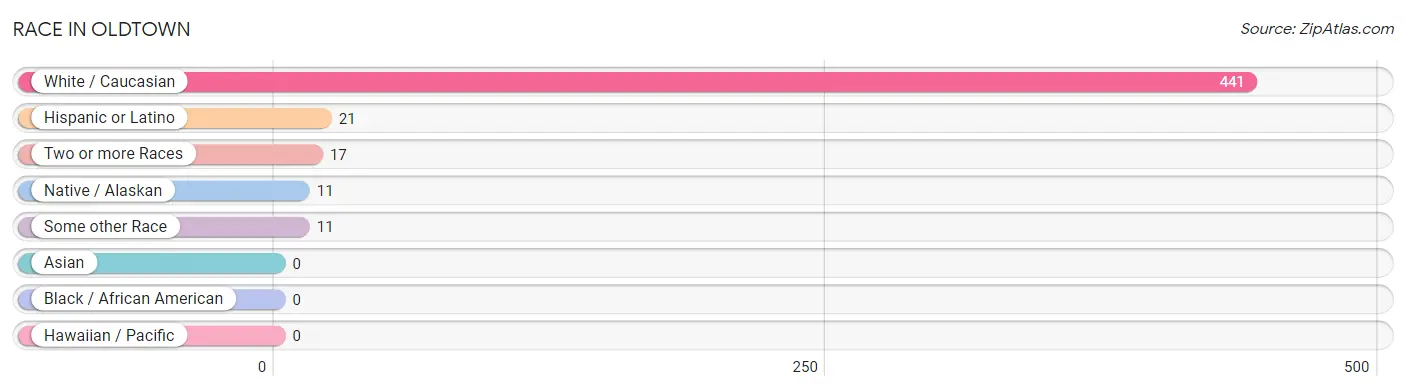
| Race | # Population | % Population |
| Asian | 0 | 0.0% |
| Black / African American | 0 | 0.0% |
| Hawaiian / Pacific | 0 | 0.0% |
| Hispanic or Latino | 21 | 4.4% |
| Native / Alaskan | 11 | 2.3% |
| White / Caucasian | 441 | 91.9% |
| Two or more Races | 17 | 3.5% |
| Some other Race | 11 | 2.3% |
| Total | 480 | 100.0% |
Ancestry in Oldtown
The most populous ancestries reported in Oldtown are English (76 | 15.8%), Swedish (55 | 11.5%), German (48 | 10.0%), Scottish (38 | 7.9%), and Irish (37 | 7.7%), together accounting for 52.9% of all Oldtown residents.
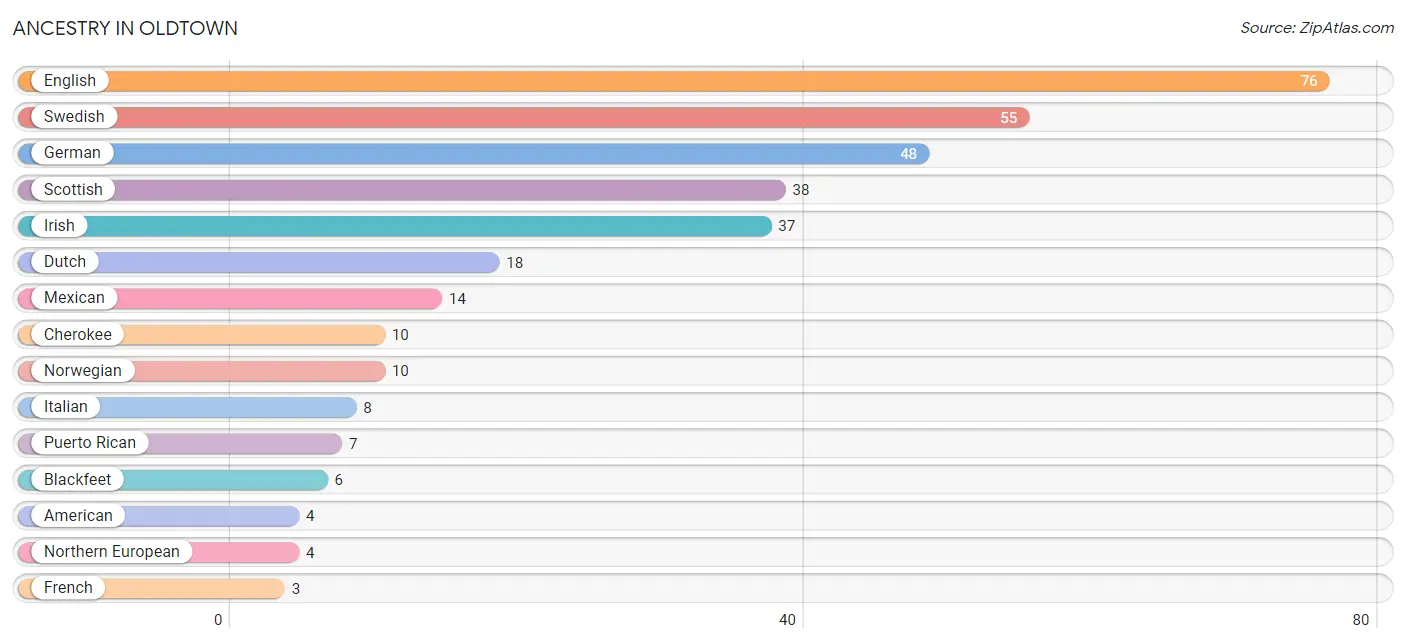
| Ancestry | # Population | % Population |
| American | 4 | 0.8% |
| Belgian | 2 | 0.4% |
| Blackfeet | 6 | 1.3% |
| Cherokee | 10 | 2.1% |
| Dutch | 18 | 3.7% |
| English | 76 | 15.8% |
| French | 3 | 0.6% |
| German | 48 | 10.0% |
| Irish | 37 | 7.7% |
| Italian | 8 | 1.7% |
| Mexican | 14 | 2.9% |
| Northern European | 4 | 0.8% |
| Norwegian | 10 | 2.1% |
| Polish | 1 | 0.2% |
| Puerto Rican | 7 | 1.5% |
| Scotch-Irish | 1 | 0.2% |
| Scottish | 38 | 7.9% |
| Swedish | 55 | 11.5% | View All 18 Rows |
Immigrants in Oldtown
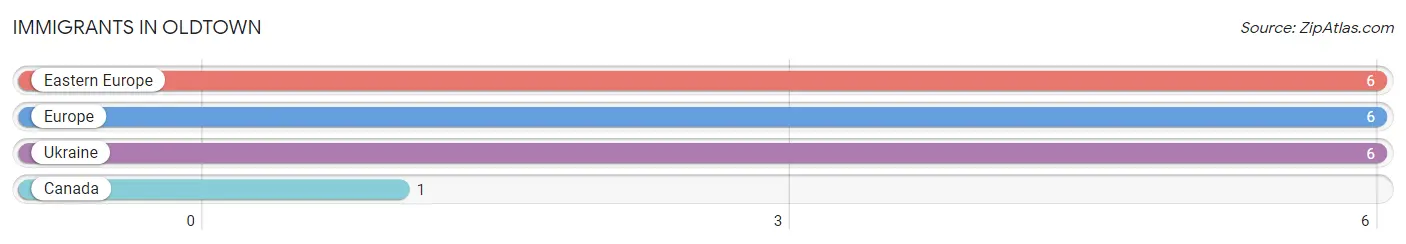
The most numerous immigrant groups reported in Oldtown came from Eastern Europe (6 | 1.3%), Europe (6 | 1.3%), Ukraine (6 | 1.3%), and Canada (1 | 0.2%), together accounting for 4.0% of all Oldtown residents.
| Immigration Origin | # Population | % Population |
| Canada | 1 | 0.2% |
| Eastern Europe | 6 | 1.3% |
| Europe | 6 | 1.3% |
| Ukraine | 6 | 1.3% | View All 4 Rows |
Sex and Age in Oldtown
Sex and Age in Oldtown
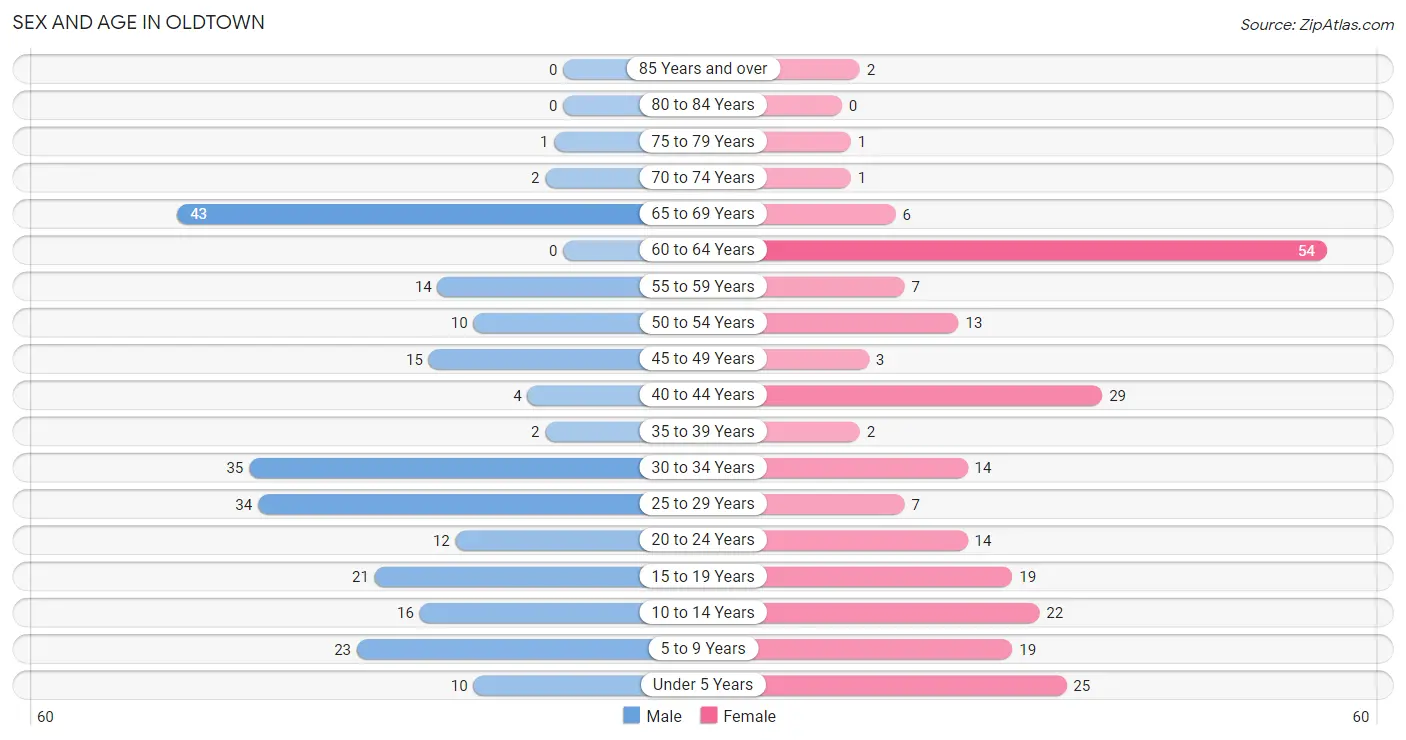
The most populous age groups in Oldtown are 65 to 69 Years (43 | 17.8%) for men and 60 to 64 Years (54 | 22.7%) for women.
| Age Bracket | Male | Female |
| Under 5 Years | 10 (4.1%) | 25 (10.5%) |
| 5 to 9 Years | 23 (9.5%) | 19 (8.0%) |
| 10 to 14 Years | 16 (6.6%) | 22 (9.2%) |
| 15 to 19 Years | 21 (8.7%) | 19 (8.0%) |
| 20 to 24 Years | 12 (5.0%) | 14 (5.9%) |
| 25 to 29 Years | 34 (14.1%) | 7 (2.9%) |
| 30 to 34 Years | 35 (14.5%) | 14 (5.9%) |
| 35 to 39 Years | 2 (0.8%) | 2 (0.8%) |
| 40 to 44 Years | 4 (1.7%) | 29 (12.2%) |
| 45 to 49 Years | 15 (6.2%) | 3 (1.3%) |
| 50 to 54 Years | 10 (4.1%) | 13 (5.5%) |
| 55 to 59 Years | 14 (5.8%) | 7 (2.9%) |
| 60 to 64 Years | 0 (0.0%) | 54 (22.7%) |
| 65 to 69 Years | 43 (17.8%) | 6 (2.5%) |
| 70 to 74 Years | 2 (0.8%) | 1 (0.4%) |
| 75 to 79 Years | 1 (0.4%) | 1 (0.4%) |
| 80 to 84 Years | 0 (0.0%) | 0 (0.0%) |
| 85 Years and over | 0 (0.0%) | 2 (0.8%) |
| Total | 242 (100.0%) | 238 (100.0%) |
Families and Households in Oldtown
Median Family Size in Oldtown
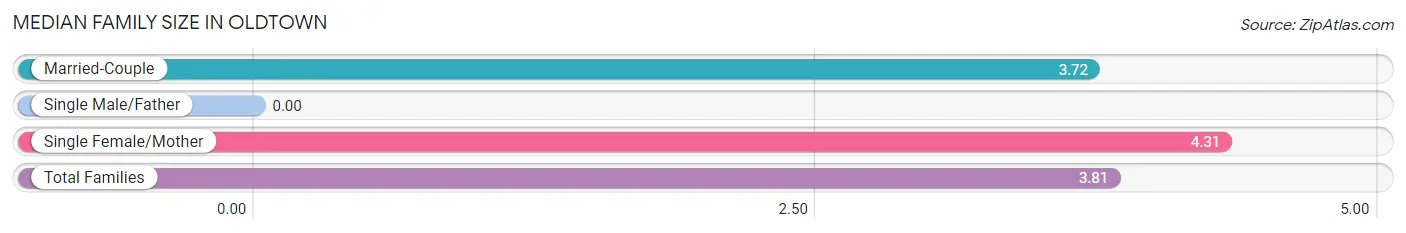
| Family Type | # Families | Family Size |
| Married-Couple | 68 (84.0%) | 3.72 |
| Single Male/Father | 0 (0.0%) | - |
| Single Female/Mother | 13 (16.1%) | 4.31 |
| Total Families | 81 (100.0%) | 3.81 |
Median Household Size in Oldtown
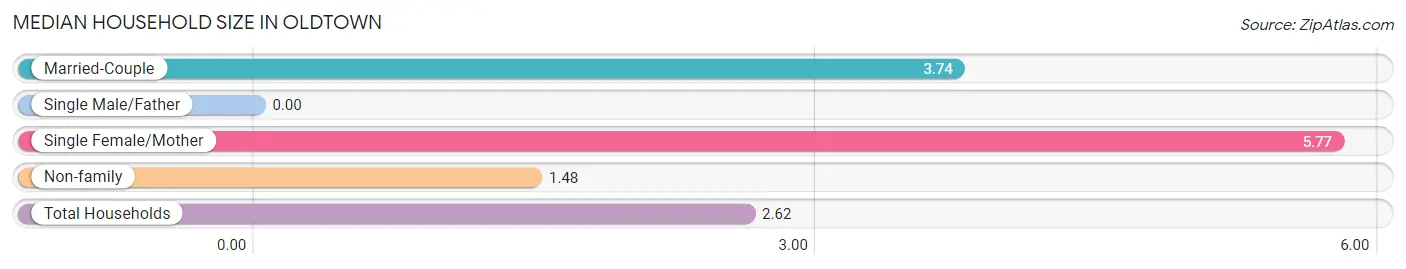
| Household Type | # Households | Household Size |
| Married-Couple | 68 (37.2%) | 3.74 |
| Single Male/Father | 0 (0.0%) | - |
| Single Female/Mother | 13 (7.1%) | 5.77 |
| Non-family | 102 (55.7%) | 1.48 |
| Total Households | 183 (100.0%) | 2.62 |
Household Size by Marriage Status in Oldtown
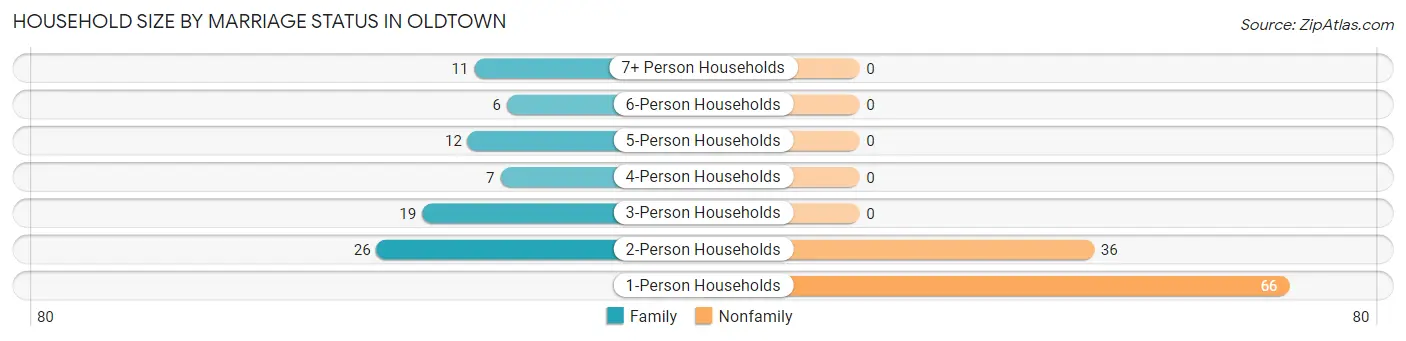
Out of a total of 183 households in Oldtown, 81 (44.3%) are family households, while 102 (55.7%) are nonfamily households. The most numerous type of family households are 2-person households, comprising 26, and the most common type of nonfamily households are 1-person households, comprising 66.
| Household Size | Family Households | Nonfamily Households |
| 1-Person Households | - | 66 (36.1%) |
| 2-Person Households | 26 (14.2%) | 36 (19.7%) |
| 3-Person Households | 19 (10.4%) | 0 (0.0%) |
| 4-Person Households | 7 (3.8%) | 0 (0.0%) |
| 5-Person Households | 12 (6.6%) | 0 (0.0%) |
| 6-Person Households | 6 (3.3%) | 0 (0.0%) |
| 7+ Person Households | 11 (6.0%) | 0 (0.0%) |
| Total | 81 (44.3%) | 102 (55.7%) |
Female Fertility in Oldtown
Fertility by Age in Oldtown
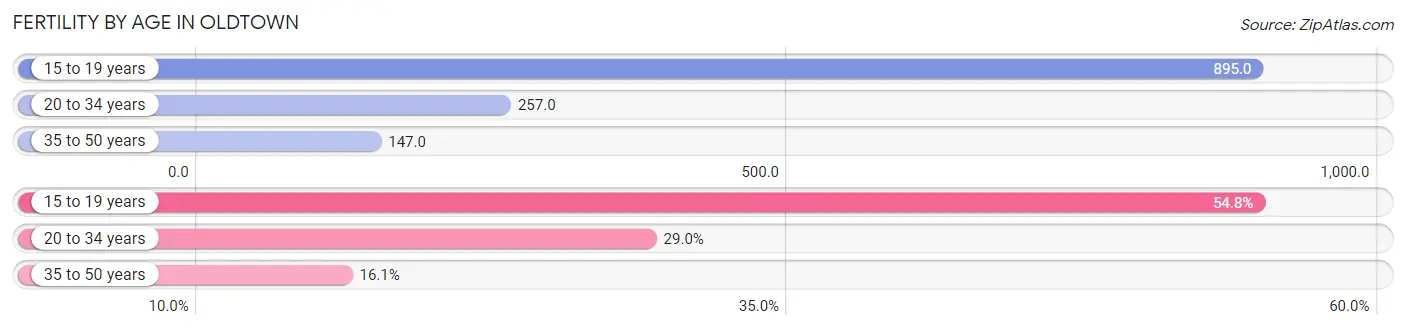
Average fertility rate in Oldtown is 352.0 births per 1,000 women. Women in the age bracket of 15 to 19 years have the highest fertility rate with 895.0 births per 1,000 women. Women in the age bracket of 15 to 19 years acount for 54.8% of all women with births.
| Age Bracket | Women with Births | Births / 1,000 Women |
| 15 to 19 years | 17 (54.8%) | 895.0 |
| 20 to 34 years | 9 (29.0%) | 257.0 |
| 35 to 50 years | 5 (16.1%) | 147.0 |
| Total | 31 (100.0%) | 352.0 |
Fertility by Age by Marriage Status in Oldtown
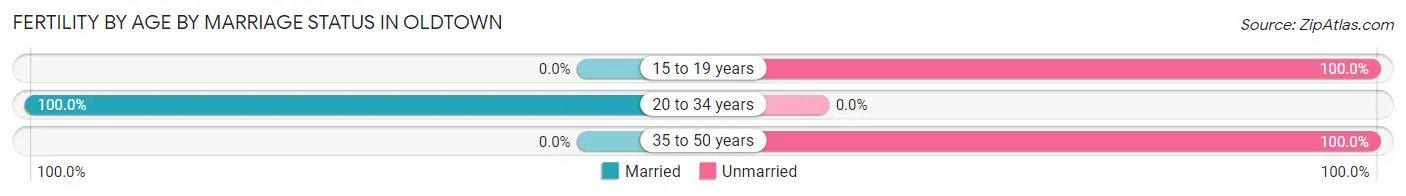
29.0% of women with births (31) in Oldtown are married. The highest percentage of unmarried women with births falls into 15 to 19 years age bracket with 100.0% of them unmarried at the time of birth, while the lowest percentage of unmarried women with births belong to 20 to 34 years age bracket with 0.0% of them unmarried.
| Age Bracket | Married | Unmarried |
| 15 to 19 years | 0 (0.0%) | 17 (100.0%) |
| 20 to 34 years | 9 (100.0%) | 0 (0.0%) |
| 35 to 50 years | 0 (0.0%) | 5 (100.0%) |
| Total | 9 (29.0%) | 22 (71.0%) |
Fertility by Education in Oldtown
| Educational Attainment | Women with Births | Births / 1,000 Women |
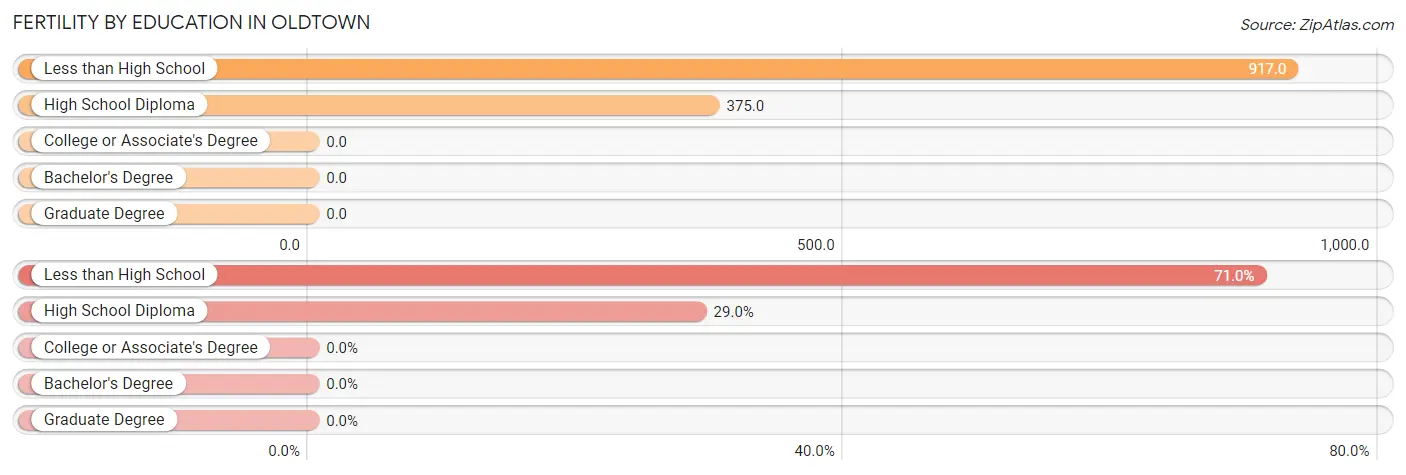
| Less than High School | 22 (71.0%) | 917.0 |
| High School Diploma | 9 (29.0%) | 375.0 |
| College or Associate's Degree | 0 (0.0%) | 0.0 |
| Bachelor's Degree | 0 (0.0%) | 0.0 |
| Graduate Degree | 0 (0.0%) | 0.0 |
| Total | 31 (100.0%) | 352.0 |
Fertility by Education by Marriage Status in Oldtown
71.0% of women with births in Oldtown are unmarried. Women with the educational attainment of high school diploma are most likely to be married with 100.0% of them married at childbirth, while women with the educational attainment of less than high school are least likely to be married with 100.0% of them unmarried at childbirth.
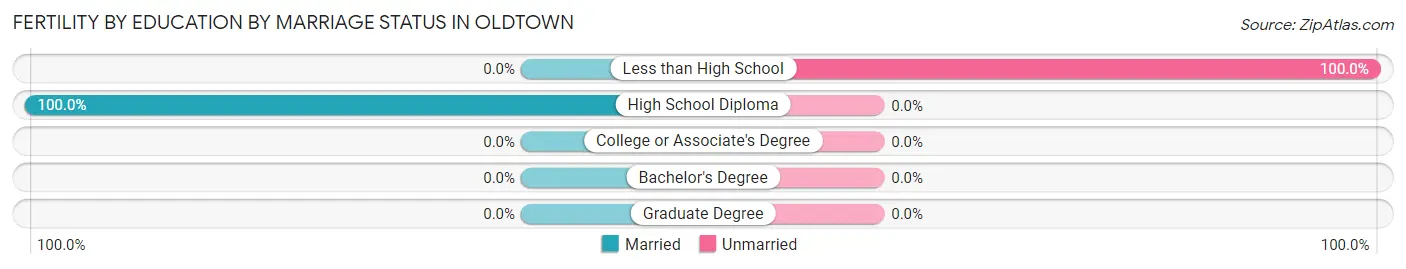
| Educational Attainment | Married | Unmarried |
| Less than High School | 0 (0.0%) | 22 (100.0%) |
| High School Diploma | 9 (100.0%) | 0 (0.0%) |
| College or Associate's Degree | 0 (0.0%) | 0 (0.0%) |
| Bachelor's Degree | 0 (0.0%) | 0 (0.0%) |
| Graduate Degree | 0 (0.0%) | 0 (0.0%) |
| Total | 9 (29.0%) | 22 (71.0%) |
Employment Characteristics in Oldtown
Employment by Class of Employer in Oldtown
Among the 193 employed individuals in Oldtown, private company employees (113 | 58.6%), self-employed (not incorporated) (65 | 33.7%), and local government employees (13 | 6.7%) make up the most common classes of employment.
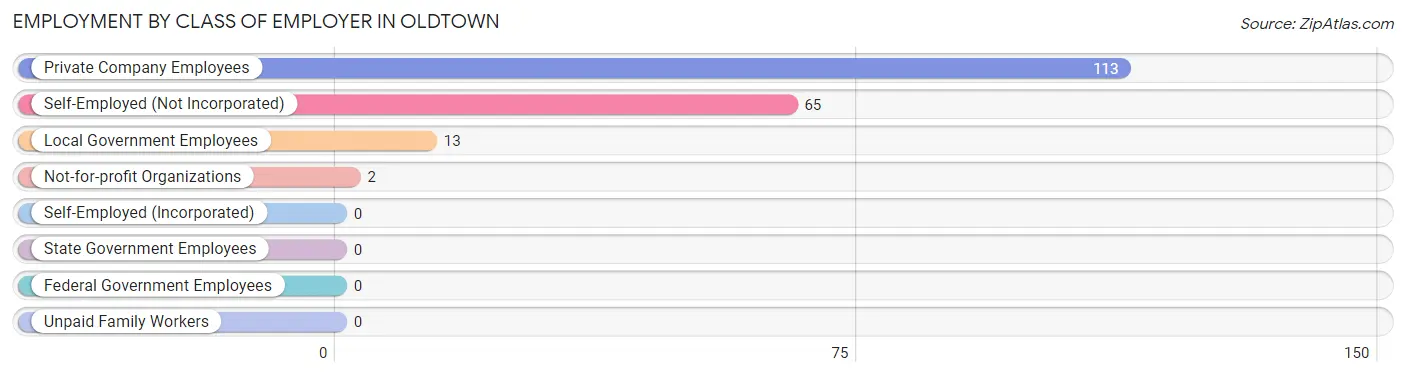
| Employer Class | # Employees | % Employees |
| Private Company Employees | 113 | 58.6% |
| Self-Employed (Incorporated) | 0 | 0.0% |
| Self-Employed (Not Incorporated) | 65 | 33.7% |
| Not-for-profit Organizations | 2 | 1.0% |
| Local Government Employees | 13 | 6.7% |
| State Government Employees | 0 | 0.0% |
| Federal Government Employees | 0 | 0.0% |
| Unpaid Family Workers | 0 | 0.0% |
| Total | 193 | 100.0% |
Employment Status by Age in Oldtown
According to the labor force statistics for Oldtown, out of the total population over 16 years of age (361), 62.9% or 227 individuals are in the labor force, with 15.0% or 34 of them unemployed. The age group with the highest labor force participation rate is 25 to 29 years, with 100.0% or 41 individuals in the labor force. Within the labor force, the 16 to 19 years age range has the highest percentage of unemployed individuals, with 100.0% or 11 of them being unemployed.
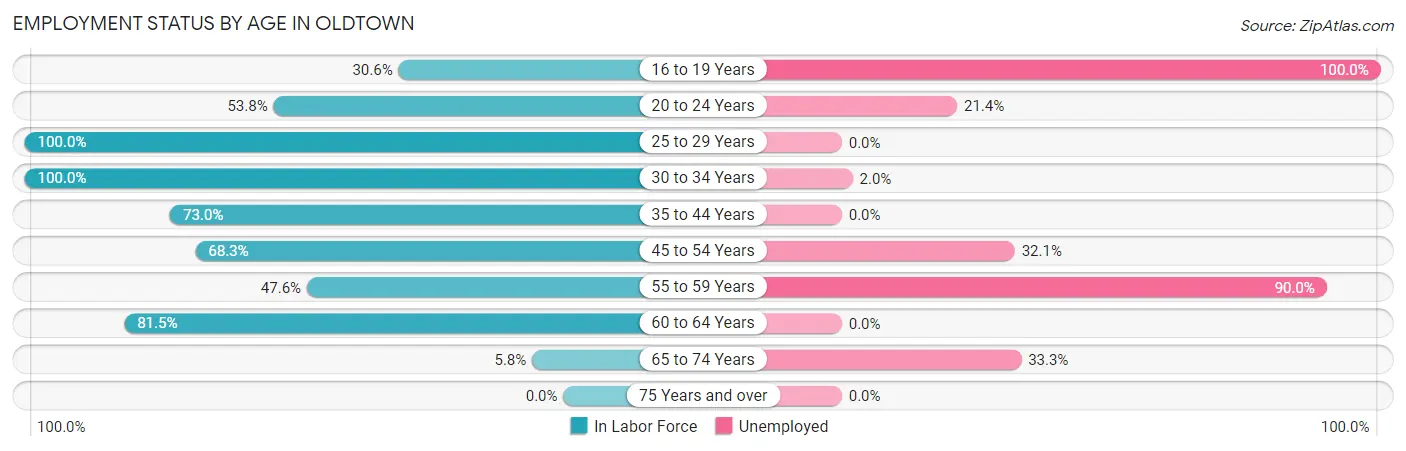
| Age Bracket | In Labor Force | Unemployed |
| 16 to 19 Years | 11 (30.6%) | 11 (100.0%) |
| 20 to 24 Years | 14 (53.8%) | 3 (21.4%) |
| 25 to 29 Years | 41 (100.0%) | 0 (0.0%) |
| 30 to 34 Years | 49 (100.0%) | 1 (2.0%) |
| 35 to 44 Years | 27 (73.0%) | 0 (0.0%) |
| 45 to 54 Years | 28 (68.3%) | 9 (32.1%) |
| 55 to 59 Years | 10 (47.6%) | 9 (90.0%) |
| 60 to 64 Years | 44 (81.5%) | 0 (0.0%) |
| 65 to 74 Years | 3 (5.8%) | 1 (33.3%) |
| 75 Years and over | 0 (0.0%) | 0 (0.0%) |
| Total | 227 (62.9%) | 34 (15.0%) |
Employment Status by Educational Attainment in Oldtown
According to labor force statistics for Oldtown, 81.9% of individuals (199) out of the total population between 25 and 64 years of age (243) are in the labor force, with 9.5% or 19 of them being unemployed. The group with the highest labor force participation rate are those with the educational attainment of bachelor's degree or higher, with 100.0% or 70 individuals in the labor force. Within the labor force, individuals with high school diploma education have the highest percentage of unemployment, with 16.1% or 10 of them being unemployed.
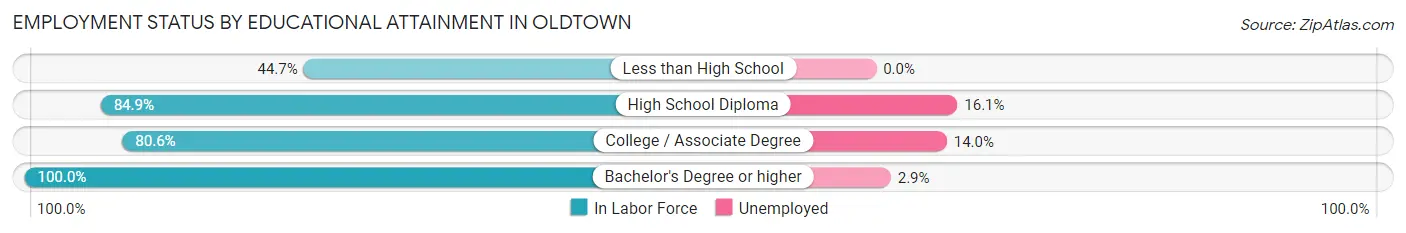
| Educational Attainment | In Labor Force | Unemployed |
| Less than High School | 17 (44.7%) | 0 (0.0%) |
| High School Diploma | 62 (84.9%) | 12 (16.1%) |
| College / Associate Degree | 50 (80.6%) | 9 (14.0%) |
| Bachelor's Degree or higher | 70 (100.0%) | 2 (2.9%) |
| Total | 199 (81.9%) | 23 (9.5%) |
Employment Occupations by Sex in Oldtown
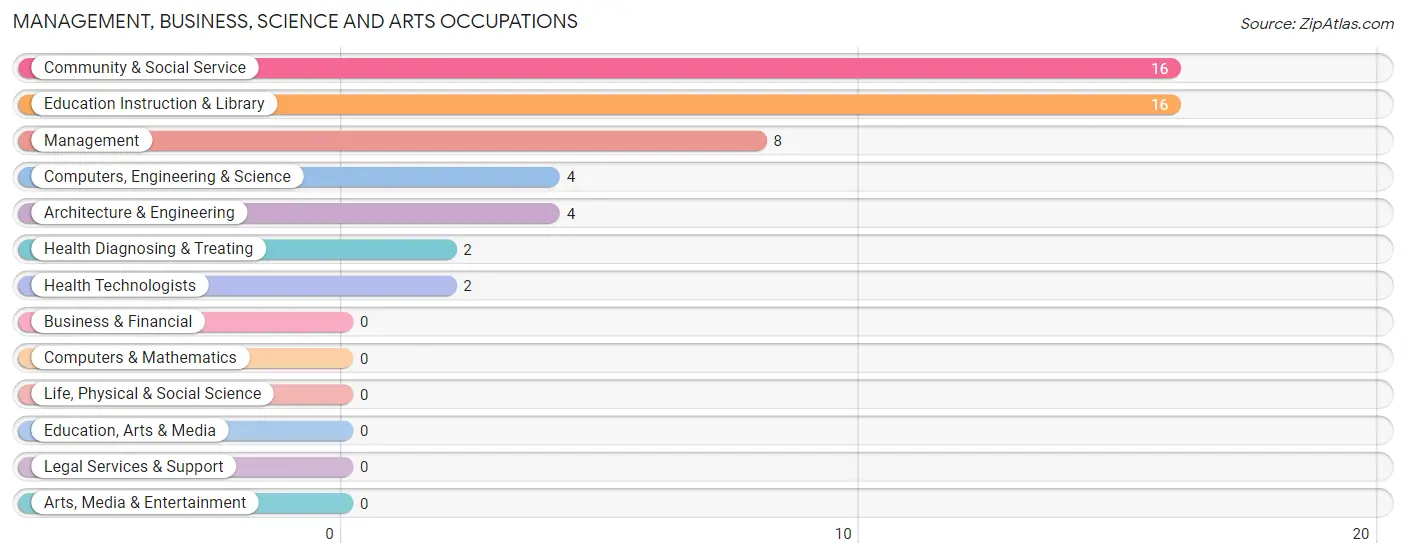
Management, Business, Science and Arts Occupations
The most common Management, Business, Science and Arts occupations in Oldtown are Community & Social Service (16 | 8.3%), Education Instruction & Library (16 | 8.3%), Management (8 | 4.2%), Computers, Engineering & Science (4 | 2.1%), and Architecture & Engineering (4 | 2.1%).
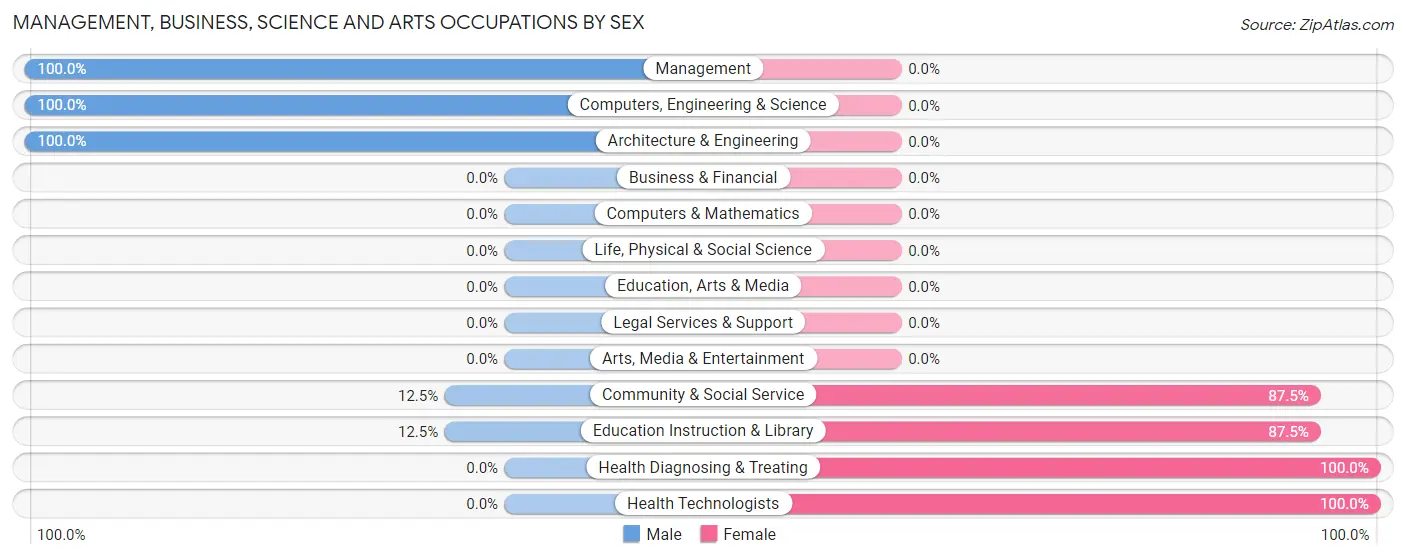
Management, Business, Science and Arts Occupations by Sex
Within the Management, Business, Science and Arts occupations in Oldtown, the most male-oriented occupations are Management (100.0%), Computers, Engineering & Science (100.0%), and Architecture & Engineering (100.0%), while the most female-oriented occupations are Health Diagnosing & Treating (100.0%), Health Technologists (100.0%), and Community & Social Service (87.5%).
| Occupation | Male | Female |
| Management | 8 (100.0%) | 0 (0.0%) |
| Business & Financial | 0 (0.0%) | 0 (0.0%) |
| Computers, Engineering & Science | 4 (100.0%) | 0 (0.0%) |
| Computers & Mathematics | 0 (0.0%) | 0 (0.0%) |
| Architecture & Engineering | 4 (100.0%) | 0 (0.0%) |
| Life, Physical & Social Science | 0 (0.0%) | 0 (0.0%) |
| Community & Social Service | 2 (12.5%) | 14 (87.5%) |
| Education, Arts & Media | 0 (0.0%) | 0 (0.0%) |
| Legal Services & Support | 0 (0.0%) | 0 (0.0%) |
| Education Instruction & Library | 2 (12.5%) | 14 (87.5%) |
| Arts, Media & Entertainment | 0 (0.0%) | 0 (0.0%) |
| Health Diagnosing & Treating | 0 (0.0%) | 2 (100.0%) |
| Health Technologists | 0 (0.0%) | 2 (100.0%) |
| Total (Category) | 14 (46.7%) | 16 (53.3%) |
| Total (Overall) | 100 (51.8%) | 93 (48.2%) |
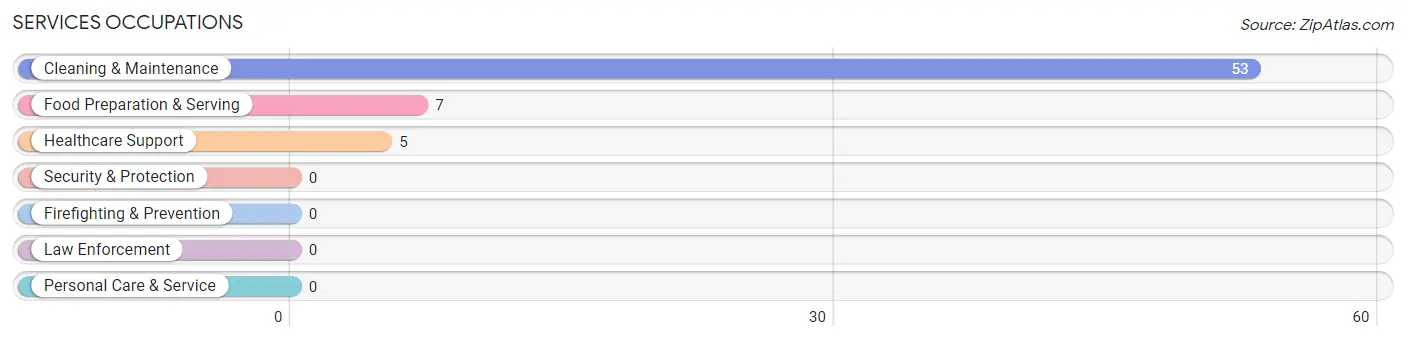
Services Occupations
The most common Services occupations in Oldtown are Cleaning & Maintenance (53 | 27.5%), Food Preparation & Serving (7 | 3.6%), and Healthcare Support (5 | 2.6%).
Services Occupations by Sex
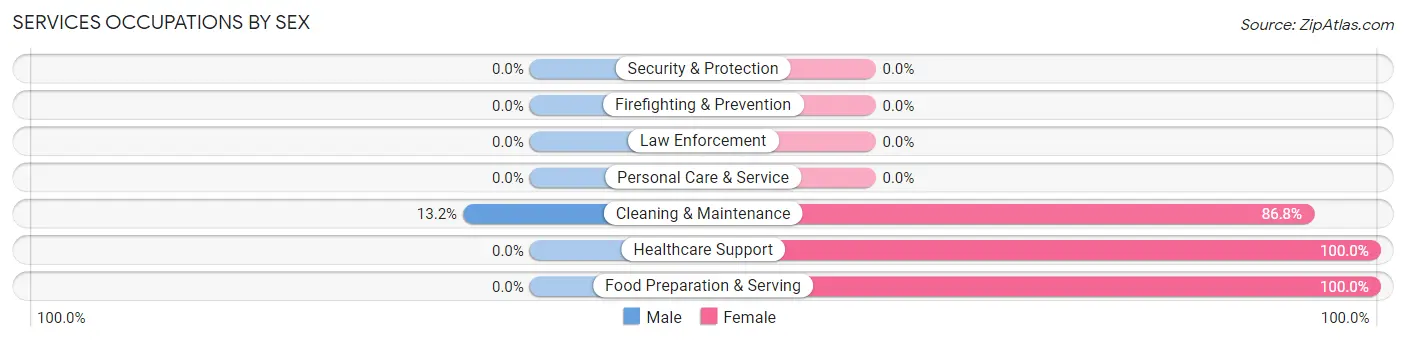
| Occupation | Male | Female |
| Healthcare Support | 0 (0.0%) | 5 (100.0%) |
| Security & Protection | 0 (0.0%) | 0 (0.0%) |
| Firefighting & Prevention | 0 (0.0%) | 0 (0.0%) |
| Law Enforcement | 0 (0.0%) | 0 (0.0%) |
| Food Preparation & Serving | 0 (0.0%) | 7 (100.0%) |
| Cleaning & Maintenance | 7 (13.2%) | 46 (86.8%) |
| Personal Care & Service | 0 (0.0%) | 0 (0.0%) |
| Total (Category) | 7 (10.8%) | 58 (89.2%) |
| Total (Overall) | 100 (51.8%) | 93 (48.2%) |
Sales and Office Occupations
The most common Sales and Office occupations in Oldtown are Sales & Related (25 | 13.0%), and Office & Administration (12 | 6.2%).
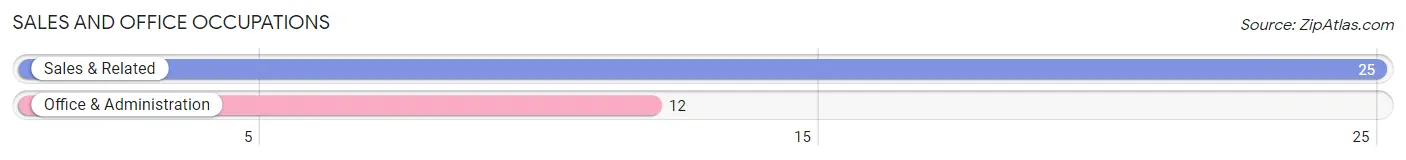
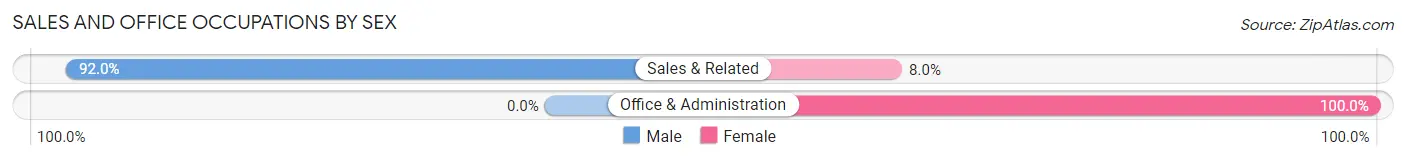
Sales and Office Occupations by Sex
| Occupation | Male | Female |
| Sales & Related | 23 (92.0%) | 2 (8.0%) |
| Office & Administration | 0 (0.0%) | 12 (100.0%) |
| Total (Category) | 23 (62.2%) | 14 (37.8%) |
| Total (Overall) | 100 (51.8%) | 93 (48.2%) |
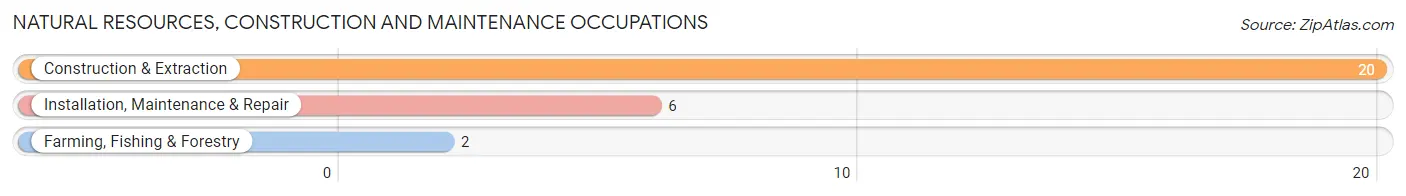
Natural Resources, Construction and Maintenance Occupations
The most common Natural Resources, Construction and Maintenance occupations in Oldtown are Construction & Extraction (20 | 10.4%), Installation, Maintenance & Repair (6 | 3.1%), and Farming, Fishing & Forestry (2 | 1.0%).
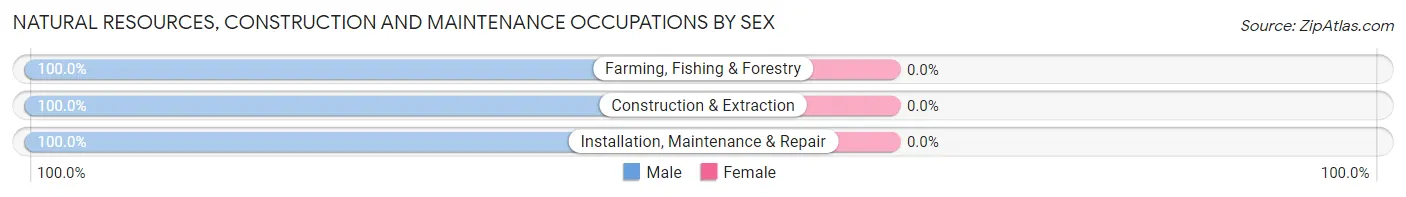
Natural Resources, Construction and Maintenance Occupations by Sex
| Occupation | Male | Female |
| Farming, Fishing & Forestry | 2 (100.0%) | 0 (0.0%) |
| Construction & Extraction | 20 (100.0%) | 0 (0.0%) |
| Installation, Maintenance & Repair | 6 (100.0%) | 0 (0.0%) |
| Total (Category) | 28 (100.0%) | 0 (0.0%) |
| Total (Overall) | 100 (51.8%) | 93 (48.2%) |
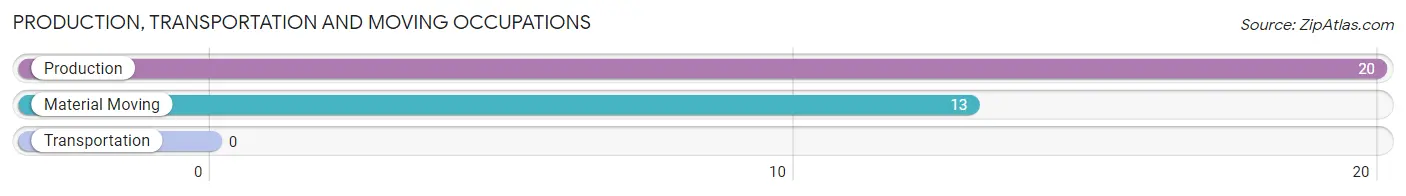
Production, Transportation and Moving Occupations
The most common Production, Transportation and Moving occupations in Oldtown are Production (20 | 10.4%), and Material Moving (13 | 6.7%).
Production, Transportation and Moving Occupations by Sex
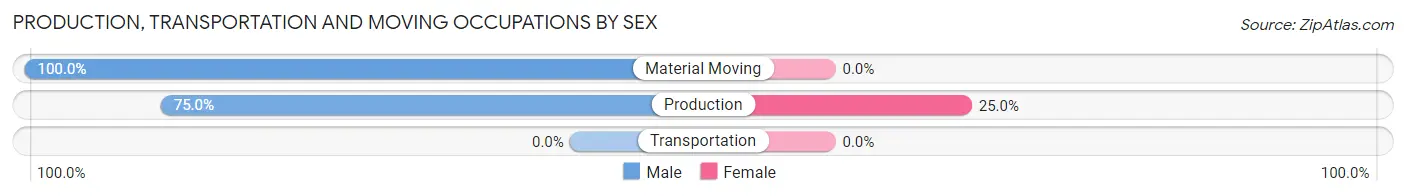
| Occupation | Male | Female |
| Production | 15 (75.0%) | 5 (25.0%) |
| Transportation | 0 (0.0%) | 0 (0.0%) |
| Material Moving | 13 (100.0%) | 0 (0.0%) |
| Total (Category) | 28 (84.9%) | 5 (15.1%) |
| Total (Overall) | 100 (51.8%) | 93 (48.2%) |
Employment Industries by Sex in Oldtown
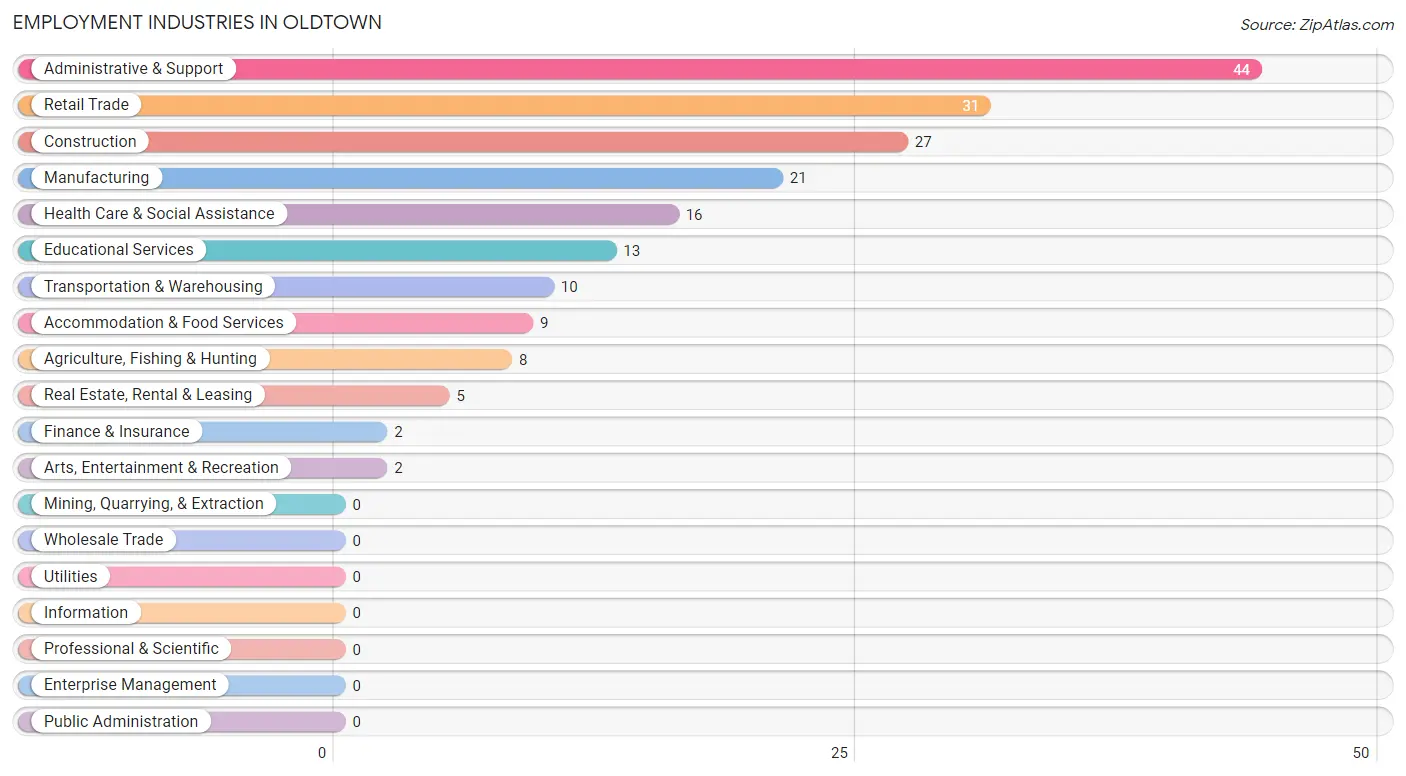
Employment Industries in Oldtown
The major employment industries in Oldtown include Administrative & Support (44 | 22.8%), Retail Trade (31 | 16.1%), Construction (27 | 14.0%), Manufacturing (21 | 10.9%), and Health Care & Social Assistance (16 | 8.3%).
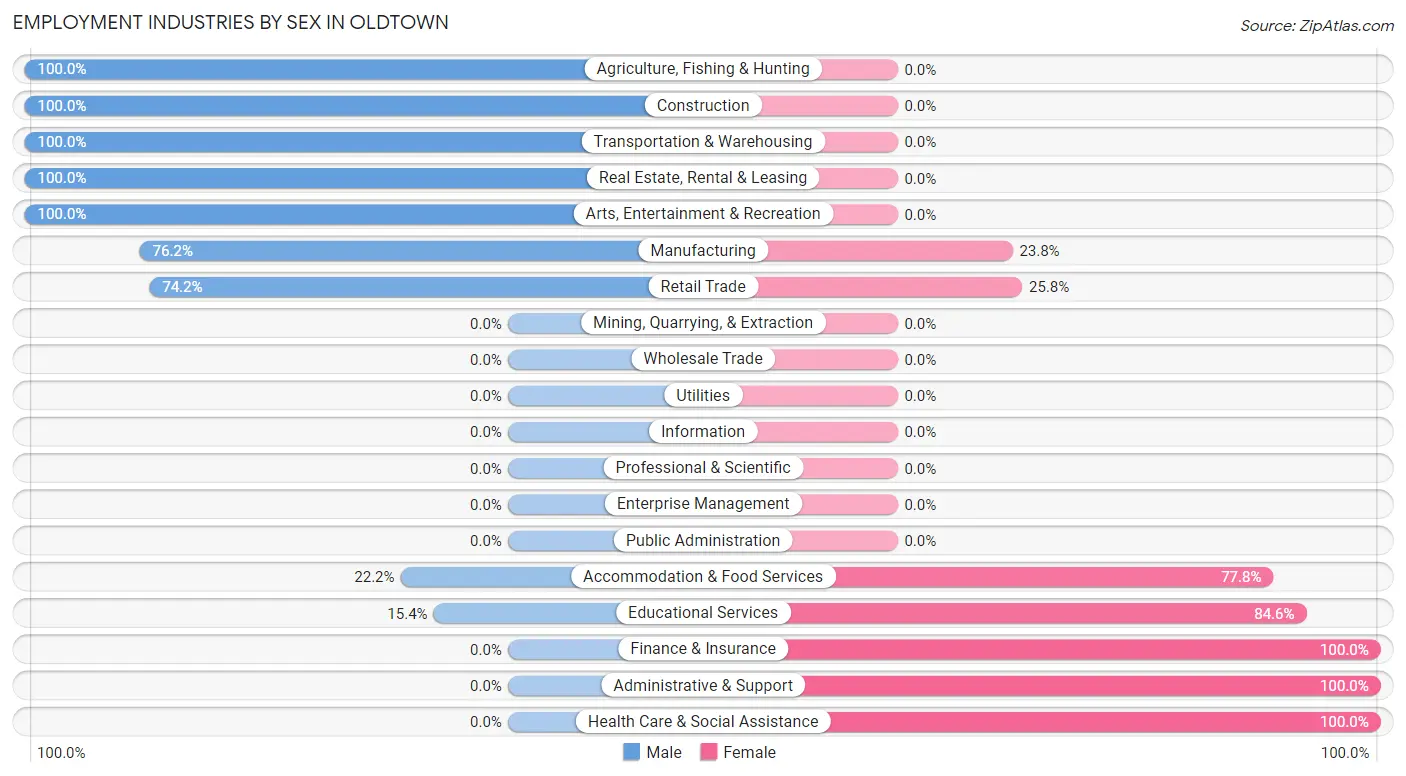
Employment Industries by Sex in Oldtown
The Oldtown industries that see more men than women are Agriculture, Fishing & Hunting (100.0%), Construction (100.0%), and Transportation & Warehousing (100.0%), whereas the industries that tend to have a higher number of women are Finance & Insurance (100.0%), Administrative & Support (100.0%), and Health Care & Social Assistance (100.0%).
| Industry | Male | Female |
| Agriculture, Fishing & Hunting | 8 (100.0%) | 0 (0.0%) |
| Mining, Quarrying, & Extraction | 0 (0.0%) | 0 (0.0%) |
| Construction | 27 (100.0%) | 0 (0.0%) |
| Manufacturing | 16 (76.2%) | 5 (23.8%) |
| Wholesale Trade | 0 (0.0%) | 0 (0.0%) |
| Retail Trade | 23 (74.2%) | 8 (25.8%) |
| Transportation & Warehousing | 10 (100.0%) | 0 (0.0%) |
| Utilities | 0 (0.0%) | 0 (0.0%) |
| Information | 0 (0.0%) | 0 (0.0%) |
| Finance & Insurance | 0 (0.0%) | 2 (100.0%) |
| Real Estate, Rental & Leasing | 5 (100.0%) | 0 (0.0%) |
| Professional & Scientific | 0 (0.0%) | 0 (0.0%) |
| Enterprise Management | 0 (0.0%) | 0 (0.0%) |
| Administrative & Support | 0 (0.0%) | 44 (100.0%) |
| Educational Services | 2 (15.4%) | 11 (84.6%) |
| Health Care & Social Assistance | 0 (0.0%) | 16 (100.0%) |
| Arts, Entertainment & Recreation | 2 (100.0%) | 0 (0.0%) |
| Accommodation & Food Services | 2 (22.2%) | 7 (77.8%) |
| Public Administration | 0 (0.0%) | 0 (0.0%) |
| Total | 100 (51.8%) | 93 (48.2%) |
Education in Oldtown
School Enrollment in Oldtown
The most common levels of schooling among the 107 students in Oldtown are elementary school (49 | 45.8%), middle school (25 | 23.4%), and college / undergraduate (16 | 14.9%).
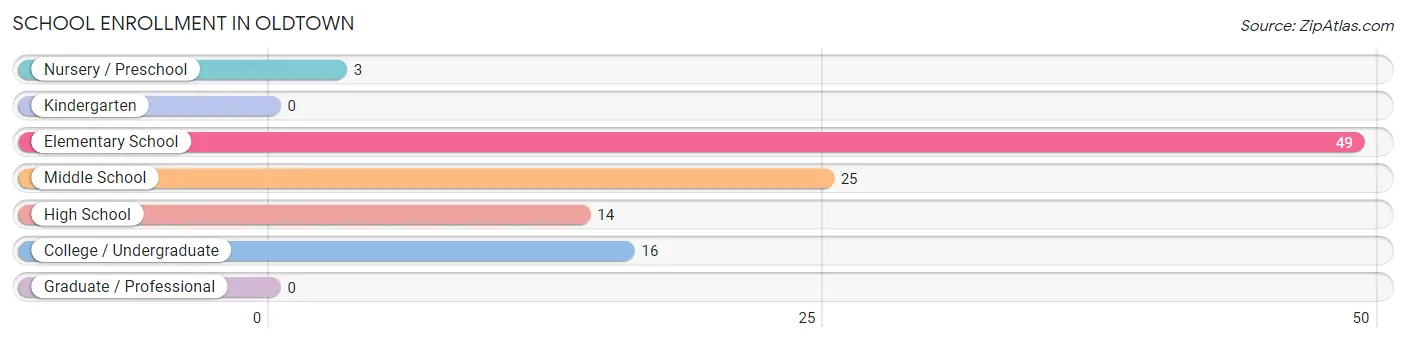
| School Level | # Students | % Students |
| Nursery / Preschool | 3 | 2.8% |
| Kindergarten | 0 | 0.0% |
| Elementary School | 49 | 45.8% |
| Middle School | 25 | 23.4% |
| High School | 14 | 13.1% |
| College / Undergraduate | 16 | 14.9% |
| Graduate / Professional | 0 | 0.0% |
| Total | 107 | 100.0% |
School Enrollment by Age by Funding Source in Oldtown
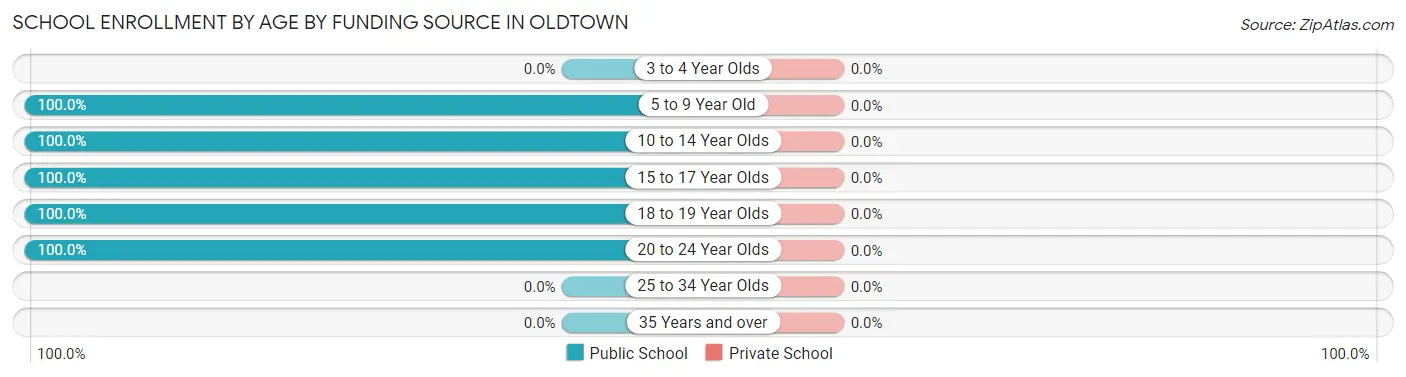
| Age Bracket | Public School | Private School |
| 3 to 4 Year Olds | 0 (0.0%) | 0 (0.0%) |
| 5 to 9 Year Old | 42 (100.0%) | 0 (0.0%) |
| 10 to 14 Year Olds | 37 (100.0%) | 0 (0.0%) |
| 15 to 17 Year Olds | 12 (100.0%) | 0 (0.0%) |
| 18 to 19 Year Olds | 11 (100.0%) | 0 (0.0%) |
| 20 to 24 Year Olds | 5 (100.0%) | 0 (0.0%) |
| 25 to 34 Year Olds | 0 (0.0%) | 0 (0.0%) |
| 35 Years and over | 0 (0.0%) | 0 (0.0%) |
| Total | 107 (100.0%) | 0 (0.0%) |
Educational Attainment by Field of Study in Oldtown
Communications (45 | 61.6%), visual & performing arts (14 | 19.2%), business (6 | 8.2%), computers & mathematics (2 | 2.7%), and bio, nature & agricultural (2 | 2.7%) are the most common fields of study among 73 individuals in Oldtown who have obtained a bachelor's degree or higher.
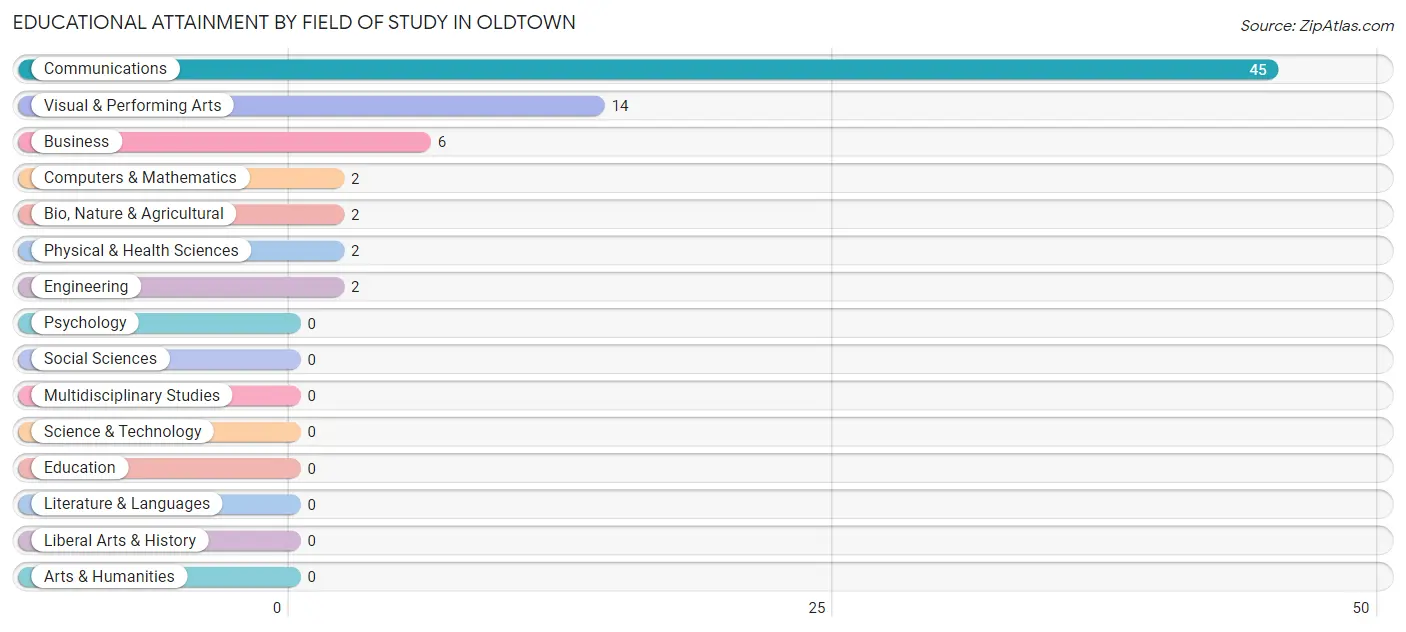
| Field of Study | # Graduates | % Graduates |
| Computers & Mathematics | 2 | 2.7% |
| Bio, Nature & Agricultural | 2 | 2.7% |
| Physical & Health Sciences | 2 | 2.7% |
| Psychology | 0 | 0.0% |
| Social Sciences | 0 | 0.0% |
| Engineering | 2 | 2.7% |
| Multidisciplinary Studies | 0 | 0.0% |
| Science & Technology | 0 | 0.0% |
| Business | 6 | 8.2% |
| Education | 0 | 0.0% |
| Literature & Languages | 0 | 0.0% |
| Liberal Arts & History | 0 | 0.0% |
| Visual & Performing Arts | 14 | 19.2% |
| Communications | 45 | 61.6% |
| Arts & Humanities | 0 | 0.0% |
| Total | 73 | 100.0% |
Transportation & Commute in Oldtown
Vehicle Availability by Sex in Oldtown
The most prevalent vehicle ownership categories in Oldtown are males with 1 vehicle (40, accounting for 40.0%) and females with 1 vehicle (54, making up 43.0%).
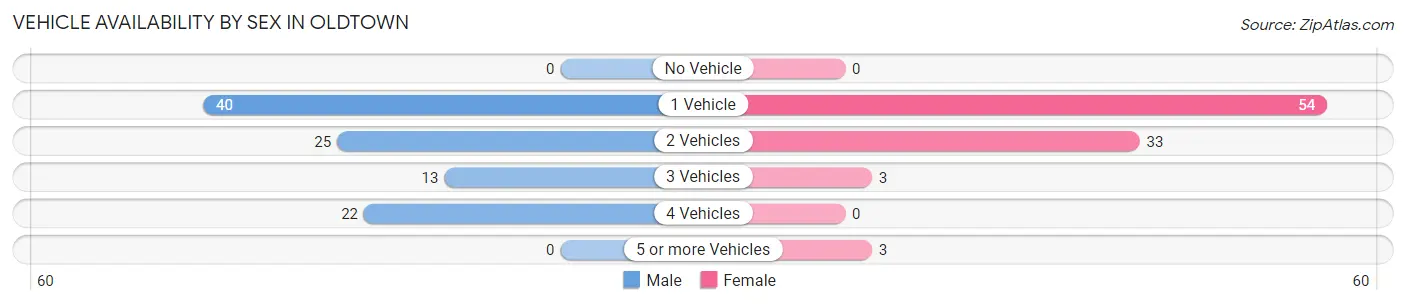
| Vehicles Available | Male | Female |
| No Vehicle | 0 (0.0%) | 0 (0.0%) |
| 1 Vehicle | 40 (40.0%) | 54 (58.1%) |
| 2 Vehicles | 25 (25.0%) | 33 (35.5%) |
| 3 Vehicles | 13 (13.0%) | 3 (3.2%) |
| 4 Vehicles | 22 (22.0%) | 0 (0.0%) |
| 5 or more Vehicles | 0 (0.0%) | 3 (3.2%) |
| Total | 100 (100.0%) | 93 (100.0%) |
Commute Time in Oldtown
The most frequently occuring commute durations in Oldtown are 10 to 14 minutes (57 commuters, 30.2%), 5 to 9 minutes (37 commuters, 19.6%), and 60 to 89 minutes (23 commuters, 12.2%).
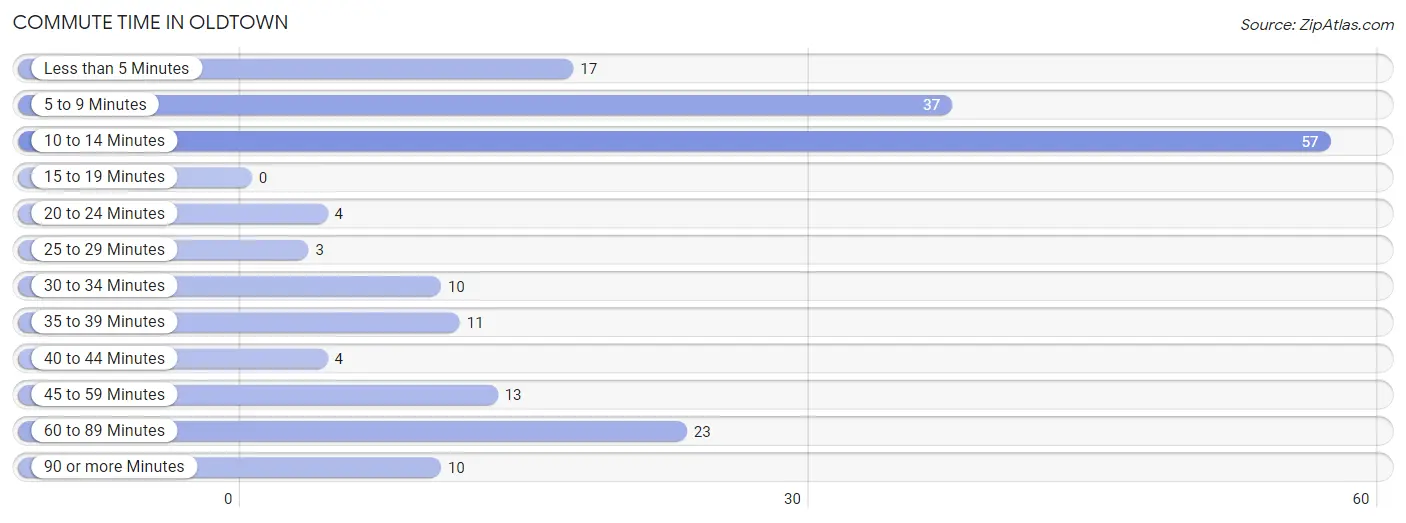
| Commute Time | # Commuters | % Commuters |
| Less than 5 Minutes | 17 | 9.0% |
| 5 to 9 Minutes | 37 | 19.6% |
| 10 to 14 Minutes | 57 | 30.2% |
| 15 to 19 Minutes | 0 | 0.0% |
| 20 to 24 Minutes | 4 | 2.1% |
| 25 to 29 Minutes | 3 | 1.6% |
| 30 to 34 Minutes | 10 | 5.3% |
| 35 to 39 Minutes | 11 | 5.8% |
| 40 to 44 Minutes | 4 | 2.1% |
| 45 to 59 Minutes | 13 | 6.9% |
| 60 to 89 Minutes | 23 | 12.2% |
| 90 or more Minutes | 10 | 5.3% |
Commute Time by Sex in Oldtown
The most common commute times in Oldtown are 5 to 9 minutes (28 commuters, 29.2%) for males and 10 to 14 minutes (49 commuters, 52.7%) for females.
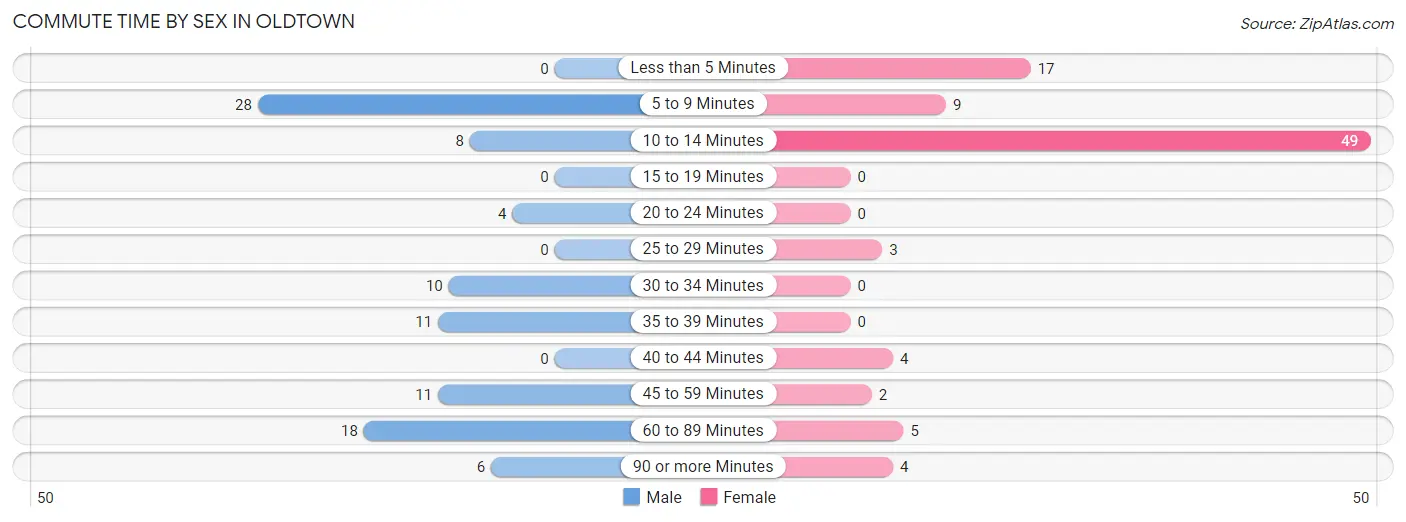
| Commute Time | Male | Female |
| Less than 5 Minutes | 0 (0.0%) | 17 (18.3%) |
| 5 to 9 Minutes | 28 (29.2%) | 9 (9.7%) |
| 10 to 14 Minutes | 8 (8.3%) | 49 (52.7%) |
| 15 to 19 Minutes | 0 (0.0%) | 0 (0.0%) |
| 20 to 24 Minutes | 4 (4.2%) | 0 (0.0%) |
| 25 to 29 Minutes | 0 (0.0%) | 3 (3.2%) |
| 30 to 34 Minutes | 10 (10.4%) | 0 (0.0%) |
| 35 to 39 Minutes | 11 (11.5%) | 0 (0.0%) |
| 40 to 44 Minutes | 0 (0.0%) | 4 (4.3%) |
| 45 to 59 Minutes | 11 (11.5%) | 2 (2.1%) |
| 60 to 89 Minutes | 18 (18.8%) | 5 (5.4%) |
| 90 or more Minutes | 6 (6.2%) | 4 (4.3%) |
Time of Departure to Work by Sex in Oldtown
The most frequent times of departure to work in Oldtown are 7:30 AM to 7:59 AM (25, 26.0%) for males and 7:00 AM to 7:29 AM (60, 64.5%) for females.
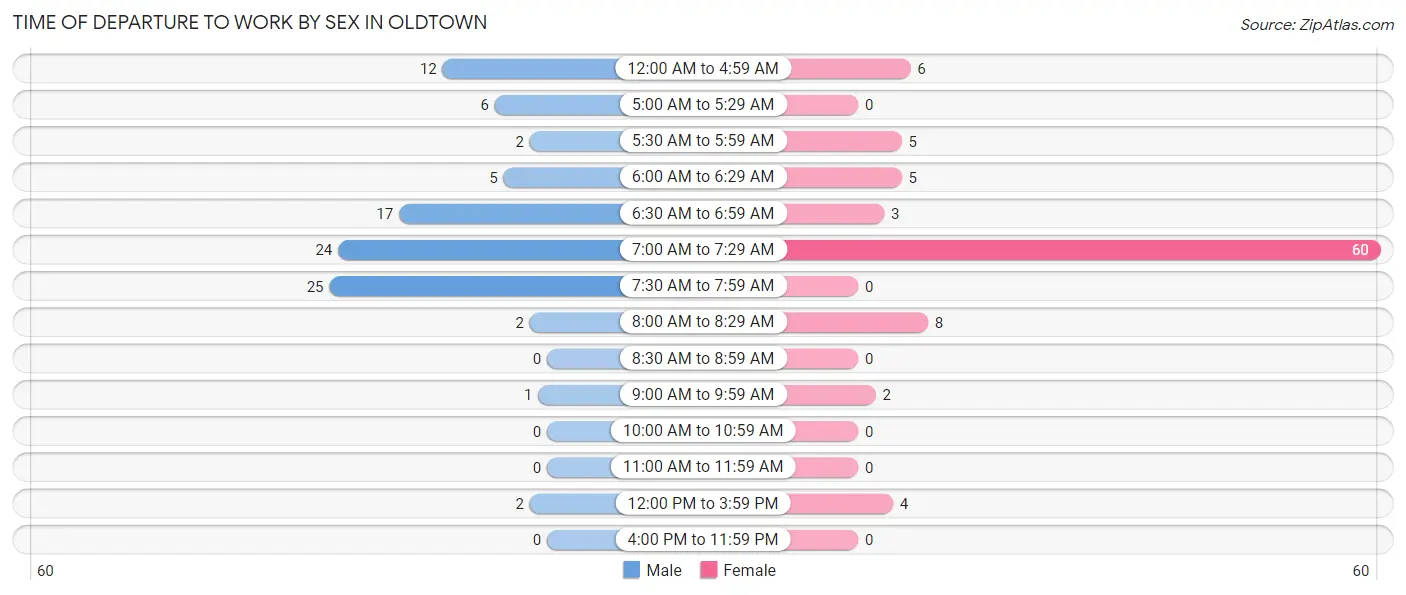
| Time of Departure | Male | Female |
| 12:00 AM to 4:59 AM | 12 (12.5%) | 6 (6.5%) |
| 5:00 AM to 5:29 AM | 6 (6.2%) | 0 (0.0%) |
| 5:30 AM to 5:59 AM | 2 (2.1%) | 5 (5.4%) |
| 6:00 AM to 6:29 AM | 5 (5.2%) | 5 (5.4%) |
| 6:30 AM to 6:59 AM | 17 (17.7%) | 3 (3.2%) |
| 7:00 AM to 7:29 AM | 24 (25.0%) | 60 (64.5%) |
| 7:30 AM to 7:59 AM | 25 (26.0%) | 0 (0.0%) |
| 8:00 AM to 8:29 AM | 2 (2.1%) | 8 (8.6%) |
| 8:30 AM to 8:59 AM | 0 (0.0%) | 0 (0.0%) |
| 9:00 AM to 9:59 AM | 1 (1.0%) | 2 (2.1%) |
| 10:00 AM to 10:59 AM | 0 (0.0%) | 0 (0.0%) |
| 11:00 AM to 11:59 AM | 0 (0.0%) | 0 (0.0%) |
| 12:00 PM to 3:59 PM | 2 (2.1%) | 4 (4.3%) |
| 4:00 PM to 11:59 PM | 0 (0.0%) | 0 (0.0%) |
| Total | 96 (100.0%) | 93 (100.0%) |
Housing Occupancy in Oldtown
Occupancy by Ownership in Oldtown
Of the total 183 dwellings in Oldtown, owner-occupied units account for 84 (45.9%), while renter-occupied units make up 99 (54.1%).
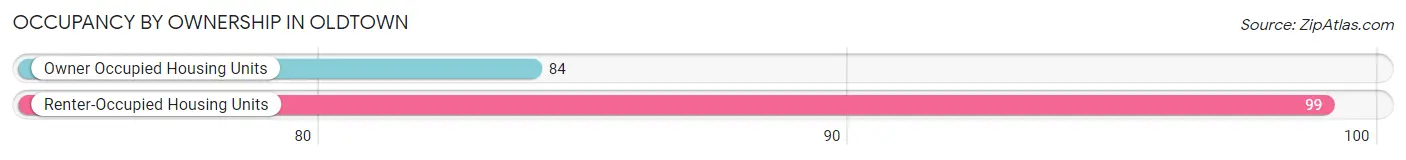
| Occupancy | # Housing Units | % Housing Units |
| Owner Occupied Housing Units | 84 | 45.9% |
| Renter-Occupied Housing Units | 99 | 54.1% |
| Total Occupied Housing Units | 183 | 100.0% |
Occupancy by Household Size in Oldtown
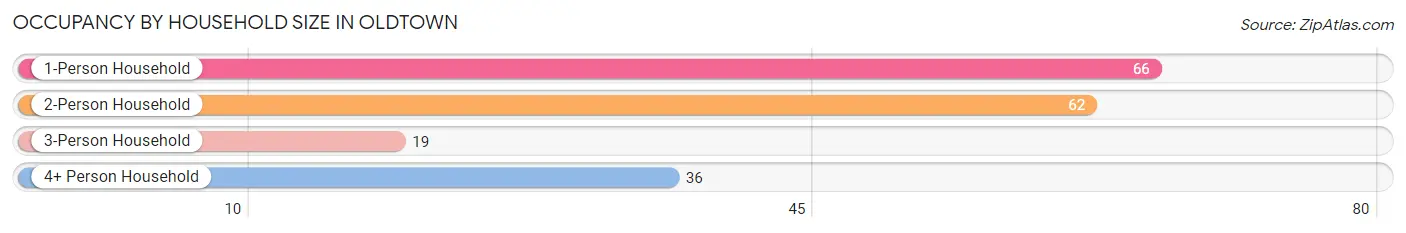
| Household Size | # Housing Units | % Housing Units |
| 1-Person Household | 66 | 36.1% |
| 2-Person Household | 62 | 33.9% |
| 3-Person Household | 19 | 10.4% |
| 4+ Person Household | 36 | 19.7% |
| Total Housing Units | 183 | 100.0% |
Occupancy by Ownership by Household Size in Oldtown
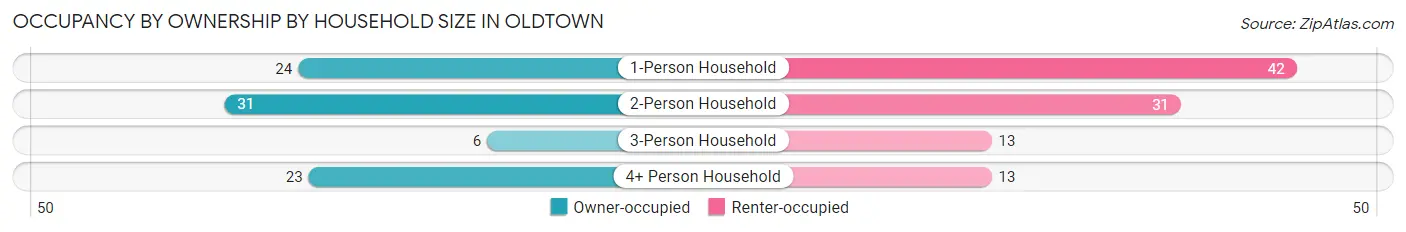
| Household Size | Owner-occupied | Renter-occupied |
| 1-Person Household | 24 (36.4%) | 42 (63.6%) |
| 2-Person Household | 31 (50.0%) | 31 (50.0%) |
| 3-Person Household | 6 (31.6%) | 13 (68.4%) |
| 4+ Person Household | 23 (63.9%) | 13 (36.1%) |
| Total Housing Units | 84 (45.9%) | 99 (54.1%) |
Occupancy by Educational Attainment in Oldtown
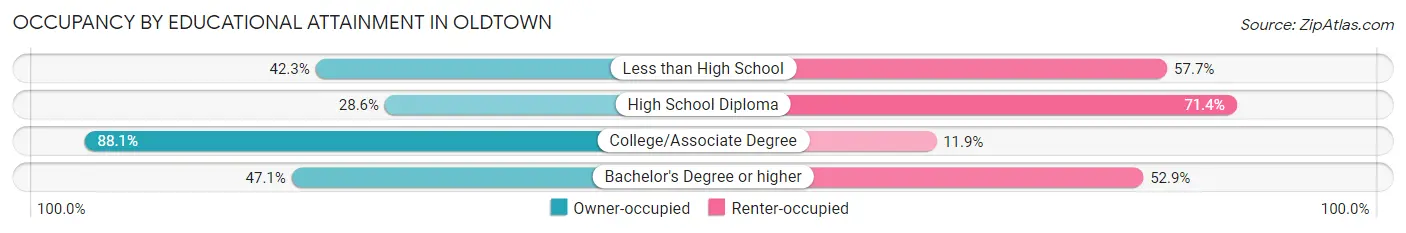
| Household Size | Owner-occupied | Renter-occupied |
| Less than High School | 11 (42.3%) | 15 (57.7%) |
| High School Diploma | 28 (28.6%) | 70 (71.4%) |
| College/Associate Degree | 37 (88.1%) | 5 (11.9%) |
| Bachelor's Degree or higher | 8 (47.1%) | 9 (52.9%) |
Occupancy by Age of Householder in Oldtown
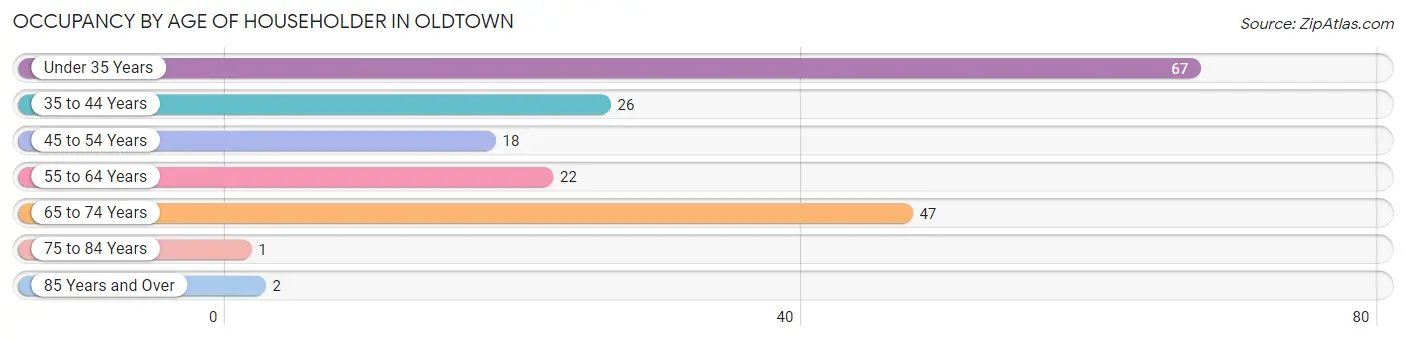
| Age Bracket | # Households | % Households |
| Under 35 Years | 67 | 36.6% |
| 35 to 44 Years | 26 | 14.2% |
| 45 to 54 Years | 18 | 9.8% |
| 55 to 64 Years | 22 | 12.0% |
| 65 to 74 Years | 47 | 25.7% |
| 75 to 84 Years | 1 | 0.5% |
| 85 Years and Over | 2 | 1.1% |
| Total | 183 | 100.0% |
Housing Finances in Oldtown
Median Income by Occupancy in Oldtown
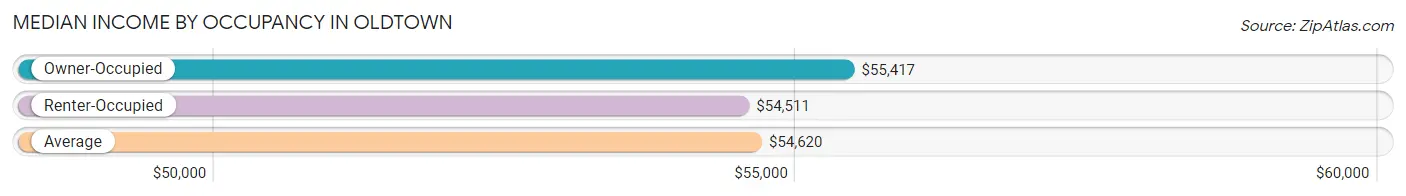
| Occupancy Type | # Households | Median Income |
| Owner-Occupied | 84 (45.9%) | $55,417 |
| Renter-Occupied | 99 (54.1%) | $54,511 |
| Average | 183 (100.0%) | $54,620 |
Occupancy by Householder Income Bracket in Oldtown
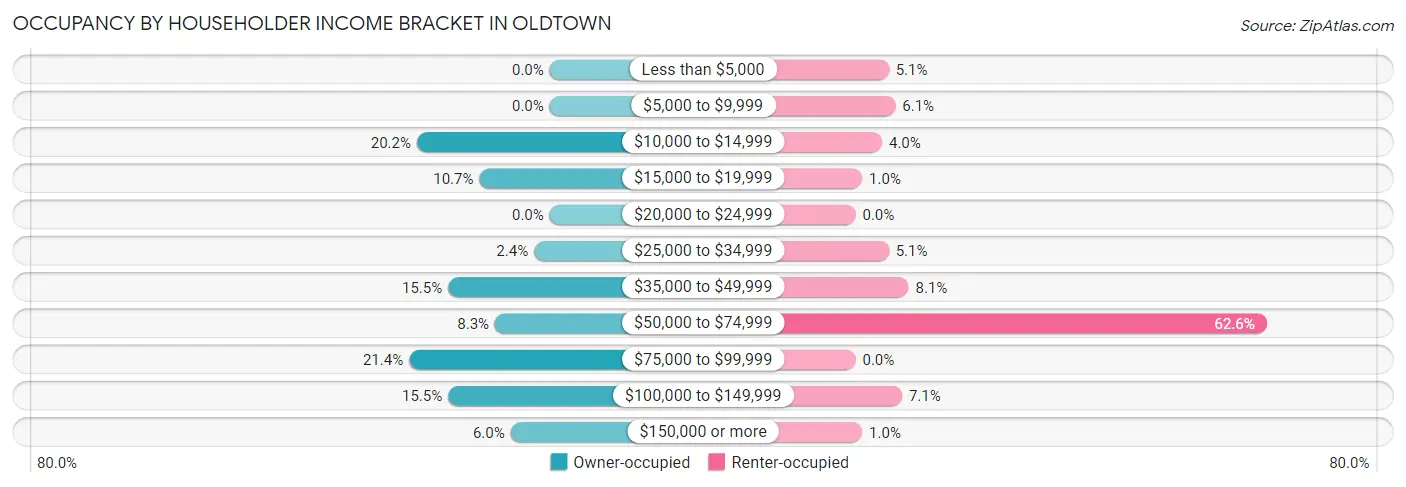
| Income Bracket | Owner-occupied | Renter-occupied |
| Less than $5,000 | 0 (0.0%) | 5 (5.1%) |
| $5,000 to $9,999 | 0 (0.0%) | 6 (6.1%) |
| $10,000 to $14,999 | 17 (20.2%) | 4 (4.0%) |
| $15,000 to $19,999 | 9 (10.7%) | 1 (1.0%) |
| $20,000 to $24,999 | 0 (0.0%) | 0 (0.0%) |
| $25,000 to $34,999 | 2 (2.4%) | 5 (5.1%) |
| $35,000 to $49,999 | 13 (15.5%) | 8 (8.1%) |
| $50,000 to $74,999 | 7 (8.3%) | 62 (62.6%) |
| $75,000 to $99,999 | 18 (21.4%) | 0 (0.0%) |
| $100,000 to $149,999 | 13 (15.5%) | 7 (7.1%) |
| $150,000 or more | 5 (5.9%) | 1 (1.0%) |
| Total | 84 (100.0%) | 99 (100.0%) |
Monthly Housing Cost Tiers in Oldtown
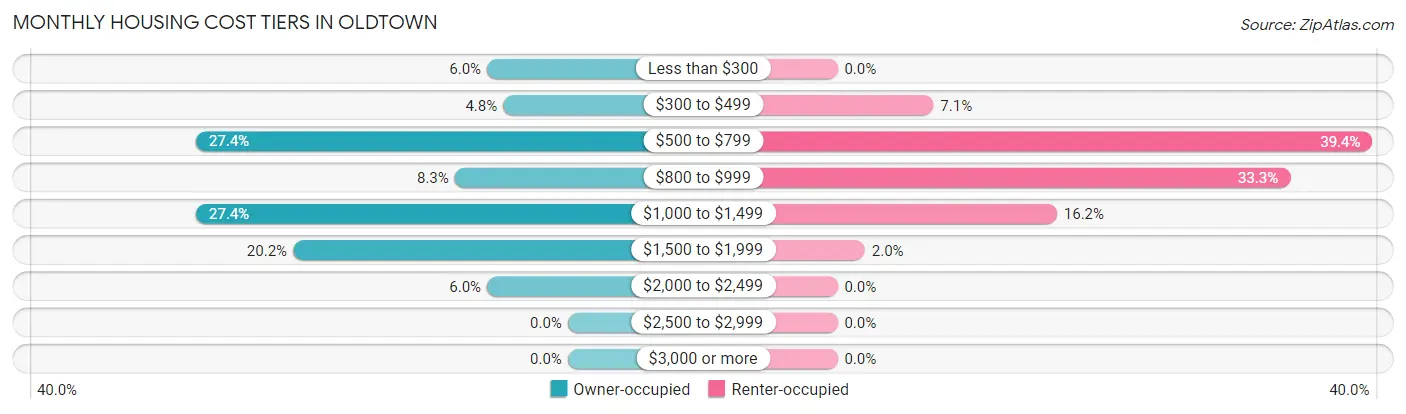
| Monthly Cost | Owner-occupied | Renter-occupied |
| Less than $300 | 5 (5.9%) | 0 (0.0%) |
| $300 to $499 | 4 (4.8%) | 7 (7.1%) |
| $500 to $799 | 23 (27.4%) | 39 (39.4%) |
| $800 to $999 | 7 (8.3%) | 33 (33.3%) |
| $1,000 to $1,499 | 23 (27.4%) | 16 (16.2%) |
| $1,500 to $1,999 | 17 (20.2%) | 2 (2.0%) |
| $2,000 to $2,499 | 5 (5.9%) | 0 (0.0%) |
| $2,500 to $2,999 | 0 (0.0%) | 0 (0.0%) |
| $3,000 or more | 0 (0.0%) | 0 (0.0%) |
| Total | 84 (100.0%) | 99 (100.0%) |
Physical Housing Characteristics in Oldtown
Housing Structures in Oldtown
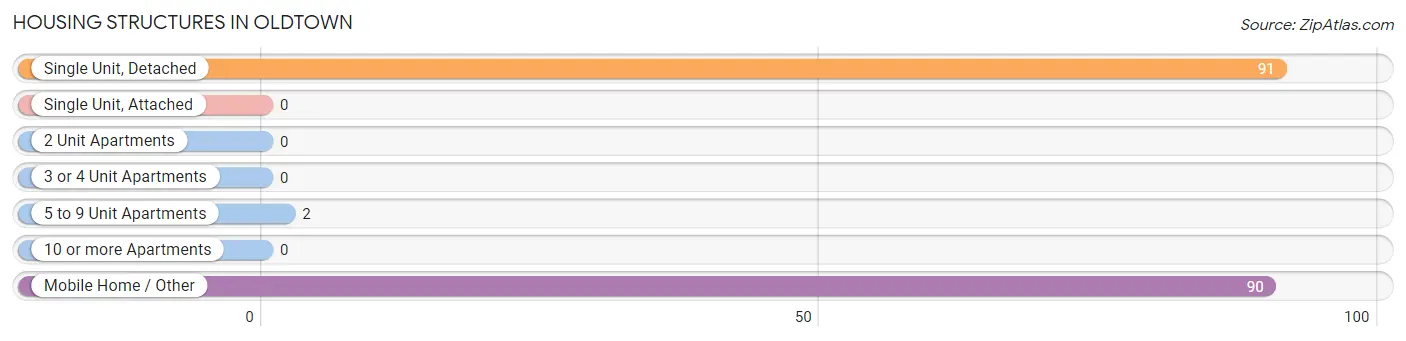
| Structure Type | # Housing Units | % Housing Units |
| Single Unit, Detached | 91 | 49.7% |
| Single Unit, Attached | 0 | 0.0% |
| 2 Unit Apartments | 0 | 0.0% |
| 3 or 4 Unit Apartments | 0 | 0.0% |
| 5 to 9 Unit Apartments | 2 | 1.1% |
| 10 or more Apartments | 0 | 0.0% |
| Mobile Home / Other | 90 | 49.2% |
| Total | 183 | 100.0% |
Housing Structures by Occupancy in Oldtown
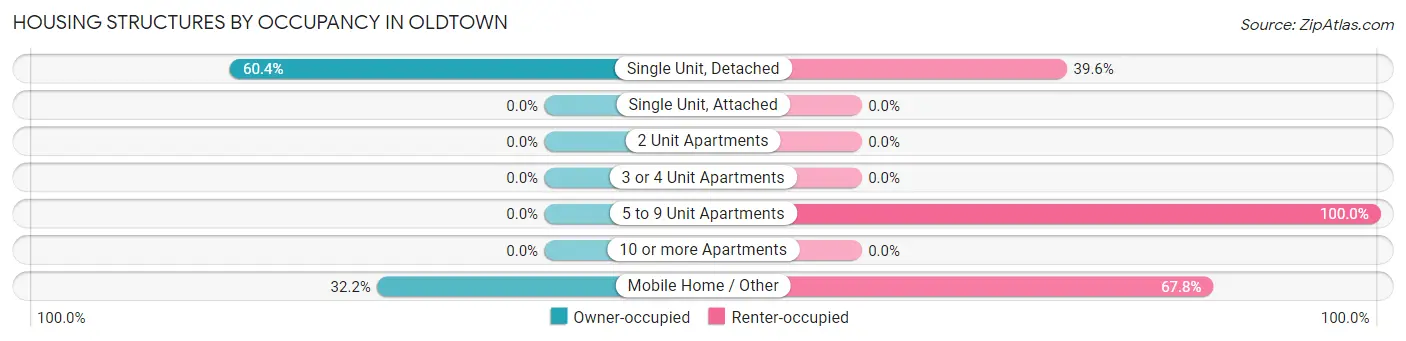
| Structure Type | Owner-occupied | Renter-occupied |
| Single Unit, Detached | 55 (60.4%) | 36 (39.6%) |
| Single Unit, Attached | 0 (0.0%) | 0 (0.0%) |
| 2 Unit Apartments | 0 (0.0%) | 0 (0.0%) |
| 3 or 4 Unit Apartments | 0 (0.0%) | 0 (0.0%) |
| 5 to 9 Unit Apartments | 0 (0.0%) | 2 (100.0%) |
| 10 or more Apartments | 0 (0.0%) | 0 (0.0%) |
| Mobile Home / Other | 29 (32.2%) | 61 (67.8%) |
| Total | 84 (45.9%) | 99 (54.1%) |
Housing Structures by Number of Rooms in Oldtown
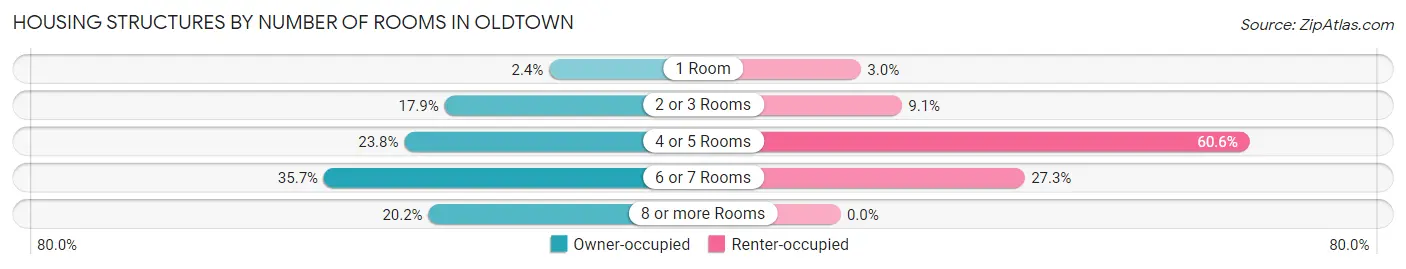
| Number of Rooms | Owner-occupied | Renter-occupied |
| 1 Room | 2 (2.4%) | 3 (3.0%) |
| 2 or 3 Rooms | 15 (17.9%) | 9 (9.1%) |
| 4 or 5 Rooms | 20 (23.8%) | 60 (60.6%) |
| 6 or 7 Rooms | 30 (35.7%) | 27 (27.3%) |
| 8 or more Rooms | 17 (20.2%) | 0 (0.0%) |
| Total | 84 (100.0%) | 99 (100.0%) |
Housing Structure by Heating Type in Oldtown
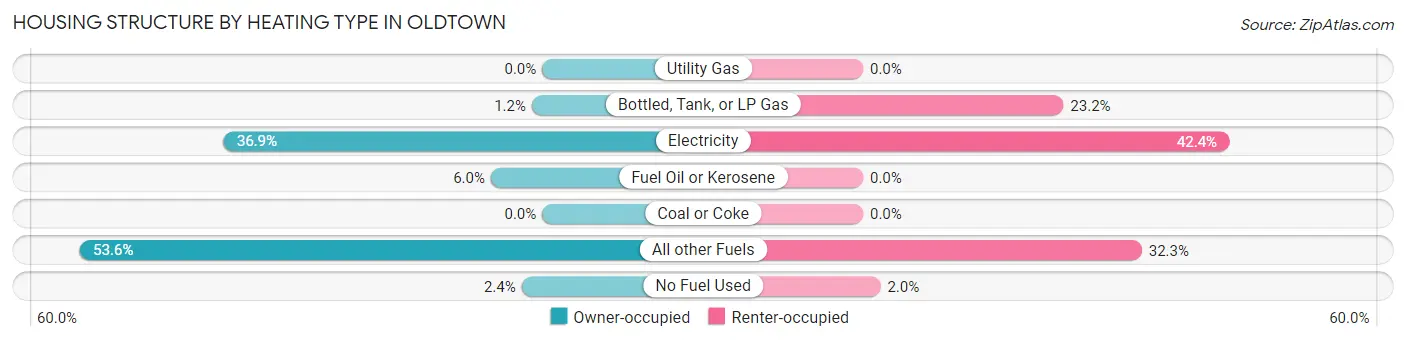
| Heating Type | Owner-occupied | Renter-occupied |
| Utility Gas | 0 (0.0%) | 0 (0.0%) |
| Bottled, Tank, or LP Gas | 1 (1.2%) | 23 (23.2%) |
| Electricity | 31 (36.9%) | 42 (42.4%) |
| Fuel Oil or Kerosene | 5 (5.9%) | 0 (0.0%) |
| Coal or Coke | 0 (0.0%) | 0 (0.0%) |
| All other Fuels | 45 (53.6%) | 32 (32.3%) |
| No Fuel Used | 2 (2.4%) | 2 (2.0%) |
| Total | 84 (100.0%) | 99 (100.0%) |
Household Vehicle Usage in Oldtown
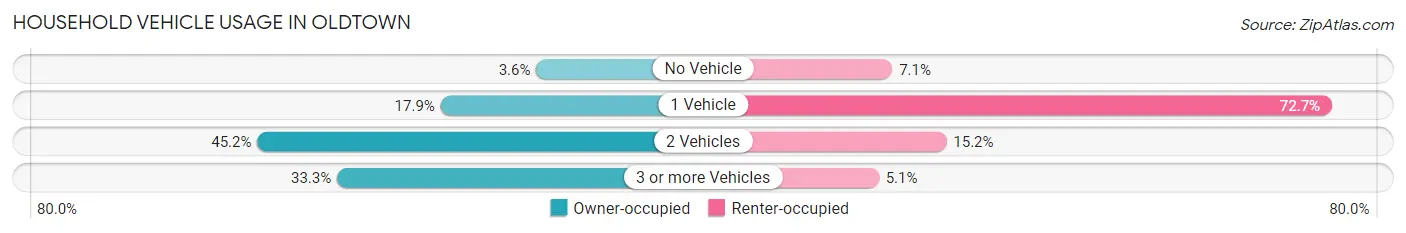
| Vehicles per Household | Owner-occupied | Renter-occupied |
| No Vehicle | 3 (3.6%) | 7 (7.1%) |
| 1 Vehicle | 15 (17.9%) | 72 (72.7%) |
| 2 Vehicles | 38 (45.2%) | 15 (15.1%) |
| 3 or more Vehicles | 28 (33.3%) | 5 (5.1%) |
| Total | 84 (100.0%) | 99 (100.0%) |
Real Estate & Mortgages in Oldtown
Real Estate and Mortgage Overview in Oldtown
| Characteristic | Without Mortgage | With Mortgage |
| Housing Units | 26 | 58 |
| Median Property Value | $205,600 | $220,000 |
| Median Household Income | - | - |
| Monthly Housing Costs | $533 | $0 |
| Real Estate Taxes | - | - |
Property Value by Mortgage Status in Oldtown
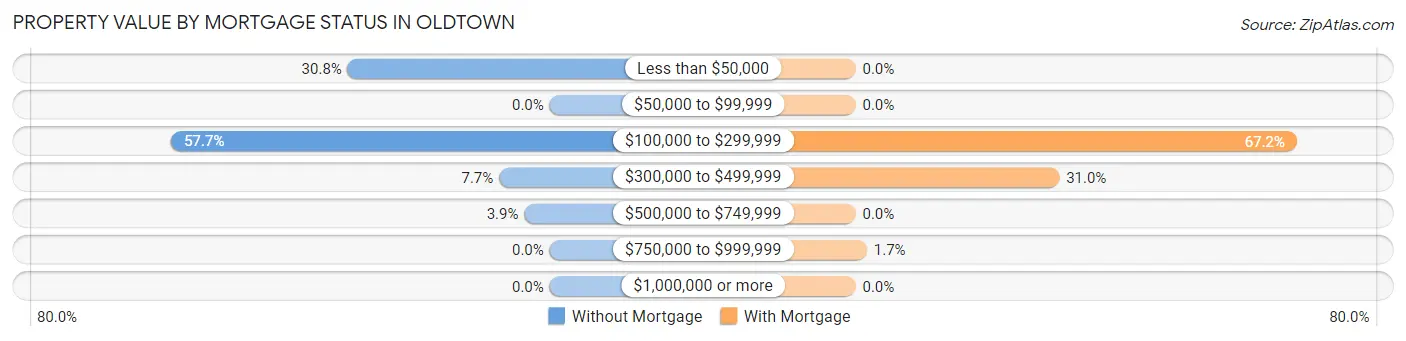
| Property Value | Without Mortgage | With Mortgage |
| Less than $50,000 | 8 (30.8%) | 0 (0.0%) |
| $50,000 to $99,999 | 0 (0.0%) | 0 (0.0%) |
| $100,000 to $299,999 | 15 (57.7%) | 39 (67.2%) |
| $300,000 to $499,999 | 2 (7.7%) | 18 (31.0%) |
| $500,000 to $749,999 | 1 (3.8%) | 0 (0.0%) |
| $750,000 to $999,999 | 0 (0.0%) | 1 (1.7%) |
| $1,000,000 or more | 0 (0.0%) | 0 (0.0%) |
| Total | 26 (100.0%) | 58 (100.0%) |
Household Income by Mortgage Status in Oldtown
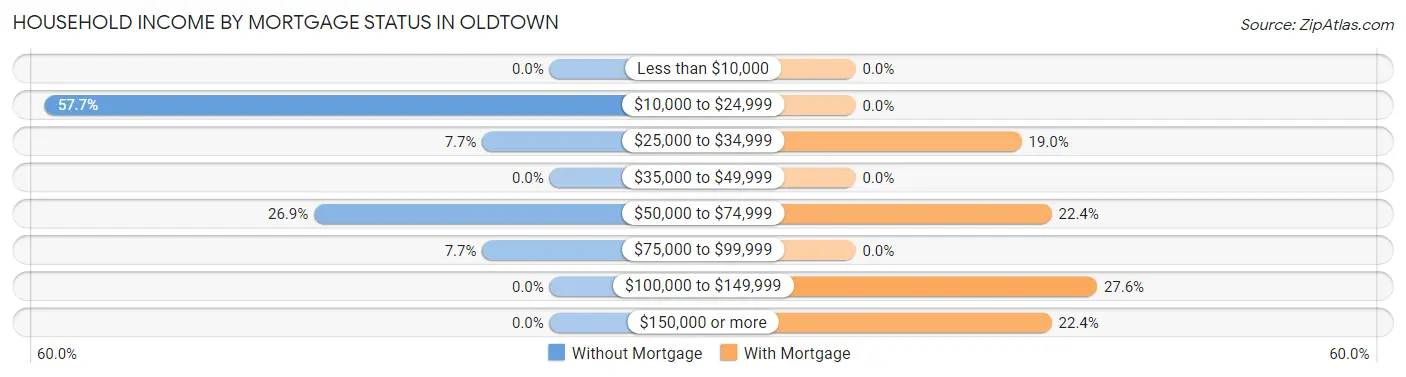
| Household Income | Without Mortgage | With Mortgage |
| Less than $10,000 | 0 (0.0%) | 0 (0.0%) |
| $10,000 to $24,999 | 15 (57.7%) | 0 (0.0%) |
| $25,000 to $34,999 | 2 (7.7%) | 11 (19.0%) |
| $35,000 to $49,999 | 0 (0.0%) | 0 (0.0%) |
| $50,000 to $74,999 | 7 (26.9%) | 13 (22.4%) |
| $75,000 to $99,999 | 2 (7.7%) | 0 (0.0%) |
| $100,000 to $149,999 | 0 (0.0%) | 16 (27.6%) |
| $150,000 or more | 0 (0.0%) | 13 (22.4%) |
| Total | 26 (100.0%) | 58 (100.0%) |
Property Value to Household Income Ratio in Oldtown
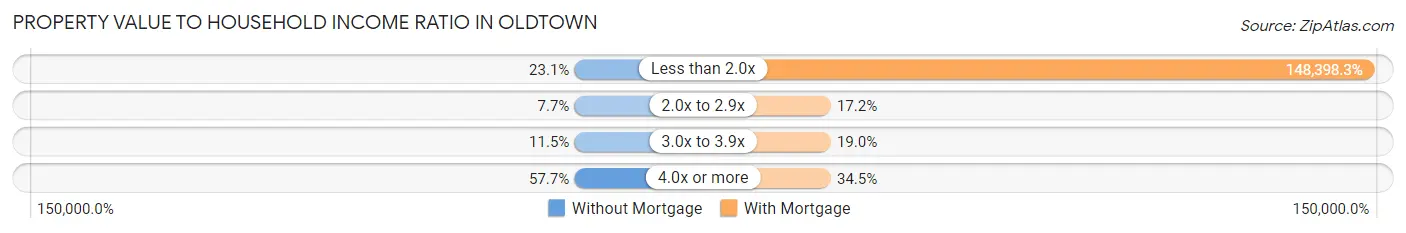
| Value-to-Income Ratio | Without Mortgage | With Mortgage |
| Less than 2.0x | 6 (23.1%) | 86,071 (148,398.3%) |
| 2.0x to 2.9x | 2 (7.7%) | 10 (17.2%) |
| 3.0x to 3.9x | 3 (11.5%) | 11 (19.0%) |
| 4.0x or more | 15 (57.7%) | 20 (34.5%) |
| Total | 26 (100.0%) | 58 (100.0%) |
Real Estate Taxes by Mortgage Status in Oldtown
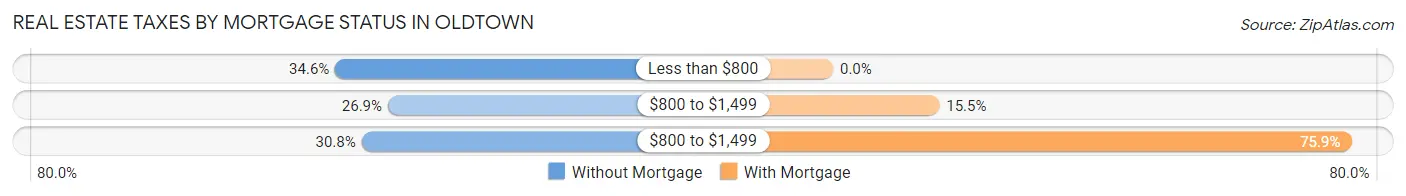
| Property Taxes | Without Mortgage | With Mortgage |
| Less than $800 | 9 (34.6%) | 0 (0.0%) |
| $800 to $1,499 | 7 (26.9%) | 9 (15.5%) |
| $800 to $1,499 | 8 (30.8%) | 44 (75.9%) |
| Total | 26 (100.0%) | 58 (100.0%) |
Health & Disability in Oldtown
Health Insurance Coverage by Age in Oldtown
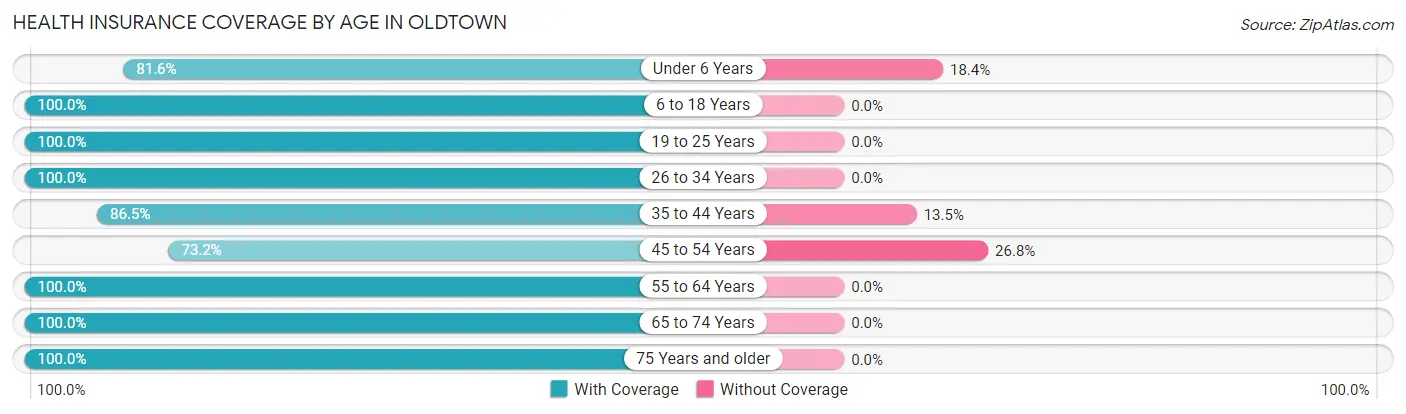
| Age Bracket | With Coverage | Without Coverage |
| Under 6 Years | 31 (81.6%) | 7 (18.4%) |
| 6 to 18 Years | 100 (100.0%) | 0 (0.0%) |
| 19 to 25 Years | 48 (100.0%) | 0 (0.0%) |
| 26 to 34 Years | 85 (100.0%) | 0 (0.0%) |
| 35 to 44 Years | 32 (86.5%) | 5 (13.5%) |
| 45 to 54 Years | 30 (73.2%) | 11 (26.8%) |
| 55 to 64 Years | 75 (100.0%) | 0 (0.0%) |
| 65 to 74 Years | 52 (100.0%) | 0 (0.0%) |
| 75 Years and older | 4 (100.0%) | 0 (0.0%) |
| Total | 457 (95.2%) | 23 (4.8%) |
Health Insurance Coverage by Citizenship Status in Oldtown
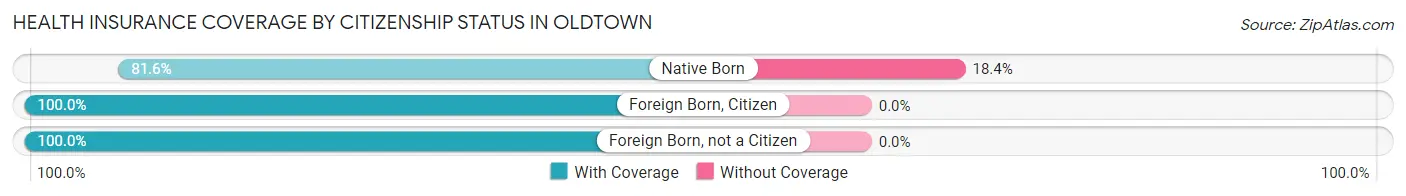
| Citizenship Status | With Coverage | Without Coverage |
| Native Born | 31 (81.6%) | 7 (18.4%) |
| Foreign Born, Citizen | 100 (100.0%) | 0 (0.0%) |
| Foreign Born, not a Citizen | 48 (100.0%) | 0 (0.0%) |
Health Insurance Coverage by Household Income in Oldtown
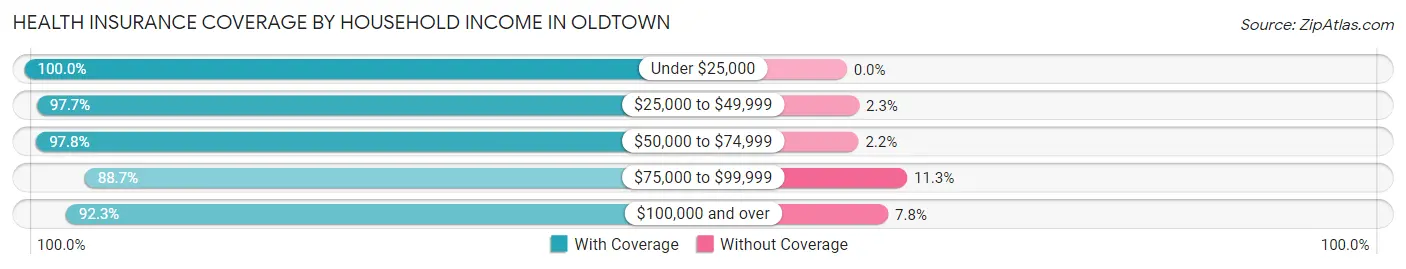
| Household Income | With Coverage | Without Coverage |
| Under $25,000 | 52 (100.0%) | 0 (0.0%) |
| $25,000 to $49,999 | 85 (97.7%) | 2 (2.3%) |
| $50,000 to $74,999 | 134 (97.8%) | 3 (2.2%) |
| $75,000 to $99,999 | 55 (88.7%) | 7 (11.3%) |
| $100,000 and over | 131 (92.2%) | 11 (7.7%) |
Public vs Private Health Insurance Coverage by Age in Oldtown
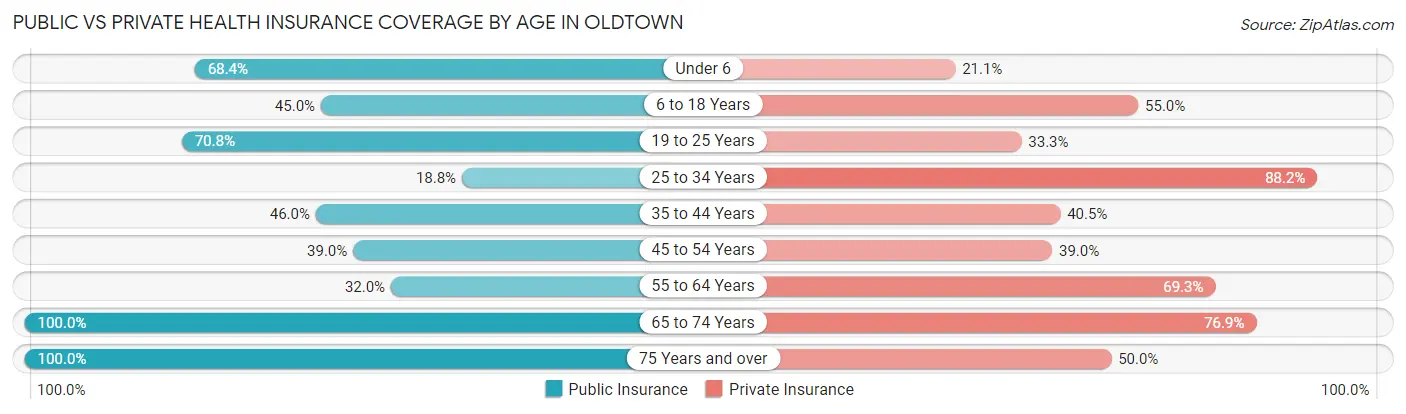
| Age Bracket | Public Insurance | Private Insurance |
| Under 6 | 26 (68.4%) | 8 (21.0%) |
| 6 to 18 Years | 45 (45.0%) | 55 (55.0%) |
| 19 to 25 Years | 34 (70.8%) | 16 (33.3%) |
| 25 to 34 Years | 16 (18.8%) | 75 (88.2%) |
| 35 to 44 Years | 17 (46.0%) | 15 (40.5%) |
| 45 to 54 Years | 16 (39.0%) | 16 (39.0%) |
| 55 to 64 Years | 24 (32.0%) | 52 (69.3%) |
| 65 to 74 Years | 52 (100.0%) | 40 (76.9%) |
| 75 Years and over | 4 (100.0%) | 2 (50.0%) |
| Total | 234 (48.7%) | 279 (58.1%) |
Disability Status by Sex by Age in Oldtown
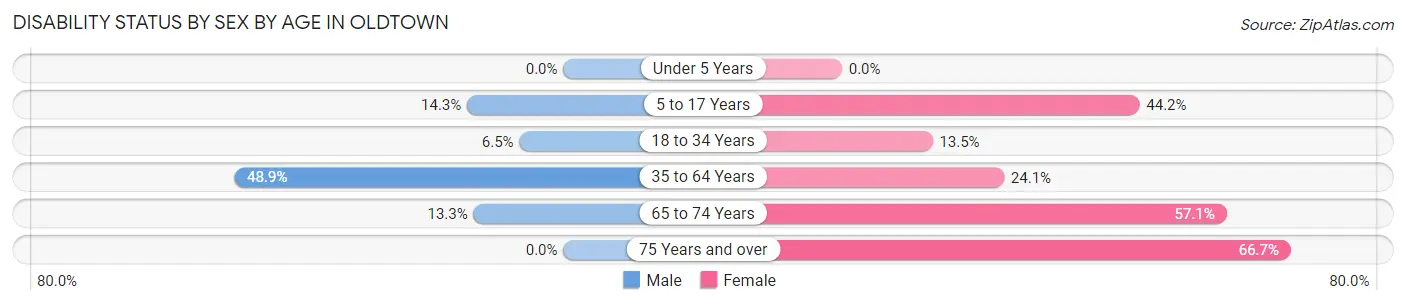
| Age Bracket | Male | Female |
| Under 5 Years | 0 (0.0%) | 0 (0.0%) |
| 5 to 17 Years | 7 (14.3%) | 19 (44.2%) |
| 18 to 34 Years | 6 (6.5%) | 7 (13.5%) |
| 35 to 64 Years | 22 (48.9%) | 26 (24.1%) |
| 65 to 74 Years | 6 (13.3%) | 4 (57.1%) |
| 75 Years and over | 0 (0.0%) | 2 (66.7%) |
Disability Class by Sex by Age in Oldtown
Disability Class: Hearing Difficulty
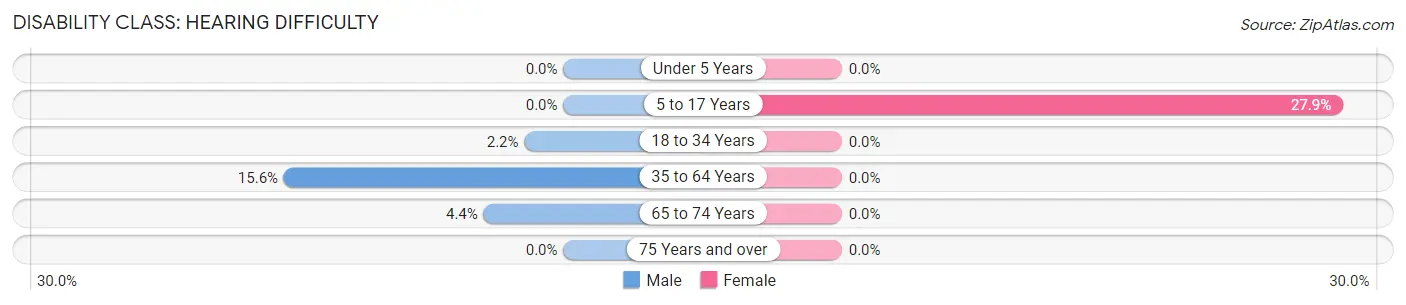
| Age Bracket | Male | Female |
| Under 5 Years | 0 (0.0%) | 0 (0.0%) |
| 5 to 17 Years | 0 (0.0%) | 12 (27.9%) |
| 18 to 34 Years | 2 (2.2%) | 0 (0.0%) |
| 35 to 64 Years | 7 (15.6%) | 0 (0.0%) |
| 65 to 74 Years | 2 (4.4%) | 0 (0.0%) |
| 75 Years and over | 0 (0.0%) | 0 (0.0%) |
Disability Class: Vision Difficulty
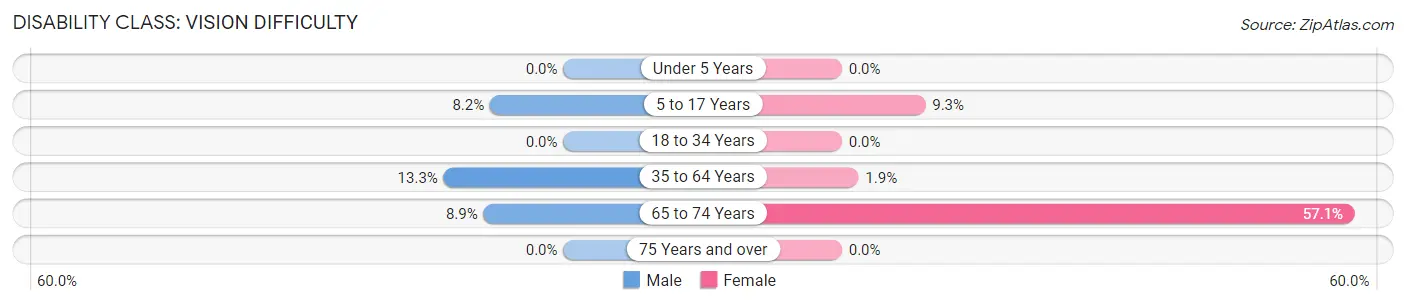
| Age Bracket | Male | Female |
| Under 5 Years | 0 (0.0%) | 0 (0.0%) |
| 5 to 17 Years | 4 (8.2%) | 4 (9.3%) |
| 18 to 34 Years | 0 (0.0%) | 0 (0.0%) |
| 35 to 64 Years | 6 (13.3%) | 2 (1.8%) |
| 65 to 74 Years | 4 (8.9%) | 4 (57.1%) |
| 75 Years and over | 0 (0.0%) | 0 (0.0%) |
Disability Class: Cognitive Difficulty
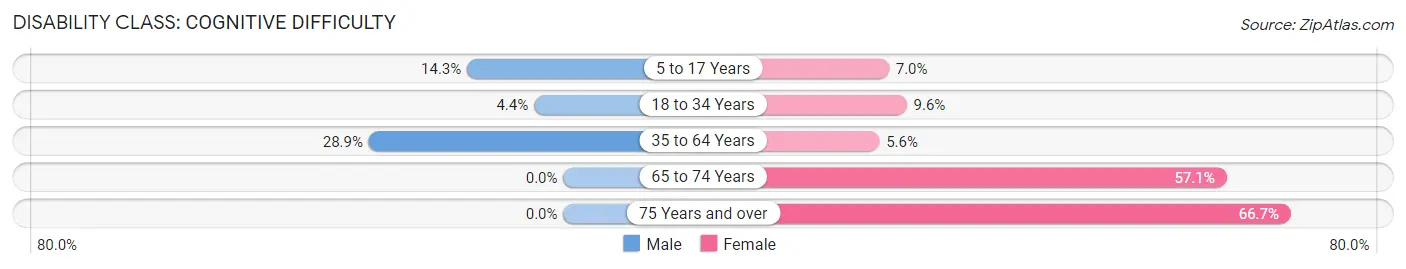
| Age Bracket | Male | Female |
| 5 to 17 Years | 7 (14.3%) | 3 (7.0%) |
| 18 to 34 Years | 4 (4.3%) | 5 (9.6%) |
| 35 to 64 Years | 13 (28.9%) | 6 (5.6%) |
| 65 to 74 Years | 0 (0.0%) | 4 (57.1%) |
| 75 Years and over | 0 (0.0%) | 2 (66.7%) |
Disability Class: Ambulatory Difficulty
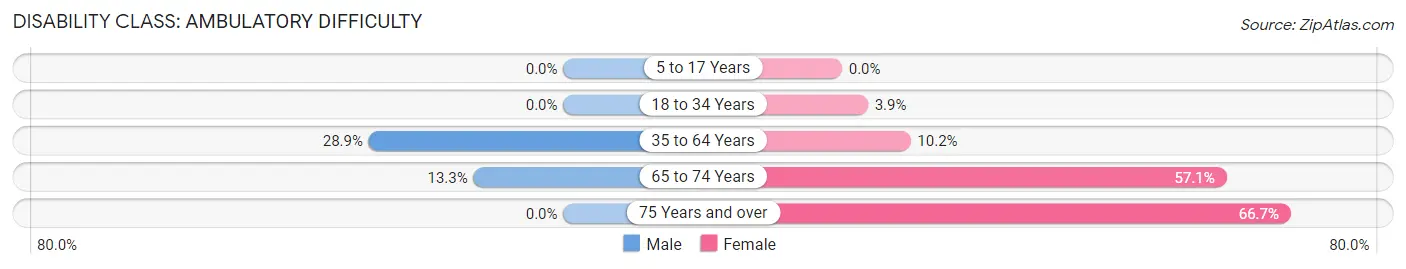
| Age Bracket | Male | Female |
| 5 to 17 Years | 0 (0.0%) | 0 (0.0%) |
| 18 to 34 Years | 0 (0.0%) | 2 (3.8%) |
| 35 to 64 Years | 13 (28.9%) | 11 (10.2%) |
| 65 to 74 Years | 6 (13.3%) | 4 (57.1%) |
| 75 Years and over | 0 (0.0%) | 2 (66.7%) |
Disability Class: Self-Care Difficulty
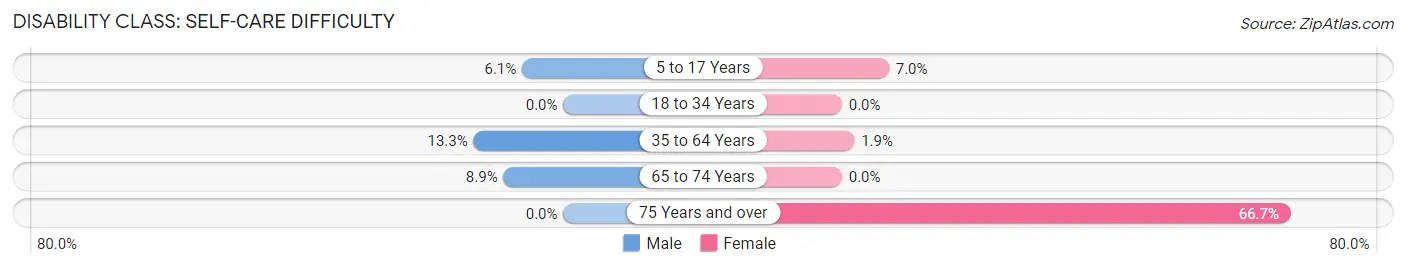
| Age Bracket | Male | Female |
| 5 to 17 Years | 3 (6.1%) | 3 (7.0%) |
| 18 to 34 Years | 0 (0.0%) | 0 (0.0%) |
| 35 to 64 Years | 6 (13.3%) | 2 (1.8%) |
| 65 to 74 Years | 4 (8.9%) | 0 (0.0%) |
| 75 Years and over | 0 (0.0%) | 2 (66.7%) |
Technology Access in Oldtown
Computing Device Access in Oldtown
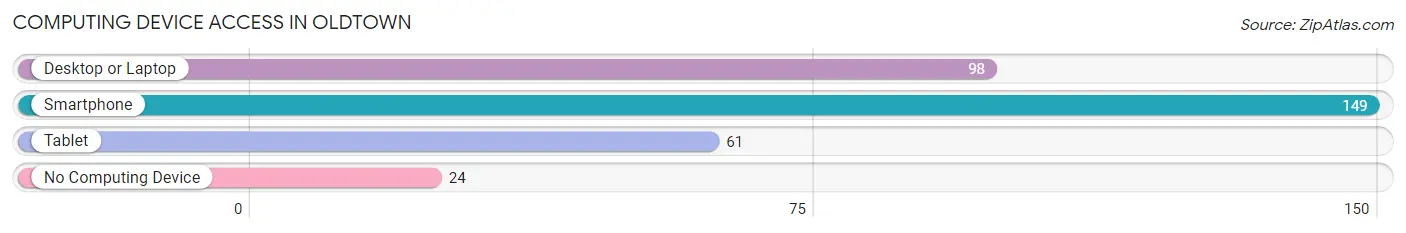
| Device Type | # Households | % Households |
| Desktop or Laptop | 98 | 53.5% |
| Smartphone | 149 | 81.4% |
| Tablet | 61 | 33.3% |
| No Computing Device | 24 | 13.1% |
| Total | 183 | 100.0% |
Internet Access in Oldtown
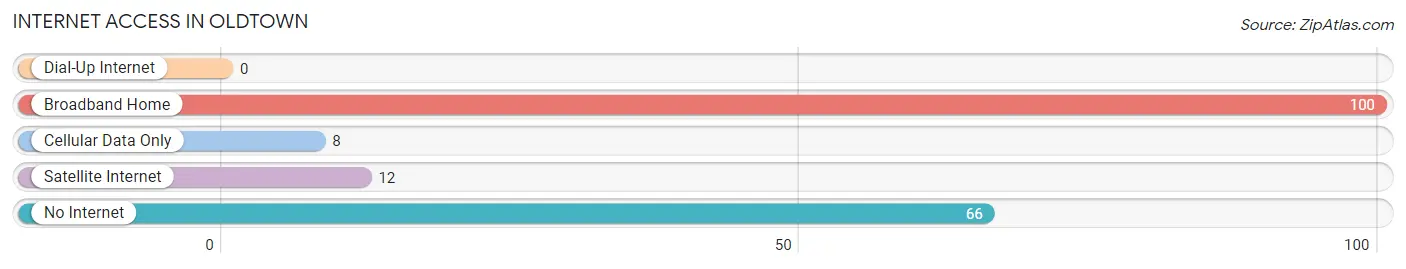
| Internet Type | # Households | % Households |
| Dial-Up Internet | 0 | 0.0% |
| Broadband Home | 100 | 54.6% |
| Cellular Data Only | 8 | 4.4% |
| Satellite Internet | 12 | 6.6% |
| No Internet | 66 | 36.1% |
| Total | 183 | 100.0% |
Oldtown Summary
Oldtown is a small city located in the state of Idaho, United States. It is situated in the northern part of the state, in the county of Kootenai. The city has a population of approximately 2,000 people, and is part of the Coeur d'Alene metropolitan area.
History
Oldtown was founded in 1883 by a group of settlers from the Midwest. The settlers were looking for a place to settle and start a new life, and they chose Oldtown because of its proximity to the Coeur d'Alene River. The settlers built a sawmill and a flour mill, and the town quickly grew. By the early 1900s, Oldtown had become a thriving community with a population of over 1,000 people.
The town was named after the old-fashioned way of life that the settlers brought with them from the Midwest. The town was known for its traditional values and its strong sense of community.
In the early 1900s, Oldtown was a major center for logging and lumber production. The town was also home to a number of small businesses, including a general store, a blacksmith shop, and a hotel.
In the 1950s, Oldtown began to decline as the logging industry moved away from the area. The town's population began to decline, and by the 1970s, the population had dropped to just over 1,000 people.
Geography
Oldtown is located in the northern part of Idaho, in the county of Kootenai. The city is situated on the banks of the Coeur d'Alene River, and is surrounded by mountains and forests. The city is located about 25 miles north of Coeur d'Alene, and about 50 miles south of Spokane, Washington.
The city has a total area of 1.3 square miles, all of which is land. The city is located at an elevation of 2,400 feet above sea level.
Economy
Oldtown's economy is largely based on tourism and recreation. The city is home to a number of tourist attractions, including the Oldtown Historical Museum, the Oldtown Logging Museum, and the Oldtown Railroad Museum. The city is also home to a number of outdoor recreation activities, including fishing, hunting, camping, and hiking.
The city is also home to a number of small businesses, including restaurants, shops, and hotels. The city is also home to a number of manufacturing companies, including a furniture factory and a woodworking shop.
Demographics
As of the 2010 census, Oldtown had a population of 2,000 people. The racial makeup of the city was 95.2% White, 0.7% African American, 0.3% Native American, 0.7% Asian, 0.1% Pacific Islander, 0.7% from other races, and 2.1% from two or more races. Hispanic or Latino of any race were 2.3% of the population.
The median income for a household in Oldtown was $35,000, and the median income for a family was $41,000. The per capita income for the city was $17,000. About 11.2% of families and 14.3% of the population were below the poverty line, including 18.2% of those under age 18 and 8.3% of those age 65 or over.
Common Questions
What is Per Capita Income in Oldtown?
Per Capita income in Oldtown is $24,314.
What is the Median Family Income in Oldtown?
Median Family Income in Oldtown is $67,679.
What is the Median Household income in Oldtown?
Median Household Income in Oldtown is $54,620.
What is Income or Wage Gap in Oldtown?
Income or Wage Gap in Oldtown is 32.9%.
Women in Oldtown earn 67.1 cents for every dollar earned by a man.
What is Inequality or Gini Index in Oldtown?
Inequality or Gini Index in Oldtown is 0.38.
What is the Total Population of Oldtown?
Total Population of Oldtown is 480.
What is the Total Male Population of Oldtown?
Total Male Population of Oldtown is 242.
What is the Total Female Population of Oldtown?
Total Female Population of Oldtown is 238.
What is the Ratio of Males per 100 Females in Oldtown?
There are 101.68 Males per 100 Females in Oldtown.
What is the Ratio of Females per 100 Males in Oldtown?
There are 98.35 Females per 100 Males in Oldtown.
What is the Median Population Age in Oldtown?
Median Population Age in Oldtown is 31.9 Years.
What is the Average Family Size in Oldtown
Average Family Size in Oldtown is 3.8 People.
What is the Average Household Size in Oldtown
Average Household Size in Oldtown is 2.6 People.
How Large is the Labor Force in Oldtown?
There are 227 People in the Labor Forcein in Oldtown.
What is the Percentage of People in the Labor Force in Oldtown?
62.9% of People are in the Labor Force in Oldtown.
What is the Unemployment Rate in Oldtown?
Unemployment Rate in Oldtown is 15.0%.